Watch the Market tutorial videos on YouTube
How to buy а trading robot or an indicator
Run your EA on
virtual hosting
virtual hosting
Test аn indicator/trading robot before buying
Want to earn in the Market?
How to present a product for a sell-through
Technical Indicators for MetaTrader 4 - 17

Dark Oscillator is an Indicator for intraday trading. This Indicator is based on Counter Trend strategy, trying to intercept changes in direction, in advance compared trend following indicators. We can enter in good price with this Indicator, in order to follow the inversion of the trend on the current instrument. It is advised to use low spread ECN brokers. This Indicator does Not repaint and N ot lag . Recommended timeframes are M5, M15 and H1. Recommended working pairs: All. I nst

Lord Auto Fibonnaci is a free indicator for Meta Trader, in order to show the most famous chart in the financial market known as "Fibonnaci".
As we can see in the images below, the fibonnaci table will automatically analyze the graph for you, with trend factors through percentage, almost infallible use, you can always work when the percentage is low or high, start shopping and sales on time, great for analyzing entries!
In the images below we can see an example in gold in H4, where we are at
FREE

The statistical indicator for the metatrader 5 TradingStatisticPro collects statistical data on your trade, which makes it easier to assess the effectiveness of trading, the profit received and the risks. The indicator is compactly placed in the corner of the main chart of the terminal and displays the following information: 1. The profit earned. 2. Maximum drawdown. 3. The recovery factor. 4. Profit factor. 5. The ratio of profitable and unprofitable transactions (winrate). 6. Average profit a
FREE

What is G Force Trend? G Force Trend is a technical analysis indicator developed for the MetaTrader 4 platform. It analyzes price movements to identify trend direction and generates buy/sell signals. The indicator creates a dynamic channel to track price behavior within the channel and visualizes trend changes. What Does It Do? Trend Detection : Determines whether the price is in a bullish or bearish trend. Buy/Sell Signals : Generates clear buy and sell signals when the price crosses the channe
FREE

This indicator shows the latest untouched support and resistance as horizontal lines. The indicator can show support/resistance from higher timeframes. With this indicator you can e.g. easily see the support/resistance of the timeframes H4, D1 and W1 on a H1 chart, which can be a big advantage while time your entry on H1. This is the FREE version of the indicator: Support Resistance Multi Time Frame The free version works only on EURUSD and GBPUSD!
Parameters referenceTF: the timeframe from whi
FREE

This indicator is the converted Metatrader 4 version of the TradingView indicator "ATR Based Trendlines - JD" by Duyck. This indicator works by automatically and continuously drawing trendlines not based exclusively on price, but also based on the volatility perceived by the ATR. So, the angle of the trendlines is determined by (a percentage of) the ATR. The angle of the trendlines follows the change in price, dictated by the ATR at the moment where the pivot point is detected. The ATR percentag
FREE
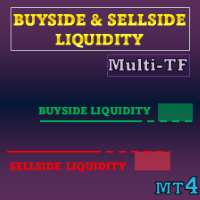
Special offer : ALL TOOLS , just $35 each! New tools will be $30 for the first week or the first 3 purchases ! Trading Tools Channel on MQL5 : Join my MQL5 channel to update the latest news from me This indicator visualizes liquidity levels and liquidity zones based on ICT concepts, plus Liquidity Voids to highlight one-direction price displacements. It focuses on where stop or pending orders tend to cluster and how those areas evolve once price trades through them.
Se

Time Range Separator is a useful tool to display a separator period on your platform. You could go in the properties of the indicator, select the desired range and that's ALL. We believe it is a useful and necessary that we wish to share with you for free all our followers.
Input Values: TimeFrame Period Separator GMT_Hour (ex. +1 or -1) to move the lines at Period Time +/- tot hours in input Hide_dates to show or hide the datetime on vertical lines VLine_Color = Vertical Color Line VLine_Style
FREE
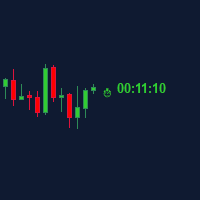
Candle Time (MT4) The Candle Time indicator shows the remaining time for the current candle on the active chart timeframe. It adapts automatically to the chart period and updates on every tick. This is a charting utility; it does not provide trading signals and does not guarantee any profit. Main functions Display the time remaining for the current candle on any timeframe (M1 to MN). Color-coded state: green when price is above the open (up), gray when unchanged, and red when below the open (do
FREE

** All Symbols x All Time frames scan just by pressing scanner button ** *** Contact me to send you instruction and add you in "Harmonic Scanner group" for sharing or seeing experiences with other users. Introduction Harmonic Patterns are best used to predict turning point. Harmonic Patterns give you high win rate and high opportunities for trade in during one day. This indicator detects the best and successful patterns base on Harmonic Trading books . The Harmonic Patterns Scanner Scans All ch

CandleStick Countdown – Candle Remaining Time Indicator CandleStick Countdown is a simple and practical MT4 indicator that displays a real-time countdown of how many minutes and seconds remain until the current candle closes. It helps improve trading timing accuracy and is widely used by traders. Main Features Displays the remaining time of the current candle in a "minutes:seconds" format Shown as text on the chart for high visibility Automatically adjusts position near the current price for eas
FREE

Special offer : ALL TOOLS , just $35 each! New tools will be $30 for the first week or the first 3 purchases ! Trading Tools Channel on MQL5 : Join my MQL5 channel to update the latest news from me SMC is a trading approach that helps traders identify liquidity zones, institutional order placements, and key market turning points. By leveraging SMC principles, traders can navigate the market more effectively, finding optimal entries and exits. The SMC System indicator automates th
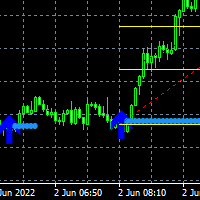
Here is the Double Arrow ArrZZx2 indicator that works best on 5 minutes time frame with Alerts. Good for pairs like NAS100, US30, GER30 and XAUUSD Your buy entry or Sell entry is on the second arrow of the Arr zzz You can confirm your second arrow with Fibonacci retracement levels the 50% level and the 61.8% which is the golden zone The double is good on strong trending markets look for the breakout on the second arrow Look at the screenshots for examples.

EMA Cloud System is a Trading System Invented by Ripster where areas are shaded between two desired EMAs. The concept that the EMA cloud area serves as support or resistance for Intraday & Swing Trading. Can be utilized effectively on 10 Min for day trading and 1Hr/Daily for Swings. Ripster utilizes various combinations of 5-12 EMA clouds 34-50 EMA clouds among others. 8-9, 20-21 EMA clouds can be used as well. Adjust what works for you. Ideally 5-12 or 5-13 EMA cloud acts as sold fluid Trendlin
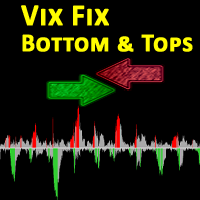
The VIX Fix is a volatility indicator developed by renowned trader Larry Williams. It's designed to measure volatility in assets that don't have options or futures, such as individual stocks and forex markets. Essentially, it acts as a synthetic VIX (Volatility Index) for any asset , providing a gauge of market uncertainty. This modified version of William's indicator helps you to find market bottoms and market tops. It comes with 2 styles: Stochastic and histogram style. Please see screenshot
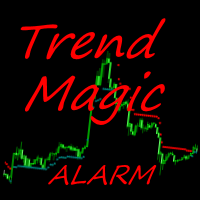
The Trend Magic Alarm shows the direction of a trend and indicates when it changes with a sound, popup window, push or email notice. Blue dots in the chart indicate an uptrend, red dots indicate a downtrend. Levels of former highs + lows give orientation in a chart. Trend Magic Alarm can draw these levels as lines in the chart, see inputs.
Input Parameters Counter : number of bars used for calculation PowerSet : shows how near to the bars the trigger dots are placed DotSize : size of the shown

"The Squeeze indicator attempts to identify periods of consolidation in a market. In general the market is either in a period of quiet consolidation or vertical price discovery. By identifying these calm periods, we have a better opportunity of getting into trades with the potential for larger moves. Once a market enters into a "squeeze," we watch the overall market momentum to help forecast the market direction and await a release of market energy." The StdATR Squeeze Channel combines standard

Forex Meter Oscillator is an indicator that can give a whole view of forex market from a single chart, measuring currency strenghts among 28 forex pairs (majors and minors). The "oscillator" word is very meaningful: it normalizes currency strenghts in order to provide values in a predefined range (from -1 to 1).
What are normalization's advantages? It's so simple, values will always be in a pre-defined range that reflect exactly the current value compared to the last N values. In this way you w
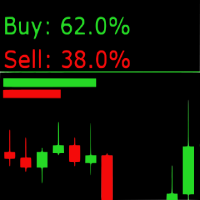
Sentiment Market Indicator: Real-Time Market Sentiment Display The Sentiment Market Indicator is a real-time MQL4 tool that displays current buy/sell sentiment directly on your MetaTrader 4 chart. Designed to support your technical analysis, it provides a visual representation of market positioning to help inform your decision-making process. Key Features Live Sentiment Display
View real-time percentage breakdowns of buy vs. sell sentiment. Customizable Alerts
Set specific thresholds for buy o
This indicator calculates support and resistance prices in multi-timeframe with different formulation and draw them on the chart that style do you choose. And If you want, Indicator can alert you when the current price arrive these pivot levels. Formulations: Classic, Camarilla, Woodie, Demark, Floor, Fibonacci
Alert Options: Send Mobil Message, Send E-mail, Show Message, Sound Alert
Levels: PP, S1, S2, S3, S4, S5, R1, R2, R3, R4, R5, TC, BC and Middle Points Why do you need this indicator:
Tim
FREE
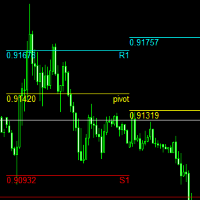
pivot points using by many traders and pivot levels most of the times are very helpfull . this indicator is a custom with internal parameters. it can show two times pivot (weekly and daily). you can choose periods total for each time showing pivots.( 1 week , 2 week ,...1day , 2day ,...) when use weekly and daily pivots , it can show you many support and resistance zones. if have proposal comment too me for upgrading indicator.
FREE

The indicator looks for consolidation (flat) in the market at a certain time, builds a box-channel and marks levels indented from it for a breakdawn. After crossing one of the levels, the indicator marks the zone for take profit and calculates the corresponding profit or loss in the direction of this entry on the panel. Thus, the indicator, adjusting to the market, finds a flat area of the market, with the beginning of a trend movement to enter it. Version for MT5: https://www.mql5.com/en/market
FREE

Didi Index indicator with visual buy and sell alert, with confirmation alert.
Buy or sell alerts, on screen and for mobile phones, with a visual description in colors of the direction on the screen!
A warning in the color of the current direction of the graph on the screen quickly informs you if the pair is bought or sold by Didi Index.
With configurable text position and size, making it easier to follow the trend of the pair.
FREE

Unleash Your Trading Potential with the Golden Fractal Cross Are you tired of second-guessing your trades? Do you wish you had a clear, reliable system to guide your decisions? Introducing the Golden Fractal Cross —a powerful and user-friendly indicator designed to help you spot high-probability trading opportunities. This isn't just another average indicator; it's a complete strategy that combines the precision of fractal patterns with the dynamic power of Exponential Moving Averages (EMAs). Th
FREE
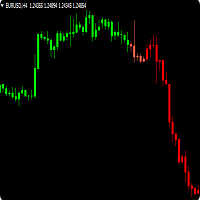
Trendfinder SMA are Colored candlesticks showing the trend based on two Simple Moving Averages and the slope of the slow moving average. This indicator will give you the color change on the next bar on the confirmation candle and will never repaint Trendfinder SMA is optimize to trade on any market and to be used trending and None trending markets. PLEASE TAKE NOTICE: For best results use this indicator as an extra tools after you have completed your regular analysis and use it for alerts base
FREE

G-Labs Market Maker Dashboard - Exclusive Seasonal Offer Elevate your trading with the original G-Labs Market Maker Dashboard, available for a limited time at just $70 USD. Ideal for starter traders, this dashboard has been enhanced with new features and now includes a comprehensive training video. This indicator is for people trading the market makers method and is the entry level dashboard for that strategy is available for both mt4 and mt5. its a market scanner in real time showing peak
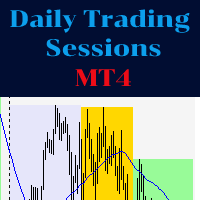
The indicator represents the session boxes for the Asian, European and American sessions. It is possible to change the time of each session, such as color. It is also possible to disable the display of each session. You will find in input parameters variables to modify time sessions in format hh:mm and the color of boxes of each sessions. If you need some implementations please contact me.
FREE

Note : New in 1.6: the indicator now exports the trade signal (but not displayed). Go long with light blue. Go short with red. Exit otherwise. Signal to be imported to your EA using iCustom. This indicator provides Best of the Best linear filter momentum oscillators that I am aware of (Low Pass Differentiators, LPD's) . All of them are recent developments by this developer, or other researchers. The oscillator line is the first buffer of the indicator, and can be called in other indicators or
FREE

This multicurrency strategy simultaneously determines the strength of the trends, entry points and the take profit levels for each trade. The indicator can determine entry points on any trading period from M1 to D1. For the convenience of users, the indicator renders the entry point (in the form of an arrow), recommended take profit levels (TP1, TP2, TP3) and the recommended stop loss level (SL1, SL2). The options for using the strategy are described below. Full description of the indicator Cosm

The product Divergence Mom Stoch Adx Bears Bulls is designed to find the differences between indicators and price. It allows you to open orders or set trends using these differences. The indicator has 4 different divergence features.
Divergence types Class A Divergence Class B Divergence Class C Divergence Hidden Divergence
Product Features and Rec ommendations There are 5 indicators on the indicator Indicators = Momentum Stochastic Adx Bears Bulls 4 different divergence types are used.
FREE

"WinWiFi All in Signal is designed based on the principles of Candlestick Consolidation (กระจุกตัว) and Price Expansion (กระจายตัว). By identifying these key behaviors on the M5 timeframe, traders can execute high-frequency entries with confidence. Our system eliminates timezone discrepancies between brokers, focusing purely on price action."
WinWiFi All in Signal – Master the M5 Gold Market "Unlock the power of Price Action with our $600 proven strategy. WinWiFi uses a unique logic of Candlest
FREE
This is a custom indicator based on the Exponential Moving Average (EMA) angle, typically used to measure the trend angle of EMA lines. Here are the main parameters and functions of this indicator: Main Parameters: md1: Fast period for EMA, default value is 12. md2: Slow period for EMA, default value is 26. md3: Period for the MACD signal line, default value is 9. Functions: The indicator calculates the MACD indicator and categorizes data into different buffers based on the direction and angle o
FREE
The High Low Cloud Trend indicator is a channel-based technical analysis tool that identifies trend direction and mean reversion opportunities through adaptive price boundaries. The system operates by calculating the highest high and lowest low over a specified lookback period, creating outer channel boundaries that define the overall price range. A secondary inner channel uses a shorter period (one-quarter of the main lookback) to capture more immediate price movements within the broader range.
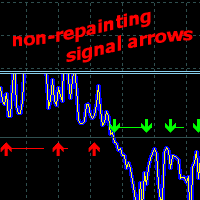
Price Direction Oscillator - indicator designed to detect short- and medium-term market movements. Adaptable to any market and timeframe,
It consists of a trend line, a market volatility oscillator, and a potential trading signal generator.
Indicator Use
It determines the trend based on market volatility and provides signals for opening BUY or SELL orders. Without redrawing its historical data, the signal arrows do not change color and appear at the close of the candle. Following the signal, t

Sniper Entries AI is a powerful, intelligent indicator designed for traders seeking precise entry points at potential market reversals. Leveraging advanced AI algorithms, this tool analyzes price patterns across multiple timeframes, allowing traders to stay informed of trend shifts, no matter the scale of their trades. Key Features of Sniper Entries AI: High-Precision Reversal Signals : The indicator scans market movements to identify precise reversal points and continuation, giving you a compe

The EasyTrend is a seemingly simple but quite powerful trend indicator. Everyone has probably come across indicators or Expert Advisors that contain numerous input parameters that are difficult to understand. Here you will not see dozens of input parameters, the purpose of which is only clear to the developer. Instead, an artificial neural network handles the configuration of the parameters.
Input Parameters The indicator is as simple as possible, so there are only 2 input parameters: Alert - i
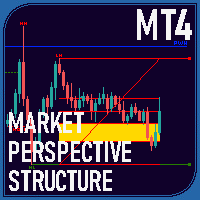
Overview The Market Perspective Structure Indicator is a comprehensive MetaTrader indicator designed to provide traders with a detailed analysis of market structure across multiple timeframes. It identifies and visualizes key price action elements, including swing highs and lows, Break of Structure (BOS), Change of Character (CHOCH), internal structures, equal highs/lows, premium/discount levels, previous levels from higher timeframes, and trading session zones. With extensive customization opt

Easy Scalp System Pro: Never Miss an Entry Again! Are you tired of complex trading setups that leave you guessing? Introducing the Easy Scalp System Pro —your ultimate, high-accuracy tool for capturing fast profits in any market! This powerful indicator combines the best of trend confirmation (Multiple EMAs) and momentum timing (MACD) into clear, non-repainting Buy and Sell arrows right on your chart. It's designed for scalpers and day traders who demand speed and precision. Why Choose Easy Sca
FREE

SMARTMASS INDICATOR This indicator is different from all known volume indicators. It has a significant distinction; it is an algorithm that relates price movement to volume, attempting to find proportionality and efficient movement while filtering out noise and other movements that are more random and do not follow a trend or reversal. Ultimately, it reveals the true strength of the movement, indicating whether it has genuine support from bulls or bears or if it's merely a high-volume movement

Introduction To Time Box Indicator Time Box Indicator is a must have indicator for any trader. It will display daily, weekly and Monthly box according to your preferences. Yet, you can extend any important price levels in your chart automatically. You can use them as the significant support and resistance levels. It is very simple but effective tool for your trading.
Graphic Setting Use White Chart Line Style for Current Open price
Daily Setting Update Timeframe for daily box Number of days to
FREE
Highly configurable Macd indicator.
Features: Highly customizable alert functions (at levels, crosses, direction changes via email, push, sound, popup) Multi timeframe ability Color customization (at levels, crosses, direction changes) Linear interpolation and histogram mode options Works on strategy tester in multi timeframe mode (at weekend without ticks also) Adjustable Levels Parameters:
Stochastic RSI Timeframe: You can set the lower/higher timeframes for Stochastic RSI. Stochastic RSI
FREE

Draw and Sync Objects Multiple Charts 1. Draw objects by key press. ( You must: 1. Press Function key => 2. Click where you want to draw => 3. Draw it => 4. Press ESC to complete). (If you don't want to draw after pressing function key, you must press ESC to cancel). 2. Developing : Sync selected objects to multiple charts by button. 3. Developing: Hide objects that do not belong to the current symbol (Objects drawn with this indicator will belong to the symbol they are plotted
FREE
Immerse yourself in a trading environment where adaptability meets precision. Dynamic Grid Pro v1.7 offers a suite of tools designed to refine your approach in the market. This system was developed with the intention of providing a flexible framework for the execution of grid trading strategies. Its core functionality lies in the ability to dynamically adjust grid parameters in response to ever-changing market conditions. Features of Dynamic Grid Pro v1.7: Dynamic Grid: The system automatically

Product Title Smart Moving Averages (MT4) – part of the SmartView series Short Description A Moving Averages indicator with a unique user experience on MetaTrader platform. Features advanced capabilities not previously available, such as opening settings with double-click, hiding and showing indicators without deleting them, and displaying indicator windows at full chart size. Designed to work seamlessly with the rest of the SmartView Indicators series. Overview The SmartView series offers a uni
FREE

The indicator displays overbought and oversold levels, calculating them using the Fibonacci golden ratio formula.
It enables both trend-following and counter-trend trading, accommodating breakouts and rebounds from these levels.
It operates on all timeframes, across various currency pairs, metals, and cryptocurrencies.
Suitable for binary options trading.
Key Features: Based on the Fibonacci golden ratio Shows overbought and oversold levels Suitable for market and pending orders Simple
FREE
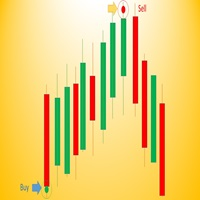
Wave Entry Alerts In Gold is a custom indicator developed by Azad Gorgis for MetaTrader 4. This indicator is designed to provide alerts based on ZigZag patterns, specifically tailored for trading on the Gold (XAU/USD) symbol.
Key Features: - Chart Window Indicator: The indicator is designed to be displayed on the main chart window. - Arrow Signals: The indicator generates arrow signals on the chart, indicating potential reversal points based on ZigZag patterns. - Customizable Parameters: Trade
FREE

What does this do? It shows you on the chart which stop belongs to which entry. Have you ever had multiple positions or trades open on a single pair and were confused which stop loss goes with what entry? Even worse, the stop loss orders for buy and sells are the same color on the chart. Well, your problem has been solved! This indicator will show you which stop belongs to which entry. It will place a vertical line and an arrow on the chart for each open trade. A yellow line connects the entry
FREE
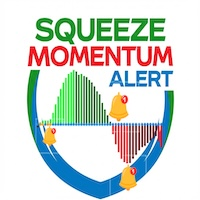
Squeeze Momentum Alert 1. Identifies Price "Explosion" Points (The "Squeeze") The greatest advantage of this indicator is its ability to catch periods where the market is "consolidating" or "gathering energy" before a massive move. Why it's good: Markets cycle between periods of calm (consolidation) and bursts of volatility (explosions). This tool tells you, "The chart is currently compressing tightly; get ready for the next big surge," ensuring you don't miss the start of a major trend. 2. Dist

The indicator is designed for displaying the following price levels on the chart: Previous day's high and low. Previous week's high and low. Previous month's high and low. Each of the level types is customizable. In the indicator settings, you set line style, line color, enable or disable separate levels. The version of the exact same indicator but only with sound alerts there - Time Levels with Alerts .
Configurations ----Day------------------------------------------------- DayLevels - enable/
FREE
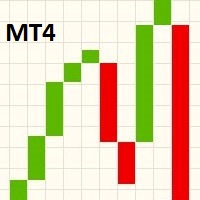
This indicator displays a Line Break chart in the main chart window. To view the line break chart on its own, change the main chart window to display a Line Chart and then change the "Line chart" color to "None" in the F8 properties dialog. When scrolling, zooming in/out or changing the chart pair/timeframe, the indicator will resize the blocks on the next tick to fit the main chart viewing area. Line Break charts were invented in Japan and are similar to Point & Figure and Renko charts. A Japan
FREE

Simple ATR Stop Loss : Your market volatility compass that helps you navigate the treacherous waters of trading , setting smarter Stop Losses and making you look like a trading ninja (cape not included). Attention all trading aficionados and market mavens! Behold, the Simple ATR Stop Loss indicator – your new best friend in the wild world of trading. It's simpler than a two-piece puzzle but mightier than a caffeinated bull in a china shop. The ATR Trading Cheat Sheet (or
FREE

False Breakout Stochastic to be used with our Elliott Wave Indicator as part of the overall strategy on trading the 5th wave.
As we cannot upload multiple files, we have listed this separately. False Breakout Stochastic is best used as a confirmation tool rather than the sole signal indicator The Elliott Wave Indicator Suite is designed around a simple but effective Swing Trading Strategy. The Indicator Suite is great for Stocks, Futures and Forex trading on multiple timeframes You can find the
FREE

Are you tired of wasting time trying to figure out the total value of your TP and SL lines on Metatrader charts? Look no further, because we have a solution for you. Introducing our free MT4 indicator that allows you to easily track the total SL and TP of your positions on any corner of your screen. With customizable X-Y parameters and color options, you can personalize your screen to fit your trading style. Say goodbye to the hassle and confusion of monitoring your positions, and make smarter
FREE
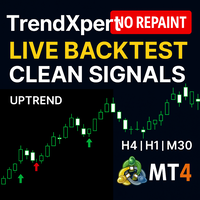
TrendXpert Indicator v1.02 – Master the Trend, Trade with Precision Overview
TrendXpert v1.02 is a precision tool built for serious traders who want to stay on the right side of the market. Designed specifically for the 4H, 1H, and 30M timeframes, it helps you identify high-probability trend conditions and delivers timely, clean trade signals—without clutter or confusion. What’s New in v1.02 Enhanced Trend Detection : Improved internal logic ensures even greater accuracy in trend labeling and
FREE

Description
SuperCCI is an indicator based on the standard CCI indicator. It identifies and displays convergences/divergences in the market and forms the corresponding entry points. Also, using the trading channel index, it determines the direction of the trend and displays the levels of support and resistance .
Features Not repaint. Shows entry points. Shows the direction of the current trend and support/resistance levels. Has notifications. Recommendations
Use convergence/divergence to ide
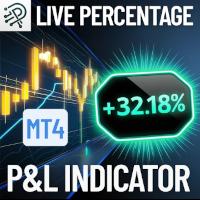
Quickly monitor your floating profit or loss as a percentage of your account balance live and always visible right on your chart! Key Features: Real-Time Calculation: Instantly calculates the combined floating profit or loss from all open trades as a percentage of your current account balance. Easy On-Chart Display: The result is conveniently shown as a label in the lower-right corner of your chart no distractions, always visible. Clear Color Coding: Green for profit, red for loss for imm
FREE

Mouse Calculation quickly calculates each order’s P/L if closed at the price level you point to with your mouse. Ideal for quick decisions when managing multiple orders such as grid, martingale, and scaled entries. Break-even and target price levels at a glance. Key Features Mouse PnL (M) : Preview per-order and total P/L (including swap). Break even Price (B) : Show the basket break-even price / break-even line. Time_Sync_Lines (T) : Align the same time-of-day across the most recent N days for
FREE

. Simple Trading System Update !!! Follow this link to see our Strategy !!! (With auto trade indicator)
Description This is an indicator Free Version and showing only history signals, Not real time. Binary Deal Trading Indicator is an indicator on MT4 for Binary Option Trading. It forecasts the overbought / oversold level, Reversal and Fractal point. This indicator will help you to decide a reversal price on any time frame (Recommend M1, M5 and M15). The expiry time is 5-15 minutes after rec
FREE

Stop Chasing Trends, Start Sniping Reversals: Introducing Stochastic Sniper Are you tired of trading sideways markets or getting caught by false breakouts? The Stochastic Sniper indicator is engineered for precision entry . It combines the volatility channels of Keltner Bands with the momentum timing of the Stochastic Oscillator to pinpoint extreme price reversals with high accuracy. Think of it as having a sniper scope on the market. It waits for the price to stretch to its maximum, confirms t
FREE
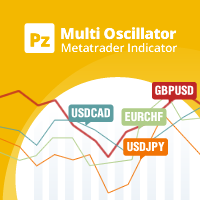
Leverage multi-currency insights for effective statistical arbitrage The Multi-Oscillator is the ultimate swiss army knife for multi-currency and multi-timeframe trading. It plots your desired oscillator for many currency pairs and/or timeframes in a single chart. It can be used to trade statistical arbitrage, as a market screening tool or as a refined multi-timeframe indicator. [ Installation Guide | Update Guide | Troubleshooting | FAQ | All Products ] Easy interpretation and configuration Sup
FREE

Heiken Ashi Toggle – Instant Chart Mode Control for MT4 Heiken Ashi Toggle (Also spelled Heikin Ashi) is a small utility indicator for MetaTrader 4 that provides Heiken Ashi candles — with one key upgrade: instant ON/OFF control directly from the chart . Instead of constantly adding, removing, or reloading indicators, this tool allows traders to switch between standard candlesticks and Heiken Ashi visualization with a single click. What This Indicator Does Displays classic Heiken Ashi candles
FREE

If you like this project, leave a 5 star review. Trading large volumes requires us to look at multiple instruments/charts to
find new opportunities, this indicator will help you by plotting specific
levels by the multiple of a number or its suffix and update them automatically
as the price changes, a task that would otherwise be tedious. For example, on GBPUSD, you could have 4 instances of the indicator on the
chart to plot: Each 0.01 intervals with line length of 100 bars. Each price ending in
FREE

If you like this project, leave a 5 star review. As institutionals trade large volumes, it is not uncommon for them to try to
defend their position at specific percentage levels. These levels will serve as a natural support and resistance which you can use
either to enter a trade or be aware of possible dangers against your position. An example of a common used percentages are 0.25% and 0.50% on EURUSD for the
week, you can see this example on the screenshots. With this indicator you will be abl
FREE
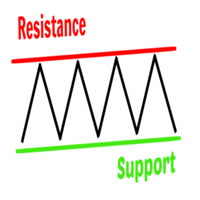
Support and resistance levels are the key factors that determine the price movement from one zone to another. They are levels for trend reversal/breakout signals forex traders look out for before making a trade decision. The Support and Resistance Indicator is a custom trading tool for MT4 developed to plot support/resistance zones from past price actions. The indicator also helps a trader evaluate optimal zones to place a BUY/SELL order or to exit a trade. In other words, it assists traders to
FREE

The VR Grid indicator is designed to create a graphical grid with user-defined settings. Unlike the standard grid , VR Grid is used to build circular levels . Depending on the user's choice, the step between the round levels can be arbitrary. In addition, unlike other indicators and utilities, VR Grid maintains the position of the grid even when the time period changes or the terminal is rebooted. You can find settings, set files, demo versions, instructions, problem solving, at [blog]
You can
FREE

Early Bird Breakout: Capture the Power of the London Open Are you tired of trading in choppy, unpredictable markets? The Early Bird Breakout is your essential tool for exploiting one of the most reliable and explosive patterns in Forex: the Asia Session Breakout . This smart indicator automatically identifies the crucial price levels set during the quiet Asian hours and alerts you the moment the major volume of the London/European session ignites a trend! Key Features and Market Edge Precision
FREE
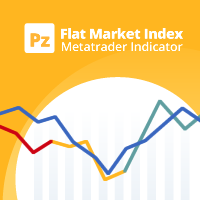
Identify trending and flat markets effortlessly
This indicator calculates how much has a symbol moved in relative terms to find trending or flat markets. It displays what percentage of the latest price range is directional. It can be used to avoid trading in flat markets, or to find flat markets to execute range-bound trading strategies. [ Installation Guide | Update Guide | Troubleshooting | FAQ | All Products ] A value of zero means the market is absolutely flat A value of 100 means the marke
FREE
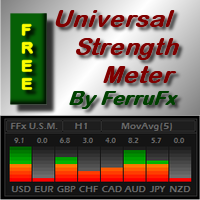
PRO version is available here: https://www.mql5.com/en/market/product/12648 FFx Universal Strength Meter is more than a basic strength meter. Instead of limiting the calculation to price, it can be based on any of the 19 integrated strength modes + 9 timeframes. With the FFx USM, you are able to define any period for any timeframe. For example, you can set the dashboard for the last 10 candles for M15… Full flexibility! Very easy to interpret... It gives a great idea about which currency is weak
FREE

The indicator builds a Renko chart in the sub window for the current symbol. The bars are formed from live data and the desired bar size can be set in the inputs tab. Most importantly, because the Renko chart only uses price to construct bars and ignores time, the indicator can be applied to any time frame and same results can be achieved. Recommended usage
As Renko charts are famous for eliminating noise so traders can use this tool to see clear picture of the trend to help their analysis, entr
FREE

Principles of construction of the indicator. The Absolute Bands (AB) indicator is reminiscent of the Bollinger Bands indicator with its appearance and functions, but only more effective for trading due to the significantly smaller number of false signals issued to them. This effectiveness of the Absolute Bands indicator is due to its robust nature. In the Bollinger Bands indicator, on both sides of the moving average - Ma, there are lines spaced from Ma by the standa
FREE
MetaTrader Market - trading robots and technical indicators for traders are available right in your trading terminal.
The MQL5.community payment system is available to all registered users of the MQL5.com site for transactions on MetaTrader Services. You can deposit and withdraw money using WebMoney, PayPal or a bank card.
You are missing trading opportunities:
- Free trading apps
- Over 8,000 signals for copying
- Economic news for exploring financial markets
Registration
Log in
If you do not have an account, please register
Allow the use of cookies to log in to the MQL5.com website.
Please enable the necessary setting in your browser, otherwise you will not be able to log in.