Watch the Market tutorial videos on YouTube
How to buy а trading robot or an indicator
Run your EA on
virtual hosting
virtual hosting
Test аn indicator/trading robot before buying
Want to earn in the Market?
How to present a product for a sell-through
Technical Indicators for MetaTrader 4 - 14
* All Symbols x All Timeframes scan just by pressing scanner button ** *** Contact me to send you instructions and add you in "Candle Scanner group" for sharing or seeing experiences with other users. Introduction: Candles tell their story. When looking at a candle, it’s best viewed as a contest between buyers and sellers. Candlestick patterns are used to predict the future direction of price movement. Candlesticks are an easy way to understand the price action. You can use candlesticks to decid
FREE

Tired of plotting trendlines? The PZ TrendLines indicator applies a mechanical approach to the construction of trend lines for you! [ Installation Guide | Update Guide | Troubleshooting | FAQ | All Products ] It can draw up to 18 trendlines Trendlines can be optionally based on fractals Each line represents a breakout level Each trendline can be broken or rejected Configurable amount of lines Configurable colors
Author Arturo López Pérez, private investor and speculator, software engineer and
FREE

The indicator measures the imbalance between bulls and bears over a chosen period and shows a straight line in color between the two points right on your chart. Additionally indicator's window shows how exactly the volume developed in time. ( This is a manual indicator and contains features that are may not supported by the MetaTrader current testing environment )
If the bulls have more volume than the bears, the line turns green. If the bears have more volume, it is red. The line also shows

The Gann Box (or Gann Square) is a market analysis method based on the "Mathematical formula for market predictions" article by W.D. Gann. This indicator can plot three models of Squares: 90, 52(104), 144. There are six variants of grids and two variants of arcs. You can plot multiple squares on one chart simultaneously.
Parameters Square — selection of a Gann square model: 90 — square of 90 (or square of nine); 52 (104) — square of 52 (or 104); 144 — universal square of 144; 144 (full) — "fu
Trend Correlation Strength (TCS) Indicator: Your Edge in Forex Trend Analysis The Trend Correlation Strength (TCS) Indicator is a cutting-edge tool that redefines how you measure trend strength, offering a significant advantage over conventional indicators like the Average Directional Index (ADX). Unlike ADX, which relies on directional movement, TCS uniquely quantifies trend strength by calculating the correlation between closing prices and a linear time series . This innovative approach provi
FREE

We present you an indicator that not only improves the visual aspect of the chart, but also gives it a lively, dynamic character. Our indicator is a combination of one or more Moving Average (MA) indicators, which constantly change their color, creating an interesting and colorful look.
This product is a graphical solution, so it is difficult to describe what it does in text, it is easier to see by downloading it, besides the product is free. This indicator is suitable for bloggers who want to
FREE

This indicator is an original view on volumes. It is known that volumes show the amount of buyers and sellers for a certain period of time. A candle is used a period of time. Volumes at a candle High show the buyers. Volumes at a candle Low show the sellers. A candle Open shows the Delta. Delta indicates who was dominant on a given candle, buyers or sellers.
Input parameters Distance - distance of the volumes text from High and Low. Font size - text font size. The indicator provides levels that
FREE

Murray's mathematical levels are based on observations by Gann and his theory of the squareness of prices. According to Gann, the price moves in 1/8 of the range. These 1/8 allow us to get different resistance and support levels for a given chart, which have their own characteristics. After a breakout of -2 or +2 levels, or with a decrease in volatility, they are rebuilt. You can choose which period to display (current or entire history). All lines are drawn through buffers. Blog-Link - Murrey
FREE

The TrueChannel indicator shows us the true price movement channels. This indicator resembles Donchian Channel in its appearance, but is built on the basis of completely different principles and gives (in comparison with Donchian Channel , which is better just to use to assess volatility) more adequate trading signals. As shown in the article , the price actually moves in channels parallel to the time axis and jumps abruptly from the previous channels to the subsequ
FREE

Cyber Engulf Indicator - Professional Trading System for MetaTrader 4 What is the Indicator?
Cyber Engulf is an advanced technical analysis indicator that detects engulfing patterns filtered by moving average. It identifies trend reversal points, helping you spot changes in market structure early. What Does It Do? Automatically identifies engulfing candlestick patterns Filters out false signals using moving average Displays buy and sell signals with blue/up and red/down arrows Works across mult
FREE

The Super Arrow PRT Indicator generates high-probability trading signals by using multiple indicators such as Moving Averages, Bull/Bear power, Relative Strength Index (RSI), Bollinger Bands, and Magic Filter. It filters out false signals and provides good trade signals by combining these indicators. The Supper Arrow PRT indicator is a trend reversal system that paints buy/sell signal arrows at the potential reversal zone of the price. The buy/sell signal arrows are painted directly on the ch
FREE

Gold Rush Signal Pro: Triple-Filter Precision Indicator Tired of false signals and getting whipped out by market noise? The Gold Rush Signal Pro indicator is engineered to cut through the confusion, providing you with high-probability trading opportunities powered by three layers of filtering. This is not just another Moving Average tool—it's a complete system designed for precision. Why You Need Gold Rush Signal Pro This indicator is your competitive edge, focusing on market confluence to ensu
FREE
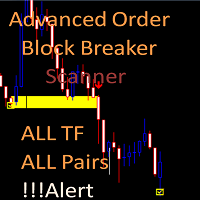
Advanced Order Block Breaker Scanner
This Scanner is free to download but is dependent on you owning the advance order block breaker indicator. Need to purchase the indicator here: https://www.mql5.com/en/market/product/59127
MT5 version: https://www.mql5.com/en/market/product/62769
The Scanner will show you on a single chart all the timeframes (M1 to Monthly) with their own status for the indicator: advance order block breaker Scan all time frame and all symbol: breaker's smart algor
FREE

CyberZingFx Volume Indicator is designed to help traders find market reversals with ease. This powerful tool uses a unique strategy that combines both volume and historical price to provide accurate signals for potential market reversals. The indicator displays volume BUY and SELL power values on the right side of the chart for both BUY and SELL. With customizable settings, you can set alerts at different levels to suit your trading style. The most recent alert value is displayed as Alert High,
FREE

Lord Auto Fibonnaci is a free indicator for Meta Trader, in order to show the most famous chart in the financial market known as "Fibonnaci".
As we can see in the images below, the fibonnaci table will automatically analyze the graph for you, with trend factors through percentage, almost infallible use, you can always work when the percentage is low or high, start shopping and sales on time, great for analyzing entries!
In the images below we can see an example in gold in H4, where we are at
FREE

The indicator displays minimized charts of any symbol from any timeframe. The maximum number of displayed charts is 28. The charts can be located both in the main and bottom window. Two display modes: candles and bars. Amount of displayed data (bars and candles) and chart sizes are adjustable. Parameters: Corner - display start corner (selected from the list) CandleMode - display mode: true - candles, false - bars ShowLastBid - enable/disable the last price display LastBidShiftX - last price lin
FREE

The Trend_Scalper_Arrows_Entry&Exit trend indicator perfectly follows the trend, indicates entry search zones, indicates entry signals with arrows, and also indicates zones for fixing market orders with vertical lines. An excellent indicator for both beginners in Forex trading and professionals.
All lines, arrows, alerts can be disabled.
See all indicator parameters on the screenshot.
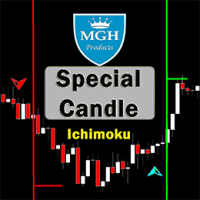
Special Candle
Do you want to use one of the best Forex indicators with a successful Ichimoku strategy? You can use this Awesome Indicator that is based on the Ichimoku strategy.
MT5 version is here
First strategy:
This strategy involves identifying similar strong crosses that rarely occur.
The best timeframes for this strategy are 30 minutes (30M) and 1 hour (H1).
Appropriate symbols for the 30-minute timeframe include:
• CAD/JPY
• CHF/JPY
• USD/JPY
• NZD/JPY
• AUD/JPY
• EUR
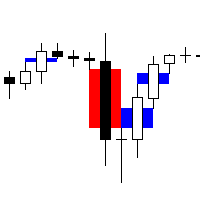
Fair Value Gap Scanner 4 is a sophisticated MetaTrader 5 indicator designed to detect fair value gaps (FVGs) in price action and display them as rectangles directly on the chart. This powerful tool empowers traders by providing visual representations of FVGs, enabling them to identify potential trading opportunities with ease and precision. With customizable parameters for color, width, and style, traders can tailor the indicator's appearance to suit their preferences and trading strategies. Key
FREE

Super Signal Series – V6 PRO Advanced Breakout Scanner Dashboard Exclusive Bonus When you purchase this indicator, you receive 2 professional Gold EAs: MT4 Gold EA
XAU Trend Matrix EA – Worth $150 : See the EA https://www.mql5.com/en/market/product/162870 MT5 Gold EA
XAU Steady Gain Pro – Worth $150 : See the EA https://www.mql5.com/en/market/product/162861 Total Bonus Value: $300 Advanced Breakout Scanner Dashboard Super Signal Series – V6 PRO is a professional multi-pair breakout scan

Ever wondered why standard ADX is made unsigned and what if it would be kept signed? This indicator gives the answer, which allows you to trade more efficient. This indicator calculates ADX values using standard formulae, but excludes operation of taking the module of ADX values, which is forcedly added into ADX for some reason. In other words, the indicator preserves natural signs of ADX values, which makes it more consistent, easy to use, and gives signals earlier than standard ADX. Strictly s
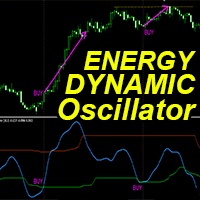
"Dynamic Energy Oscillator" - is an advanced custom Crypto_Forex indicator - efficient Trading tool for MT4!
- New generation of Oscillators - see pictures to check how to use it. - Dynamic Energy Oscillator has adaptive Oversold/Overbought zones. - This is a technical momentum indicator which is very useful on trend markets. - Oscillator is an auxiliary tool to find exact entry points from OverSold/OverBought areas. - Oversold values: below Green line, Overbought values: above Orange line. -

Immediately plots renko bars in an external/indicator window. One of the distinctive advantages Renko charts offer is the fact that they are not time dependent. Therefore, the new Renko blocks are only traced when the price moves higher or lower by the specified number of points.
For example, a 10 pip (100 points) Renko chart would plot the blocks when price moves 10 pips higher in an uptrend or 10 pips lower in a downtrend. Renko charts removes "noises" from the Market and i t helps to identi

The Future Trend Channel is a dynamic and visually intuitive indicator designed to identify trend directions and inform potential price movements. Originally developed by ChartPrime for TradingView, this tool has been adapted for MetaTrader 4, offering traders a experience with similar functionality. Whether you're a swing trader, day trader, or long-term investor, the Future Trend Channel helps you visualize trend strength, anticipate reversals, and optimize entry/exit points.
Key Features Mul
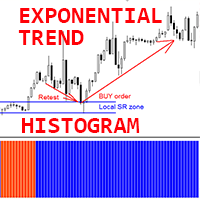
Crypto_Forex Indicator "Exponential Trend Histogram" for MT4, No Repaint.
- Exponential Trend Histogram indicator is very efficient for trend detection purpose. - The best way to use it - is to combine with Support/Resistance Levels and Retest technique (see pictures): - Once indicator detects new trend - find local SR level and arrange corresponding pending order there expecting Retest of that zone. - If new trend is bullish - arrange Buy Limit pending order; if new trend is bearish- arrange
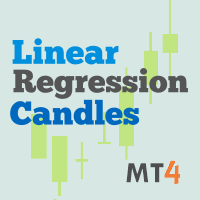
This indicator is the mql version of the Linear Regression Candles indicator. Find out more here: https://www.mql5.com/en/users/rashedsamir/seller There are many linear regression indicators out there, most of them draw lines or channels, but this one actually draws a chart.This script includes features such as linear regression for open, high, low, and close prices, signal smoothing with simple or exponential moving averages. I welcome your suggestion for improving the indicator.
To incre
FREE

CS ATR FIBO CHANNELS MULTI TIMEFRAME
Additional tool to trade with Cycle Sniper Indicator.
Cycle Sniper : https://www.mql5.com/en/market/product/51950 Indicator Draws Channels based on: - Cycle Sniper Price and Moving Averages - ATR Deviations - Fibonacci Retracement and Extensions
Features: - Multi TimeFrame - Full alert and Notification options. - Simple Settings - Finds the trend change or extreme reversals.
Inputs: - Arrow Mode: ATR Levels or Median Line If Median Line is selected ind
- Real price is 80$ - 60% Discount (It is 30$ now) - It is enabled for 1 purchase. Contact me for extra bonus tool, instruction or any questions! - Non-repaint, No lag - I just sell my products in Elif Kaya Profile, any other websites are stolen old versions, So no any new updates or support. - Lifetime update free
Introduction Smart Money Concepts (SMC) strategy was initially popularized the Inner Circle Trading (ICT) method which is claimed to be the evolved version of the SMC. Essenti

This indicator is a conventional analytical tool for tick volumes changes. It calculates tick volumes for buys and sells separately, and their delta on every bar, and displays volumes by price clusters (cells) within a specified bar (usually the latest one). The algorithm used internally is the same as in the indicator VolumeDelta , but results are shown as cumulative volume delta bars (candlesticks). Analogous indicator for MetaTrader 5 exists - VolumeDeltaBars . This is a limited substitution

This is an unconventional version of the Heiken Ashi Smoothed indicator implemented as lines rather than a histogram. Unlike a usual histogram, the indicator draws the readings of the two moving averages in the form of colored lines.
Example If the candle crosses two indicator lines upwards, a trend is assumed to be changing from bearish to bullish. If the candle crosses two indicator lines downwards, a trend is assumed to be changing from bullish to bearish. The indicator is good at displaying
FREE

ATR Volatility plots the ATR-based volatility, and triggers alerts when it crosses user-defined upper and lower thresholds (purple and tan lines, please see screenshots). Circles are painted when ATR volatility crosses either above the upper threshold, or below the lower threshold. This is a small tool custom-built by our group, by specific request of one of our customers. We hope you enjoy! Do you have an indicator you would like to see designed? Feel free to send us a message! Click here for m
FREE
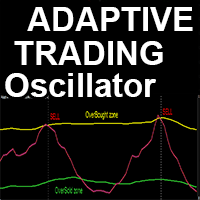
Advanced custom Crypto_Forex indicator "Adaptive Trading Oscillator" - efficient auxiliary Trading tool for MT4!
- This indicator is a New generation of Oscillators - see pictures to check how to use it. - "Adaptive Trading Oscillator" has adjustable adaptive Oversold/Overbought zones. - This oscillator is an auxiliary tool to find exact trade entry points on the Exits from dynamic OverSold/OverBought areas. - Oversold zone: below the Green line. - Overbought zone: above Yellow line . - This

Currency Strength Matrix (CSM) is an indicator that will show you the current strength of the major currencies in several timeframes, allowing you to sort the currencies for strength and spot possible trading setups. This indicator is ideal for scalping and in all those events of sudden big moves.
How does it work? The CSM compares the value of the current moving average with the same moving average in the previous candle for all the 28 pairs and all 9 timeframes, producing a Matrix of Strength
FREE

SmoothedRSI is a custom indicator that calculates a standard RSI and then applies a smoothing method to the RSI values. The indicator displays only the smoothed RSI line in a separate window. The output range is 0 to 100. RSI can react strongly to short-term price fluctuations, which may increase small oscillations depending on market conditions. This indicator smooths the RSI values to reduce short-term noise and make broader momentum changes easier to observe. Core Specifications Display: one
FREE
40% off. Original price: $50 (Ends on February 15)
Moving Average Trend Scanner is a multi symbol multi timeframe triple MA crossover dashboard that helps traders to monitor, and identify potential market trends from one chart. This panel scans 3 moving averages in up to 28 configurable instruments and 9 timeframes for triple moving average alignment and moving average crossover with a deep scan feature to scan all market watch symbols (up to 1000 instruments!).
Download Demo here (Scans o

Trend Dot Indicator
– Clean & Powerful Reversal System A fast-reacting Trend Step Regression (TSR) line with color-coded dots instantly shows the current trend. High-probability BUY/SELL signals appear only when a real reversal occurs, confirmed by minimum trend length and ADX strength. Description here: https://www.mql5.com/en/blogs/post/765867 Feel free to join my Telegram Channel Features: Clear visual TSR line + dots (blue = up, red = down) Filtered reversal signals with text labels Re

RCI (Rank Correlation Index) Indicator Overview The RCI (Rank Correlation Index) indicator is an oscillator-based tool that analyzes market trends and possible turning points by measuring the rank correlation of price data.
It quantifies the correlation between price ranking and time ranking over a specified period, displaying values from -100 to +100 as a simple line.
RCI is widely used for gauging market momentum, timing entries and exits, and can support both trend-following and counter-tren
FREE

Early Bird Breakout: Capture the Power of the London Open Are you tired of trading in choppy, unpredictable markets? The Early Bird Breakout is your essential tool for exploiting one of the most reliable and explosive patterns in Forex: the Asia Session Breakout . This smart indicator automatically identifies the crucial price levels set during the quiet Asian hours and alerts you the moment the major volume of the London/European session ignites a trend! Key Features and Market Edge Precision
FREE

Boost your trend-spotting capabilities with the Consecutive Candle Indicator MT4, a dynamic tool designed to identify streaks of bullish or bearish candles, delivering timely alerts for trend confirmations and potential reversals in forex, stocks, crypto, and commodities markets. Celebrated in trading communities like Forex Factory and Reddit’s r/Forex, as well as praised in discussions on Investopedia and TradingView for its ability to simplify momentum analysis, this indicator is a favorite a
FREE

The SPV Volatility indicator is one of the most effective filters. Volatility filter. Shows three volatility options. The so-called limit, real, and the last most effective filter for the filter is the percentage filter. Percentage display of folatility shows the ratio of limit to real volatility. And thus, if we trade in the middle of the channel, then it is necessary to set a condition that the percentage is less than a certain indicator value. If we trade on the channel breakout - following t
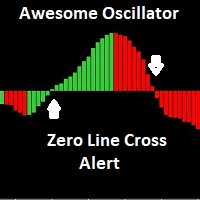
The Awesome Oscillator (AO) is an indicator used to measure market momentum. AO calculates the difference between a 34 Period and 5 Period Simple Moving Average. The Simple Moving Averages that are used are not calculated using closing price but rather each bar's midpoints. This indicator has email and pushup "mobile" features Alert, for any suggestions, please don't hesitate, thanks
FREE

Galaxy Force Analyzer - is an intelligent indicator for analyzing market volume and strength. It combines data from indicators like Force, OBV, MFI, AD, and others with advanced algorithms for acceleration and filtering to show the energy of price movement — the moment when a trend gains strength or begins to weaken. The indicator doesn’t just display volume — it measures impulse power, acceleration, and the speed of pressure changes between buyers and sellers.
Signals: Everything on the chart
FREE

The Trade by levels indicator is designed to automatically determine the formation of a model for entering the market on the chart of the selected instrument.
Definitions: ⦁ BFl is the bar that formed the level. ⦁ BCL1 and BCL2 bars, confirming the level.
The graphical model: ⦁ levels high\low the bars BFL and BCL1 must match the accuracy to the point ⦁ there can be any number of bars between BFL and BCL1. ⦁ between BCL1 and BCL2 intermediate bars
FREE
Gold Trend M1 - Optimized Scalping Tool for Gold (XAUUSD) Gold Trend M1 is a high-frequency trading indicator for the MetaTrader 4 platform, specifically optimized for the M1 timeframe on the Gold market. It combines a powerful SuperTrend trend filter with buy/sell signals derived from Heiken Ashi calculation logic, helping traders identify precise and disciplined entry points for optimal trading performance.
Key Features Optimized for M1 Scalping: Specifically developed for high-speed scalping
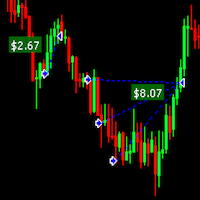
Draw Profit indicator can efficiently help those traders who want to see on the chart all closed positions output: profit or loss. If set DrawProfit on your chart managed by an Expert Advisor (EA) you will see clearly it’s performance by its profits & losses. My other products: https://www.mql5.com/en/users/hoangvudb/seller
Input parameters: Show Profit Labels : show profit of orders with a label (true/false). Profit Mode : available options: Show in currency. Show in pips. Show in currency a
FREE

The Supertrend Indicator is a popular technical analysis tool designed to assist traders in identifying market trends. The indicator combines the average true range (ATR) with a multiplier to calculate its value. This value is then added to or subtracted from the asset’s closing price to plot the supertrend line. The Supertrend Indicator can help identify trends, manage risk, and confirm market tendencies. The indicator is limited by its lagging nature, is not very flexible, and can send up fal
FREE

Currency Strength Breakout Indicator
Gain an edge in your trading with the Currency Strength Breakout Indicator , a powerful tool that analyses eight currencies across multiple timeframes (M1, M5, M15, M30, and H1) – all within a single, easy-to-read window. Identify the strongest and weakest currencies and trade pullbacks with precision, leveraging alerts to help you enter trends at the right time. Key Features Real-Time Currency Strength Monitoring : Instantly see which currencies are trendin
FREE
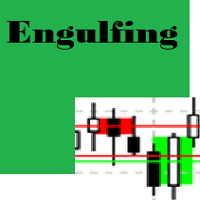
Engulfing Candle Detector
Detectable pattern Double Candlestick Patterns Bullish Engulfing
The first candle is black candle. The second candle opens with a gap below the real body of the black candle but rallies upwards to close above the real body of the black candle. In other words, the second candle's real body completely engulfs the first candle's real body Bearish Engulfing
The first candle is white candle. The second candle opens with a gap above the real body of the white candle but dec
FREE

Necessary for traders: tools and indicators Waves automatically calculate indicators, channel trend trading Perfect trend-wave automatic calculation channel calculation , MT4 Perfect trend-wave automatic calculation channel calculation , MT5 Local Trading copying Easy And Fast Copy , MT4 Easy And Fast Copy , MT5 Local Trading copying For DEMO Easy And Fast Copy , MT4 DEMO Easy And Fast Copy , MT5 DEMO "Cooperative QQ:556024" "Cooperation wechat:556024" "Cooperative email:556024@qq.com" Strong
FREE

Unlock Smarter Trading with Trend-Sensing Pro Are you tired of confusing charts and late signals? Trend-Sensing Pro is a powerful yet simple indicator designed to help you see market trends with crystal clarity. It combines the smoothness of an EMA (Exponential Moving Average) with a unique candle visualization, giving you a clean, noise-free view of the market's direction. Why You'll Love Trend-Sensing Pro See the True Trend : Trend-Sensing Pro cuts through market noise, making it easy to ident
FREE
Like most things that work in trading, it's really simple. However, it's one of the most powerful tools I have that makes entries of many systems much more precise.
In its essence, it measures the recent volatility against the medium-term average. How does it work? Markets tend to be prone to strong trending movements when relative volatility is low and tend to be mean-reverting when relative volatility is high.
It can be used with both mean-reversion systems (like the Golden Pickaxe) and mo
FREE

This outside bar indicator is the opposite of the inside bar. So what this MT4 outside bar indicator does is identifies outside bars for you as they form on your charts. Outside bar is a famous trading pattern in which the bar carry higher high and lower low compared with the previous bar, also known as mother bar. To trade based on Outside Bars, simply place buy stop order above the high price level of a bullish Outside Bar, and sell stop order should be placed below the low price level of a be
FREE
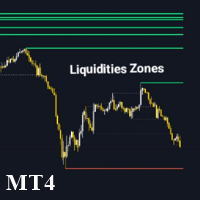
The Liquidity Zone Detector is an advanced technical indicator designed to identify and highlight key liquidity zones in the market using the ZigZag indicator. This tool pinpoints price levels where significant liquidity is likely present by drawing trendlines at the highs and lows detected by the ZigZag. The Liquidity Zone Detector assists traders in spotting potential reversal or trend continuation areas based on liquidity accumulation or release. Key Features: Automatic Liquidity Zone Identif
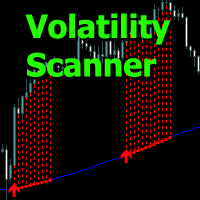
Volatility Scanner - the indicator analyzes the market condition and shows the zones of increasing volatility with histogram lines.
The indicator allows you to determine the moments for entering and holding positions, working in the trend direction or when to wait out the time without trading.
Input parameters allow you to independently configure the indicator for the desired trading instrument or time frame.
Any time frames for use from minute to daily.
There are several types of alerts.
All in

THE PRICE ACTION INDICATOR! This program finds candlestick absorption patterns and a false breakdown, after which it draws the entry points with arrows.
Input parameters:
1. PPR_Arrow The On parameter/Off display of the absorption model arrows. By default, it is set to true.
2. FB_Arrow Everything is the same as the first parameter, only for false breakdown models. By default, it is set to true.
Sincerely, Novak Production.
FREE
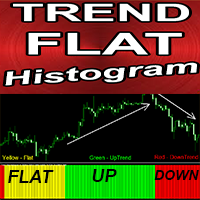
Crypto_Forex Indicator "Trend Flat Histogram" for MT4, No Repaint.
- Trend Flat Histogram indicator is very sensitive and much more efficient than any standard Moving Averages. - It is designed to show current market conditions: Flat, Uptrend, Downtrend. - Indicator has 3 colors: Yellow for Flat market conditions, Red for downtrend and Green for uptrend (colors can be changed in settings). - With Mobile and PC alerts. - It is great to combine this indicator with any other trading methods: Pri

After purchasing the Tpx Dash Supply Demand indicator, you must download this indicator which will link and feed market data to the Tpx Dash Supply Demand indicator and will provide all Supply Demand price signals, ATR Stop, VAH and VAL, trend values with the ADX, and POC prices and locations in the market. Just download it and Dash will locate the indicator to retrieve the information!
FREE
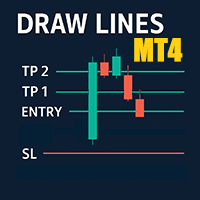
Easily draw Entry, Take Profit, and Stop Loss levels on your chart to analyse and follow trading signals. Key Features Easily input Entry, TP1, TP2, TP3 and SL values Optional vertical line to mark the exact time of the signal Custom labels and colours for each line Visually assess the accuracy and risk/reward of any signal Works with all symbols and all timeframes No repainting, no lag, just clear and stable lines Use Cases Visualise signals from Telegram, WhatsApp, or other channels A
FREE

Time Session OPEN-HIGH-LOW-CLOSE This Indicator Will Draw Lines Of OHLC Levels Of Time Session Defined By User. It Will Plot Floating Lines On Current Day Chart. Time Session Can Of Current Day Or Previous Day. You Can Plot Multiple Session Lines By Giving Unique ID To Each Session. It Can Even Show Historical Levels Of Time Session Selected By User On Chart To Do Backdating Test. You Can Write Text To Describe The Lines.
FREE

Introduction This indicator detects volume spread patterns for buy and sell opportunity. The patterns include demand and supply patterns. You might use each pattern for trading. However, these patterns are best used to detect the demand zone (=accumulation area) and supply zone (=distribution area). Demand pattern indicates generally potential buying opportunity. Supply pattern indicates generally potential selling opportunity. These are the underlying patterns rather than direct price action. T
FREE

This indicator calculates the volume profile and places labels that correspond to the VAH, VAL and POC levels, for each candle individually.
Indicator operation features The indicator works on the timeframes from M5 to MN, but it uses the history data of smaller periods: M1 - for periods from M5 to H1, M5 - for the H4 period, M30 - for the D1 period, H4 - for the W1 period, D1 - for the MN period. The color and location of the VAL, VAH and POC labels on the current candle are considered to be c
FREE
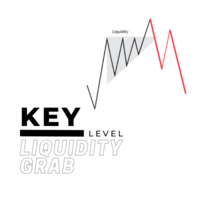
For a bullish move to occur for example, there should be alot of buying power. but you cannot buy if there is no sell on the other side, so the big players usually tend to manipulate the market in order to create available positions on the other side and be able to open their positions and one of the ways is by creating a fake breakout/ a liquidity grab. Before majority of big reversal moves and trends are formed, a liquidty grab would have occured in order to have enough orders to push for the

Scalping monster - ready trading system in the form of an indicator. Scalping monster is designed for the Metatrader4 platform. When placed on a forex chart, the indicator automatically analyzes the market using an adaptation algorithm and displays the signals to the trader in the form of red and blue dots. The indicator also shows in the upper right corner information about potential profit / loss.
Our other products at https://www.mql5.com/en/users/master-mql4/seller
How to trade using S
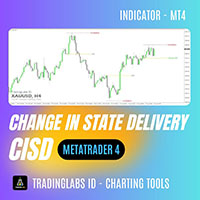
CISD (Change In State Delivery) Indicator TradingLabs ID – ICT Concept Tool The Change In State Delivery (CISD) Indicator is designed based on the ICT (Inner Circle Trader) concept, where price transitions from one delivery state to another often signal high-probability trade opportunities. This tool automatically detects and marks CISD levels on your MT4 charts, helping traders identify potential breakout and retest zones with great accuracy. It is especially useful for traders applying Smart
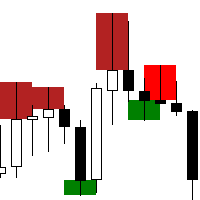
The "Rejection Block" MetaTrader 4 Indicator is a powerful tool designed to assist traders in identifying and visualizing rejection candlestick patterns, commonly referred to as rejection blocks. These patterns play a crucial role in market analysis as they often signify potential reversals or continuations in price movements. Key Features: Rejection Block Detection: The indicator meticulously scans price data to identify instances of rejection candlestick patterns. These patterns typically feat
FREE
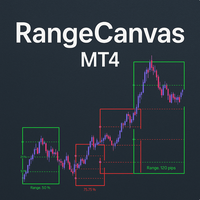
Daily Range Boxes : The indicator draws rectangular boxes around each day's high and low prices, creating a clear visual boundary for the daily trading range. Color-Coded Logic : Green boxes when the current price (or close) is above the daily open Red boxes when the current price is below the daily open Percentage Level Lines : Inside each box, it draws three horizontal lines at: 25% of the daily range 50% of the daily range (midpoint) 75% of the daily range Range Information : Each box displa
FREE

This indicator effectively separates the tick volume in the forex market into bullish and bearish categories. Additionally, it provides the functionality to calculate and display the sum of bullish and bearish tick volumes for any selected period of your choice. You can easily adjust the period by moving the two blue lines on the chart, allowing for customizable and precise volume analysis tailored to your trading needs. If you find it usefull your reviews will be appreciated! Happy trading!
FREE

Product Title Smart Fractals (MT4) – part of the SmartView series Short Description A Fractals indicator with a unique user experience on MetaTrader platform. Features advanced capabilities not previously available, such as opening settings with double-click, hiding and showing indicators without deleting them, and displaying indicator windows at full chart size. Designed to work seamlessly with the rest of the SmartView Indicators series. Overview The SmartView series offers a unique and distin
FREE

Automatically plots Fibo levels, based on the High & Low prices from the specified time frame Multiple bars may be united: e.g. you can get a Fibo based on the 10-days Highs and Lows My #1 Utility : 65+ features, including this indicator | Contact me for any questions | MT5 version Helps to see potential reversal levels; Patterns formed at the Fibo levels tend to be stronger; Significantly reduces the time spent on manual plotting ; Settings: Timeframe to calculate the base High & Low p
Magic Supply Demand Indicator works on all products and timeframes. It is a new formula, and the very new features are two zone strength functions adjustable by user input! This is a great advantage in trading. When you learn how to use the proprietary features such as the zone strength with min X-factor of price travel away, you will be able to tell whether the zone is strong or not.
The supply and demand zones are used as an alert trigger. You can use popup alert with sound on MetaTra
FREE
The MetaTrader Market offers a convenient and secure venue to buy applications for the MetaTrader platform. Download free demo versions of Expert Advisors and indicators right from your terminal for testing in the Strategy Tester.
Test applications in different modes to monitor the performance and make a payment for the product you want using the MQL5.community Payment System.
You are missing trading opportunities:
- Free trading apps
- Over 8,000 signals for copying
- Economic news for exploring financial markets
Registration
Log in
If you do not have an account, please register
Allow the use of cookies to log in to the MQL5.com website.
Please enable the necessary setting in your browser, otherwise you will not be able to log in.