Weis Wave Double Side
- Indicators
- Version: 1.3
- Updated: 27 May 2024
- Activations: 5

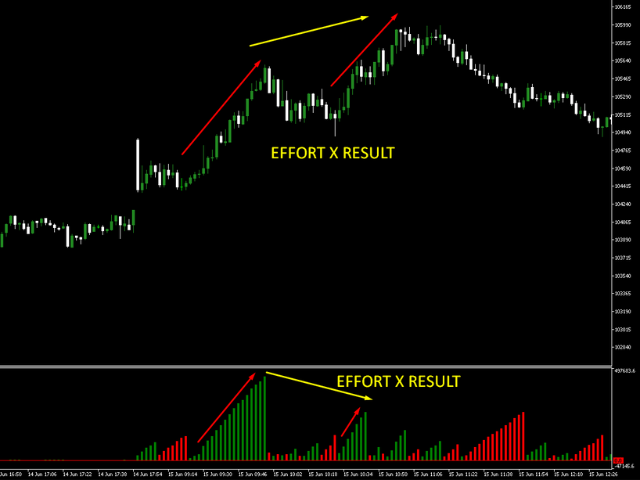
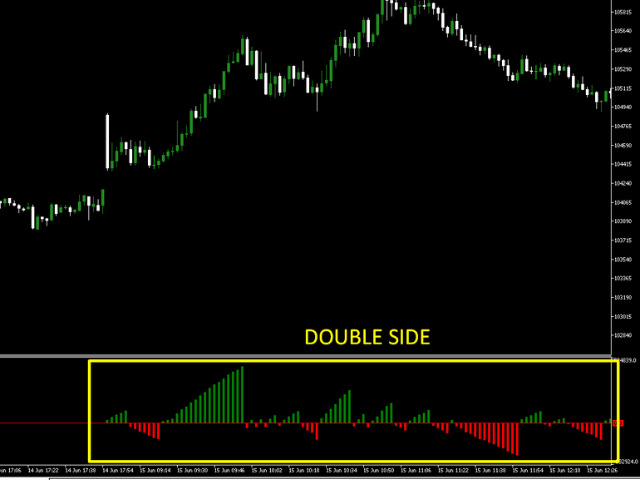
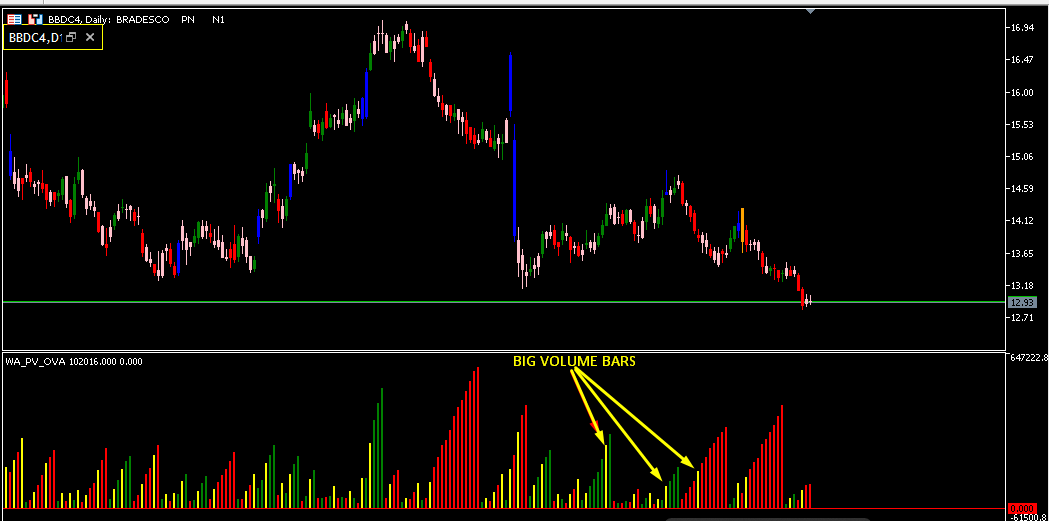
The Weis Wave Bouble Side Indicator for MT5 is part of the toolkit (Wyckoff Academy Wave Market) The Weis Wave Bouble side Indicator for MT5 was created based on the already established Weis Wave created by David Weis. The Weis Wave Double Side indicator reads the market in waves as it was done by R. Wyckoff in 1900. It helps in the identification of effort x result, cause and effect, and Supply and demand Its differential is that it can be used below the zero axis, further improving plus operator reading indicator created based on the theory of R. Wyckoff see the images how the indicator is read.