Weis Wave Double Side
- Indicatori
- Versione: 1.3
- Aggiornato: 27 maggio 2024
- Attivazioni: 5

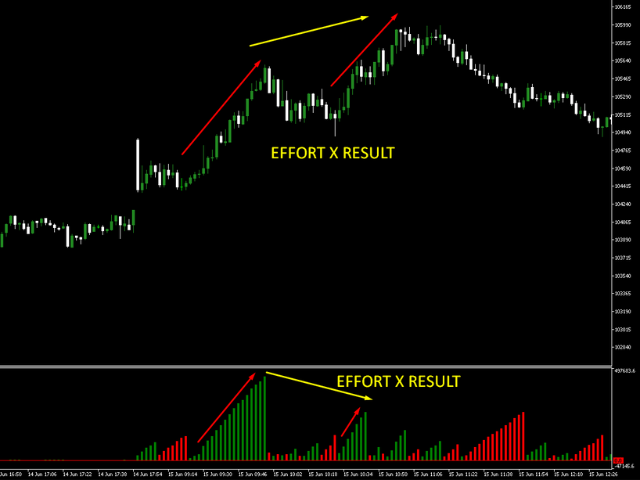
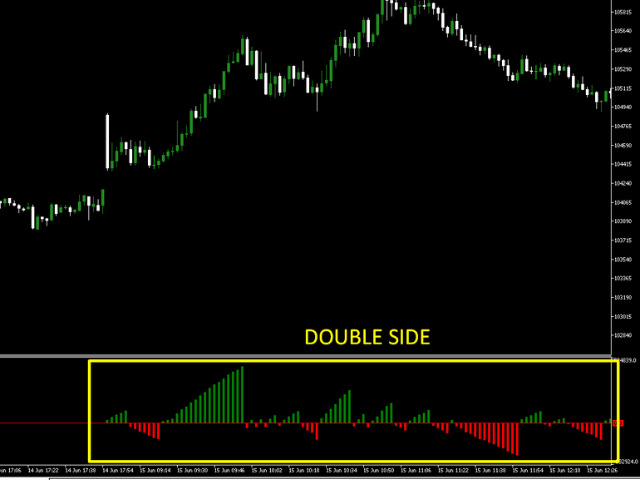
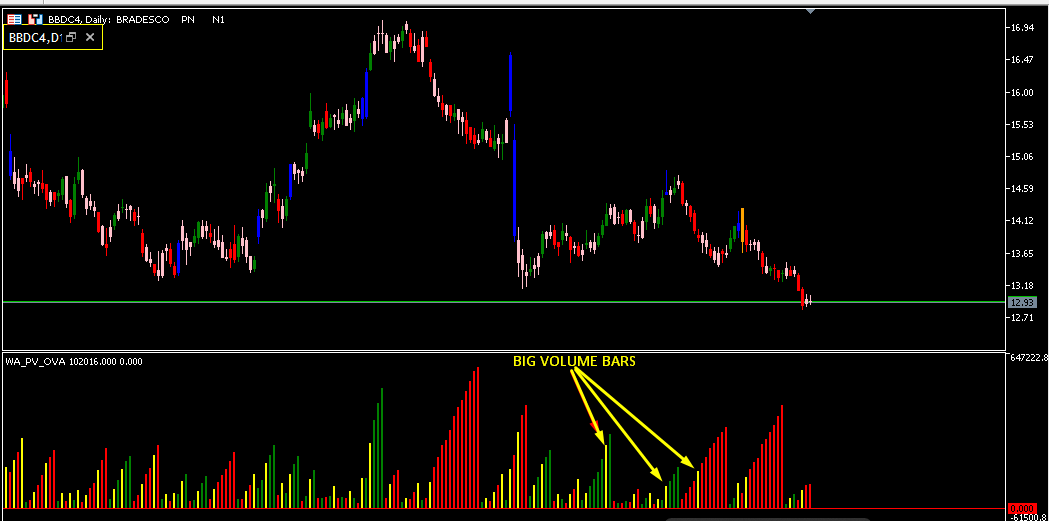
L'indicatore laterale Weis Wave Bouble per MT5 fa parte del toolkit (Wyckoff Academy Wave Market) L'indicatore laterale Weis Wave Bouble per MT5 è stato creato sulla base della già consolidata Weis Wave creata da David Weis. L'indicatore Weis Wave Double Side legge il mercato a ondate come è stato fatto da R. Wyckoff nel 1900. Aiuta a identificare sforzo x risultato, causa ed effetto e domanda e offerta Il suo differenziale è che può essere utilizzato sotto l'asse zero, migliorando ulteriormente più lettura dell'operatore indicatore creato sulla base della teoria di R. Wyckoff guarda le immagini come viene letto l'indicatore.