Supply and Demand Dashboard PRO MT5
- Indicators
-
Bernhard Schweigert
 ⚜️ Elevate Your Trading Success with innovative Solutions ⚜️
Trading without the right tools is like navigating without a map. - Version: 6.1
- Activations: 5
Supply and Demand DASHBOARD PRO for MT5
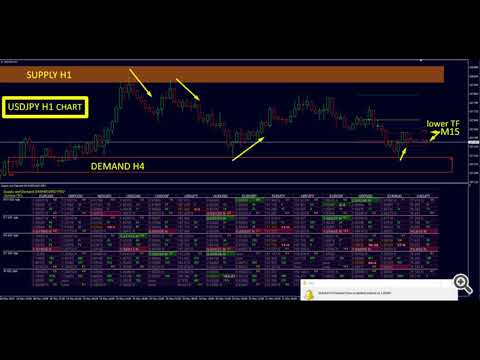
is a multi-symbol, multi-timeframe dashboard showing filtered Supply & Demand zones, zone strength ratings, pip distances, nested-zone highlighting, and 4 alert types across up to 9 timeframes. Based on our Advanced Supply Demand indicator (358 reviews).It provides a complete overview of Supply and Demand zones across up to 9 timeframes and number of symbols in your Market Watch.
User Manual for a complete walkthrough: https://www.mql5.com/en/blogs/post/725584
What the dashboard shows:
-
Filtered Supply and Demand values including zone strength rating
-
Pip distances to zones and within zones
-
Nested zones highlighted across timeframes
-
New versus tested zones marked with "N"
-
4 alert types for all selected symbols and timeframes
-
Full customization through an extensive input panel
Why supply and demand matters:
The most important questions for every trader are addressed directly:
-
Where are the best levels to enter the market? Enter your trade within or near a strong supply/demand zone for the best chance of success.
-
Where is the best place for my stop loss? Place your stop below/above a strong supply/demand zone to be safest.
-
What is my best profit target? Use the next supply zone as a target for buys, the next demand zone for sells.
The greater the imbalance between buyers and sellers, the greater the move in price. The highest-probability price levels are those with the greatest imbalance.
Alerts:
-
A new zone appeared
-
Price entered a zone
-
Price left the zone
-
The zone is broken
All alert types can be filtered to nested zones only. You can select which timeframes trigger alerts and exclude individual symbols.
Visual features on the dashboard:
-
Supply and demand prices (from top to bottom: supply upper / supply lower / demand upper / demand lower)
-
Pip distances until supply and demand (green if price is far from the zone)
-
Pip distances within supply and demand (pink and bold if price has entered the zone — pips to outer price / pips to inner price)
-
Zone strength rating (yellow number when a minimum strength is reached)
-
"N" is added to the price if the zone is still untested or new
-
Nested zones: background is highlighted when a zone is nested within a higher-timeframe zone
-
Nested AND new: prices shown in bold
Visual features on the chart:
-
Drag the sub-window of the dashboard down with the mouse to see the actual chart
-
Click on symbol names to change the symbol
-
All timeframes shown in the dashboard are drawn on the chart
-
Lower timeframes than the chart appear as dashed squares
-
The actual timeframe of the chart appears as full squares
-
Higher timeframes than the chart appear as empty squares
-
The higher the timeframe, the further to the right the squares end
-
Color coding shows if a zone is new or tested
-
Prices can be shown on the chart or hidden
Input parameters:
Dashboard settings:
-
Symbol names must include suffix! — Comma-separated symbol list (0 = current chart)
-
Dashboard mode vertical or horizontal — Layout orientation
-
Show S/D strength rating — Enable the rating column
-
Minimum S/D strength rating to draw — Hide zones below this threshold
-
Price entered S/D mode — Show pips to inner line, outer line, or both
TF settings:
-
Show M1 / M5 / M15 / M30 / H1 / H4 / D1 / W / MN — Enable or disable individual timeframes
Supply Demand settings:
-
Min candles before a zone is printed — Minimum bar count before detection
-
Min X-factor of price travel away (ATR) — Minimum displacement from the zone
-
Min Y-factor of price travel away (zone size) — Minimum drop relative to zone size
-
Limited size of a big zone. Max factor (ATR) — Cap the zone thickness
Candle pattern:
-
Use reversal candle color bar 1 — Require a reversal candle at bar 1
-
Use reversal candle color bar 2 — Require a reversal candle at bar 2
-
Use true engulfing pattern — Require a strict engulfing formation
Specials:
-
Include wick 1 for zone size — Extend zone to the wick of bar 1
Alert settings:
-
Alert zone hit — Alert when price enters a zone
-
Alert zone break — Alert when price breaks a zone
-
Alert reverse candle from zone — Alert on a rejection candle
-
Alert new zone appears — Alert when a new zone is detected
-
Alert only NESTED zones! — Suppress non-nested alerts
-
Alert only new zones (excluding breaks) — Suppress break alerts
-
Alerts for M1 through MN — Per-timeframe alert toggles
-
Comma-separated pair exclude list (no alert) — Mute specific symbols
-
Last Signal time is Local or broker time — Timestamp source
General Alert Settings:
-
Popup Alerts — On-screen alerts
-
Send email alerts — Email notifications
-
Send push alerts — Mobile push notifications
-
Traders preference alerts buy-sell-both — Restrict alerts by trade direction
On Chart Settings:
-
Show outer price labels — Price labels at outer edge
-
Outer price labels min timeframe — Minimum timeframe for outer labels
-
Show inner price labels — Price labels at inner edge
-
Inner price labels min timeframe — Minimum timeframe for inner labels
-
Show yesterday's high/low — Draw previous day extremes
-
Show todays pivot — Draw the daily pivot
-
Rectangles extended over next timeframe in bars — How far zones are drawn to the right
-
Display all HTF names left — Show timeframe names on the left
-
Display all TF names right — Show timeframe names on the right
Color Settings Dash:
-
SD neutral background Color — Base panel color
-
Supply nested background Color — Highlight for nested supply
-
Demand nested background Color — Highlight for nested demand
-
Price within Supply background Color — Highlight when price is inside supply
-
Price within Demand background Color — Highlight when price is inside demand
-
Color pip out of SD — Pip-distance color outside the zone
-
Color pip within SD — Pip-distance color inside the zone
-
TOP background Color — Header panel color
-
Symbols button background Color — Symbol button color
-
Color SD rating strong — Rating highlight color
Color Settings Chart:
-
Color supply all TF — New supply zones
-
Color supply used all TF — Tested supply zones
-
Color demand all TF — New demand zones
-
Color demand used all TF — Tested demand zones
-
Color price labels all TF — Price label color
-
Color yesterday high / low / today open / daily Pivot — Daily level colors
Other Settings 1:
-
Check Bars back — Lookback depth
-
Size price labels (1-5) — Label font size
-
Full rectangles on chart -all TF — Draw all-timeframe zones filled
-
Full Rectangles Current Chart TF — Fill zones on the current timeframe
-
Rectangle Width Current TF (if not full 1-5) — Line width on current TF
-
Rectangle width higher TF (1-5) — Line width on higher TFs
-
Rectangle line style lower-TF — Dash style for lower-TF zones
-
Alert delay seconds after restart — Startup silence window
-
Charts open in new window — Open symbols in a separate window
-
Keep new charts in same window (Target) — Reuse one target chart
-
Chart open in timeframe — Timeframe for opened symbol charts
Other Settings 2:
-
Run support chart for all timeframes! — Enable the hidden helper chart
-
Repeat update quotes per minutes — Quote refresh interval
-
Show prices with less digits (0-2) (0=all digits) — Digit reduction
-
Autofit pixel 4K — Auto scale for high-DPI screens
-
Font spacing X manual (big screen) — Horizontal text spacing
-
Font spacing Y — Vertical text spacing
-
Start Dash pixel X / Y — Dashboard origin position
-
Scroll number of rows list (1-10) — Visible rows before scrolling
-
Label font / Label font 2 — Fonts used in the dashboard
-
Font size of numbers / Font size top — Font sizes
-
Use PIN — Use for EAs.
-
Force objects to subwindow number (0=Auto) — Subwindow override
Important Info:
-
Copyright and bonus. Please ask.
Strategy Tester:
To get the demo working in the strategy tester, a special setup might be required since this is a multi-symbol, multi-timeframe dashboard. You may need to prepare chart data quotes. Send a private message for setup instructions. Alternatively, you can try with Symbollist = 0, or the demo of Advanced Supply Demand, which works in a similar way.
Tips:
-
Read the User Manual for a complete walkthrough: https://www.mql5.com/en/blogs/post/725584
-
If you are new to supply and demand trading, read this blog: https://www.mql5.com/en/blogs/post/720245
-
Check the profile for news, blogs, and trading examples: https://www.mql5.com/en/users/bernardo33
-
Once you have the indicator, request the STARTER-PACK email with more info, links, templates, and other resources.
Important notes:
-
The support chart (one chart opened automatically to update chart history) can be deactivated in the settings.
-
The product is based on Advanced Supply Demand, which is available for both MT4 and MT5: https://www.mql5.com/en/market/product/20582
Best regards,
Bernhard Schweigert