IQ Star Lines MT5

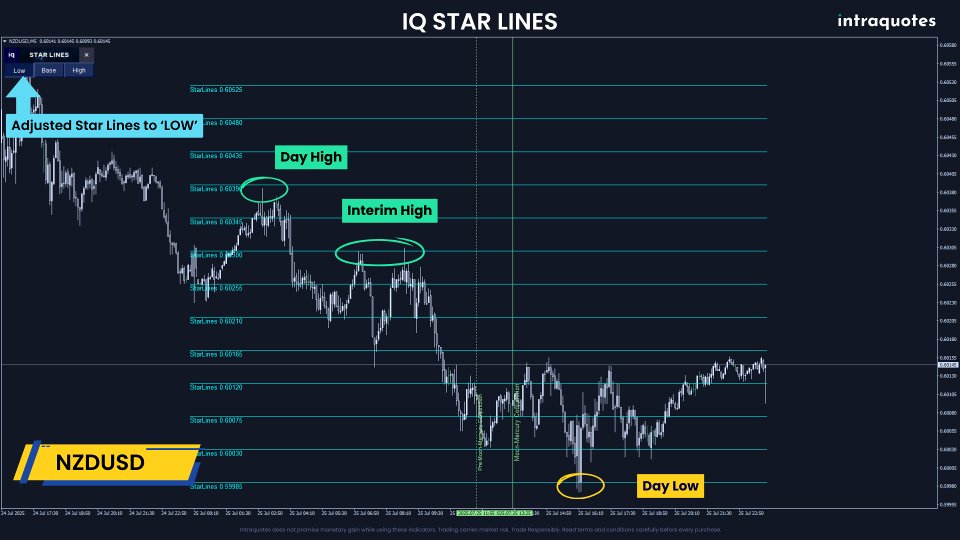
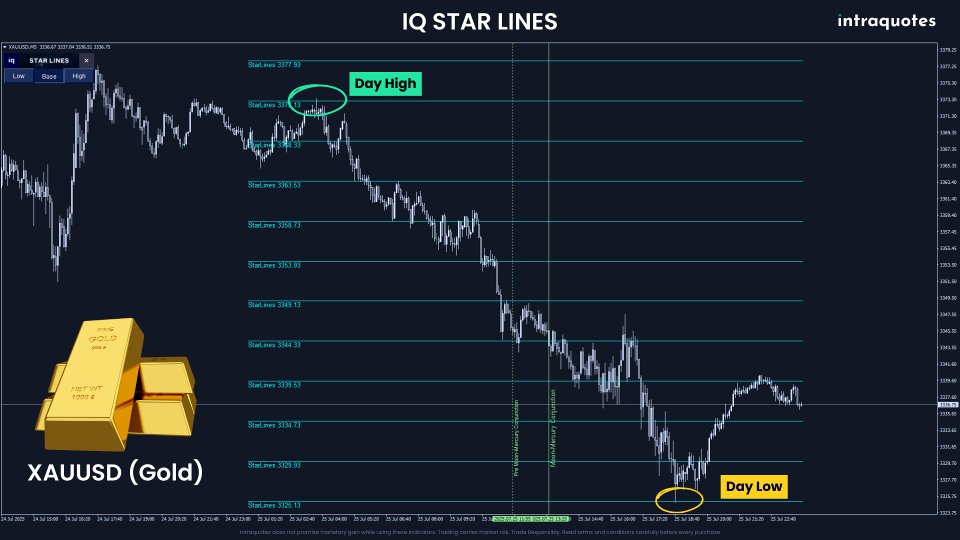
Introducing IQ Star Lines - a unique astrological indicator purely based on Vedic astrology calculations, for the first time on Metatrader. This unique tool plots dynamic planetary grid lines based on real-time stars, constellations, and celestial movements, which allows you to plot the power of the cosmos directly onto your trading charts. This indicator is specifically designed for scalpers and intraday traders. The grid lines get automatically adjusted on your chart, with the moving solar system & the star alignment.

Imagine trading with invisible cosmic energy plotted as visible support and resistance levels on your chart, calculated using precise astronomical formulas, all lines are plotted automatically. Whether you’re scalping or intraday trading, these planetary grid lines adapt based on how the Earth and Moon align with the stars and constellations, revealing powerful trade levels and time zones you never knew existed.

Even though the indicator does extremely complex astronomical and advanced calculations, we have tried to keep the interface extremely simple so that serious and professional traders like you can get only the benefits without having to do any other extra difficult calculations from your side. The indicator automatically aligns the astrological grid lines on the current market chart based on the moon and constellations' positions.

"Millionaires don't use astrology, billionaires do".J.P. Morgan, Legendary American financier and banker

If you are not into this astrological trading dynamo, or you do not believe in astrology (even though it is one of the most powerful scientific studies done to date on this planet), you don’t have to, not right away. By the time you finish reading the manual and complete the backtesting using the demo, you will be convinced that this is something powerful that you didn’t know existed. It will open a whole new dimension of trading for you for the rest of your life. ‘IQ Star Lines’ gives the most accurate trade levels that can be used as astrological support and resistance levels throughout the day. Not only this, but the indicator marks the important trade time for using Lunar aspects for each day specifically. This feature has been added keeping in mind how powerful some aspects can get, which sometimes directly dictates the trend for that day, and we want our traders to take advantage of that. The Aspect alert system is another feature this indicator has to keep you on track with the possible major market movement in advance. 

Check the Indicator User Manual for more details.

Download the Metatrader 4 Version.

Read the product description carefully before purchasing the product. 

Disclaimer:

  • It is highly recommended to backtest this indicator and understand how it works before taking any financial decisions.

  • Due to regulatory restrictions, our service is unavailable in certain countries such as India, Pakistan, and Bangladesh.

  • Our products are available only on mql5.com.

  • We never contact anyone or sell our products privately.

  • We do not provide any personal trading advice.

  • We do not sell any of the Intraquotes products on Telegram or any other platform or website.

1. Why Vedic Astrology?

In astrology, it is a well-established fact that lunar transits have a powerful yet different influence on different human behaviours (greed, fear, confidence, depression, aggression, passion, etc), just like it has an effect on the tides in the water bodies like rivers & oceans. This, in turn, dictates the market sentiment of buying and selling (mainly due to greed & fear) in the financial markets. When stars and planets emit subtle cosmic energies, they interact with human physical and emotional states. Not only that, but also when the lunar transits take place through all the major planets and different nakshatras, it influences global financial markets of various sectors. 

Unlike Western astrology, Vedic astrological calculation is different. Vedic astrological genre involves in-depth micro-metric calculations, and this specific feature makes it highly effective for intraday trading.

One must know that the markets are always driven by several economic factors, many types of forces, and among them, astrology plays a major role. Sometimes, when a study of general economic principles, or even financial tools of technical & fundamental analysis fails to explain certain market dynamics, it can easily be predicted by using astrological calculations. We will share lots of real, live-chart examples to prove them. Stay with us & read it till the end. 

We have fused the ancient science with modern technical analysis (to get the best of both worlds) to create IQ Star Lines - an indicator built by the developer, who has spent almost 2 decades of trading, along with studying & researching the Vedic Financial Astrology. The developer of this indicator have always wanted to build an indicator where the principles of ancient Indian Vedic astrological theories can be applied in the modern market in real time, that would be both easy to use for daily trading and would give an accurate astrological forecast of the market movement where entry exit decisions would take lesser time giving a chance to earn more from the market.

Unlike other astrological indicators on the market that are based on WD Gann techniques, this tool utilises entirely original algorithms designed, tested, and refined across diverse market types and various market conditions, using both live and historical data, for real-world performance spanning multiple years, developed by the creator.

This is the reason why this indicator is not available for all the symbols or all the market sectors. After years of exhaustive study and research on various market types and conditions, utilising different calculations, we achieved a breakthrough in successfully predicting astrological levels for only a few specific symbols, particularly those suitable for scalping & day trading. Our quest was to get to the bottom of it. We are grateful that we have finally built this extraordinary indicator that works accurately on the following selected symbols. Hope you enjoy your trading journey even more now.

2. Supported symbols:

Major Pairs
Minor Pairs Metals Cryptocurrency
EURUSD GBPUSD 
AUDUSD NZDUSD
USDJPY USDCAD 
USDCHF

AUDCAD CADJPY EURGBP GBPJPY
AUDJPY CADCHF EURJPY GBPAUD
AUDCHF CHFJPY EURAUD GBPCAD
AUDNZD NZDCHF EURCAD GBPCHF
NZDJPY EURCHF GBPNZD
NZDCAD EURNZD

XAUUSD (Gold)
XAGUSD (Silver)
BTCUSD (Bitcoin)


3. What are Planetary Aspects?

Planetary aspects are specific angular relationships formed between two or more planets in the universe. In astrology, these angles, such as conjunction (0°), opposition (180°), trine (120°), square (90°), and sextile (60°), indicate how planets interact and influence each other’s energies. Aspects reveal harmony, tension, opportunities, or challenges in life, depending on the planets involved and the nature of the angle. They are key tools that all astrologers use to interpret how planetary forces combine to shape events, decisions, emotions, and outcomes in our daily lives.

Since this indicator is designed mainly for intraday short-term trading, the indicator plots Lunar aspects with different major planets. Indicator automatically plots 4 major planetary aspects mentioned above: Conjunction, Opposition, Trine and Square. Indicator plots Lunar aspects with the Sun, Mars, Venus, Mercury, Jupiter and Saturn. Below, we have given the simplest explanation of what these aspects represent and how they can help in your trading.

4. Aspects Details

  • Conjunction - This represents the combined energy of both the planet and the moon. It generally has the strongest influence over the market.

  • Opposition - Stronger influence over the market.

  • Trine - Strong influence over the market.

  • Square - A Lesser strong influence than the Trine.

5. Impact on the Market with different planetary aspects with the Moon

Jupiter and Saturn are 2 large planets; thus, any major aspect with these planets can create a trend change or sudden spike of volatility on the market during their aspect timing.

Note: Using a 1-minute and 5-minute chart provides more specific and accurate timing for the daily lunar aspect. 

6. Aspect alert

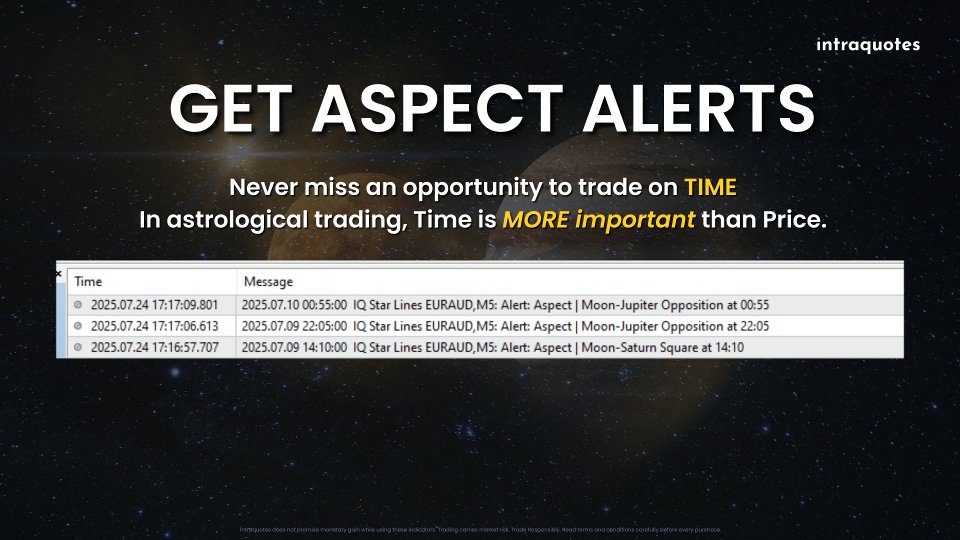
The indicator has an aspect alert system. Get notified when the market reaches an aspect timing. Utilise this feature to plan your trade accordingly, where you can benefit from making better entry and exit decisions in the market. The best option for you will be to set an aspect time alert system on a 1-minute or a 5-minute chart.

7. Why is the IQ Star Lines Indicator Highly Useful for You?

  1. Entering Trades Without Clear Support/Resistance
    This indicator auto-calculates key astro levels, based on actual market structure and plots them in advance. Therefore for you can always plan your self ahead.

  2. Blindly Trusting Indicators That Lag
    Moving averages, RSI, MACD, by the time they confirm, it's already too late.
    Star Lines calculates price levels based on astro time-price relationships, not lagging momentum. That means real levels where price reacts, not guesses after the fact.

  3. Hesitating Out of Fear and Missing the Move
    You saw the setup, but didn’t take the trade. Now it hurts.
    When the levels are clearly mapped and visible, your confidence boosts.
    Star Lines removes hesitation and helps you to gauge the movement better, along with daily planetary aspects.

  4. Overanalysing the Chart and Missing Simplicity
    Too many indicators, signals - mental clutter.
    This tool gives simple, minimal, clean price levels and aspect times - but calculated with complex mathematical trading models with astronomy.
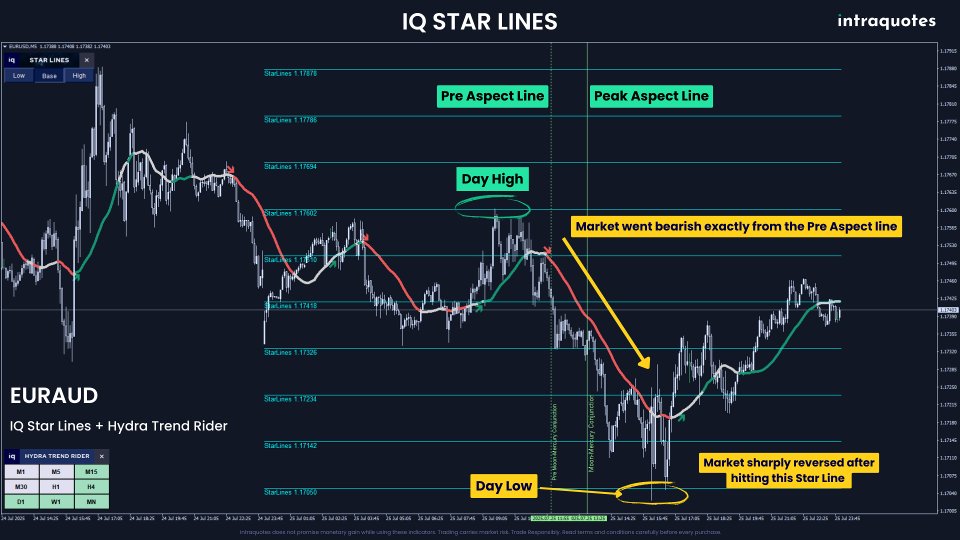
    Power and simplicity, finally combined. Best suited to use with any non-lagging trend indicator like the Hydra Trend rider. A perfect, powerful combination to gauge the trend along with accurate support and resistance levels.

  5. Cutting Profits Too Early Out of Fear
    You get in, price moves your way, but you close early and regret it.
    Star Lines give you precise targets for your take profit. If you trade from one level, you can set an immediate target to the next IQ star line level and continue riding the trend and keep trailing your position.
    Not how the market moves in different conditions, you will always get a Star line for you to trade.

  6. Feeling Like the Market Is Always Against You
    “Why does it always reverse right when I enter?”
    Because it hit an astrological price level you couldn’t see - until now. This is your missing link. Once you use it, you’ll wonder how you ever traded without it.
    Most of the intraday high and low forms sharply around the IQ Star lines. Will highly recommend using the Hydra trend rider along with it for clear visibility of the trend.

8. IQ Star Lines Benefits (In short)

  • Daily Auto-Adapting Grid Levels:
    Use IQ Star Lines as natural intraday support and resistance zones that sync with market volatility. The price levels get auto-adjusted based on the planetary movements and their cosmic influence in the live market. This indicator is crafted mainly for short-term trading (Scalping and day-trading).

  • Sweet Spot Entries and Exits:
    Get precise astrological price levels for profit targets and stop losses while riding a trend to optimise your risk-reward ratio visually. You can use multiple star lines levels for multiple profit targets to manage your risk-reward ratio.

  • Minimalistic Dashboard with 3 Scales & One-click Close Button:
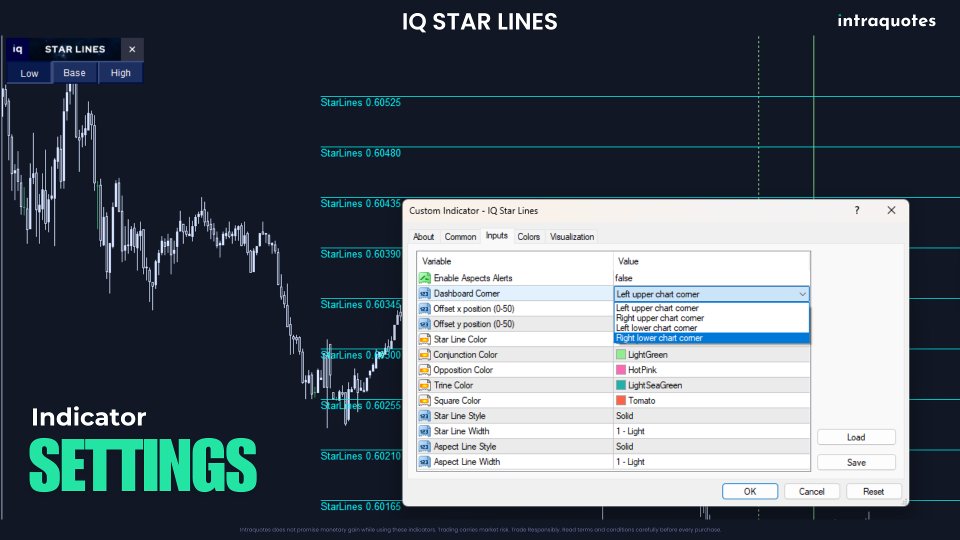
    Clean dashboard interface with easy one-click close, scale adjustments (Default Base, High, Low) as per market volatility, and dashboard positioning (can be placed at any of the 4 corners of the chart) for maximum convenience.

  • Pre and Peak Aspect Time Visualisation:
    Pre-aspect and peak aspect vertical lines are plotted on charts for clear timing cues, where this indicator shows daily Lunar aspects with different major planets and plots the timing on the chart automatically.

  • Aspect Alert:
    The Indicator has an option to set alerts for daily aspects. Stay ahead with automated alerts when key aspect timings approach, so you never miss critical market moves.


9. Who Should Use This Indicator?

  • Intraday Traders
  • Scalpers
  • Breakout, Continuation, and Reversal Traders (Recommended additional Indicator to be used with this: Hydra Trend Rider)


10. Do you need to know the basics of Vedic Astrology to use this?

Not at all, as we have explained everything in the User Manual, which you need to know to utilise this indicator to its best possible way. This indicator can be used by any trader who is a scalper or a day trader.

11. Recommended Timeframes

1-minute, 5-minute chart for precise entry exit decisions, and highest accuracy in aspect timings.

12.  How Does IQ Star Lines Work? (Quick Explanation)

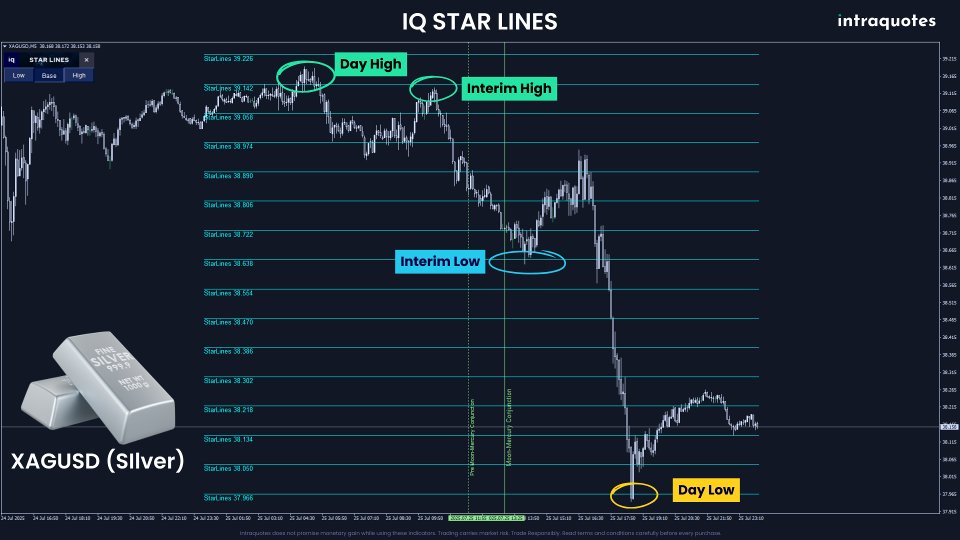
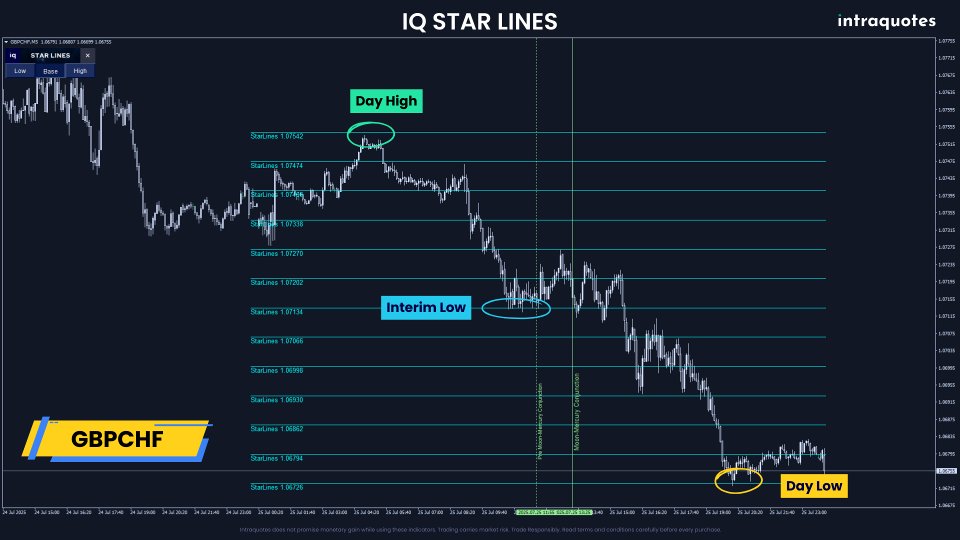
Indicator plots Star lines, which look like grid lines. These lines are the levels where the market reacts frequently, sometimes very sharply. Most of the intraday highs and lows get created around these levels. Star lines get adjusted with the market movement and planetary movement. There are two usable components.

  • Price levels: These Star Lines can be used as support and resistance levels. It can even be used for profit target and setting your stop losses.

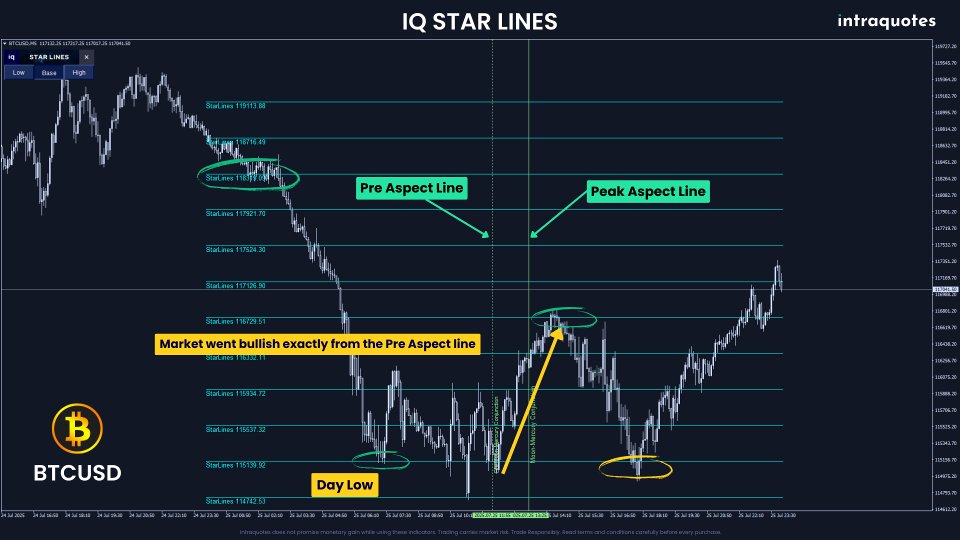
  • Aspect Time: It indicates aspect times, which are the major astrological timings where the market shows probable trend change or a sudden spike in the volatility. When stronger aspects with larger planets occur, higher is the chance for a breakout or trend reversal. So it is highly recommended to trade during these astrological aspect timings.

Aspect Timelines are again subdivided into two more parts:.

    1. Pre Aspect Time Line: This is represented by dotted vertical lines; this is the start of the significant astrological aspect time. The market sometimes starts reacting from this specific time itself.
    2. Peak Aspect Time Line: This is the peak astrological timing of that specific aspect. In some cases, after this time, the market either changes its intraday trend or a range market becomes volatile or active. Both come with better trading opportunities.

Note: When the Moon aspects giant planets like Jupiter or Saturn, markets often witness trend changes or sudden spikes in volatility - perfect for scalping or entering new intraday trades.

It is highly recommended to see the backtest results to fully understand how it has worked practically on the past markets.


13. Scaling Options

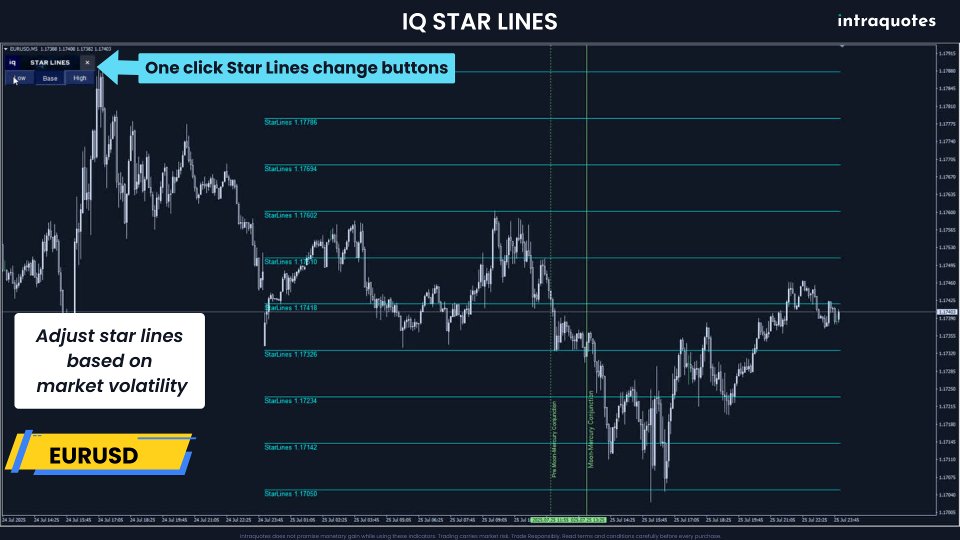
The indicator dashboard gives you an option to adjust the Star Lines based on your preference and the market conditions.

  • Base (Default option) - This is the base scale, which plots Star Lines based on their current market conditions. Most of the time, the base scale works the best.

  • High - You can use this scale to adjust the Star Lines if the market moves beyond the Base Scale Star Lines (in case of extreme volatile conditions, like a news release).

  • Low - During a range or low-volatile market, use this scale to adjust.


14. Can I use another indicator with IQ Star Lines?

Yes, absolutely! It is recommended to use any trend indicator (like the Hydra Trend Rider) with IQ Star Lines to get an understanding of the trend before entering into any trade. Check the indicator manual for more details.


15. Compatible Trading Styles

  1. Trend following
  2. Breakout
  3. Continuation
  4. Trend reversal


16. Indicator Customisation - Input Settings 

  • Change the Star Lines and aspect lines (including all the aspect types separately: Conjunction, Opposition, Trine & Square) colour to match your dark or light theme.
  • Enable/Disable aspect alerts as needed. Every time the current Metatrader time aligns with the Astrological Aspect Time, an alert will be triggered.
  • Instantly adjust Star Line scales based on market conditions for fine-tuned levels. Scaling functionality is explained earlier under the topic ‘Scaling Options’.

Note: The Indicator does not have buffer output for EA integration.

17. FAQ

Q: Is there any trial option available?
A: Yes! You can download the demo and backtest.

18. Indicator Troubleshooting

Check the user manual.

19. How to Get Started with IQ Star Lines?

  1. After purchasing, open MetaTrader Software, log in to your account, and open Toolbox - Market - Purchased.
  2. Install the indicator.
  3. Open Navigator - Market - Drag & drop the indicator to the chart.

20. Learn More at Intraquotes MQL5 Channel

If you want to learn more about how this indicator works and how you can take profitable trades, subscribe to our Intraquotes official MQL5 channel. We post daily market analysis using this indicator to train our traders how to study the chart with this indicator, where to set targets, and how to take profitable trades. We help you build confidence with daily market analysis using this indicator so that you can trade confidently.

21. Conclusion
IQ Star Lines empowers you to align your trades with universal cosmic cycles, revealing opportunities that traditional technical analysis alone may sometimes fail to detect. Experience a fusion of ancient astrological science and modern technical analysis – turn your charts into a celestial map for profitable decisions.


Support & Updates:

  • For indicator-related assistance, send us a direct message on MQL5.
  • Follow our channel for daily live market updates and insights.
  • If you encounter any technical issues with the indicator, contact us directly on MQL5.


    Risk Disclosure:

    Trading financial markets carries inherent risks and may not be suitable for every investor. This indicator is designed as a tool to assist in trading decisions but does not guarantee profits or prevent losses, which could exceed your initial investment. Past performance is not a reliable indicator of future outcomes. Users are encouraged to fully understand the risks and seek independent financial advice if needed. Any trading decisions made using this indicator are at the user's discretion and responsibility.

    Related topics: Financial astrology, gold, XAUUSD, silver, XAGUSD, forex, WD Gann, Astrological analysis, forex major, forex minor, Vedic, cryptocurrency, trade levels, planetary lines, market trend, scalping, intraday trading, intraday support and resistance levels.

    Recommended products
    Trade smarter, not harder: Empower your trading with Harmonacci Patterns This is arguably the most complete harmonic price formation auto-recognition indicator you can find for the MetaTrader Platform. It detects 19 different patterns, takes fibonacci projections as seriously as you do, displays the Potential Reversal Zone (PRZ) and finds suitable stop-loss and take-profit levels. [ Installation Guide | Update Guide | Troubleshooting | FAQ | All Products ] It detects 19 different harmonic pri
    ATrend
    Zaha Feiz
    4.8 (15)
    ATREND: How It Works and How to Use It How It Works The " ATREND " indicator for the MT5 platform is designed to provide traders with robust buy and sell signals by utilizing a combination of technical analysis methodologies. This indicator primarily leverages the Average True Range (ATR) for volatility measurement, alongside trend detection algorithms to identify potential market movements. Leave a massage after purchase and receive a special bonus gift. Key Features: ⦁ Dynamic Trend Detect
    Double HMA MTF for MT5
    Pavel Zamoshnikov
    4 (4)
    This is an advanced multi-timeframe version of the popular Hull Moving Average (HMA) Features Two lines of the Hull indicator of different timeframes on the same chart. The HMA line of the higher timeframe defines the trend, and the HMA line of the current timeframe defines the short-term price movements. A graphical panel with HMA indicator data from all timeframes at the same time . If the HMA switched its direction on any timeframe, the panel displays a question or exclamation mark with a tex
    Inventory Retracement Trade it is designed based on one of the most popular tradingview indicator.  This is mostly combined with other popurlar trend indicator to confirm the strength of the movement. Definition Inventory Retracement Trade is quickly becoming one of the most popular ways to identify where short-term counter trend institutional inventory has subsided and when it’s time to re-enter into a trade’s original trend direction.
    KT Renko Patterns MT5
    KEENBASE SOFTWARE SOLUTIONS
    KT Renko Patterns scans the Renko chart brick by brick to find some famous chart patterns that are frequently used by traders across the various financial markets. Compared to the time-based charts, patterns based trading is easier and more evident on Renko charts due to their uncluttered appearance. KT Renko Patterns features multiple Renko patterns, and many of these patterns are extensively explained in the book titled Profitable Trading with Renko Charts by Prashant Shah. A 100% automated
    Overview The Market Perspective Structure Indicator is a comprehensive MetaTrader indicator designed to provide traders with a detailed analysis of market structure across multiple timeframes. It identifies and visualizes key price action elements, including swing highs and lows, Break of Structure (BOS), Change of Character (CHOCH), internal structures, equal highs/lows, premium/discount levels, previous levels from higher timeframes, and trading session zones. With extensive customization opt
    Atomic Analyst MT5
    Issam Kassas
    4.14 (21)
    First of all Its worth emphasizing here that this Trading Indicator is   Non-Repainting   , Non Redrawing and Non Lagging Indicator   Indicator, Which makes it ideal from both manual and robot trading.  User manual: settings, inputs and strategy . The Atomic Analyst  is a PA Price Action Indicator that uses Strength and Momentum of the price to find a better edge in the market. Equipped with Advanced filters which help remove noises and false signals, and Increase Trading Potential. Using Multi
    SolarTrade Suite Financial Indicator: Jupiter Market Indicator - Your Reliable Guide in the World of Financial Markets! This is a trend indicator that uses special innovative and advanced algorithms to calculate its value, and also has an eye-pleasing design. It is very easy to understand the readings of this indicator: blue color - buy, red - sell. Check out our other products from the SolarTrade Suite series at the bottom of the description. Do you want to confidently navigate the world o
    Cumulative delta indicator As most traders believe, the price moves under the pressure of market buying or selling. When someone redeems an offer standing in the cup, the deal is a "buy". If someone pours into the bid standing in the cup - the deal goes with the direction of "sale". The delta is the difference between purchases and sales. A cumulative delta - the difference between the cumulative sum of purchases and sales for a certain period of time. It allows you to see who is currently contr
    The RSI Divergence + FVG Signal indicator combines Relative Strength Index (RSI) Divergence with Fair Value Gap (FVG) detection to generate high-probability buy and sell signals based on both momentum shifts and institutional imbalance zones. Core Features: RSI Divergence Detection : Identifies both regular and hidden bullish/bearish divergences between price and RSI. Divergences indicate potential trend reversals or continuation. FVG Zone Recognition : Detects Fair Value Gaps (imbalances caused
    STRICTLY FOR BOOM INDEX ONLY!!!!! Here I bring the Maximum Trend Arrows OT1.0 MT5 indicator. This indicator is made up of a combination of different trend indicators for entries and exits, for entries an orange arrow will paint on the chart below the current market and a red flag for closing of trades and it produces buy arrows only. When the orange arrow appears, it will appear along with it's sound to notify you. The 1H timeframe is recommended, don't use it anywhere else than on the 1H timefr
    Terra Infinity is a flat indicator. This improved version of the CalcFlat indicator has three additional lines that significantly increase its effectiveness. Unlike its predecessor with two static levels, Terra Infinity adds three dynamic lines above the main histogram, which are interpreted as follows: base signal line, minimum signal line, maximum signal line. These lines are formed using the additional parameter Avg, which is the average value of the histogram. Averaging produces a line cl
    PZ Support Resistance MT5
    PZ TRADING SLU
    3.71 (7)
    Unlock key market insights with automated support and resistance lines Tired of plotting support and resistance lines? This is a multi-timeframe indicator that detects and plots supports and resistance lines in the chart with the same precision as a human eye would. As price levels are tested over time and its importance increases, the lines become thicker and darker, making price leves easy to glance and evaluate. [ Installation Guide | Update Guide | Troubleshooting | FAQ | All Products ] Boos
    TrendDetect
    Pavel Gotkevitch
    The Trend Detect indicator combines the features of both trend indicators and oscillators. This indicator is a convenient tool for detecting short-term market cycles and identifying overbought and oversold levels. A long position can be opened when the indicator starts leaving the oversold area and breaks the zero level from below. A short position can be opened when the indicator starts leaving the overbought area and breaks the zero level from above. An opposite signal of the indicator can b
    Overview Harmonic Patterns MT5 is a technical analysis indicator designed for the MetaTrader 5 platform. It identifies and displays harmonic price patterns, such as Butterfly, Cypher, Crab, Bat, Shark, and Gartley, in both bullish and bearish directions. The indicator calculates key price levels, including entry, stop loss, and three take-profit levels, to assist traders in analyzing market movements. Visual elements and customizable alerts enhance usability on the chart. Features Detects six ha
    Owl Smart Levels MT5
    Sergey Ermolov
    3.93 (30)
    MT4 version  |   FAQ The Owl Smart Levels Indicator is a complete trading system within the one indicator that includes such popular market analysis tools as Bill Williams' advanced fractals , Valable ZigZag which builds the correct wave structure of the market, and Fibonacci levels which mark the exact levels of entry into the market and places to take profits. Detailed description of the strategy Instructions for working with the indicator Advisor-assistant in trading Owl Helper Private User
    ACB Breakout Arrows MT5
    KEENBASE SOFTWARE SOLUTIONS
    5 (1)
    The ACB Breakout Arrows indicator provides a crucial entry signal in the market by detecting a special breakout pattern. The indicator constantly scans the chart for a settling momentum in one direction and provide the accurate entry signal right before the major move. Get multi-symbol and multi-timeframe scanner from here - Scanner for ACB Breakout Arrows MT 5 Key features Stoploss   and Take Profit levels are provided by the indicator. Comes with a MTF Scanner dashboard which tracks the brea
    This is Gekko's Cutomized Relative Strength Index (RSI), a customized version of the famous RSI indicator. Use the regular RSI and take advantage two entry signals calculations and different ways of being alerted whenever there is potential entry or exit point. Inputs Period: Period for the RSI calculation; How will the indicator calculate entry (swing) signals: 1- Produces Exit Signals for Swings based on RSI entering and leaving Upper and Lower Levels Zones; 2- Produces Entry/Exit Signals for
    PREngulfing
    Slobodan Manovski
    PR EA - Engulfing Pattern Trading System Automated Engulfing Pattern Detection with MA Confirmation The PR EA is a Meta Trader 5 expert advisor that identifies and trades bullish/bearish engulfing candlestick patterns when confirmed by a moving average filter. Designed for swing trading on 30-minute charts with compatibility for M15 and H1 time frames. Key Features: Pattern Recognition - Detects valid bullish/bearish engulfing candle formations Trend Confirmation - 238-period SMA filter
    Automated Trendlines MT5
    Georgios Kalomoiropoulos
    Trendlines  are the most essential tool of technical analysis in forex trading.  Unfortunately, most  traders don’t draw them correctly. Automated Trendlines indicator is a professional tool for serious traders that help you visualize the trending movement of the markets . AMAZING OFFER --> Activations from 5 to 20 for "MTF Supply Demand Zones" and "Automated Trendlines" There are two types of Trendlines Bullish Trendlines and Bearish Trendlines. In the uptrend, Forex trend line is drawn throu
    Auto Optimized RSI   is a smart and easy-to-use arrow indicator designed for precision trading. It automatically finds the most effective RSI Buy and Sell levels for your selected symbol and timeframe using real historical data simulations. The indicator can be used as a standalone system or as part of your existing trading strategy. It is especially useful for intraday trading. Unlike traditional RSI indicators that rely on fixed 70/30 levels,   Auto Optimized RSI   dynamically adjusts its lev
    Identify precise entry and exit points with AB=CD patterns This indicator finds AB=CD retracement patterns. The AB=CD Retracement pattern is a 4-point price structure where the initial price segment is partially retraced and followed by an equidistant move from the completion of the pullback, and is the basic foundation for all harmonic patterns. [ Installation Guide | Update Guide | Troubleshooting | FAQ | All Products ] Customizable pattern sizes Customizable AC and BD ratios Customizable b
    Noize Absorption Index - is the manual trading system that measures the difference of pressure between bears forces and bulls forces. Green line - is a noize free index that showing curent situation. Zero value of index shows totally choppy/flat market.Values above zero level shows how powerfull bullish wave is and values below zero measures bearish forces.Up arrow appears on bearish market when it's ready to reverse, dn arrow appears on weak bullish market, as a result of reverse expectation.
    PipFinite Trend PRO MT5
    Karlo Wilson Vendiola
    4.84 (554)
    Breakthrough Solution For Trend Trading And Filtering With All Important Features Built Inside One Tool! Trend PRO's smart algorithm detects the trend, filters out market noise and gives entry signals with exit levels. The new features with enhanced rules for statistical calculation improved the overall performance of this indicator. Important Information Revealed Maximize the potential of Trend Pro, please visit www.mql5.com/en/blogs/post/713938 The Powerful Expert Advisor Version Automatin
    B5 and B3 assistant is an indicator developed to add a bit of certainty. The indicator provides the trader with clear "predictive" entries. Each entry is marked on the chart, with a point value and estimated amount of spikes. HOW TO USE THE INFDICATOR: Load onto your Boom 500 or B300 chart. Wait for signal. Use signal information to place SL and TP. EXAMPLE OF HOW TO TAKE TRADES: You will get an on chart alert and push notification which will be as follows: OPTION 1: incoming spike ale
    FusionPro EA
    Bram Van De Vooren
    FusionPro v1.1 Beta - Multi-Strategy News-Aware EA ️ CONSERVATIVE Multi-Pair Trading System with Advanced Risk Protection LIMITED BETA RELEASE - $299 (Price increases +$100 after every 10 sales - Secure your copy now!) ️ SAFETY-FIRST TRADING APPROACH Conservative Risk Management - Maximum 0.1%-2.0% risk per pair, never risky martingale News Event Protection - Automatically blocks trades during high-impact volatile events Smart Position Limits - Maximum open trades cap prevents o
    Surf Board
    Mohammadal Alizadehmadani
    Benefits of the Surfboard indicator : Entry signals without repainting If a signal appears and is confirmed, it does NOT disappear anymore, unlike indicators with repainting, which lead to major financial losses because they can show a signal and then remove it. perfect opening of trades The indicator algorithms allow you to find the Peak and floor position to enter a deal (buy or sell an asset), which increases the success rate for each and every trader using it. Surfboard works with any asset
    Premium level is a unique indicator with more than 80% accuracy of correct predictions! This indicator has been tested for more than two months by the best Trading Specialists! The author's indicator you will not find anywhere else! From the screenshots you can see for yourself the accuracy of this tool! 1 is great for trading binary options with an expiration time of 1 candle. 2 works on all currency pairs, stocks, commodities, cryptocurrencies Instructions: As soon as the red arrow app
    The "No Reversal Accumatrix AI" is a cutting-edge MetaTrader 5 indicator designed to assist traders in confirming trends without the inconvenience of repainting. Built upon advanced artificial intelligence algorithms, this indicator offers a reliable tool for identifying and validating trends in financial markets. Key Features: Non-Repainting Technology : Unlike traditional indicators prone to repainting, the "No Reversal Accumatrix AI" utilizes innovative algorithms to provide accurate trend co
    Stochastic Divergen MT5
    Komang Putra Riswanjaya
    2 (1)
    Overview The Stochastic Divergence Indicator is a tool designed to help identify potential market turning points by analyzing divergences between price and the Stochastic Oscillator. It highlights divergence signals visually on the chart, assisting traders in observing possible trend changes. Key Features No Repaint: Once a signal is formed, it remains on the chart. Adjustable Parameters: Settings can be modified to fit different trading preferences and timeframes. Visual Display: Arrows are plo
    Buyers of this product also purchase
    Divergence Bomber
    Ihor Otkydach
    4.98 (62)
    Each buyer of this indicator also receives the following for free: The custom utility "Bomber Utility", which automatically manages every trade, sets Stop Loss and Take Profit levels, and closes trades according to the rules of this strategy Set files for configuring the indicator for various assets Set files for configuring Bomber Utility in the following modes: "Minimum Risk", "Balanced Risk", and "Wait-and-See Strategy" A step-by-step video manual to help you quickly install, configure, and s
    Grabber System MT5
    Ihor Otkydach
    5 (15)
    Let me introduce you to an excellent technical indicator – Grabber, which works as a ready-to-use "All-Inclusive" trading strategy. Within a single code, it integrates powerful tools for technical market analysis, trading signals (arrows), alert functions, and push notifications. Every buyer of this indicator also receives the following for free: Grabber Utility for automatic management of open orders Step-by-step video guide: how to install, configure, and trade with the indicator Custom set fi
    Quantum TrendPulse
    Bogdan Ion Puscasu
    5 (16)
    Introducing Quantum TrendPulse , the ultimate trading tool that combines the power of SuperTrend , RSI , and Stochastic into one comprehensive indicator to maximize your trading potential. Designed for traders who seek precision and efficiency, this indicator helps you identify market trends, momentum shifts, and optimal entry and exit points with confidence. Key Features: SuperTrend Integration: Easily follow the prevailing market trend and ride the wave of profitability. RSI Precision: Detect
    How many times have you bought a trading indicator with great back-tests, live account performance proof with fantastic numbers and stats all over the place but after using it, you end up blowing your account? You shouldn't trust a signal by itself, you need to know why it appeared in the first place, and that's what RelicusRoad Pro does best! User Manual + Strategies + Training Videos + Private Group with VIP Access + Mobile Version Available A New Way To Look At The Market RelicusRoad is the
    Introduction to X3 Chart Pattern Scanner X3 Cherart Pattern Scanner is the non-repainting and non-lagging indicator detecting X3 chart patterns including Harmonic pattern, Elliott Wave pattern, X3 patterns, and Japanese Candlestick patterns. Historical patterns match with signal patterns. Hence, you can readily develop the solid trading strategy in your chart. More importantly, this superb pattern scanner can detect the optimal pattern of its kind. In addition, you can switch on and off individu
    FX Volume MT5
    Daniel Stein
    4.84 (19)
    FX Volume: Experience Genuine Market Sentiment from a Broker’s Perspective Quick Overview Looking to elevate your trading approach? FX Volume provides real-time insights into how retail traders and brokers are positioned—long before delayed reports like the COT. Whether you’re aiming for consistent gains or simply want a deeper edge in the markets, FX Volume helps you spot major imbalances, confirm breakouts, and refine your risk management. Get started now and see how genuine volume data can
    TPSproTREND PrO MT5
    Roman Podpora
    4.72 (18)
    Entry points at the bar close,  without redrawing .  Trend scanner  across all assets,  MTF - mode  and much more in one tool. We recommend using it together with   RFI LEVELS. ИНСТРУКЦИЯ RUS   /   INSTRUCTIONS  ENG         /         VERSION MT4   Main functions: Accurate entry signals WITHOUT REPAINTING! Once a signal appears, it remains valid! This is a significant distinction from repainting indicators that might provide a signal and then alter it, potentially leading to deposit losses. Now,
    AriX
    Temirlan Kdyrkhan
    1 (1)
    AriX Indicator for MT5 A powerful trend-following and signal-evaluation tool AriX is a custom MT5 indicator that combines Moving Averages and ATR-based risk/reward logic to generate clear buy/sell signals. It visualizes dynamic SL/TP levels, evaluates past trade outcomes, and displays win/loss statistics in a clean on-chart panel. Key features include: Buy/Sell signals based on MA crossovers ATR-based SL/TP1/TP2/TP3 levels with visual lines and labels Signal outcome tracking with real-time stat
    ARIPoint
    Temirlan Kdyrkhan
    ARIBot is a powerful trading companion designed to generate high-probability entry signals with dynamic TP/SL/DP levels based on volatility. Built-in performance tracking shows win/loss stats, PP1/PP2 hits, and success rates — all updated live. Key Features: Buy/Sell signals with adaptive volatility bands Real-time TP/SL/DP levels based on ATR Built-in MA Filter with optional ATR/StdDev volatility Performance stats panel (Success, Profit/Loss, PP1/PP2) Alerts via popup, sound, push, or email Cus
    Algo Pumping
    Ihor Otkydach
    4.74 (19)
    PUMPING STATION – Your Personal All-inclusive strategy Introducing PUMPING STATION — a revolutionary Forex indicator that will transform your trading into an exciting and effective activity! This indicator is not just an assistant but a full-fledged trading system with powerful algorithms that will help you start trading more stable! When you purchase this product, you also get FOR FREE: Exclusive Set Files: For automatic setup and maximum performance. Step-by-step video manual: Learn how to tr
    PZ Swing Trading MT5
    PZ TRADING SLU
    5 (5)
    Protect against whipsaws: revolutionize your swing trading approach Swing Trading is the first indicator designed to detect swings in the direction of the trend and possible reversal swings. It uses the baseline swing trading approach, widely described in trading literature. The indicator studies several price and time vectors to track the aggregate trend direction and detects situations in which the market is oversold or overbought and ready to correct. [ Installation Guide | Update Guide | Tro
    TPSpro RFI Levels MT5
    Roman Podpora
    4.55 (20)
    Reversal zones - levels / Active zones of a major player INSTRUCTIONS RUS   /   INSTRUCTIONS   ENG   /   Version MT4 EVERY BUYER OF THIS INDICATOR       GET ADDITIONALLY   FOR FREE   : 3 months       access to trading signals from the service       RFI SIGNALS       — ready-made entry points according to the TPSproSYSTEM algorithm. 3 months       access to training materials with regular updates - immersion in strategy and professional growth. 24/5 support on weekdays and access to a closed tra
    MetaForecast M5
    Vahidreza Heidar Gholami
    5 (3)
    MetaForecast predicts and visualizes the future of any market using different powerful methods. While financial markets are not always predictable, if there are patterns in the past data, MetaForecast can learn and predict the future as accurately as possible. It features a complete implementation of neural networks embedded directly into the indicator, enabling traders to create and train AI models using data from multiple symbols to learn complex patterns. MetaForecast leverages your computer'
    Custom Indictor Signal Scanner for scan your own any custom indicator and template its one click you can open your desire signals(given time frame alert). Also can open same template with particular input indicator just type name of template your created with given indicator and enjoy all time frame scan with your logical signals  input string s2 = "====== Embedded Indicator Settings ======"; input UseEmbeddedIndicator = false; // Use embedded indicator instead of external file ( don't use its n
    Top indicator for MT5   providing accurate signals to enter a trade without repainting! It can be applied to any financial assets:   forex, cryptocurrencies, metals, stocks, indices .  Watch  the video  (6:22) with an example of processing only one signal that paid off the indicator! MT4 version is here It will provide pretty accurate trading signals and tell you when it's best to open a trade and close it. Most traders improve their trading results during the first trading week with the help of
    Trend Forecaster
    Alexey Minkov
    5 (7)
    The Trend Forecaster indicator utilizes a unique proprietary algorithm to determine entry points for a breakout trading strategy. The indicator identifies price clusters, analyzes price movement near levels, and provides a signal when the price breaks through a level. The Trend Forecaster indicator is suitable for all financial assets, including currencies (Forex), metals, stocks, indices, and cryptocurrencies. You can also adjust the indicator to work on any time frames, although it is recommen
    FX Power MT5 NG
    Daniel Stein
    5 (17)
    FX Power: Analyze Currency Strength for Smarter Trading Decisions Overview FX Power is your go-to tool for understanding the real strength of currencies and Gold in any market condition. By identifying strong currencies to buy and weak ones to sell, FX Power simplifies trading decisions and uncovers high-probability opportunities. Whether you’re looking to follow trends or anticipate reversals using extreme delta values, this tool adapts seamlessly to your trading style. Don’t just trade—trade
    IQ Gold Gann Levels a non-repainting, precision tool designed exclusively for XAUUSD/Gold intraday trading. It uses W.D. Gann’s square root method to plot real-time support and resistance levels, helping traders spot high-probability entries with confidence and clarity. William Delbert Gann (W.D. Gann) was an exceptional market analyst, whose trading technique was based on a complex blend of mathematics, geometry, astrology, and ancient mathematics which proved to be extremely accurate. Download
    Introducing the POWER TRADE indicator created by a small group of traders with a few years trading trading the financial market profitably . This is a plug and play indicator that provides you with  POWERFUL Entry signals with Profit Taking and rebound zones. The indicator Works with all MT5 trading instruments. The indicator uses previous  chart data as receipt to speculate on future market moves.
    Python Ninja  - Drag & Drop Python API Connector for NinjaTrader 8 PyNinjaTrader seamlessly connects your Python scripts with NinjaTrader 8 using a simple drag-and-drop strategy. This fully tested, fast, and efficient solution utilizes websockets for communication, with the strategy acting as the server and the Python script as the client. Features: - Python login to NinjaTrader 8 Terminal - Keep-alive function for continuous connection - Retrieve NinjaTrader 8 account info to Python client -
    Introducing   Quantum Breakout PRO , the groundbreaking MQL5 Indicator that's transforming the way you trade Breakout Zones! Developed by a team of experienced traders with trading experience of over 13 years,   Quantum Breakout PRO   is designed to propel your trading journey to new heights with its innovative and dynamic breakout zone strategy. Quantum Breakout Indicator will give you signal arrows on breakout zones with 5 profit target zones and stop loss suggestion based on the breakout b
    Bill Williams Advanced
    Siarhei Vashchylka
    5 (10)
    Bill Williams Advanced is designed for automatic chart analysis using Bill Williams' "Profitunity" system. The indicator analyzes four timeframes at once. Manual (Be sure to read before purchasing) Advantages 1. Automatically analyzes the chart using the "Profitunity" system of Bill Williams. The found signals are placed in a table in the corner of the screen. 2. Equipped with a trend filter based on the Alligator indicator. Most of the system signals are recommended to be used only according t
    Market Profile Heatmap
    Samuele Borella
    5 (1)
    MP TPO Heatmap — Market Profile (TPO) with VAH/VAL/POC/IB Market Profile is a way to visualize how price accepts or rejects value within a session. Instead of averaging, it counts how often price traded at each level during equal-time “brackets.” The result is a distribution you can read at a glance: thick areas = acceptance; thin edges = rejection. This indicator implements a TPO-based Market Profile with clean session lines (POC, VAH, VAL, IBH, IBL) and a fast, two-tone heatmap cloud that high
    Advanced Supply Demand MT5
    Bernhard Schweigert
    4.5 (14)
    Best Solution for any Newbie or Expert Trader! This indicator is a unique, high quality and affordable trading tool because we have incorporated a number of proprietary features and a new formula. With this update, you will be able to show double timeframe zones. You will not only be able to show a higher TF but to show both, the chart TF, PLUS the higher TF: SHOWING NESTED ZONES. All Supply Demand traders will love it. :) Important Information Revealed Maximize the potential of Advanced Supply
    PZ Trend Trading MT5
    PZ TRADING SLU
    3.8 (5)
    Capture every opportunity: your go-to indicator for profitable trend trading Trend Trading is an indicator designed to profit as much as possible from trends taking place in the market, by timing pullbacks and breakouts. It finds trading opportunities by analyzing what the price is doing during established trends. [ Installation Guide | Update Guide | Troubleshooting | FAQ | All Products ] Trade financial markets with confidence and efficiency Profit from established trends without getting whip
    Berma Bands
    Muhammad Elbermawi
    5 (6)
    The Berma Bands (BBs) indicator is a valuable tool for traders seeking to identify and capitalize on market trends. By analyzing the relationship between the price and the BBs, traders can discern whether a market is in a trending or ranging phase. Visit the [ Berma Home Blog ] to know more. Berma Bands are composed of three distinct lines: the Upper Berma Band, the Middle Berma Band, and the Lower Berma Band. These lines are plotted around the price, creating a visual representation of the pric
    Weltrade Spike Sentinel
    Batsirayi L Marango
    5 (1)
    Introducing Indicator for PainX and GainX Indices Traders on Weltrade Get ready to experience the power of trading with our indicator, specifically designed for Weltrade   broker's PainX and GainX Indices.  Advanced Strategies for Unbeatable Insights Our indicator employs sophisticated strategies to analyze market trends, pinpointing optimal entry and exit points.  Optimized for Maximum Performance To ensure optimal results, our indicator is carefully calibrated for 5-minute timeframe charts on
    Golden Spike Premium
    Kwaku Bondzie Ghartey
    5 (1)
    Golden Spikes Indicator Technical indicator for synthetic indices trading on M1 timeframe. Compatible with Boom/Crash indices on Deriv platform and Gain/Pain indices on Weltrade platform. send me A private  message to receive trade ASISTANT EA.. booklet guide:  https://drive.google.com/file/d/1knQJqGHZSP5eQN24ndRz2ayZVCst6XhN/view?usp=sharing Also check my premium spikes bot: https://www.mql5.com/en/market/product/142350 Features Uses Parabolic SAR, RSI, and Bollinger Bands analysis Three risk
    The Golden Boom and Crash Spike Detector is an advanced synthetics trading indicator that combines proprietary AI-driven spike detection, ICT smart money concepts, and price action analysis to deliver high-probability trade signals with unmatched accuracy. Important( Use only on  Crash 300, Boom 300, PainX 400, and GainX 400 (M1 one minute timeframe) Identifies high-probability spikes with non-repainting buy/sell arrows. Automatically sets profit targets and stop losses. Sends notifications to p
    This indicator identifies and displays zones, as it were areas of strength, where the price will unfold. The indicator can work on any chart, any instrument, at any timeframe. The indicator has two modes. The indicator is equipped with a control panel with buttons for convenience and split into two modes. Manual mode: To work with manual mode, you need to press the NEW button, a segment will appear. This segment is stretched over the movement and the LVL button is pressed. The level is displayed
    More from author
    IQ Gold Gann Levels a non-repainting, precision tool designed exclusively for XAUUSD/Gold intraday trading. It uses W.D. Gann’s square root method to plot real-time support and resistance levels, helping traders spot high-probability entries with confidence and clarity. William Delbert Gann (W.D. Gann) was an exceptional market analyst, whose trading technique was based on a complex blend of mathematics, geometry, astrology, and ancient mathematics which proved to be extremely accurate. Download
    IQ Gold Gann Levels a non-repainting, precision tool designed exclusively for XAUUSD/Gold intraday trading. It uses W.D. Gann’s square root method to plot real-time support and resistance levels, helping traders spot high-probability entries with confidence and clarity. William Delbert Gann (W.D. Gann) was an exceptional market analyst, whose trading technique was based on a complex blend of mathematics, geometry, astrology, and ancient mathematics which proved to be extremely accurate. Download
    Hydra Trend Rider is a non-repainting, multi-timeframe trend indicator that delivers precise buy/sell signals and real-time alerts for high-probability trade setups. With its color-coded trend line, customizable dashboard, and mobile notifications, it's perfect for traders seeking clarity, confidence, and consistency in trend trading. Download the Metatrader 5 Version Read the User Manual here. HURRY!  Price  increasing soon! Read the product description carefully before purchasing the product. 
    IQ FX Gann Levels a precision trading indicator based on W.D. Gann’s square root methods. It plots real-time, non-repainting support and resistance levels to help traders confidently spot intraday and scalping opportunities with high accuracy. William Delbert Gann (W.D. Gann) was an exceptional market analyst, whose trading technique was based on a complex blend of mathematics, geometry, astrology, and ancient mathematics which proved to be extremely accurate. Download the Metatrader 5 Version M
    Hydra Trend Rider is a non-repainting, multi-timeframe trend indicator that delivers precise buy/sell signals and real-time alerts for high-probability trade setups. With its color-coded trend line, customizable dashboard, and mobile notifications, it's perfect for traders seeking clarity, confidence, and consistency in trend trading. Download the Metatrader 4 Version Read the Indicator User Manual here. HURRY!  Price  increasing soon! Read the product description carefully before purchasing the
    FX Correlation Matrix is a powerful multi-timeframe dashboard that helps traders analyze real-time currency correlations of upto 28 symbols at a glance. With customizable settings, sleek design, and manual symbol selection option, it enhances trade accuracy, reduces risk, and identifies profitable correlation-based opportunities. Get the  Metatrader 5 Version here. Get it FAST!  Price is  increasing soon! Read the product description carefully before purchasing the product.  Disclaimer: Due to r
    IQ FX Gann Levels a precision trading indicator based on W.D. Gann’s square root methods. It plots real-time, non-repainting support and resistance levels to help traders confidently spot intraday and scalping opportunities with high accuracy. William Delbert Gann (W.D. Gann) was an exceptional market analyst, whose trading technique was based on a complex blend of mathematics, geometry, astrology, and ancient mathematics which proved to be extremely accurate. Download the Metatrader 4 Version M
    Volatility Master for MetaTrader is a real-time dashboard tool that scans up to 56 symbols to identify high-volatility, trending markets instantly. With clear bullish/bearish signals, customizable alerts, and a user-friendly interface, it helps you avoid range-bound conditions and focus on high-probability trades. Clarity leads to confidence. This is your chance to trade confidently and protect your capital effectively, don't miss the opportunity that you might regret later! Download  Metatrader
    IQ Chart Cleaner – Get a Fresh Chart in Seconds. A cluttered chart can make trading stressful and confusing. Between dozens of old indicators, leftover lines, arrows, shapes, and notes, it’s easy to lose focus on what really matters—your trades. That’s where IQ Chart Cleaner comes in. With a single click, IQ Chart Cleaner gives you a fresh, distraction-free chart so you can analyze the markets with clarity and confidence. Get the MT5 Version here . Key Benefits Total Cleaning Power – Instantly
    Volatility Master for MetaTrader is a real-time dashboard tool that scans up to 56 symbols to identify high-volatility, trending markets instantly. With clear bullish/bearish signals, customizable alerts, and a user-friendly interface, it helps you avoid range-bound conditions and focus on high-probability trades. Clarity leads to confidence. This is your chance to trade confidently and protect your capital effectively, don't miss the opportunity that you might regret later! Download  Metatrader
    FX Correlation Matrix is a powerful multi-timeframe dashboard that helps traders analyze real-time currency correlations of upto 28 symbols at a glance. With customizable settings, sleek design, and manual symbol selection option, it enhances trade accuracy, reduces risk, and identifies profitable correlation-based opportunities. Get the  Metatrader 4  Version here. Get is FAST!  Price is  increasing soon! Read the product description carefully before purchasing the product.  Disclaimer: Due to
    Introducing  IQ Star Lines  - a unique astrological indicator purely based on Vedic astrology calculations , for the first time on Metatrader. This unique tool plots dynamic planetary grid lines based on real-time stars, constellations, and celestial movements , which allows you to plot the power of the cosmos directly onto your trading charts. This indicator is specifically designed for scalpers and intraday traders. The grid lines get automatically adjusted on your chart, with the moving sola
    Get a clean chart in an instant.  This script is extremely helpful in removing not only all the graphical objects from the chart but also all the  indicators from the chart.  Get the MT4 Version here . Features: Confirmation Dialog : Asks for confirmation before cleaning the chart. Complete Cleaning: Removes all graphical objects (lines, arrows, shapes, etc.) Removes all indicators from all chart windows (main and subwindows) Logging: Prints information about the cleaning process in the Expert
    Filter:
    No reviews
    Reply to review