Supply and Demand DASHBOARD PRO USER MANUAL.
SELECTED Supply and Demand zones.
Multiple Symbols, all Time-frames, multiple Alerts.
Highly configurable to the traders needs.
A Breakthrough Algorithm For Supply Demand Zones! That Will Further Improve Your Trading!
Supply and demand imbalances can be used on any market and timeframe: Forex, Stocks, ETFs, Commodities, Futures, Indexes, or Crypto Currencies. Use supply and demand zones to locate the exact zone to plan your Trade without expending half your life in front of your trading platform. Knowing were are supply and demand zones will help you locate turning points in any markets.
What is Supply and Demand DASHBOARD PRO?
This DASHBOARD is a very powerful piece of software working on multiple symbols and up to 9 timeframes. It is based on our main indicator (Best reviews: Advanced Supply Demand).
If you are new to supply demand trading read also https://www.mql5.com/en/blogs/post/720245
YOUR BENEFITS!
The most important questions for every trader regardless of what trading system is used:
- Were are the best levels to enter the market?
Enter your trade within or near a strong supply/demand zone to have the best chance of success and risk/reward. - Where is the best place for my stop loss?
Place your stop below/above a strong supply/demand zone to be the safest. - What is my best profit target?
Your exit strategy is just as important as your entry and knowing the higher time frame picture can help with this. For a buy use the next supply zone as a target, for a sell use the next demand zones as a target. Entering on a pullback to supply or demand to ensure that there is sufficient room for a profit margin up to higher time frame supply and demand will increase your profits.
Why we filter strong and weak zones?
The greater the imbalance, the greater the move in price. The highest probability price levels are the ones with the greatest imbalance between buyers and sellers. Without any prior warning, it reverses on the spot and drops like a stone – those are the areas of major imbalances. A big number of sellers have entered the market at that price and outnumbered the buyers. It is also very likely that, in case of a sudden sell-off, more sellers were waiting to sell just around that level.
ADVANCED FEATURES:
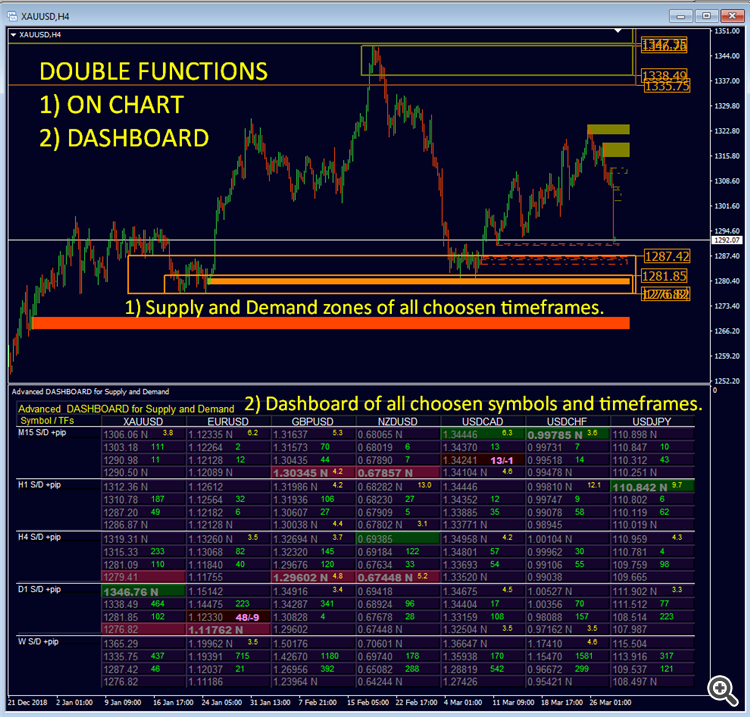
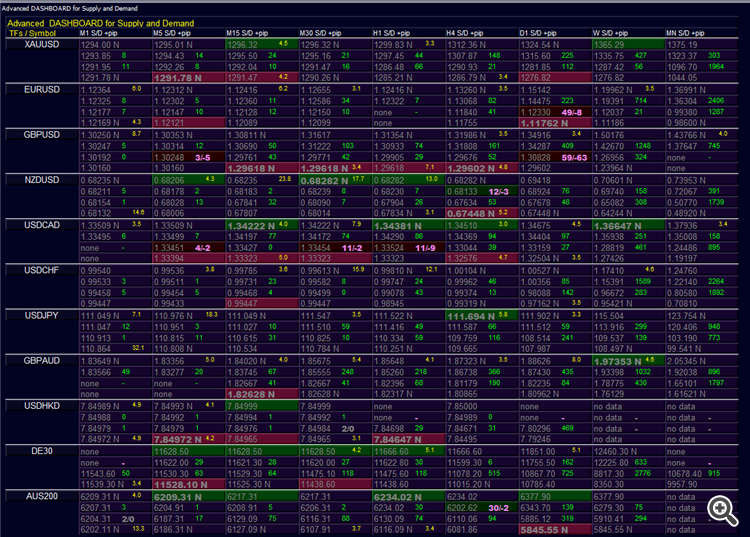
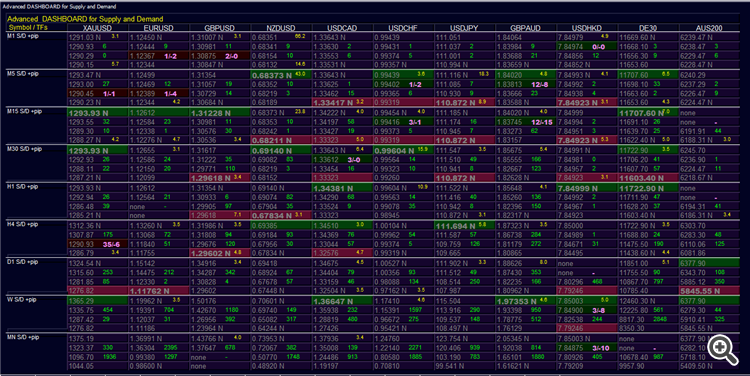
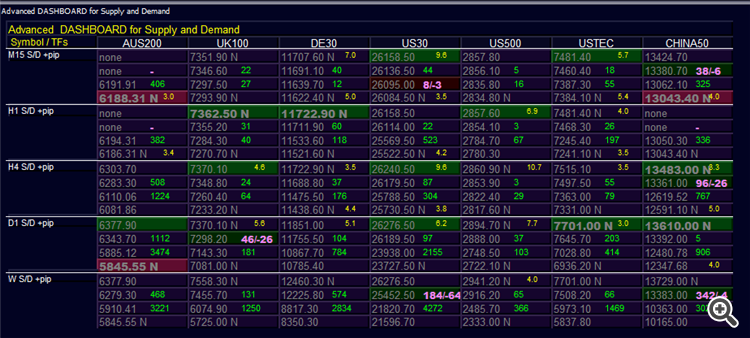
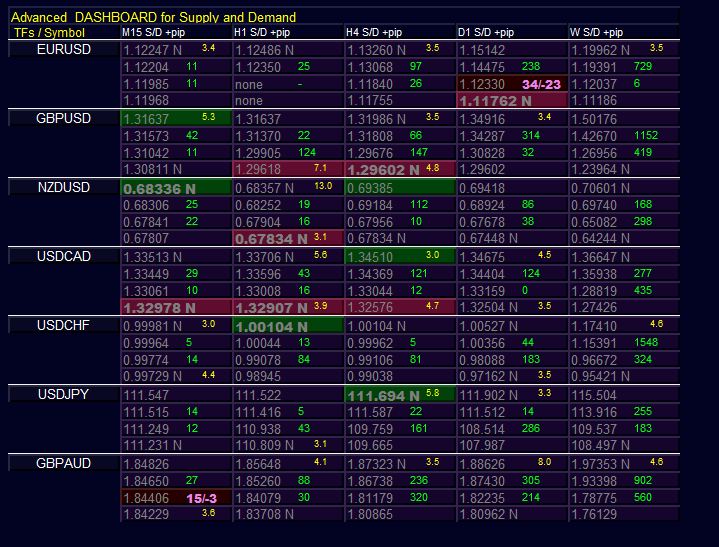
The new DASHBOARD gives a great overview of supply and demand with all timeframes.
- Zones are filtered with a special strength rating,
- Showing Supply and Demand values including zone strength rating,
- Showing pips distances to/and within zones,
- It highlights nested zones,
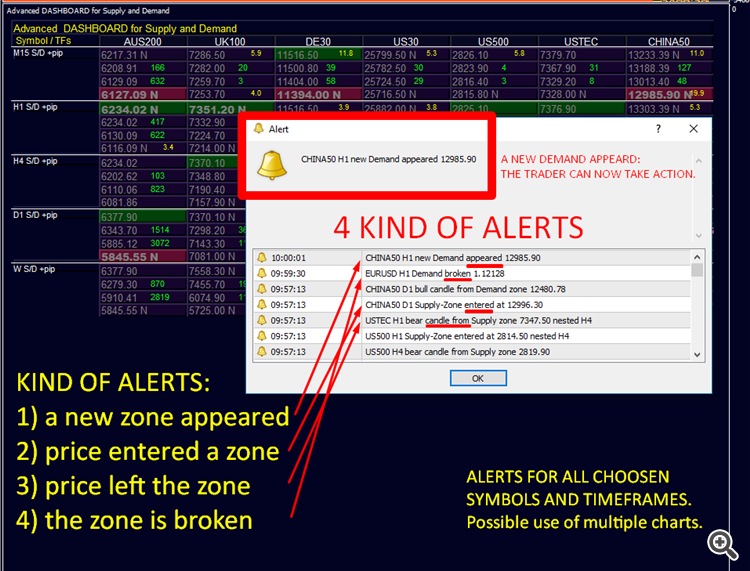
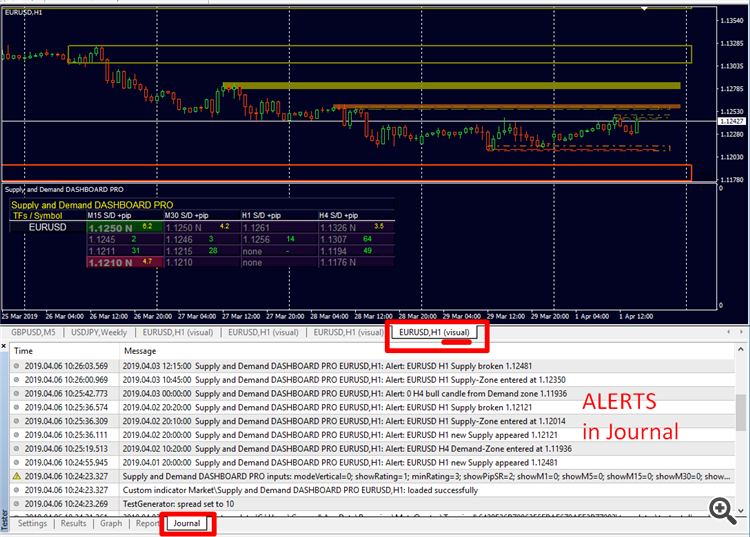
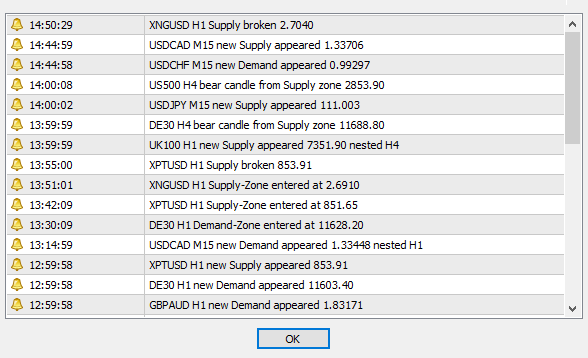
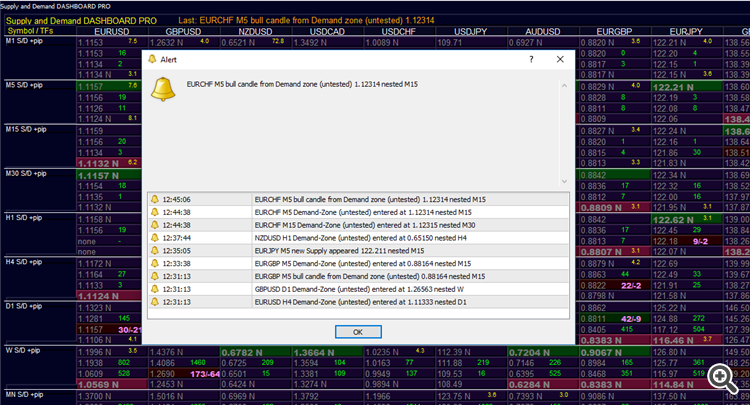
- It gives 4 kinds of alerts for the chosen symbols in up to all (9) time-frames.
- It is highly configurable for your personal needs!
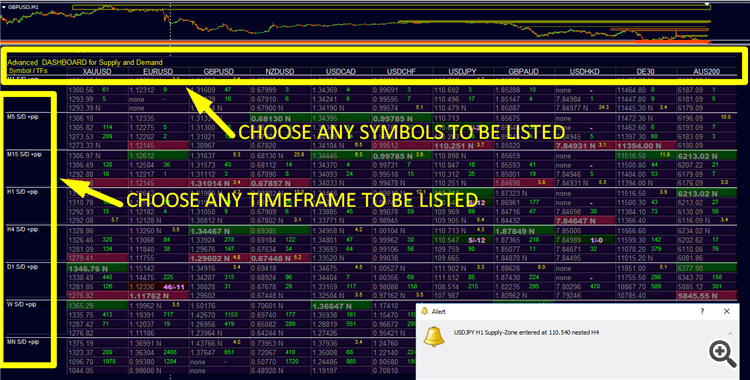
SYMBOLS AND TIMEFRAMES
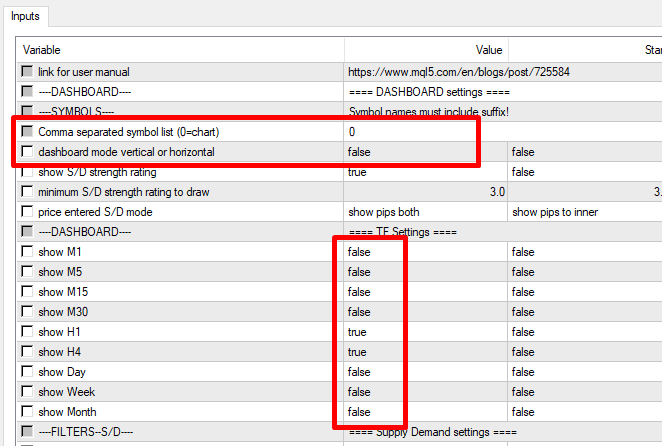
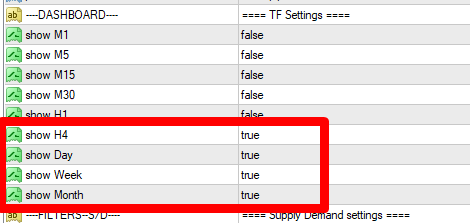
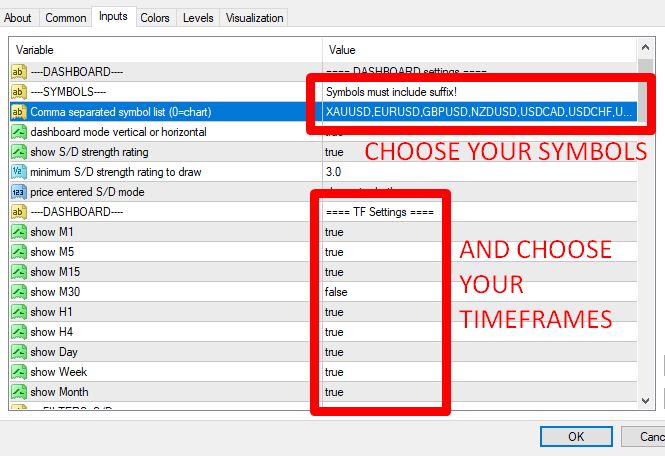
Choose all the symbols and timeframes you want to be listed on the dashboard.
Add or change any symbol. show or hide any timeframe.
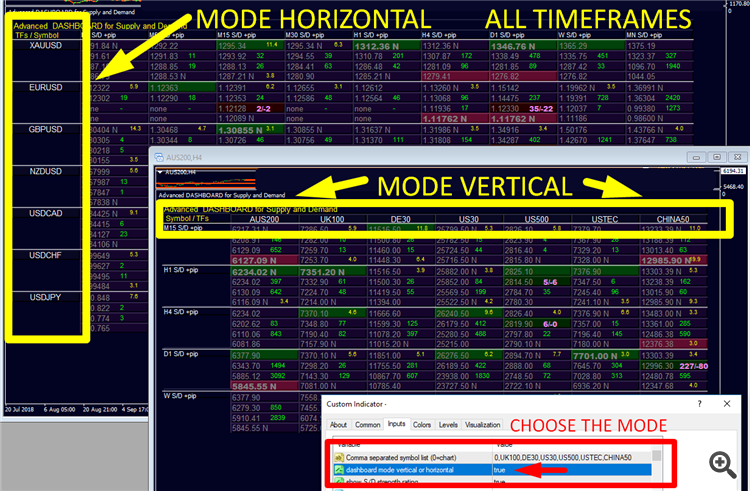
VISUAL MODE
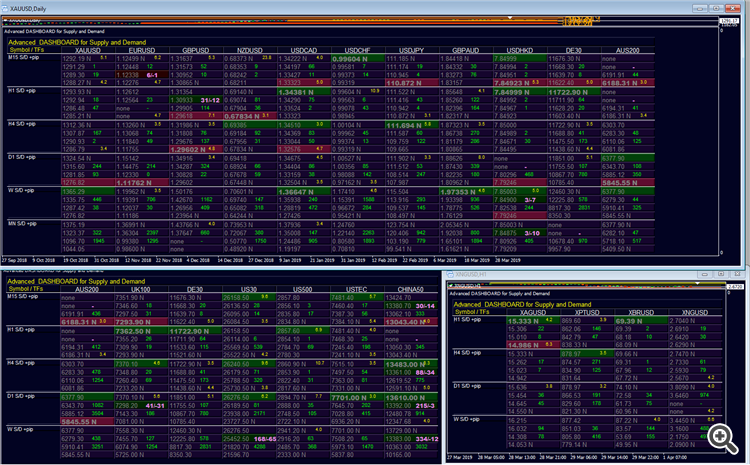
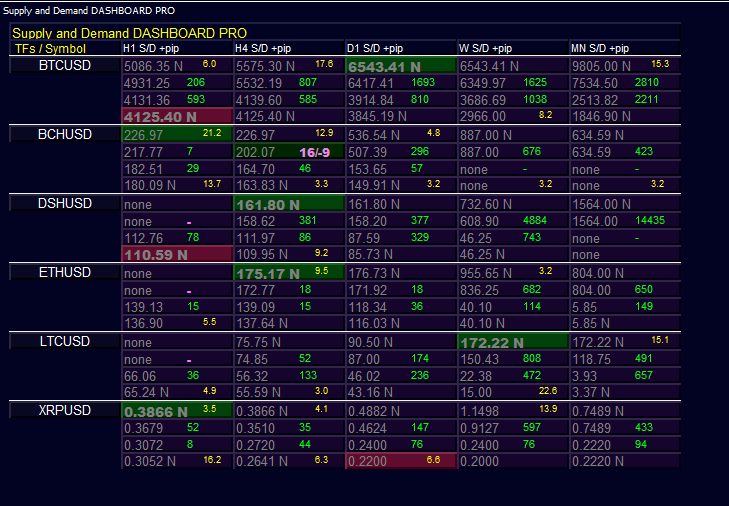
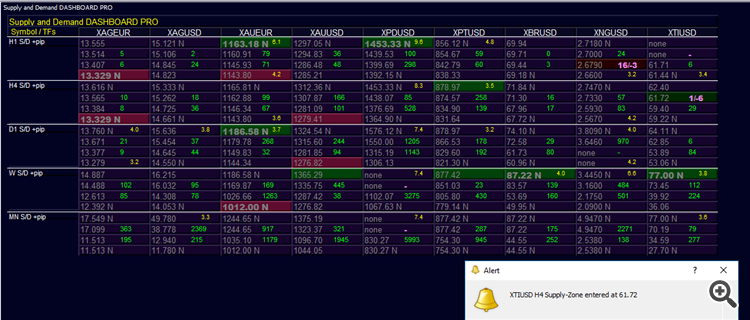
Choose the main dashboard mode. Vertical or horizontal:
4 KIND OF ALERTS:
- A new zone appeared.
- Price entered a zone.
- Price left the zone.
- The zone is broken.
- If you wish, you can filter all alerts for only nested zones.
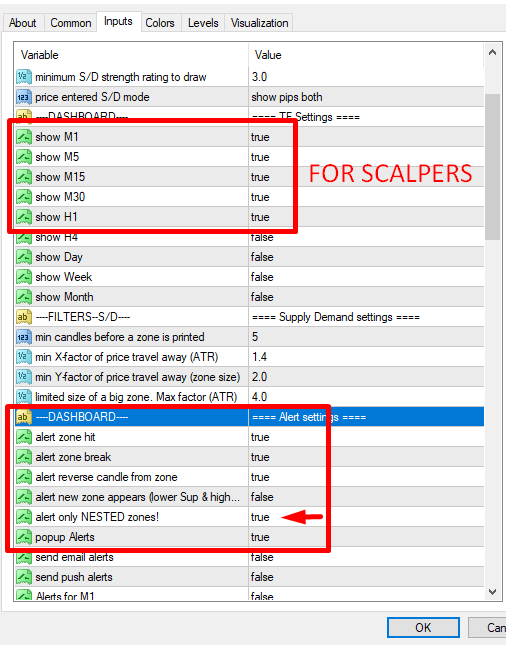
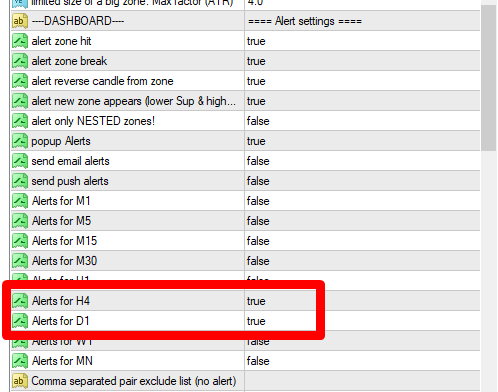
- You can choose the timeframes which should be alerted.
- You can exclude symbols from the alert.
VISUAL FEATURES ON DASHBOARD
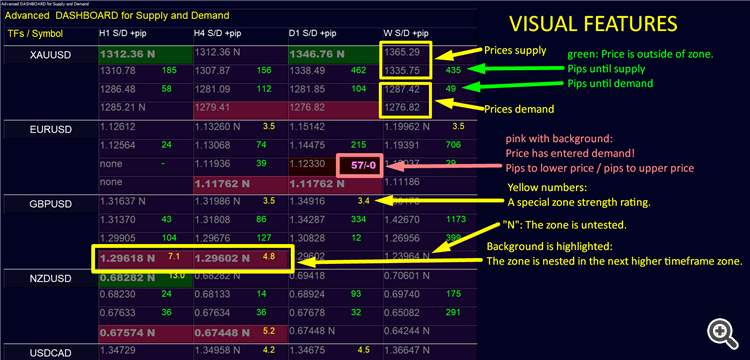
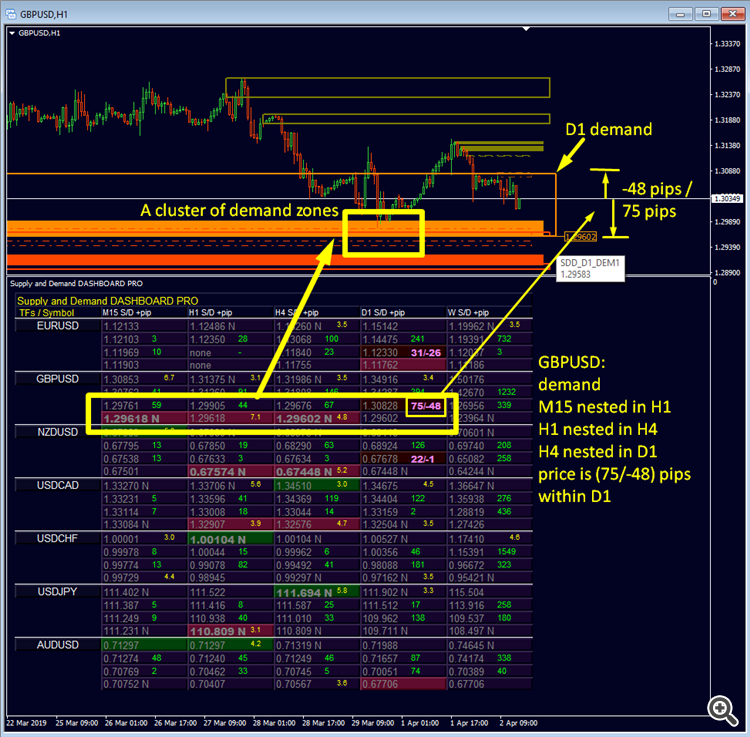
- Prices for supply and demand. (From up to down: supply upper price / supply lower price / demand upper price / demand lower price)
- Pips distances until supply and demand. Green, if price is far from zone.
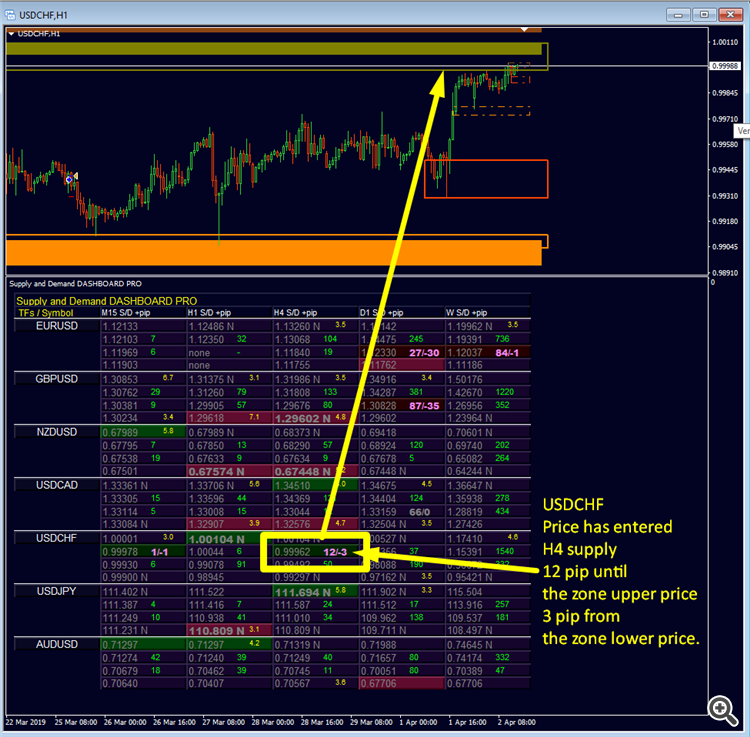
- Pips distances within supply and demand. Pink and bold, if price has entered the zone. (pips to outer price / pips to inner price)
- A special zone strength rating. Yellow number, if a minimum strength is reached.
- New or tested: "N" is added to price if the zone is still untested or new.
- Nested: the background is highlighted if the zone is nested within the higher timeframe zone.
- Nested AND new: Prices for supply and demand showing in bold.
VISUAL FEATURES ON CHART
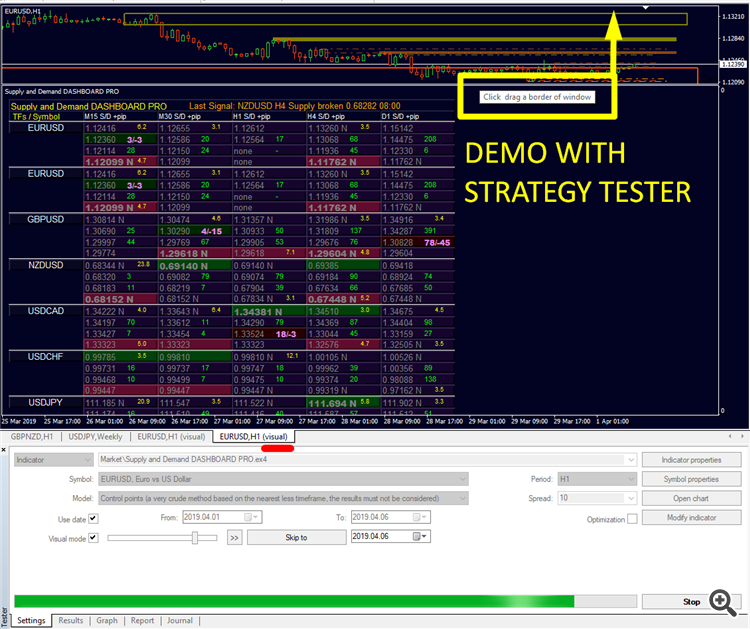
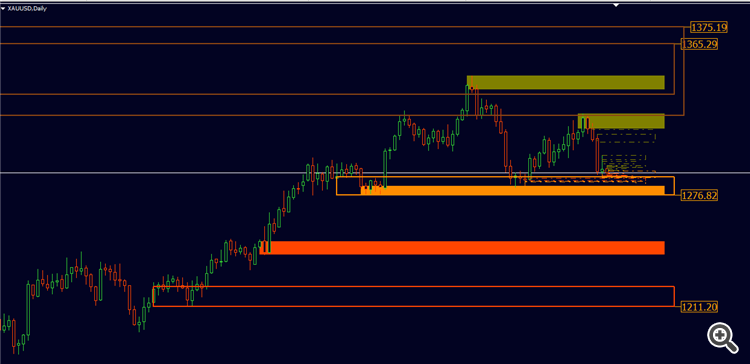
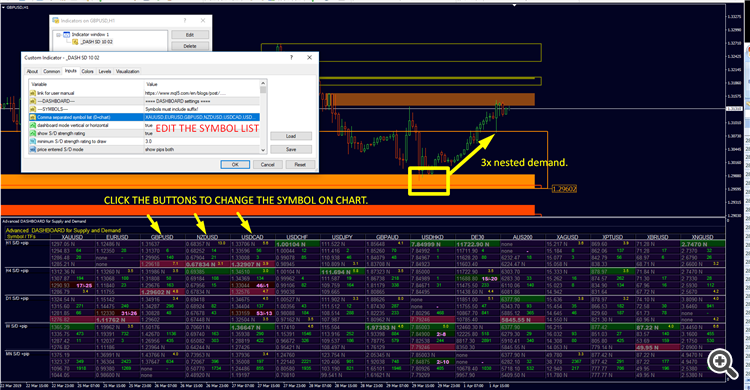
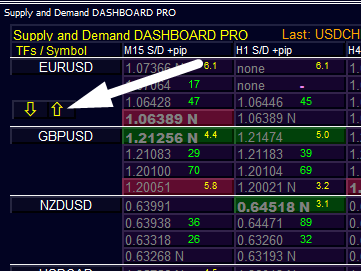
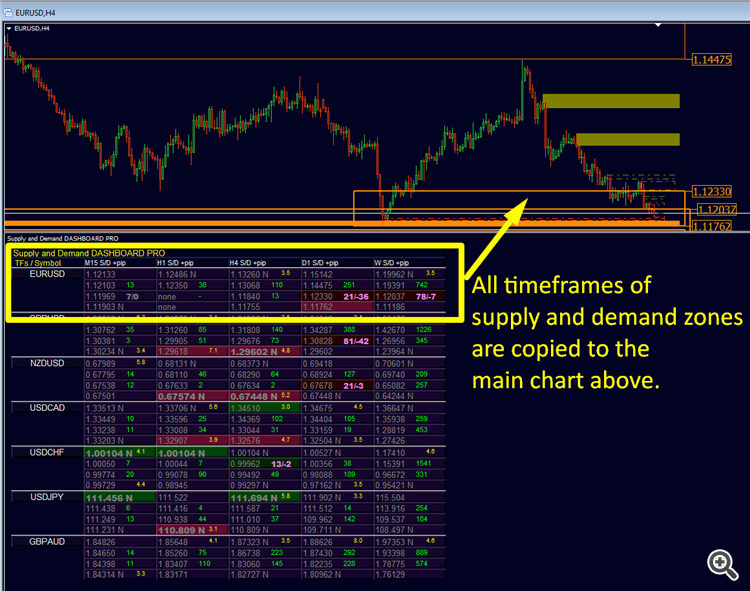
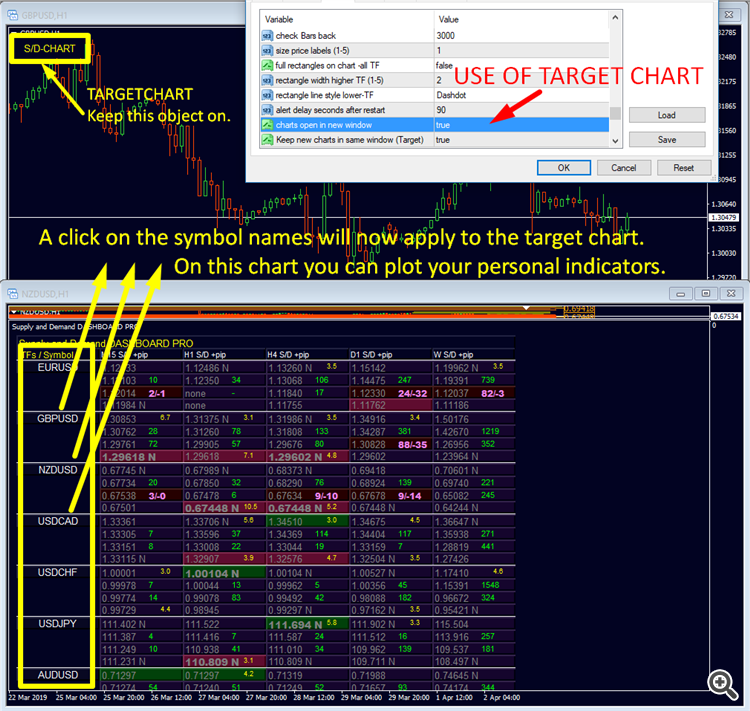
Simply drag the sub-window of the dashboard down with the mouse to see the actual chart. Click on the symbol names to change the symbol.
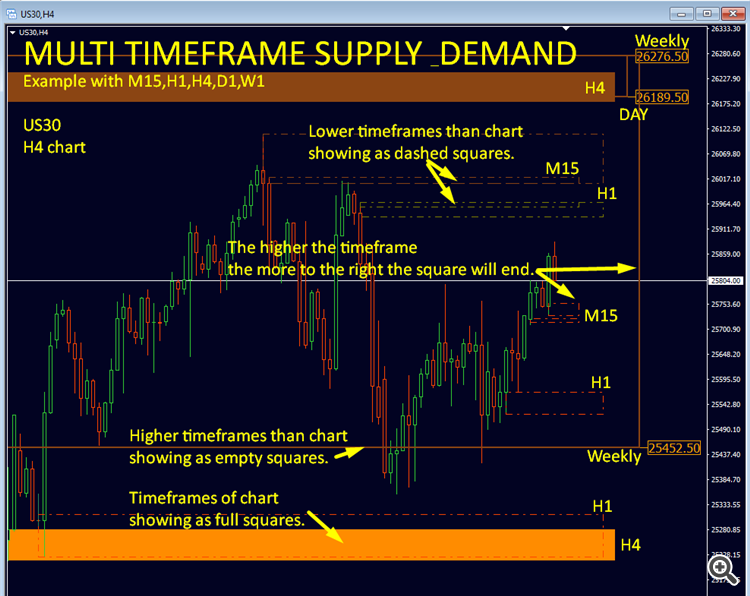
- All timeframes showing in the dashboard will be drawing on the chart.
- Lower timeframes than the chart showing as dashed squares.
- Actual timeframe of chart showing as full squares.
- Higher timeframes than chart showing as empty squares.
- The higher the timeframe is the more to the right the squares end.
- Color code will show if the zone is new or tested.
- Prices can be shown on the chart or not.
The picture below shows an example with 5 timeframes for US30, but if you want you can show all 9 timeframes.
Version 1.5 released today 2019.05.30
A new filter for alerts has been added to do alerts only if the zone is new or untouched. (Excluding break alert.)
- alert only new zones (excluding breaks) (default = false)
Example Alert: EURUSD H4 Demand-Zone (untested) entered at 1.11333 nested D1
Version 2.0 2020.10.22
MAJOR UPDATE 2020
==================
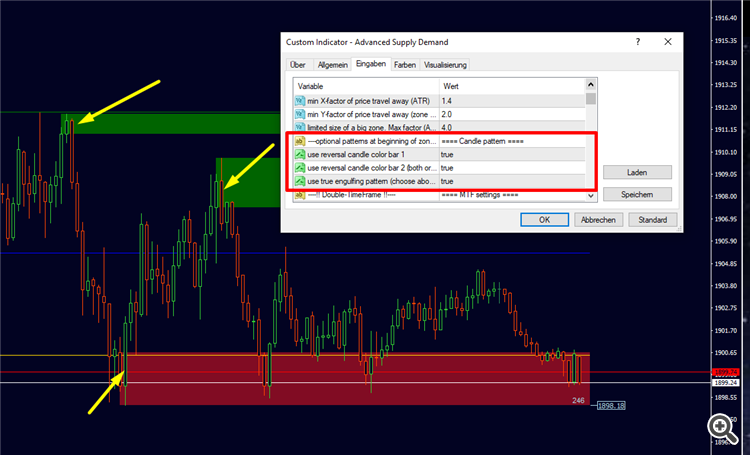
Use reversal candle color for bar 1 or bar 2 (the one before). Use either one or both.
Use a true engulfing pattern for the above-mentioned bars. (Must choose above.)
By default the use is false. To use the function you must set the new inputs = true (The selection is copied to all timeframes).
New inputs:
==== Candle pattern
- use reversal candle color bar 1
- use reversal candle color bar 2 (both or either)
- use true engulfing pattern (choose above)
MODIFICATION FOR ZONE SIZE
It was added optionally: Including a wick for the width of the supply and demand zones.
New input:
- Include wick 1 for the zone size
By default, the function is not used. To use the function, you must set the new input = true (The selection is copied to all timeframes).
Since the zones will be wider, some zones could be filtered. You may want to use lower XY factors.
How to update:
Possible you have to wait 24 hours until it is available for update.
Terminal's showcase “Market” is updating once in 24 hours. If you don't see any updates - that means 24 hours haven't passed yet. You have to wait for showcase update.
If a new version of a product is available, you will see the corresponding message against it as well as the "Update" button.
Once this button is pressed, the new version will be downloaded. The new file replaces the previous one. Thus if you need, save the old version copy the file under a different name or outside of the directory [platform data folder]\MQL5\Market\.
To install updated version immediately delete the product from Navigator window (or better safe/drag the file to another folder outside of MT4), restart the terminal and try to install purchase from Terminal - Market - Purchased tab. This will be free and cost no activation.
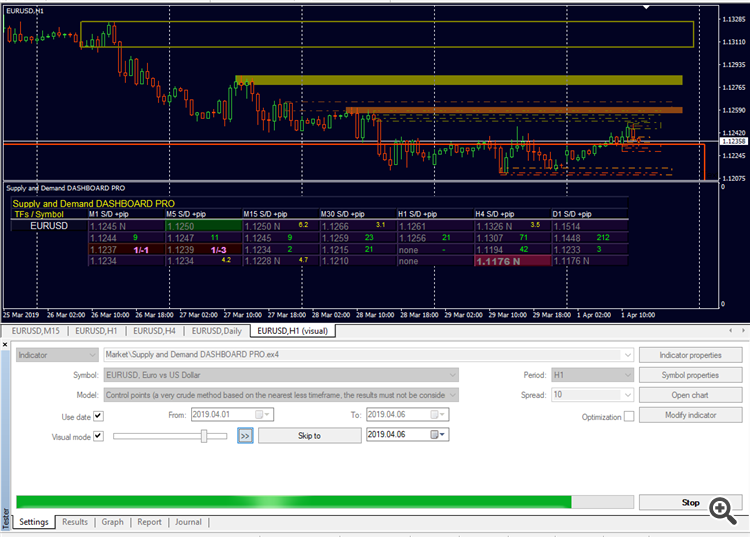
Strategy tester
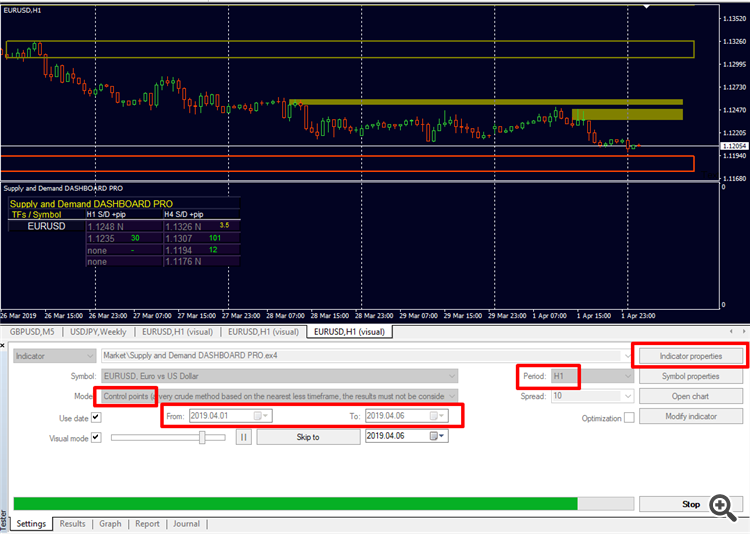
ATTENTION: To get the demo work in the strategy tester it needs a special setup since it's a Multi-Symbol and Multi-Timeframe Dashboard. Also you need to prepare chart data quotes. Please see below comment 1. Send me email if you need help currencystrength28@gmail.com (You can also try instead the demo of Advanced Supply Demand which works just in a similar way.) I can assure you it will run perfectly after purchase.
Specials !
Discounts are available for MT4 versions, now.
Sale has started!
Profit now with a lower price. Limited offer with discount MT4.
With discount !
Get it now!
MT4 CLICK HERE
I will always help you if you have any questions.
For more details and questions email me at
currencystrength28@gmail.com
I wish you many green pips in the future.
Best regards, Bernhard
Place a comment on the indicator page at mql5 so we can verify your access for our forum and other bonuses in the future.
Place a comment on the indicator page at mql5 so we can verify your access for our forum and other bonuses in the future.
THIS MANUAL WILL BE continuously be UPDATED !! So check again.
READ ALSO THE NEXT 20 COMMENTS.

