Advanced Supply Demand Indicator USER MANUAL.
SELECTED Supply/Demand Support/Resistance.
Multiple Time-frames and Alerts.
What is Advanced Supply Demand Indicator?
A Breakthrough Algorithm For Supply Demand Zones! That Can Further Improve Your Trading!
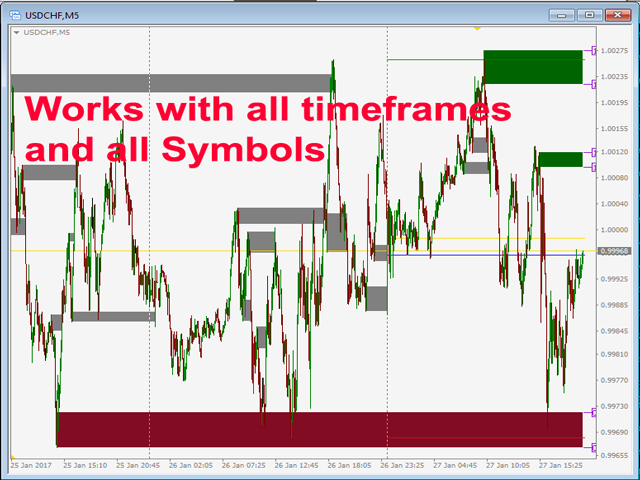
Supply and demand imbalances can be used on any market and timeframe: Forex, Stocks, ETFs, Commodities, Futures and Indexes. Use supply and demand zones to locate the exact zone to plan your Trade without expending half your life in front of your trading platform. Knowing were are supply and demand zones will help you locate turning points in any markets.
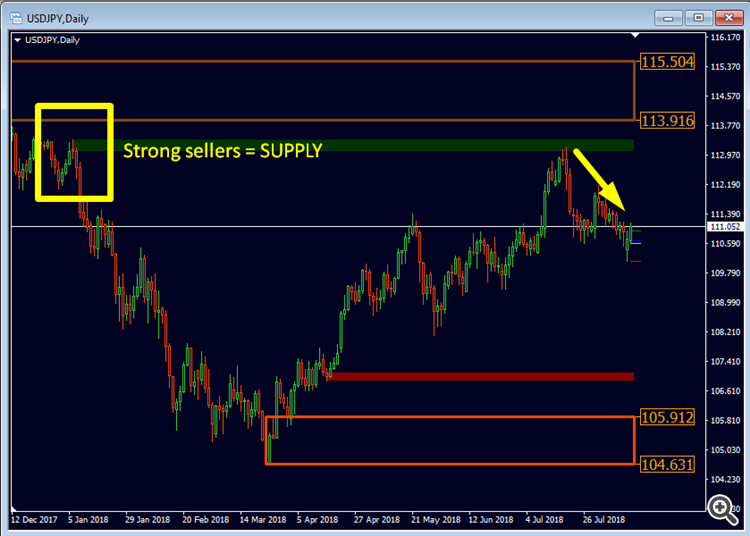
What is SUPPLY?
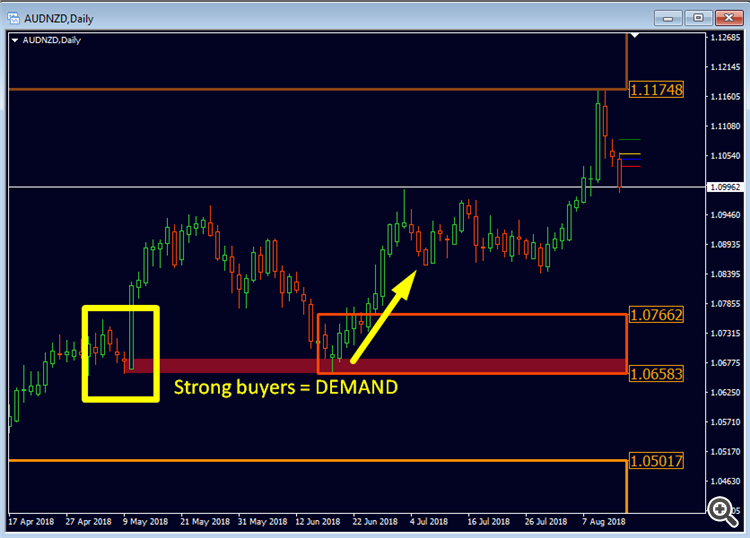
What is DEMAND?
Why Supply/Demand and not Support/Resistance?
Orders are not placed simply on a specific price but over an area or a zone. It can pay off to know how to spot such areas because just like the concept or support and resistance, supply and demand areas can add an other layer of confluence to our trading and help us find better trades.
YOUR BENEFITS!
The most important questions for every trader regardless what trading system is used:
- Were are the best levels to enter the market?
Enter your trade within or near a strong supply/demand zone to have the best chance of success and risk/reward. - Were is the best place for my stop loss?
Place your stop below/above a strong supply/demand zone to be the most safe. - What is my best profit target?
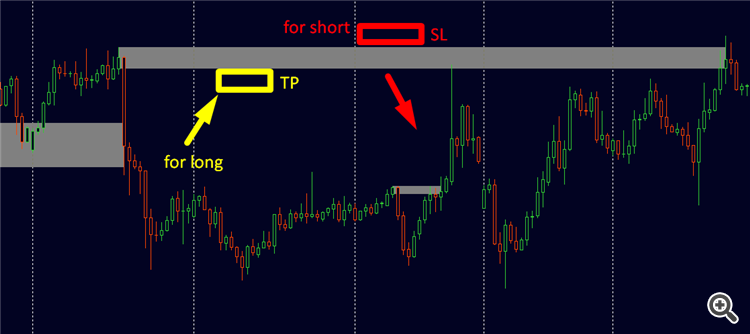
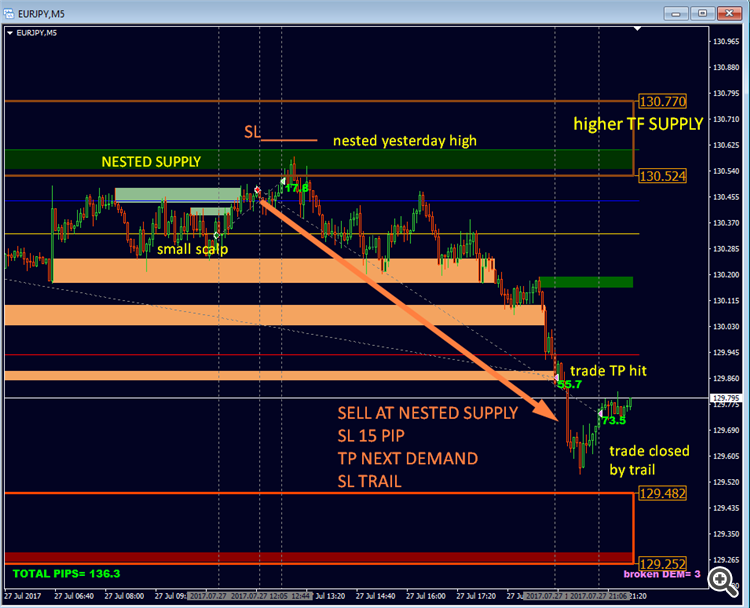
Your exit strategy is just as important as your entry and knowing the higher time frame picture can help with this. For a buy use the next supply zone as target, for a sell use the next demand zones as target. Entering on a pull back to supply or demand ensuring that there is sufficient room for a profit margin up to higher time frame supply and demand will increase your profits.
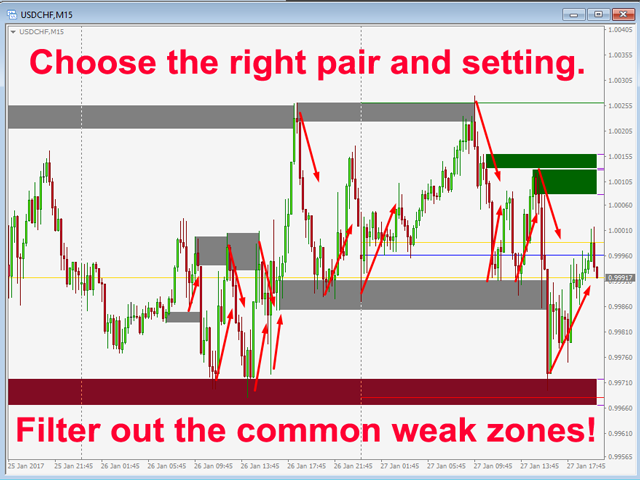
Why we filter strong and weak zones?
The greater the imbalance, the greater the move in price. The highest probability price levels are the ones with the greatest imbalance between buyers and sellers. Without any prior warning, it reverses on the spot and drops like a stone – those are the areas of major imbalances. A big number of sellers have entered the market at that price and outnumbered the buyers. It is also very likely that, in case of a sudden sell-off, more sellers were waiting to sell just around that level.
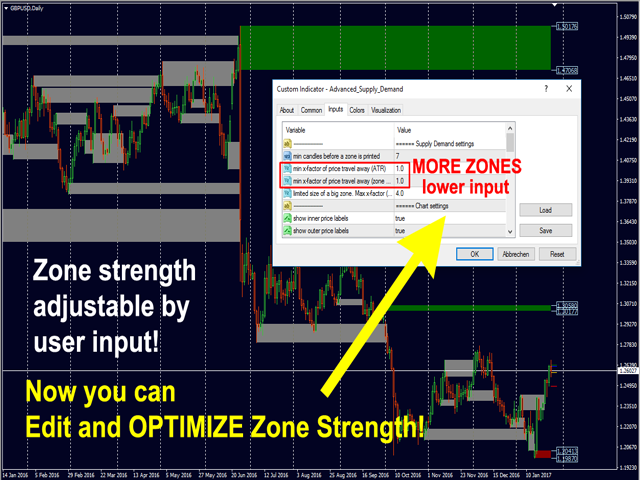
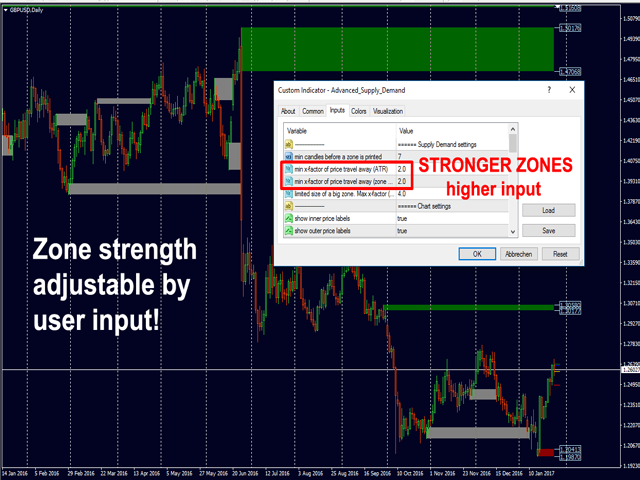
These are the indicator parameters you can edit the zone strength:
- min X-factor of price travel away (ATR)
- min Y-factor of price travel away (zone size)
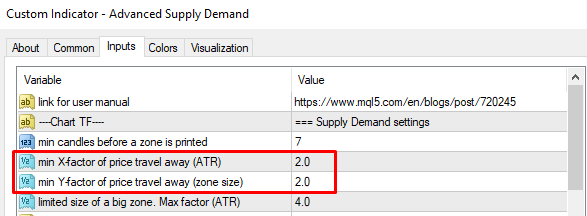
Minimum candles until price returns:
The trading opportunities exist when price moves back into those areas.
These are the indicator parameters you can edit the minimum number of candles until price revisit the zone:
- min candles before a zone is printed

Maximum zone size:
In an effort to reduce the risk on the trade the indicator will slice the size of a very big supply and demand zones, thereby cutting the distance of your stop-loss from entry and avoiding risky trades.
These are the indicator parameters you can edit the maximum size of a zone:
- limited size of a big zone. Max factor (ATR)

What means the first HIT?
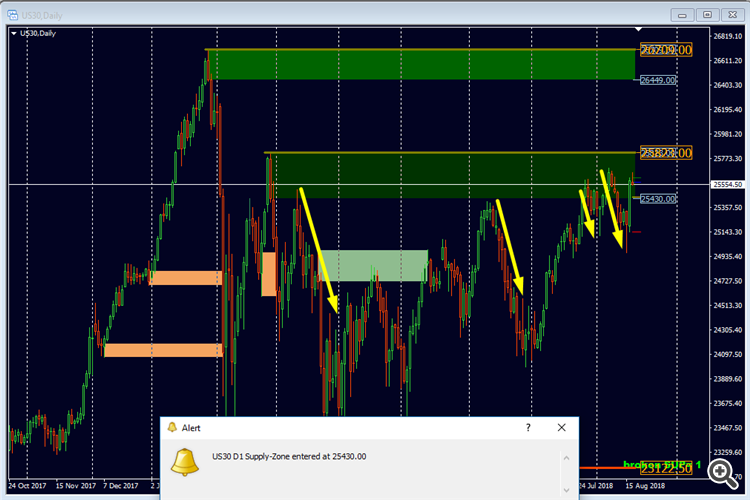
We see the Supply and Demand zones have the highest possibility of success on the first touch, but on the second touch the market breaks the area often easily.
These are the indicator parameters you can edit/see the color code of fresh and used/touched zones:
- color supply
- color supply used
- color demand
- color demand used

Why trade the first HIT?
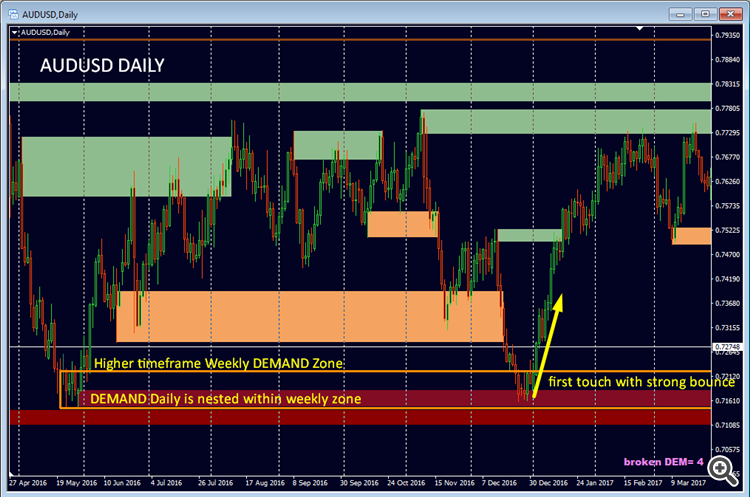
In the example below each time the price reaches the demand zone, sellers enter the market and cause a bounce by outnumbering the buyers, consuming buy orders. This is called order absorption. Often price bounces less back with each “touch” and eventually the demand level breaks.
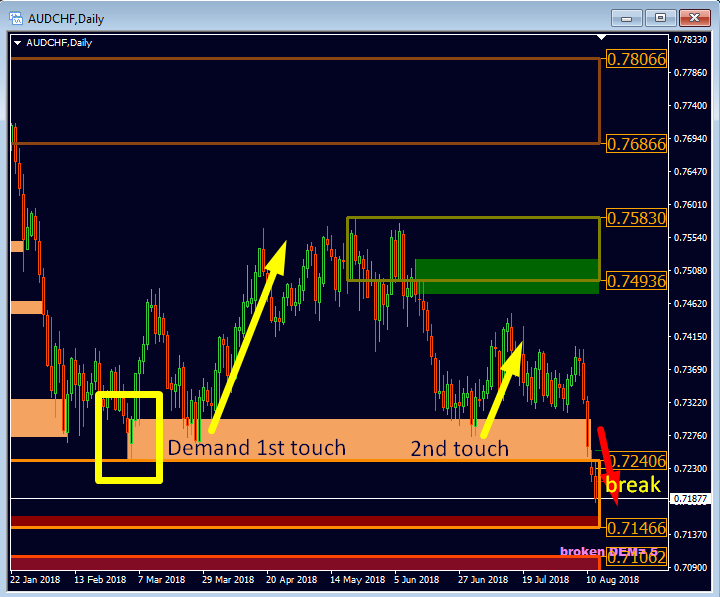
In the picture above we see the best bounce from the demand zone was on the first touch.
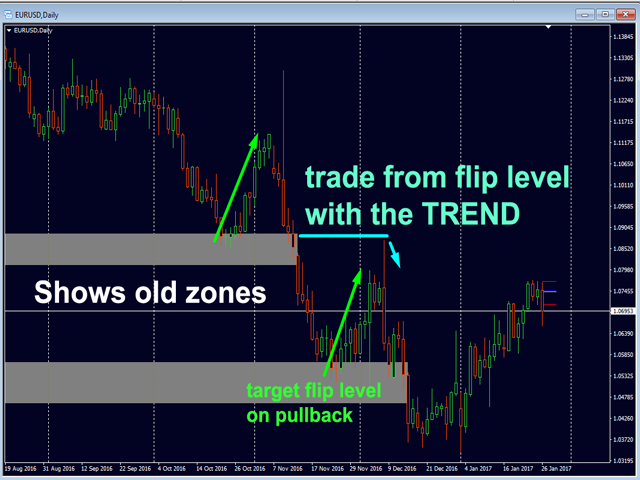
For what we show the old zones?
- When you want to see the history of old zones and learn from it.
- When you want to see false breakouts.
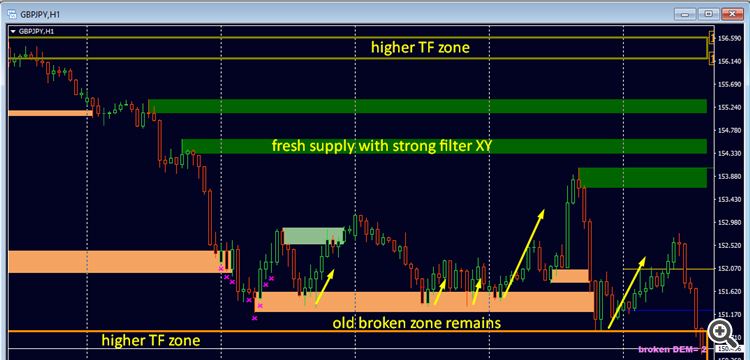
- When you want to use old zones for possible flip levels.
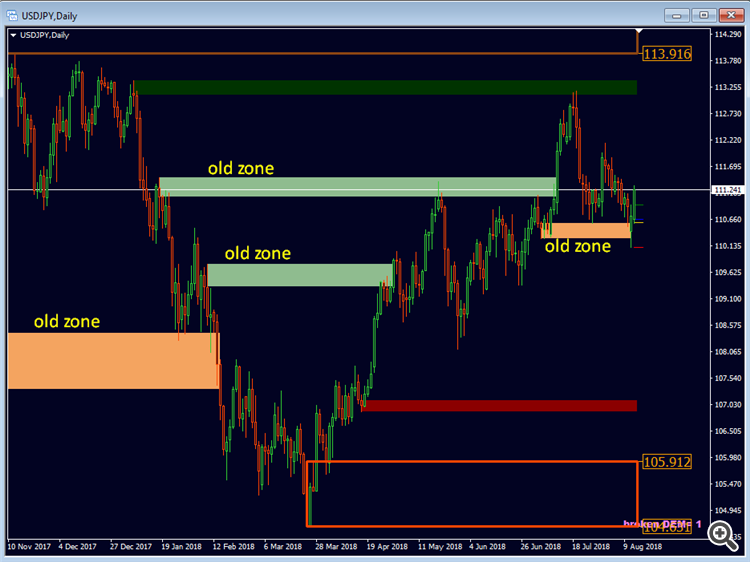
These are the indicator parameters you can edit/see the color code of old (broken) zones:
- show old zones
- color supply old
- color demand old


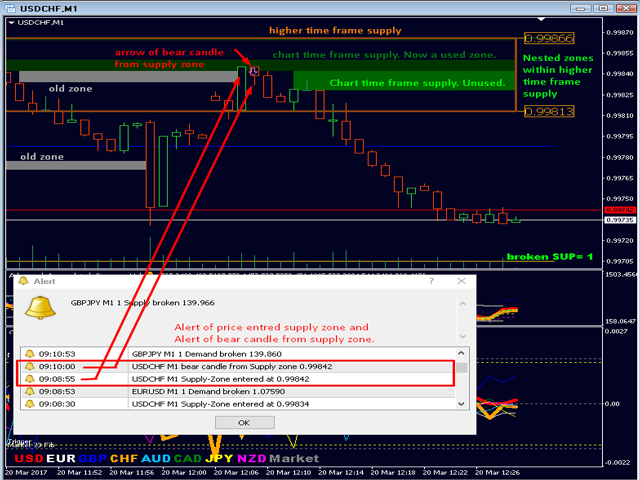
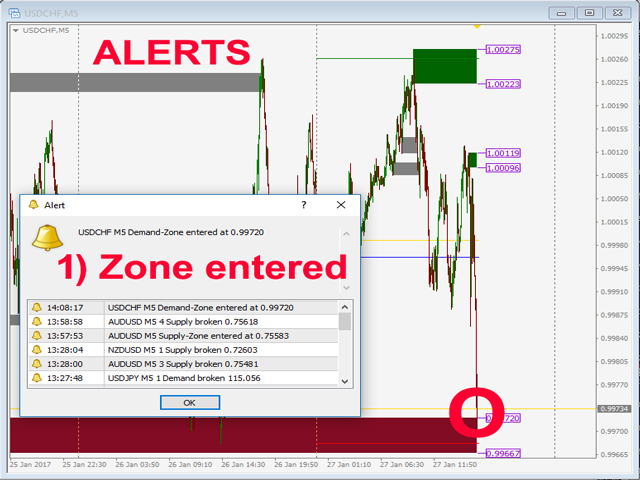
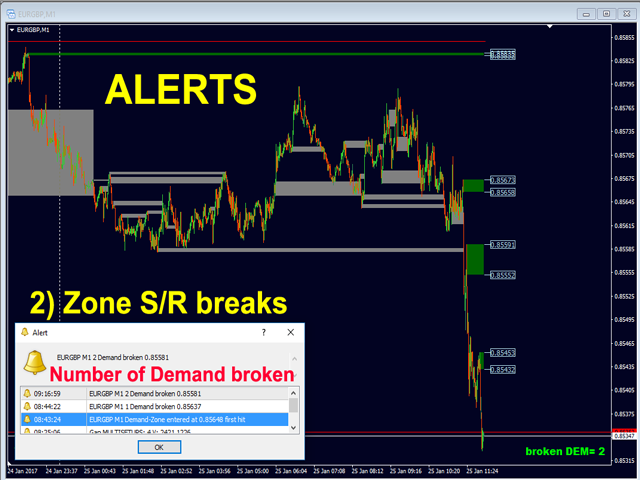
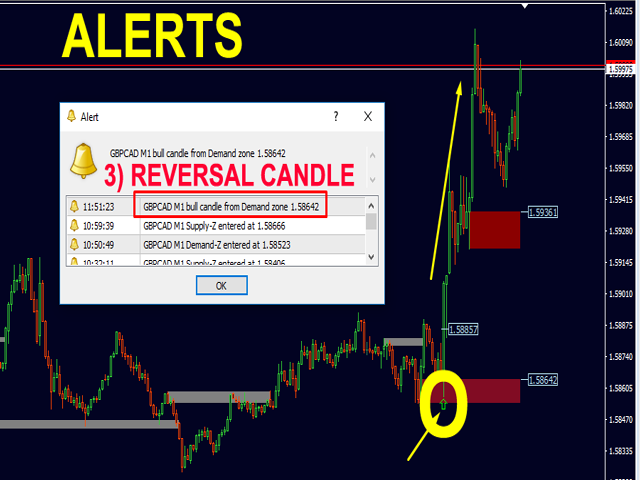
INTEGRATED ALERTS
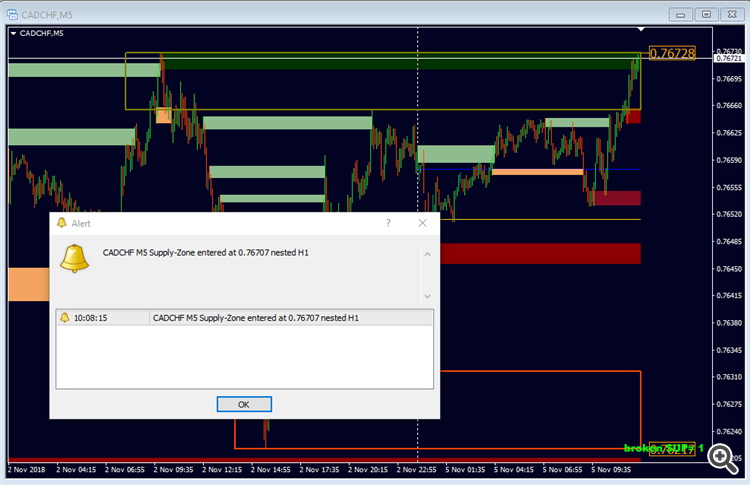
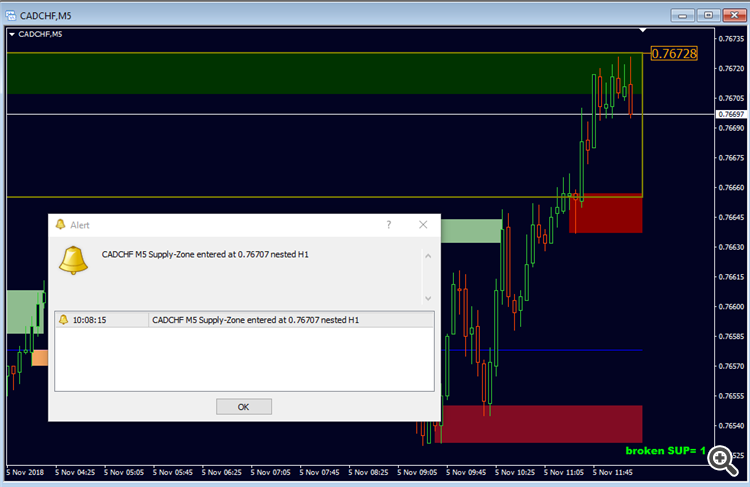
- alert zone hit
- room in points for HIT-alert (NEW version 2.80)
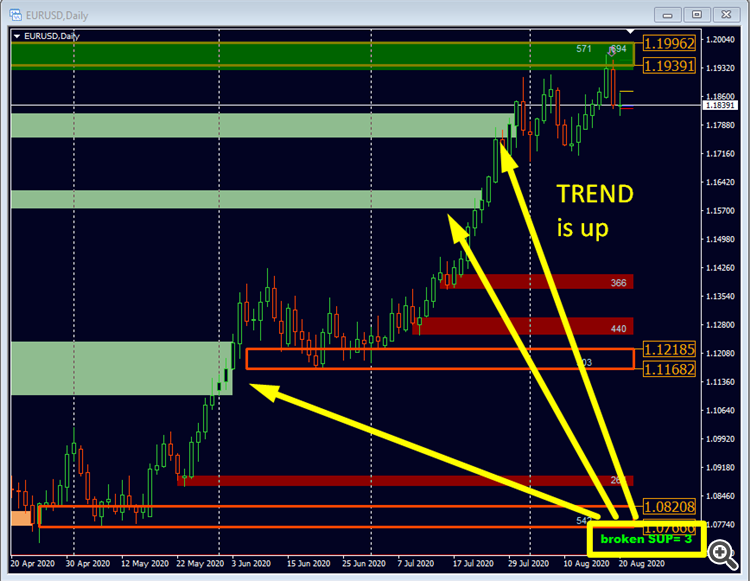
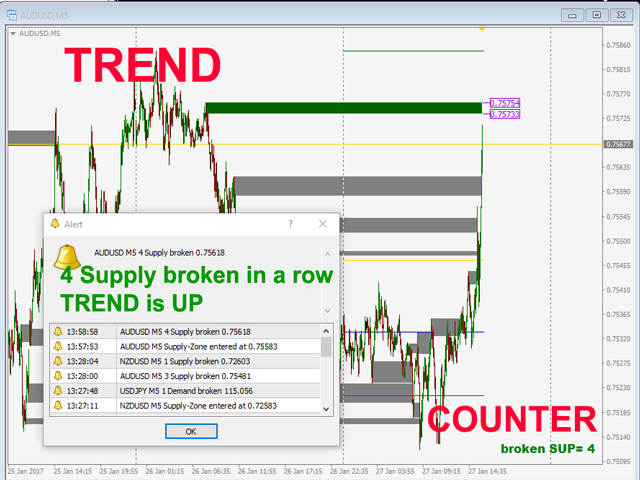
- alert zone break
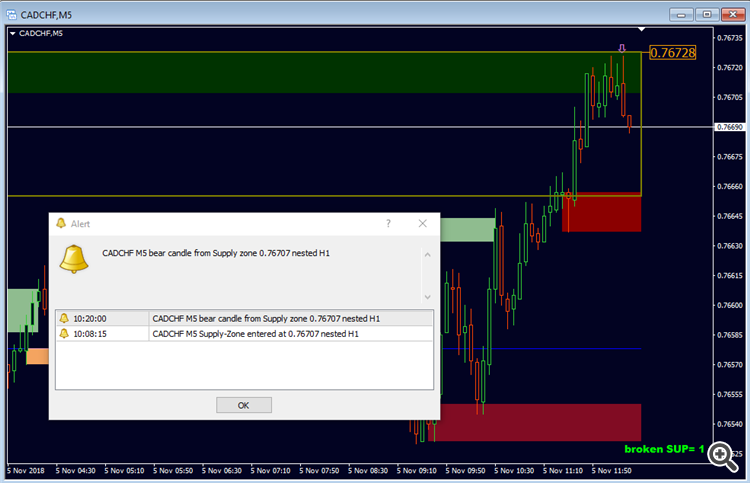
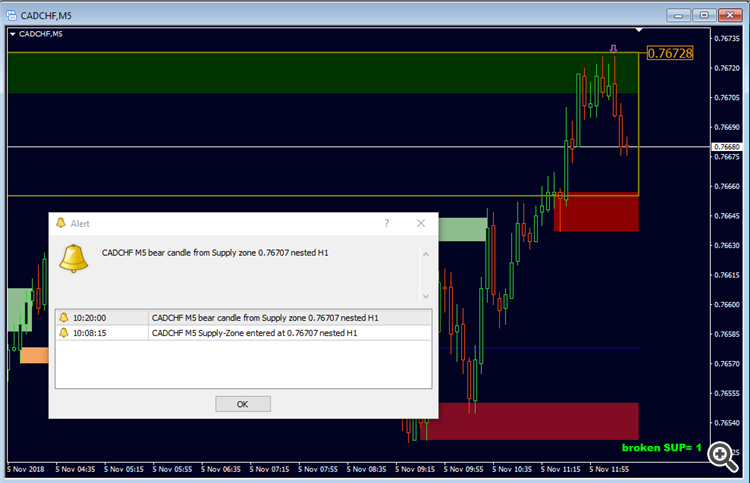
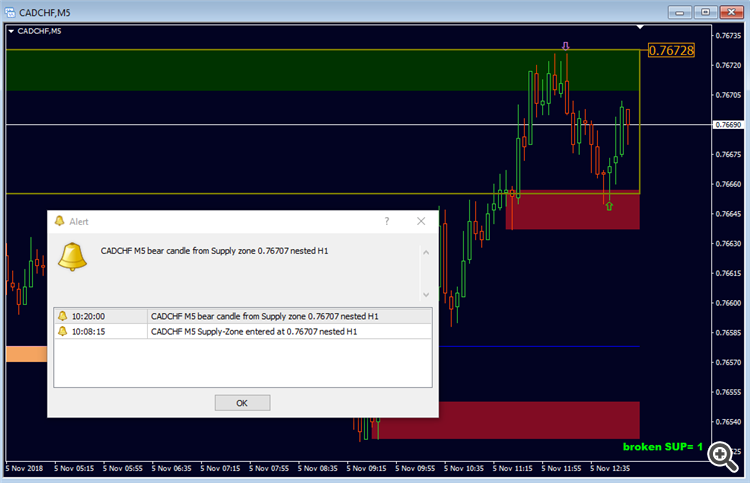
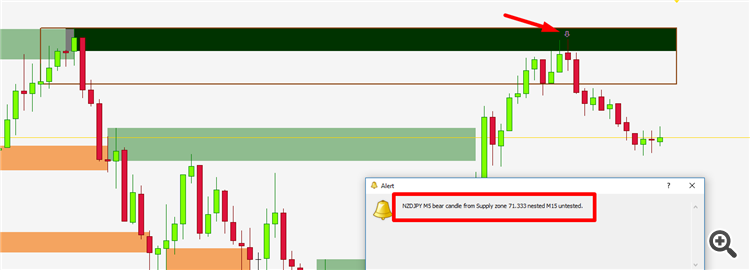
- alert reverse candle from zone

NEW with version 2.70 :
- Alert Fake Breakout (FBO)
- FBO min bar Size Point
- FBO bar close back % (20-90)
- FBO pattern bar count (1-3)
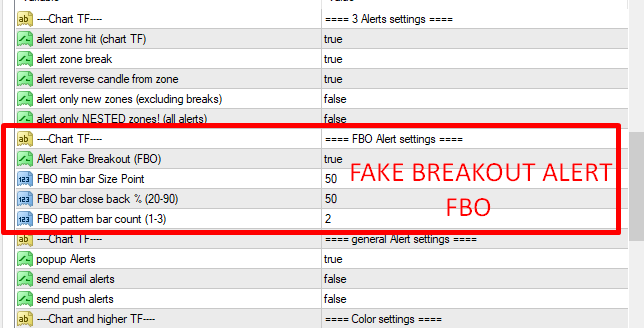
These are the indicator parameters you can manage popup, email, and push alerts:
- popup Alerts
- send email alerts
- send push alerts

MULTI TIMEFRAME APPLICATION
The Advanced Supply Demand indicator is a very powerful indicator that adds a new functionality.
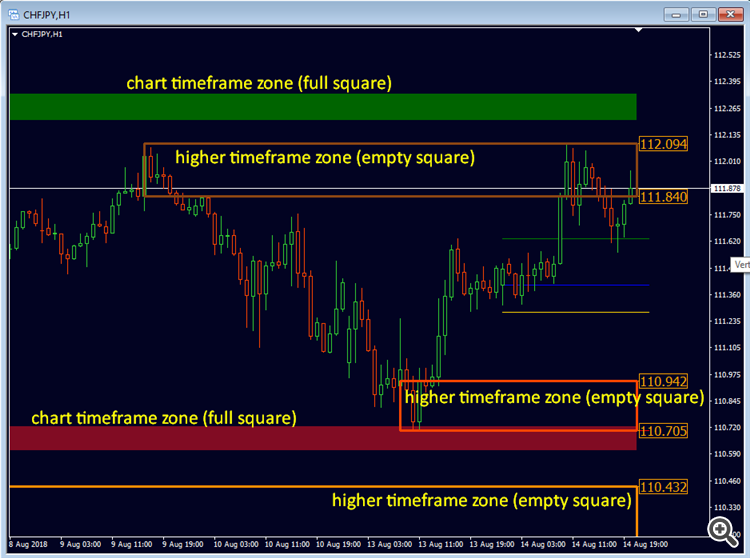
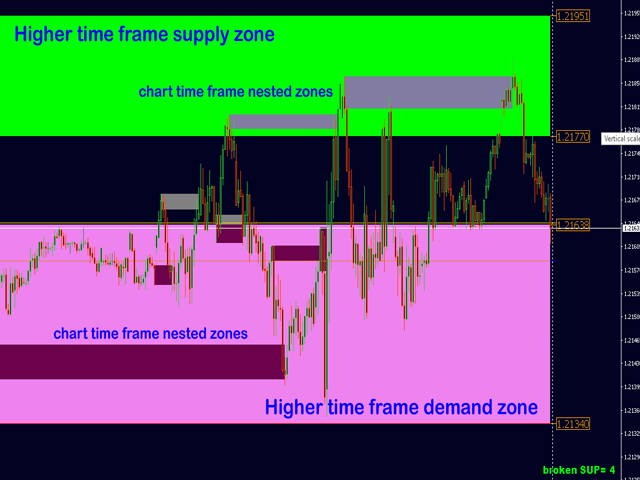
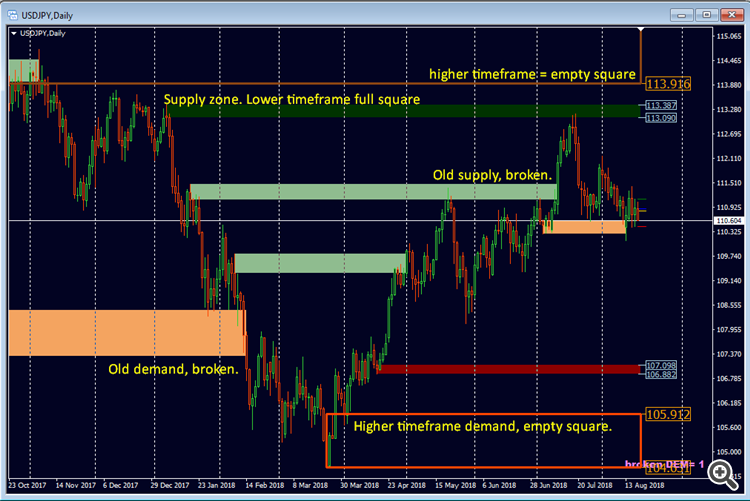
- S/D Zones of active timeframe are shown as colored rectangles.
- S/D zones of higher timeframe are shown as outlines.
- Displays supply/demand zones of multiple timeframes in one Chart.
- Helps you to see the bigger picture without constantly switching timeframes or trying to remember how the higher timeframe looked.
- It will speed up your top down analysis and help you to make faster and better trading decisions.
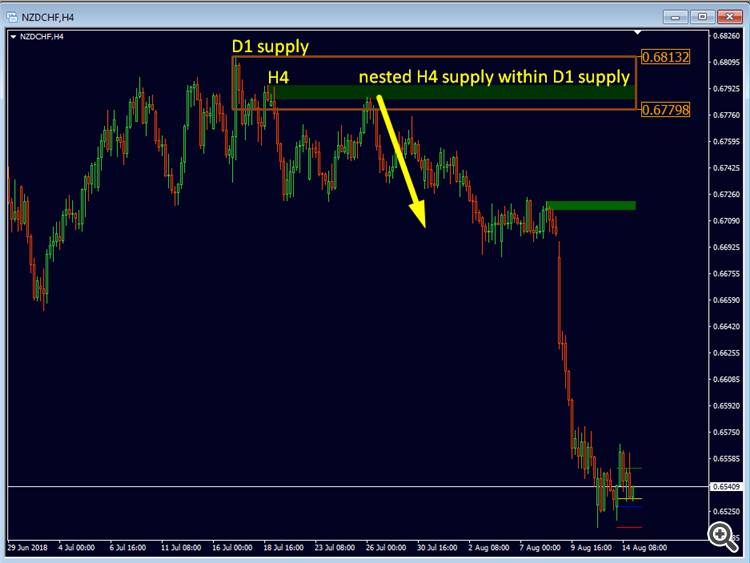
What is a NESTED Zone?
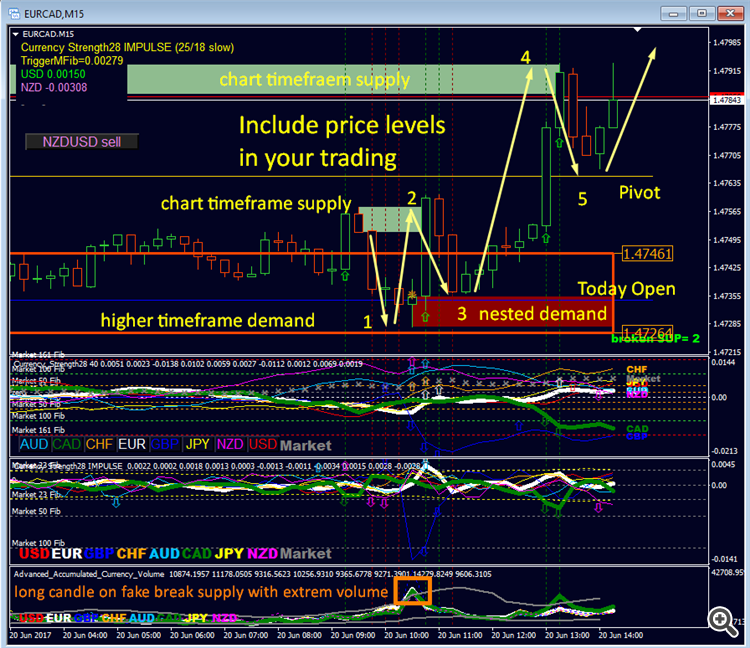
If you want to increase the success rate of supply and demand zone trades then look to find a lower time-frame zone contained within a higher time-frame zone so you are more likely to have a winning trade.
For example if you were looking only trade 1 hour zones which are contained inside 4 hour zones you would win on a significantly higher number of trades than if you were to just trade the 1 hour zones on their own with no additional confluence.
New features added! New Version
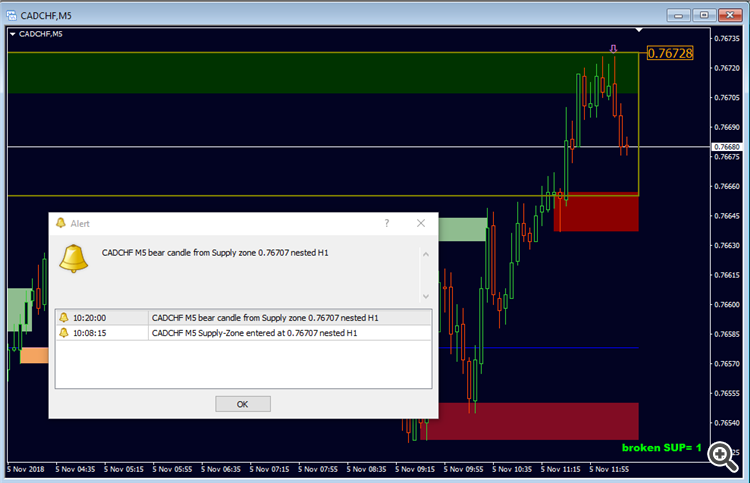
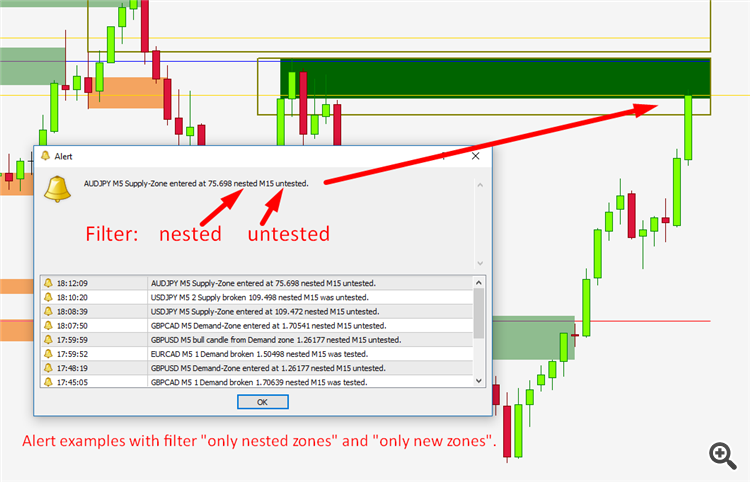
Added an optional filter to alert only nested zones. (The lower timeframe zone must be within a higher timeframe zone.)
It applies to all 3 actual alerts (hit - reverse - break).
If turned off the alerts will still tell if the alerted zone was nested or not.
New input:
- alert only NESTED zones! (within MTF)
It applies to all 3 actual alerts (hit - reverse - break).
If turned off the alerts will still tell if the alerted zone was nested or not.
New input:
- alert only NESTED zones! (within MTF)
How to trade a demand zone:
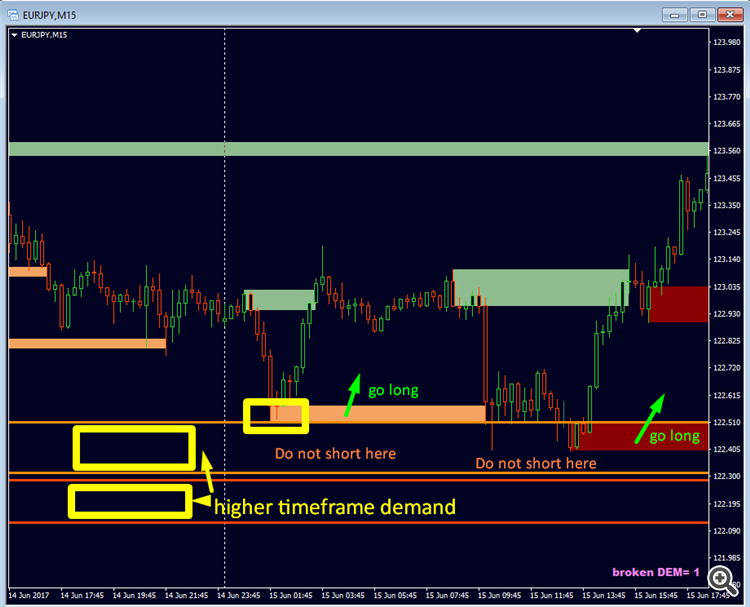
Do not short into higher timeframe demand but look for long signals. A short will be a go if demand is broken clearly (Not just a pin-bar with a fake breakout! A candle needs to CLOSE below demand.).
New Version
One great update!
1) Optimized some issue with old zones and counter.
2) As requested by a trader the reversal arrow will now only draw on nested zones if the filter "alert only nested" is true.
3) A new filter for alerts has been added to alert only if the zone is new or untouched. (Excluding break alert.)
New input:
- alert only new zones (excluding breaks)
4) If there is a strong trend the zones might not be in range with only 2000 bars look back. So this limit was set higher to 5000 bars. But we do not need to draw old zones so far. So a new candle limit has been added for old zones. That's why a new limit for old zones has been added. (Default = 1000 bars.)
New input:
- show Bars back for old zones
NEW Version
Added zone size info in point. As requested by trader.
A zone size in points will show in the right corner of the rectangles. The size of the higher timeframe is shifted a few bars to the left.
New inputs:
=== Chart settings
- show zone size (point)
- show zone size MTF (point)
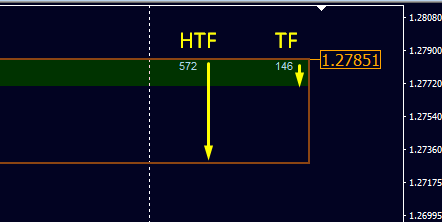
MAJOR UPDATE
=============
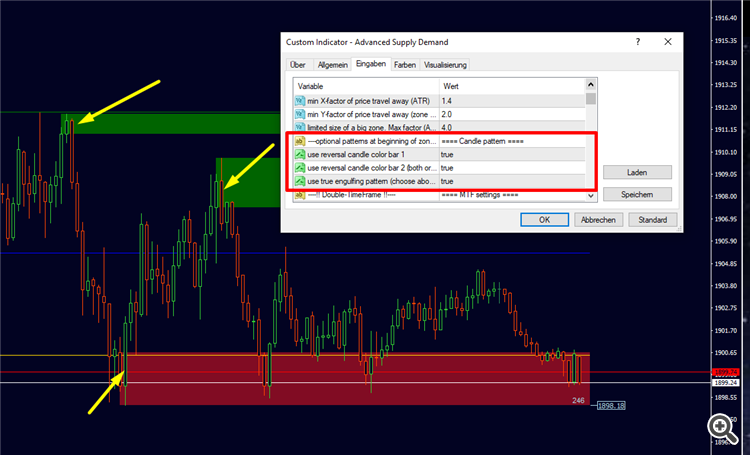
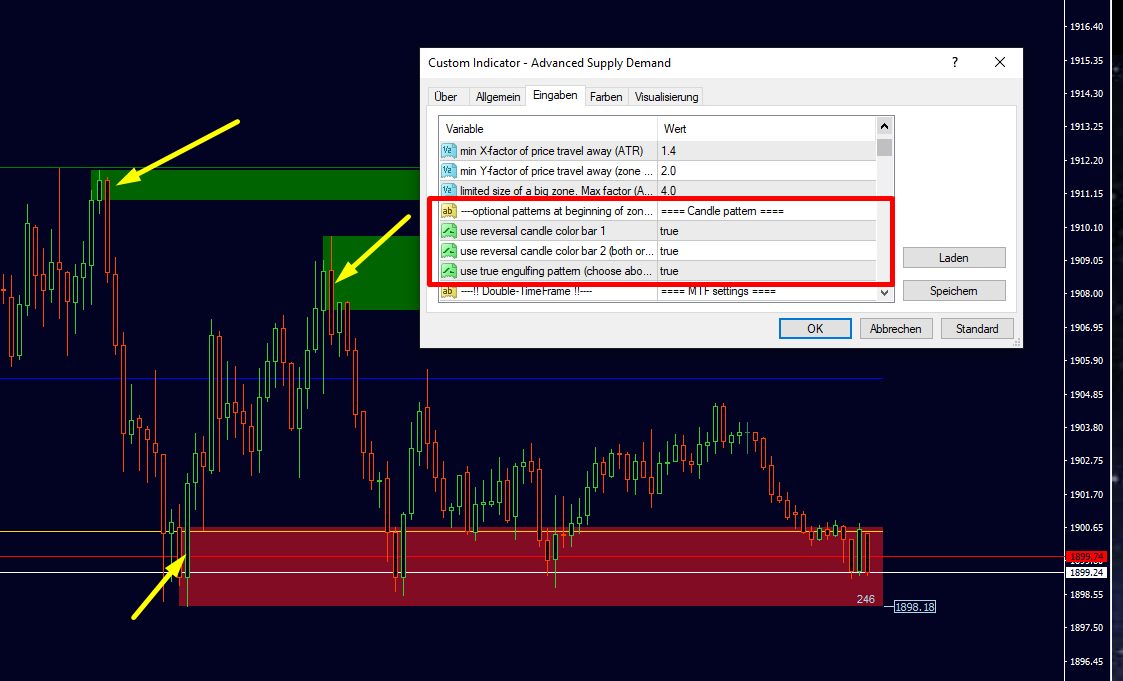
Now with ENGULFING BARS pattern!
Added optional: Supply and Demand zones with ENGULFING BARS pattern at the beginning of the zone.
Use reversal candle color for bar 1 or bar 2 (the one before). Use either one or both.
Use the true engulfing pattern for the above-mentioned bars. (Must choose above.)
By default the input is false. To use the function you must set the new inputs = true.
New inputs:
==== Candle pattern
+ use reversal candle color bar 1
+ use reversal candle color bar 2 (both or either)
+ use true engulfing pattern (choose above)
Updates are free! How to update:
Possible you have to wait 24 hours until it is available for update.
Terminal's showcase “Market” is updating once in 24 hours. If you don't see any updates - that means 24 hours haven't passed yet. You have to wait for showcase update.
If a new version of a product is available, you will see the corresponding message against it as well as the "Update" button.
Once this button is pressed, the new version will be downloaded. The new file replaces the previous one. Thus if you need, save the old version copy the file under a different name or outside of the directory [platform data folder]\MQL5\Market\.
To install updated version immediately delete the product from Navigator window (or better safe/drag the file to another folder outside of MT4), restart the terminal and try to install purchase from Terminal - Market - Purchased tab. This will be free and cost no activation.
Specials !
Discounts are available for MT4 versions, now.
Sale has started!
Profit now with a lower price. Limited offer with discount MT4.
Get it now with discount !
MT4 CLICK HERE
(MT5 CLICK HERE)
I will always help you if you have any questions.
Thanks, I wish you many green pips in the future.
Best regards, Bernhard
Just send an email to get more info and detailed description.
currencystrength28@gmail.com
Place a comment on the indicator page at mql5 so we can verify your access for our forum and other bonuses in the future.
Place a comment on the indicator page at mql5 so we can verify your access for our forum and other bonuses in the future.
THIS MANUAL WILL BE continuously be UPDATED !! So check again.
READ ALSO THE NEXT 20 COMMENTS.

