WaveMarkers

Wave Markers: adaptive swing map with a multi-timeframe dashboard

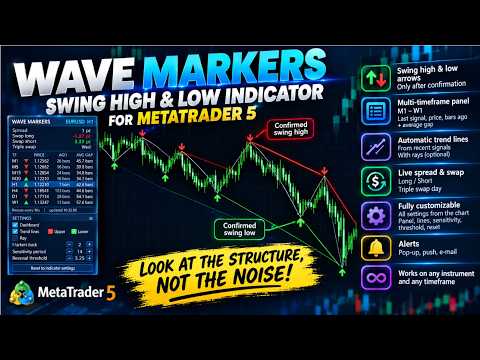
See the real structure of the market, not just noise: confirmed swing highs and lows, trend lines through them, and the picture on every timeframe from M1 to W1 in one panel.

What is it?

Wave Markers is a chart-structure indicator for MetaTrader 5. It finds the turning points of price (swing highs and swing lows), marks them with clean arrows, and builds the analysis tools around them: trend lines, a multi-timeframe table, live spread and swap readout.

It does not give "buy/sell" commands and does not promise results. It does one thing and does it carefully: it shows you where the market has actually turned, so you can read structure faster and more consistently.

Why this is not just another ZigZag

A classic ZigZag uses a fixed distance (points or percent) to decide what counts as a turn. That one number is wrong most of the time: too wide in a quiet market (you miss real waves), too narrow in a fast one (you get noise).

Wave Markers works differently:

  • The reversal threshold adapts to current volatility. It is measured in multiples of the market's own typical movement, so it stretches when the market is wild and tightens when it is calm. One setup behaves sensibly on majors, gold, indices and crypto, and on different timeframes.
  • A marker appears only after the reversal is confirmed. Price must actually move away from the extreme by the threshold. There is no look-ahead and no guessing a top while the candle is still running.
  • Confirmation lag is honest and predictable. It is defined by the threshold you choose: higher threshold means fewer, more major waves and a longer confirmation delay; lower threshold means faster, more frequent markers.
  • The logic is the same on every timeframe, so the dashboard compares like with like.

Key advantages

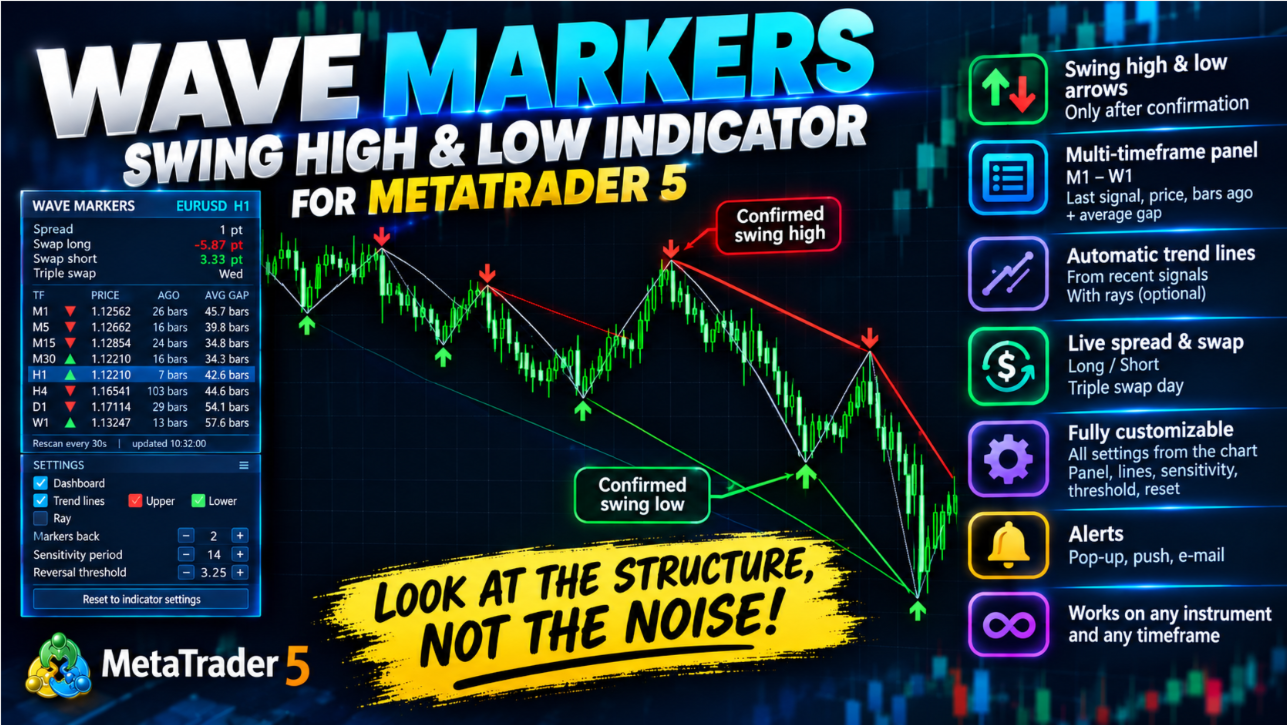
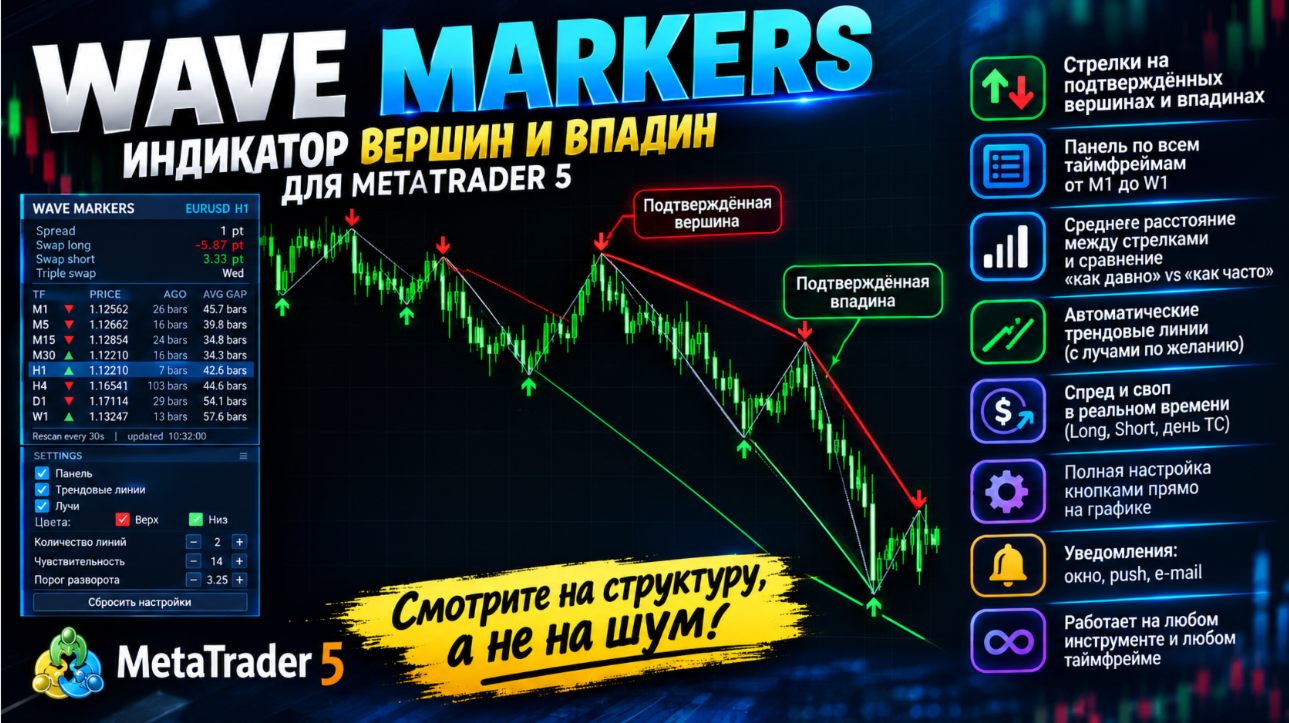
  • Clean, readable markers: a down-arrow on every confirmed swing high, an up-arrow on every swing low
  • Volatility-adaptive threshold instead of one fixed number
  • Automatic trend lines through the last markers, with optional rays
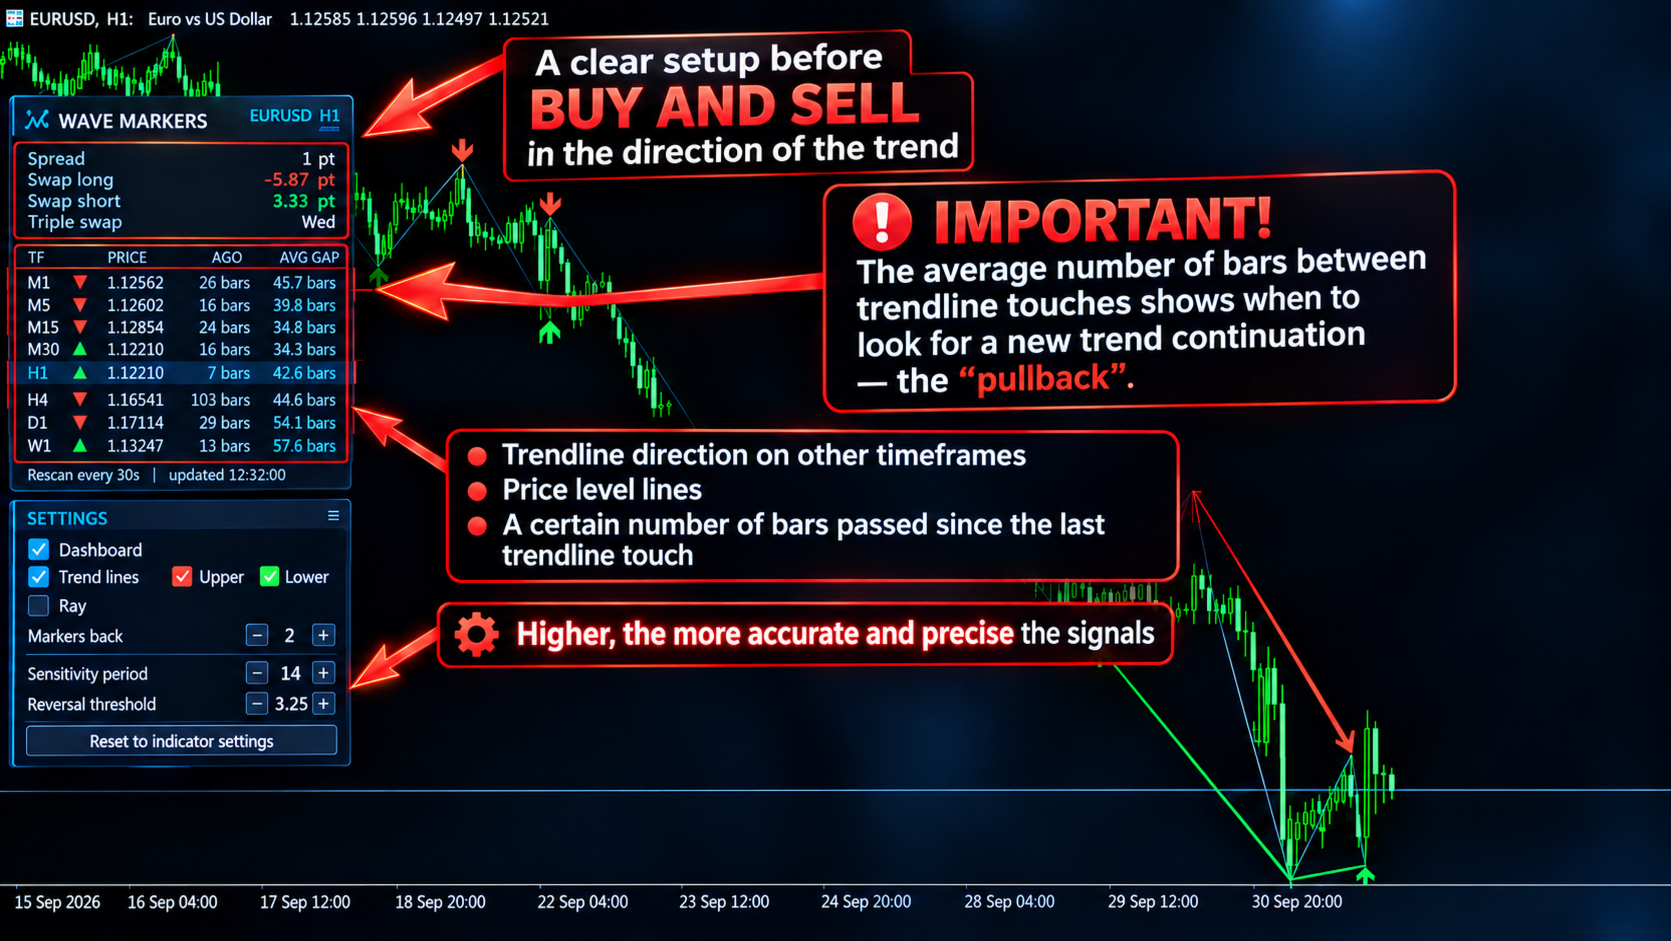
  • Dashboard for all timeframes M1 to W1: last marker direction, its price, how many bars ago it appeared, and the average gap between same-direction markers
  • Real-time spread and swap (long, short and triple-swap day) in the same panel
  • Missing history on other timeframes is requested and loaded automatically
  • Light on the terminal: chart markers are recalculated once per new bar, other timeframes on a timer instead of on every tick
  • Everything can be controlled right on the chart, without opening the settings window
  • Popup, push and e-mail alerts on each new marker
  • Works on any symbol and any timeframe

What you get on the chart

Markers and wave line. Arrows on confirmed swing highs and lows, optionally joined by a thin line, so the waves read at a glance.

Trend lines. The indicator draws trend lines through the last swing highs and, separately, through the last swing lows. You choose how many segments to draw: with 1 you get a line through the last two markers of that type, with 2 the last three markers joined by two lines, and so on. Lines can be extended to the right as rays or kept as segments that start and end exactly on the candle high or low.

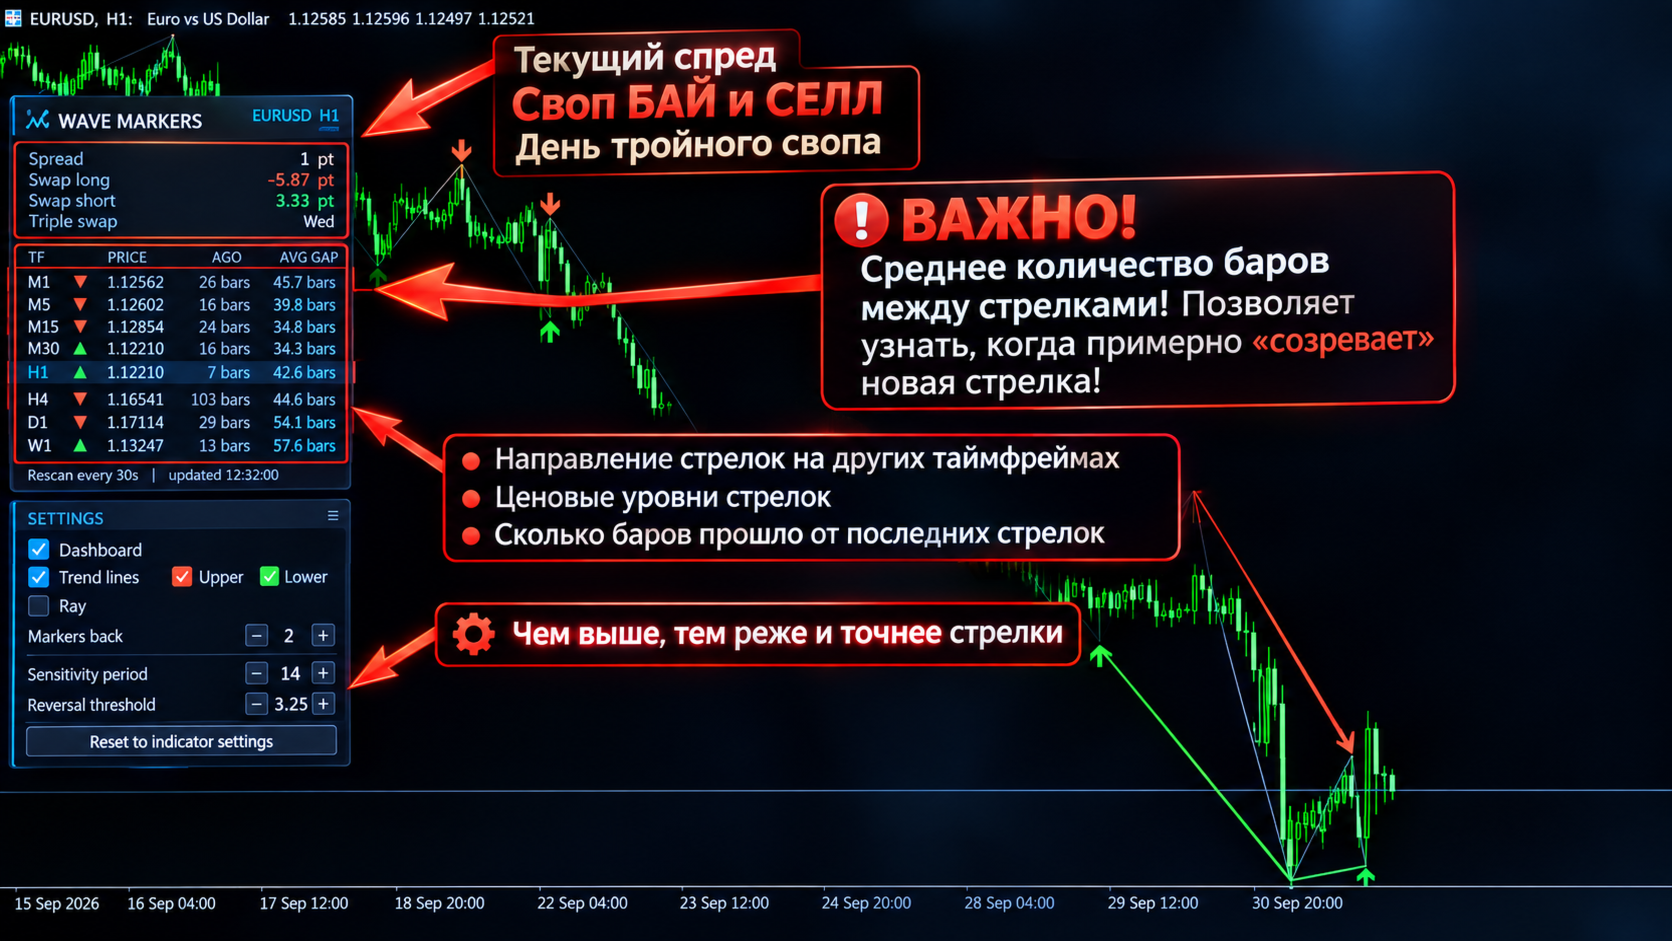
Multi-timeframe dashboard. One row per timeframe from M1 to W1:

  • the direction of the last marker (▼ high, ▲ low)
  • its price
  • how many bars ago it appeared
  • the average number of bars between markers of that direction over the analysed history

Comparing "how long ago" with "how long it usually takes" gives a quick feeling for where a timeframe is in its rhythm.

Spread and swap. Current spread updates with every tick and can be highlighted when it exceeds your level. Swap long, swap short and the triple-swap day are shown with the correct units for the instrument.

On-chart control panel

A compact settings card sits under the dashboard. You can:

  • show or hide the dashboard to see the part of the chart it covers
  • switch trend lines on or off, separately for upper and lower lines
  • switch rays on or off
  • change the number of lines with − / + buttons
  • change the sensitivity period and the reversal threshold with − / + buttons and see the result instantly
  • reset everything to the indicator settings in one click
  • drag the whole panel anywhere on the chart by its title bar

The values from the settings window are the starting point. Your choices on the chart then take over. Switching the timeframe keeps them, and the reset button brings back the originals.

How traders can use it

  • Read market structure: higher highs/lows, lower highs/lows, and where the structure breaks
  • Mark significant swing levels and trend lines automatically instead of drawing them by hand
  • Check several timeframes at a glance before taking a decision
  • Compare the marker rhythm across timeframes
  • Control spread and swap cost without leaving the chart

Wave Markers is an analysis tool. It does not guarantee any trading result, and every decision remains yours. Test any settings on a demo account first.

Good to know

  • Because a marker is confirmed only after price reverses, it always appears with a delay. That is by design, and the delay is controlled by the reversal threshold.
  • Other timeframes are loaded from your broker's history. If a timeframe shows "loading...", the terminal is still building its bars.
  • E-mail alerts require e-mail to be set up in the terminal (Tools → Options → Email).

Settings

Wave Markers

  • Wave markers: sensitivity period - how many bars are used to measure the market's typical movement. Shorter values react faster to changes in volatility, longer values are steadier. 14 is a good starting point.
  • Wave markers: reversal threshold, x sensitivity - how far price must move away from an extreme, in multiples of the typical movement, before a marker is confirmed. Higher means fewer, more major waves and later confirmation; lower means more markers, earlier, with more noise.
  • Analysis depth, bars (per timeframe) - how many bars back the indicator analyses on each timeframe. More depth means more history on the chart and in the dashboard statistics.

Chart Display

  • Show wave markers on chart - turns the arrows on or off.
  • Connect wave markers with a line - joins consecutive markers with a thin line so the waves are easy to follow.
  • Swing high marker color - color of the arrows on swing highs.
  • Swing low marker color - color of the arrows on swing lows.
  • Connecting line color - color of the line joining the markers.
  • Marker size (1-5) - size of the arrows.
  • Connecting line width (1-5) - thickness of the line joining the markers.

Dashboard

  • Show info panel on chart - shows the dashboard and the on-chart control card. If switched off, the indicator works only with the values from this settings window.
  • Panel offset X, px - starting horizontal position of the panel. You can drag it with the mouse afterwards.
  • Panel offset Y, px - starting vertical position of the panel.
  • Other timeframes re-check interval, sec - how often the other timeframes are re-checked. The current chart updates on every new bar; this controls the table only (minimum 5 seconds).
  • Spread highlight level, points (0 = off) - the spread value turns orange when it exceeds this level. Zero disables the highlight.

Alerts (current timeframe)

  • Popup alert on new wave marker - shows a terminal alert window when a new marker is confirmed.
  • Push notification on new wave marker - sends a notification to your phone (requires MetaQuotes ID in the terminal settings).
  • E-mail notification on new wave marker - sends an e-mail (requires e-mail setup in the terminal).

Trend Lines (through wave markers)

  • Draw trend lines through wave markers - master switch for all trend lines.
  • Lines through upper markers (highs) - draws lines through swing highs.
  • Lines through lower markers (lows) - draws lines through swing lows.
  • Number of lines per side (markers back, 1-50) - how many line segments to draw for each side. With 1, one line through the last two markers; with 2, the last three markers joined by two lines, and so on.
  • Extend all lines to the right (ray) - continues every line to the right edge of the chart. When off, each line starts and ends on its markers.
  • Upper line color - color of the lines through swing highs.
  • Lower line color - color of the lines through swing lows.
  • Line style - solid, dashed, dotted and so on.
  • Line width (1-5, solid style only) - thickness of the lines. MetaTrader applies widths above 1 only to solid lines.
  • Draw lines behind the chart - draws the lines under the candles instead of over them.
More from author
The indicator calculates the most probable trend stop/reversal areas, confident trend movement areas. The calculation considers: the rate of price change; the relative deviation angle of the chart; the average amplitude of price movements; the price leaving its "comfort zone"; the values of the ATR indicator. The indicator can generate an Alert when the price enter a stop/reversal area. Settings Draw the entire length? - draw the areas until the end of the chart; Show Stop UP-trend - display th
Buy and sell zones
Evgeniy Zhdan
5 (2)
Indicator for determining flat and trend. If the price is below any of the two histograms and two lines (red and blue), this is a sell zone. When purchasing this version of the indicator, MT5 version for one real and one demo account - as a gift (to receive, write me a private message)! If the price is above any of the two histograms and two lines (red and blue), this is a buy zone. MT5 version:  https://www.mql5.com/en/market/product/70409 If the price is between two lines or in the zone of
SuperTrend
Evgeniy Zhdan
2.5 (2)
The Supertrend Expert Advisor The Supertrend Expert Advisor with averaging elements. It has been developed during three months until I finally got good results. It is not a scalper. The minimum balance to start trading - 100 $. Is automatically adjusted to the 4 and 5-digit prices. Has an efficient risk management system. The lot and limit on the maximum lot is automatically calculated based on the settings specified in the EA. As a result, you have a complete automated trading system. Download
Stardust
Evgeniy Zhdan
StarDust searches for divergences in the values of several indicators considering them as signs of flat and enters the market if a relatively steady trend is detected. The Expert Advisor trades "basic" symbols with a low spread. The best results are achieved on М15. The EA automatically adjusts to 4 and 5-digit quote flows. Settings Comment_to_orders – comment to a placed order. The field can be left blank if no comment is required. MM – enable money management with automatic setting of a worki
Top Floor
Evgeniy Zhdan
The EA catches the price when it moves against the trend in an effort to open an order in an opposite direction (direction of the main trend). Screenshots illustrate examples of entries and the strategy gist. The EA uses stop losses depending on values of ATR. Settings: Lot_ - if Risk_ = 0, the EA will trade this lot; Risk_ - risk per one trade. Stop loss is taken into account; koeff_ATR - coefficient multiplied by the ATR value to calculate stop loss (the bigger the value, the bigger stop loss
FastBoom
Evgeniy Zhdan
The FastBoom EA finds the most probable points of price pullback/reverse and places an order. It places averaging orders if the price moves further against take profit. Settings of the EA: Lots - initial lot; LotExponent - multiplier for following orders (Martingale). 1 - no multiplier. TakeProfit - take profit in points; Stochastic Settings InpKPeriod - K Period of Stochastic InpDPeriod - D Period of Stochastic InpSlowing - Stochastic Slowing LevHigh - level for sell positions of Stochastic L
The Expert Advisor calculates the double/triple divergence of volumes, and starts trading. It uses a unique formula of lot calculation, which greatly improves stability of trading. Recommended TF - 1h. Currency pair - EURUSD , but the EA can be used on any trading instruments which are not subject to high volatility. Settings mode - trading direction can be set manually; close - order close level (details on the screenshot); Step between orders - step between orders in points; Maximum orders -
OrderOnLine
Evgeniy Zhdan
The Expert Advisor opens orders from the horizontal line, the a trader can set on any level by dragging using the mouse or by changing the line properties. For example, when a horizontal line is above the current price, the EA will open a Buy order once the horizontal line is reached. And vice versa: If the line is below the current price, the EA will open a sell order once the line is crossed. A buy crossover of the line is: opening of the current candlestick below the horizontal line; the curr
SellerATR
Evgeniy Zhdan
5 (1)
The Expert Advisor only sells. Recommended currency pairs : EURUSD; GBPUSD; USDCHF; USDJPY; USDCAD; AUDUSD; EURGBP; EURAUD; EURCHF; EURJPY; GBPCHF; CADJPY; GBPJPY; AUDNZD; AUDCAD; AUDCHF; AUDJPY; CHFJPY; EURNZD; EURCAD; CADCHF; NZDJPY; NZDUSD. Timeframe: H1. Percent% manages closing both loss-making and profitable deals based on the account overall status. Using the EA on 23 symbols mentioned above allows the robot to cope with the drawdown in case of a long trend. While positions on some pairs
Illusion
Evgeniy Zhdan
3 (2)
The Illusion EA uses the probability theory - after a series of consecutive virtual losses - i.e. right during a flat the EA already starts trading in the trend. In addition, the EA considers the ratio of bullish/bearish candles on the higher timeframes to determine the greatest probability of the price movement direction. Only 1 order can be opened at a time. In case of a loss the following order will be placed with an increased lot (the multiplication coefficient is set in the parameters). The
The indicator plots a trend line and determines the levels for opening trades, in case the price goes "too far" away from the trend level. More detailed information is available in the screenshots. Settings Away from the trend line - distance from the trend line to the trades level; Arrow Signal for deals - enable displaying an arrow when the price reaches the trades level; Size of Arrow - size of the arrow; Alert Signal for deals - enable generating alerts when the price reaches the trades lev
Turbina
Evgeniy Zhdan
5 (4)
The axiom of the Forex market is that any trend will be broken. The Expert Advisor determines trend direction (the pink line), and calculates levels for opening opposite orders depending on the settings. The value of Away from the trend line for Deal will be different for each pair and timeframe, depending on the volatility of the trading instrument. Next orders can be opened with an increased lot (a static lot is used by default). See the screenshots to understand the idea of the Expert Advisor
Odysseus
Evgeniy Zhdan
The Expert Advisor determines the moments of strong movements and opens a position in the direction of the most probable price movement. The strategy always uses stop loss and take profit. Several independent orders can be in the market (the maximum number is set in parameters). The goal of the EA's underlying trading system is the quantitative excess of the number of profitable deals over the number of losing ones. Recommended: EURUSD 5m; GBPUSD 5m; USDJPY 5m. The Expert Advisor is able to work
Vise
Evgeniy Zhdan
Vise is a trend indicator. The upper and lower lines follow the price showing the prevailing price direction. Frequent breakthroughs of the upper line indicate a bullish trend, while frequent breakthroughs of the lower line indicate a bearish one. Parameters Points for UpLine - initial number of points for the upper line; Points for DownLine - initial number of points for the lower line. During the breakthrough of the upper level (line), this level shifts upwards by Points for UpLine. If the up
Twinkle
Evgeniy Zhdan
Twinkle is a trend-based scalper using stop loss and take profit invisible to the broker. The EA does not look for trend reversals. The EA catches strong market movements and opens orders in the direction of the trend. Your broker will not see the order closing levels. The EA closes orders independently when reaching the take profit or stop loss levels specified in the settings. Recommended trading symbols: EURUSD M5, GBPUSD M5. ECN accounts with 5 digits quotes are recommended. Expert Advisor
Shine
Evgeniy Zhdan
4.75 (4)
This Expert Advisor implements elements of the Martingale system. Orders are opened at a specified distance from the moving average. The Parabolic SAR indicator and certain technical details are used to ensure the most accurate entries. The EA is highly customizable. It is recommended for simultaneous use on 4 currency pairs: EURUSD M15; GBPUSD M15; USDJPY M15; USDCAD M15. Despite good stability, it is advisable to disable the EA operation during the days rich in news releases. Configurations P
LuckyCase
Evgeniy Zhdan
LuckyCase is an Expert Advisor with martingale elements. The EA strategy is based on a significant "deviation" of the price from SAR inadicator and the Bands levels breakthrough point. The money management system is an essential part of the EA. It starts working after a trade is opened. Trades are closed after accumulating specified points of market orders, by deposit % or after an opposite side of the channel is broken through. The default EA settings are meant for: EURUSD M15; USDJPY M15. The
Elize
Evgeniy Zhdan
The Elize Expert Advisor has been designed to work with the EURCHF currency pair. It considers the peculiarities of this trading instrument, its behavior and dependence on the behavior of other currencies. In particular, when the currencies of the European countries (EURUSD, GBPUSD, EURNOK, EURCHF) move in the same direction, the EA starts its operation and opens a deal in the trend direction of the European currencies. In the event of price rollbacks, the EA uses a unique method for making the
AllTrendLines
Evgeniy Zhdan
4 (1)
Brief Description of the All Trend Lines Indicator The indicator analyzes the wave structure of the market. What it displays on the chart: First. Wave pivots (semaphores) • Red markers – wave highs • Yellow markers – wave lows • Yellow-green markers – additional local extremes Second. Trend lines • Purple/blue lines – trends based on highs (resistance/support) • Beige/green lines – trends based on lows • Lines are built automatically by connecting wave pivots of the same type Third. Main trend
FastTraffic
Evgeniy Zhdan
The Expert Advisor has been specifically developed for trading gold (Spot Gold). The strategy is based on Fibo levels calculated from the previous (first) candle High/Low and the width of the current and lower timeframes channel. If important Fibo levels of different orders are located in a single price channel (within a spread), the EA defines this channel as the target for price movement and starts operation. Martingale and averaging are not used. Each order is independent and is accompanied b
Jazz
Evgeniy Zhdan
The algorithm of this Expert Advisor determines the significant price levels, where the trend often turns into a flat or reverses. Stochastic Oscillator serves as an additional filter of overbought/oversold zones. The EA sets stop loss and take profit after opening an order. The underlying trailing strategy applies a trailing stop. The EA is recommended for simultaneously use on three trading instruments: EURUSD M5, GBPUSD M5, EURCHF M5. Settings: Comment to order - comment to orders. MaxRisk -
Panther
Evgeniy Zhdan
The Expert Advisor looks for technical analysis patterns formed on the higher (hourly) timeframe to start working on the 5-minute chart. Technical analysis patterns used: double top/double bottom, head/shoulders, flag, expanding/narrowing triangles. The Relative Vigor Index technical indicator is used as the filter for opening deals. It is based on the idea that on the bull market the closing price is, as a rule, higher, than the opening price. It is the other way round on the bear market. This
Spook
Evgeniy Zhdan
The Expert Advisor calculates the divergence on the current and higher timeframes. In case the divergences coincide, the EA starts its operation. Deals have strict take profit and stop loss levels. Each deal is managed by trailing stop. The strategy involves the use of a tight stop-loss. Therefore, losing deals and/or series of losing deals are not uncommon. This EA is not suitable for those who have difficulties coping with losing deals. The EA is recommended for simultaneous use on the followi
Grand
Evgeniy Zhdan
The Expert Advisor has been developed specifically for the features of the CHFJPY currency pair. The EA's algorithm determines the direction of the current trend and starts operation. In case of a price reversal within the current trend, the EA adds additional orders. If trend changes, the EA starts to work in the direction contrary to the initial grid of orders. If there were no conditions for closing orders and the trend direction changed again, the EA continues to work with the "first" grid o
Intensive
Evgeniy Zhdan
The Expert Advisor algorithm determines on daily charts those candlestick patterns, which set the intraday trading direction. The trading EA determines how long the price is moving in overbought/oversold zones and starts working in the direction of the expected trend movement. Each position is accompanied with a tight stop loss and take profit. Only one active position can be open in the market. The EA was developed and tested using 99% quality quotes. The Expert Advisor has a built-in news filt
Slender
Evgeniy Zhdan
The strategy of this Expert Advisor is based on a hedging system, which implies placing opposite orders. The EA algorithm determines trend beginning and opens a position in the trend direction. In case of a wrong entry, the EA tries to neutralize the drawdown through opposite (hedging) orders at a preset interval (Coefficient of counter orders). Orders are closed when one of the two values ​​is reached - profit in percent or profit in points. The EA does not use lot increase. The EA wast tested
Dreamer
Evgeniy Zhdan
Советник работает по принципу хеджирования с периодическими "перекосами" в сторону трендовых направлений. Направления тренда советник определяет на основании стандартного индикатора Parabolic Stop and Reverse system (SAR). Уникальная стратегия установки балансирующих позиций позволяет избегать больших просадок даже при самых не благоприятных рыночных условиях. Параметры по умолчанию рекомендуется использовать на торговом инструменте: GBPJPY 15m. Разработка и оптимизация параметров производились
Snoot
Evgeniy Zhdan
5 (1)
This Expert Advisor works using a grid in the direction of a trend movement with the step between opened positions defined in the settings. The positions are closed by the total take profit. The Parabolic SAR standard indicator is used to filter order opening, which comes in the MetaTrader 4 package. The EA has been developed and tested using 99,9% quality of quotes. Operation of the EA in real time can be viewed in the signals . The best trading results have been achieved on CHFJPY M15. Settin
Solipsism
Evgeniy Zhdan
The Expert Advisor builds channels based on the data obtained using ATR and MA indicators according to the equations: Upper channel border = MA + ATR * (FIBO); Lower channel border = MA - ATR * (FIBO), where FIBO has the following values: Style of Trade - Aggressive = 1.61852; Style of Trade - Average = 3.26704; Style of Trade - Calm = 4.85556. Trades are opened inside the channel with the intervals defined in the settings. Long and short positions are opened independently. Positions are closed
The trading statistics indicator notifies the trader of the aggregate income of the trading account for different time intervals. The indicator has wide display settings on the graph. There is a choice of one of the two display languages on the chart- English and Russian. Settings Indicator language (ENG, RUS) - Select the language to display on the chart; To control the magic (-1: any magic) - Entering the Magic for control (-1: any Magic); Angle of indicator tie - Selecting the angle of the c
Filter:
No reviews
Reply to review