WaveMarkers

Wave Markers: 적응형 웨이브 맵과 멀티 타임프레임 대시보드

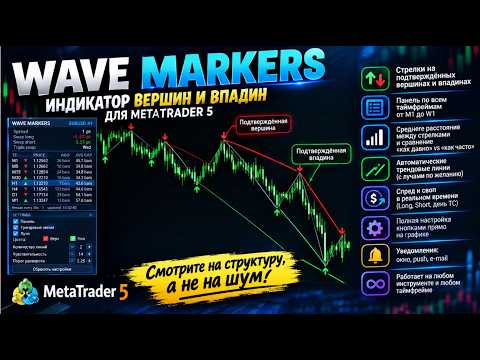
노이즈가 아닌 시장의 진짜 구조를 보세요. 확정된 스윙 고점과 저점, 이를 잇는 추세선, 그리고 M1부터 W1까지 모든 시간대의 상황을 하나의 패널에서 확인할 수 있습니다.

이 인디케이터는 무엇인가요

Wave Markers는 MetaTrader 5용 차트 구조 인디케이터입니다. 가격의 전환점(스윙 고점과 스윙 저점)을 찾아 깔끔한 화살표로 표시하고, 그 주변에 실용적인 도구를 제공합니다. 추세선, 전체 시간대 표, 그리고 실시간 스프레드와 스왑 표시입니다.

"매수"나 "매도" 지시는 내리지 않으며, 어떤 결과도 약속하지 않습니다. 한 가지 일을 꼼꼼하게 합니다. 시장이 실제로 어디에서 반전했는지 보여 주어, 구조를 더 빠르고 일관되게 읽을 수 있도록 돕습니다.

흔한 ZigZag와 다른 이유

전통적인 ZigZag는 무엇을 전환으로 볼지 고정된 거리(포인트 또는 퍼센트)로 결정합니다. 이 하나의 숫자는 대부분의 경우 맞지 않습니다. 조용한 시장에서는 너무 커서 실제 파동을 놓치고, 빠른 시장에서는 너무 작아서 노이즈를 잡아냅니다.

Wave Markers는 다르게 작동합니다.

  • 반전 임계값이 현재 변동성에 맞춰 자동으로 조정됩니다. 임계값은 시장 자체의 "전형적인 움직임"의 배수로 측정되며, 시장이 거칠 때는 넓어지고 잔잔할 때는 좁아집니다. 같은 설정이 주요 통화쌍, 금, 지수, 암호화폐, 그리고 서로 다른 시간대에서도 합리적으로 동작합니다.
  • 반전이 확정된 뒤에야 마커가 나타납니다. 가격이 극값에서 임계값만큼 실제로 벗어나야 합니다. 미래를 미리 엿보지 않으며, 캔들이 진행 중인데 고점을 짐작하지도 않습니다.
  • 확정 지연이 정직하고 예측 가능합니다. 지연의 크기는 선택한 임계값이 결정합니다. 임계값이 높으면 파동은 적고 더 중요해지며 확정은 늦어집니다. 낮으면 마커가 더 자주, 더 빠르게 나타납니다.
  • 모든 시간대에서 로직이 동일합니다. 그래서 대시보드는 같은 기준끼리 비교합니다.

주요 장점

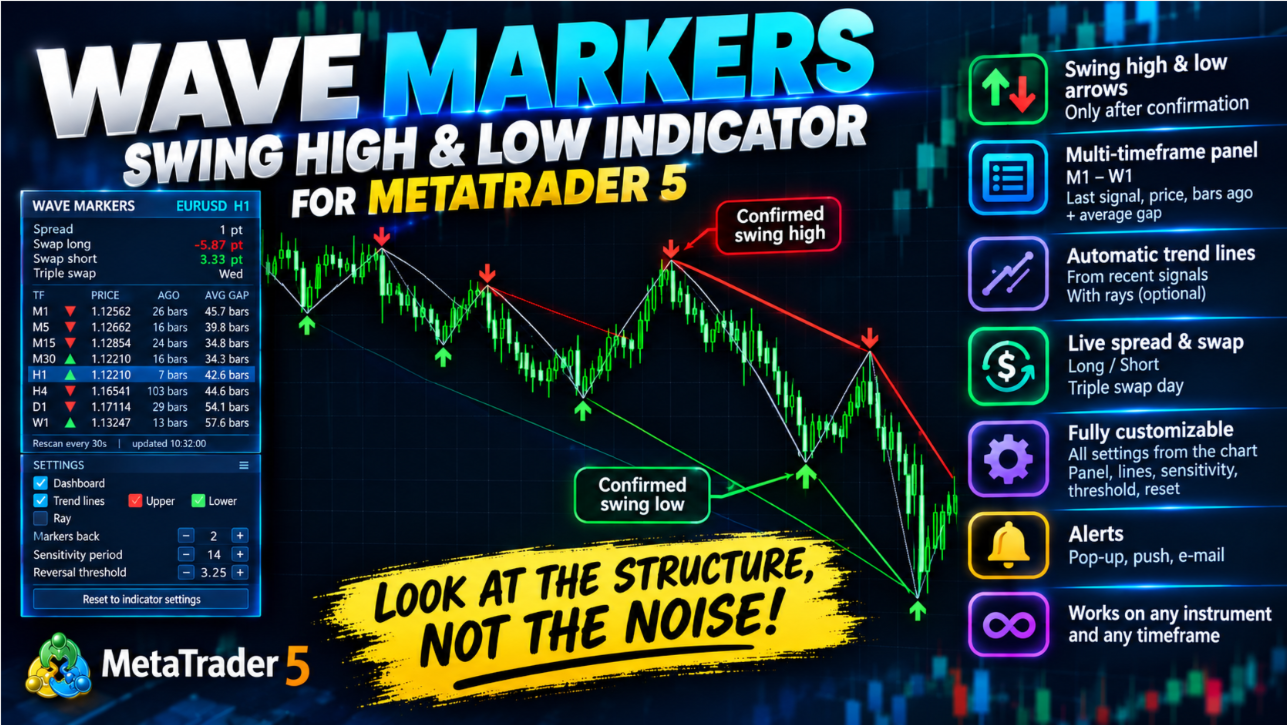
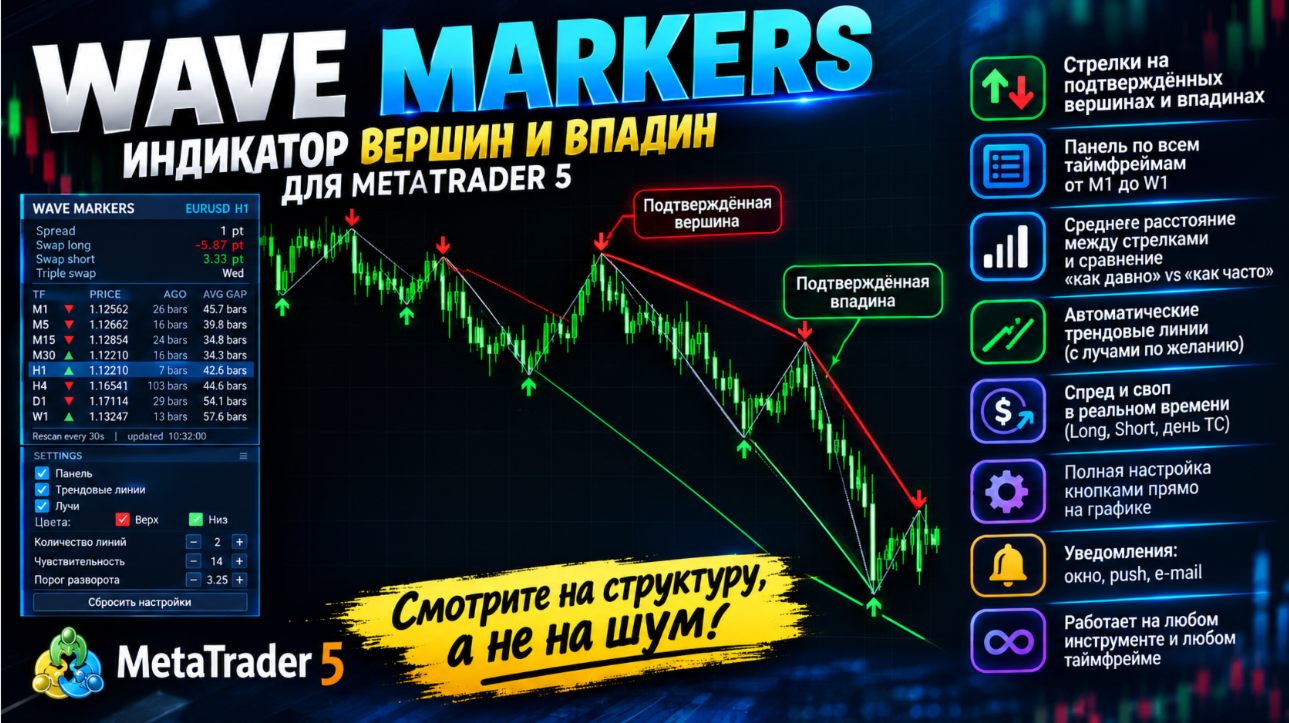
  • 깔끔하고 읽기 쉬운 마커: 확정된 스윙 고점에는 아래쪽 화살표, 스윙 저점에는 위쪽 화살표
  • 고정된 숫자 대신 변동성에 적응하는 임계값
  • 최근 마커를 지나는 추세선을 자동으로 그림(광선 표시는 선택 사항)
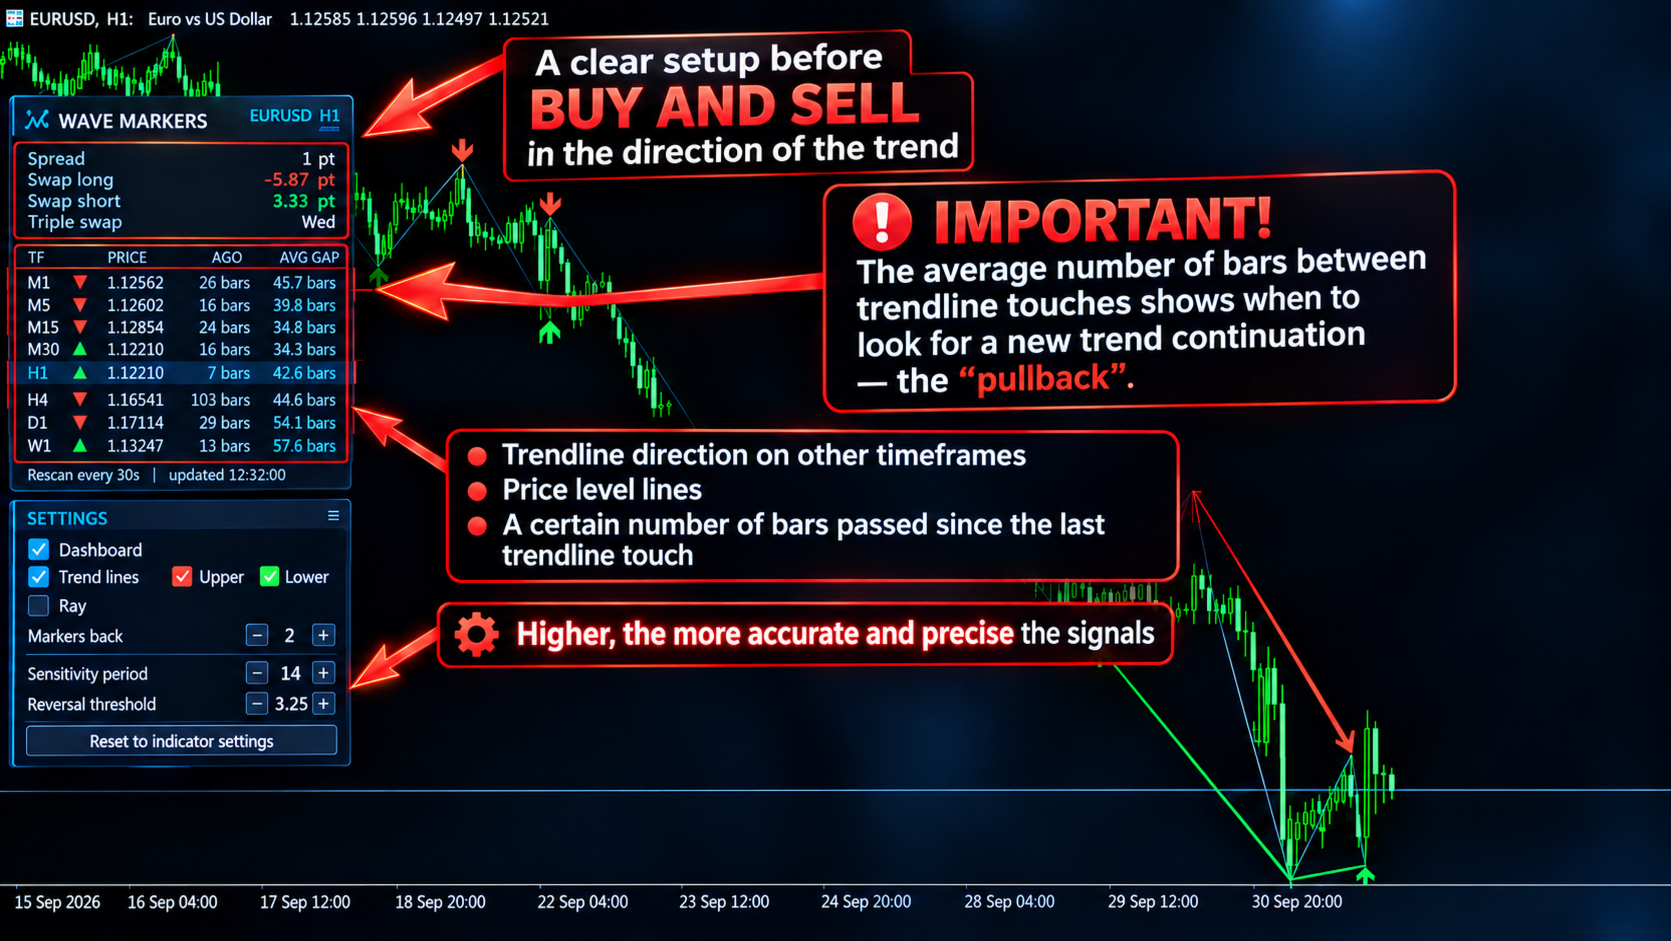
  • M1부터 W1까지 모든 시간대를 보여 주는 대시보드: 최근 마커의 방향, 가격, 몇 개의 봉 전에 나타났는지, 같은 방향 마커 사이의 평균 간격
  • 같은 패널에서 스프레드와 스왑(롱, 숏, 3배 스왑 요일)을 실시간으로 표시
  • 다른 시간대에서 부족한 히스토리를 자동으로 요청하여 불러옴
  • 터미널에 부담이 적음: 차트의 마커는 새 봉마다 한 번만 다시 계산하고, 나머지 시간대는 틱마다가 아니라 타이머로 확인
  • 설정 창을 열지 않고 차트에서 바로 모든 것을 조작 가능
  • 새 마커마다 팝업, 푸시, 이메일 알림 지원
  • 모든 종목, 모든 시간대에서 작동

차트에서 보게 되는 것

마커와 웨이브 라인. 확정된 스윙 고점과 저점에 화살표가 표시됩니다. 원하면 가는 선으로 연결해 파동을 한눈에 읽을 수 있습니다.

추세선. 최근 스윙 고점들을 지나는 선과, 별도로 최근 스윙 저점들을 지나는 선을 그립니다. 그릴 선분의 개수는 직접 정합니다. 1이면 해당 유형의 최근 마커 두 개를 지나는 선 한 개, 2이면 최근 마커 세 개를 선 두 개로 연결하는 식입니다. 선은 오른쪽으로 광선처럼 연장하거나, 캔들의 고가 또는 저가에서 정확히 시작하고 끝나는 선분으로 둘 수 있습니다.

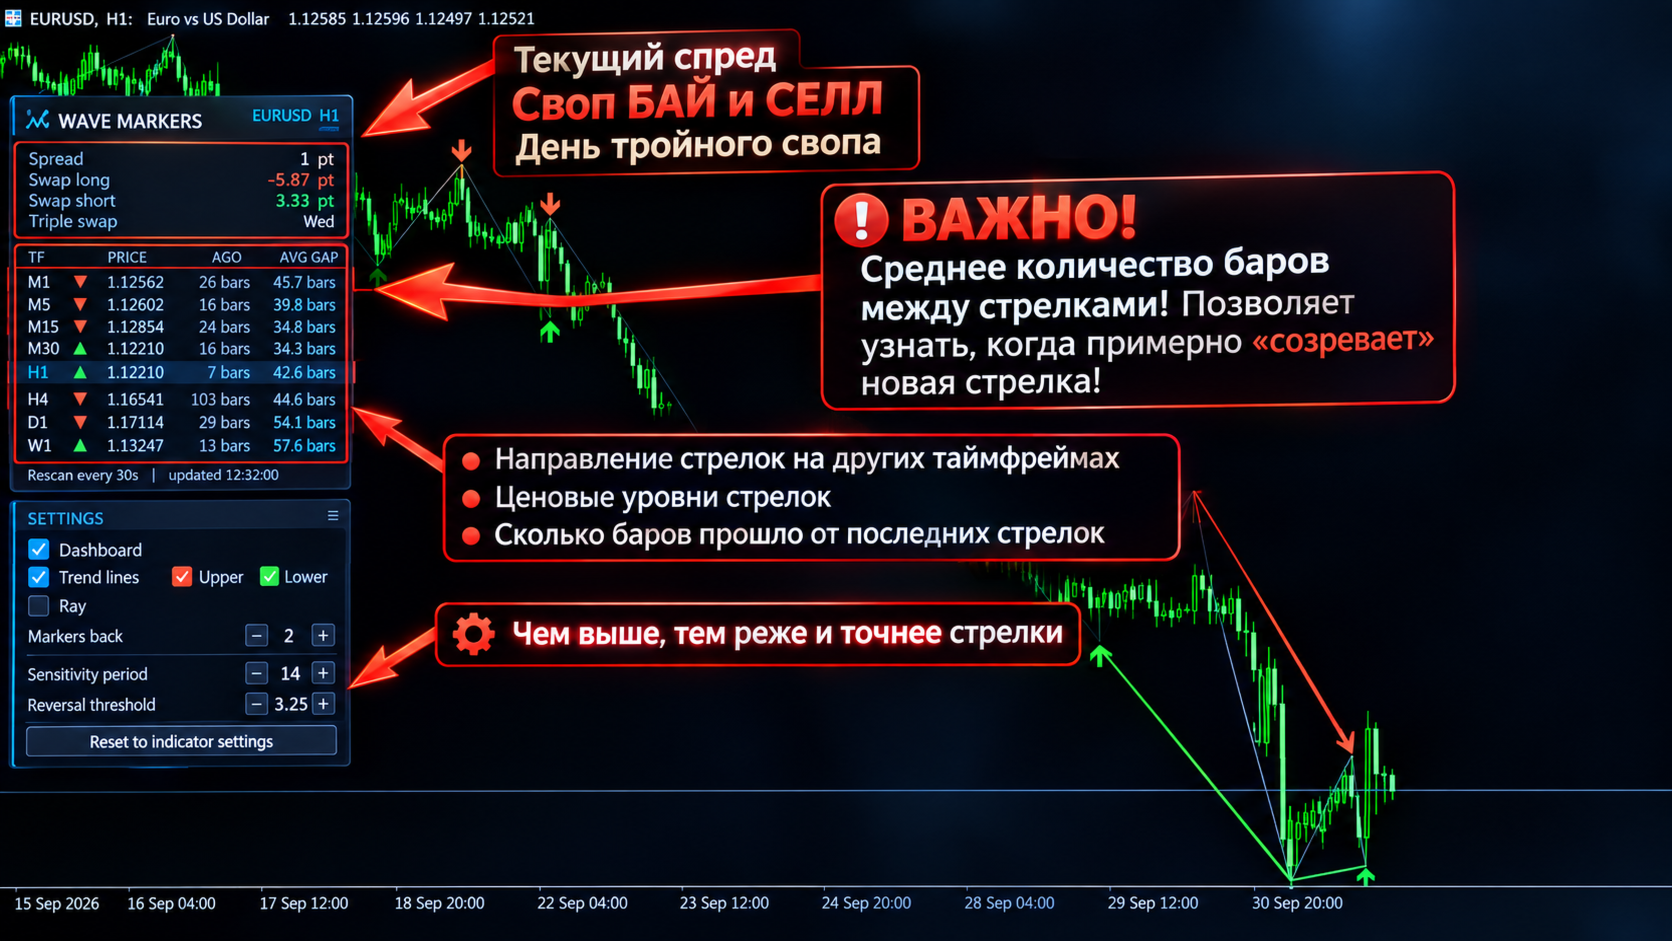
멀티 타임프레임 대시보드. M1부터 W1까지 시간대마다 한 줄씩 표시합니다.

  • 최근 마커의 방향(▼ 고점, ▲ 저점)
  • 그 가격
  • 몇 개의 봉 전에 나타났는지
  • 분석한 전체 히스토리에서 해당 방향 마커 사이의 평균 봉 수

"얼마나 전인가"와 "보통 얼마나 자주 나오는가"를 비교하면, 해당 시간대가 리듬의 어느 단계에 있는지 빠르게 감을 잡을 수 있습니다.

스프레드와 스왑. 현재 스프레드는 틱마다 갱신되며, 설정한 수준을 넘으면 강조 표시할 수 있습니다. 롱 스왑, 숏 스왑, 3배 스왑 요일은 해당 종목에 맞는 단위로 표시됩니다.

차트 위 컨트롤 패널

메인 패널 아래에는 간결한 설정 카드가 있습니다. 다음 작업을 할 수 있습니다.

  • 메인 패널 숨기기와 보이기(가려졌던 차트 부분 확인)
  • 추세선 켜기와 끄기(위쪽 선과 아래쪽 선을 따로 설정)
  • 광선 켜기와 끄기
  • "−"와 "+" 버튼으로 선의 개수 변경
  • "−"와 "+" 버튼으로 민감도 기간과 반전 임계값을 바꾸고 결과를 즉시 확인
  • 한 번의 클릭으로 인디케이터 설정값으로 되돌리기
  • 제목 표시줄을 잡고 패널 전체를 차트의 원하는 위치로 드래그

설정 창의 값이 출발점이며, 그 이후에는 차트에서 선택한 값이 우선합니다. 시간대를 바꿔도 선택은 유지되고, 초기화 버튼을 누르면 원래 값으로 돌아갑니다.

트레이더의 활용 방법

  • 시장 구조 읽기: 높아지거나 낮아지는 고점과 저점, 구조가 깨지는 지점
  • 중요한 스윙 레벨과 추세선을 손으로 그리지 않고 자동으로 확보
  • 결정을 내리기 전에 여러 시간대를 한눈에 점검
  • 시간대별 마커의 리듬 비교
  • 차트를 벗어나지 않고 스프레드와 스왑 비용 확인

Wave Markers는 분석 도구입니다. 어떤 거래 결과도 보장하지 않으며, 모든 결정은 본인의 몫입니다. 어떤 설정이든 먼저 데모 계좌에서 테스트하시기 바랍니다.

알아 두실 점

  • 마커는 가격이 반전한 뒤에 확정되므로 항상 지연되어 나타납니다. 이는 설계에 따른 것이며, 지연의 크기는 반전 임계값으로 조절합니다.
  • 다른 시간대의 데이터는 사용 중인 브로커의 히스토리에서 불러옵니다. 시간대에 "loading..."이 표시되면 터미널이 아직 해당 봉을 만드는 중입니다.
  • 이메일 알림을 사용하려면 터미널에서 이메일 설정이 필요합니다(도구 → 옵션 → 이메일).

설정 항목

Wave Markers

  • Wave markers: sensitivity period: 시장의 전형적인 움직임을 몇 개의 봉으로 측정할지 정합니다. 짧게 하면 변동성 변화에 빠르게 반응하고, 길게 하면 더 안정적입니다. 14가 출발점으로 적당합니다.
  • Wave markers: reversal threshold, x sensitivity: 마커가 확정되려면 가격이 극값에서 전형적인 움직임의 몇 배만큼 벗어나야 하는지 정합니다. 높으면 파동은 적고 더 중요해지며 확정이 늦어지고, 낮으면 마커가 더 많고 더 빨리 나타나지만 노이즈도 늘어납니다.
  • Analysis depth, bars (per timeframe): 각 시간대에서 몇 개의 봉까지 거슬러 올라가 분석할지 정합니다. 깊을수록 차트와 패널 통계에 더 많은 히스토리가 반영됩니다.

Chart Display

  • Show wave markers on chart: 화살표를 켜거나 끕니다.
  • Connect wave markers with a line: 이어지는 마커를 가는 선으로 연결해 파동을 따라가기 쉽게 합니다.
  • Swing high marker color: 스윙 고점 화살표의 색상입니다.
  • Swing low marker color: 스윙 저점 화살표의 색상입니다.
  • Connecting line color: 마커를 잇는 선의 색상입니다.
  • Marker size (1-5): 화살표의 크기입니다.
  • Connecting line width (1-5): 마커를 잇는 선의 두께입니다.

Dashboard

  • Show info panel on chart: 대시보드와 차트 위 컨트롤 카드를 표시합니다. 끄면 인디케이터는 이 설정 창의 값만으로 작동합니다.
  • Panel offset X, px: 패널의 가로 시작 위치입니다. 이후에는 마우스로 드래그할 수 있습니다.
  • Panel offset Y, px: 패널의 세로 시작 위치입니다.
  • Other timeframes re-check interval, sec: 다른 시간대를 다시 확인하는 간격입니다. 현재 차트는 새 봉마다 갱신되며, 이 값은 표에만 영향을 줍니다(최소 5초).
  • Spread highlight level, points (0 = off): 스프레드 값이 이 수준을 넘으면 주황색으로 바뀝니다. 0이면 강조를 끕니다.

Alerts (current timeframe)

  • Popup alert on new wave marker: 새 마커가 확정될 때 터미널 알림 창을 띄웁니다.
  • Push notification on new wave marker: 스마트폰으로 알림을 보냅니다(터미널 설정에 MetaQuotes ID가 필요합니다).
  • E-mail notification on new wave marker: 이메일을 보냅니다(터미널에서 이메일 설정이 필요합니다).

Trend Lines (through wave markers)

  • Draw trend lines through wave markers: 모든 추세선의 전체 스위치입니다.
  • Lines through upper markers (highs): 스윙 고점을 지나는 선을 그립니다.
  • Lines through lower markers (lows): 스윙 저점을 지나는 선을 그립니다.
  • Number of lines per side (markers back, 1-50): 각 방향으로 그릴 선분의 개수입니다. 1이면 최근 마커 두 개를 지나는 선 한 개, 2이면 최근 마커 세 개를 선 두 개로 연결하는 식입니다.
  • Extend all lines to the right (ray): 모든 선을 차트 오른쪽 끝까지 연장합니다. 끄면 각 선은 자신의 마커에서 시작해 마커에서 끝납니다.
  • Upper line color: 스윙 고점을 지나는 선의 색상입니다.
  • Lower line color: 스윙 저점을 지나는 선의 색상입니다.
  • Line style: 실선, 파선, 점선 등을 선택합니다.
  • Line width (1-5, solid style only): 선의 두께입니다. MetaTrader는 1보다 큰 두께를 실선에만 적용합니다.
  • Draw lines behind the chart: 선을 캔들 위가 아니라 캔들 뒤에 그립니다.
추천 제품
The indicator plots flexible support and resistance levels (dots). A special phase of movement is used for construction. Levels are formed dynamically, that is, each new candle can continue the level or complete it. The level can provide resistance or support to the price even where it is no longer there. Also, support and resistance levels can change roles. The importance of levels is affected by: the amount of time the level is formed and the number of touches. The significance of these lev
In the context of trading, Malaysia SNR (Support and Resistance) refers to the technical analysis of support and resistance levels in financial markets, particularly for stocks, indices, or other assets traded. This is single timeframe version. Multiple timeframe version is avaiable here . There are three type of Malaysia SNR level Classic , GAP and Flipped 1. Classic Support is the price level at which an asset tends to stop falling and may start to rebound. It acts as a "floor" where demand is
MetaHelper
Volodymyr Tseibei
This indicator automatically calculates and displays classic pivot points on your chart, helping identify key support and resistance levels for the current trading session. Features: · Plots Pivot (PP), Resistance 1-2 (R1, R2), and Support 1-2 (S1, S2) levels · Includes current close price line for reference · Color-coded lines: Blue for pivot, Red for resistances, Green for supports · Automatic calculation based on previous day's high, low, and close · Continuous lines across the chart for e
BTFX Pivot Points
Bradley Thomas Farrington
The BTFX Pivot Points is an indicator which calculates the Support and Resistance levels for each day. By using this indicator the pivot levels point out clear targets to aim for. The resistance levels are shown in purple above the silver pivot line. The support levels are shown in Orange and can be found below the silver pivot line. This indicators works very well when used with The BTFX Daybreak Indicator. For a more in depth explanation of these indicators please watch the Youtube video attac
Veltrion Smart Fibonacci   is a clean automatic Fibonacci structure overlay for MetaTrader 5. It automatically detects recent swing highs and swing lows, then draws key Fibonacci retracement levels directly on the chart. The indicator is designed to help traders visualize market structure, retracement zones, and the golden zone without manually drawing Fibonacci tools. Key Features Automatic swing high and swing low detection Clean Fibonacci retracement overlay Horizontal Fibonacci levels for a
Structure Levels (Highs & Lows) Indicator for MetaTrader 5 Decode Market DNA — Trade with Institutional Precision Description: The Structure Levels (Highs & Lows) Indicator is your secret weapon to map the market’s hidden roadmap. Designed for traders who think in terms of price action and market structure, this tool automatically identifies critical swing highs and swing lows, transforming chaotic charts into a clear blueprint of support/resistance zones, breakout opportunities, and trend rev
Fair Value Gap (FVG) & Inversion Fair Value Gap (iFVG) – TradingLabs ID (공정 가치 갭 및 반전 공정 가치 갭) ICT(Inner Circle Trader) 및 스마트 머니 컨셉(SMC) 방법론에서 Fair Value Gap(FVG)—불균형(Imbalance)이라고도 함—은 가격이 극도의 모멘텀으로 이동하여 유동성 공백을 남길 때 발생합니다. 이러한 채워지지 않은 갭은 미래 가격 행동의 자석 역할을 하여 전문 트레이더에게 가장 확률이 높은 되돌림 및 진입 구간이 됩니다. 하지만 모든 FVG가 같은 것은 아닙니다. 어떤 갭이 진정한 기관의 무게를 가지고 있는지 어떻게 알 수 있을까요? FVG & iFVG Pro 지표를 소개합니다. 표준 불균형 감지를 다음 단계로 끌어올렸습니다. 이 도구는 신선한(Fresh), 완화된(Mitigated), 반전된 공정 가치 갭(iFVG)을 정밀한 정확도로 자동으로 감지할 뿐만 아니라, 업계 최초의
这是一个基于前一个交易日的最高价、最低价和收盘价来计算的枢轴点指标,具体公式如下: 计算前一日的 Pivot Point (枢轴点): Pivot = (High + Low + Close) / 3 计算 Resistance 1 (R1) 、 Support 1 (S1) ​ 等: R1 = (2 * Pivot) - Low S1 = (2 * Pivot) - High R2 = Pivot + (High - Low) S2 = Pivot - (High - Low) 与市面上其他的枢轴点指标相比,该指标主要有以下4个特点: 1、可以修改交易日的开始时间; 2、可以设定支撑压力线的颜色; 3、可以设定是否显示各个支撑压力线对应的价格; 4、可以设定天数用以显示枢轴点的历史记录; 开发这个指标的最初目的是为了解决设定交易日开始时间的问题,接下来会进一步说明。基于计算公式,我们需要获得上一个交易日的最高价、最低价和收盘价,在夏令时,北京时间6点是开市时间,大多数交易平台服务器的0点对应的是北京时间的6点,但是香港的服务器6点才是对应的是北京时间的6点。如果你有多个平台,且存在
Support Resistance Break Zones PRO was built for a common problem I often see when trading XAUUSD and other fast-moving symbols: support and resistance levels are visible, but the chart becomes difficult to read when breakouts, retests and false breaks happen around the same area. Current price: $79 - increases by $10 after every 20 purchases until reaching the final price of $129 . Next price: $89 . Complete Buyer Kit: 42 Professional Resources included at no additional cost. MT5 Presets, PDF
Multichart V and H Line Sync Overview Multichart V and H Line Sync is the essential tool for multi-timeframe traders. It instantly synchronizes your Horizontal Support/Resistance Lines and Vertical Time Lines across all open charts of the same symbol. Stop drawing the same levels on M5, H1, and D1 charts manually. With this tool, draw a line once, and it automatically replicates on every other timeframe. Perfect for keeping your technical analysis consistent and your workspace clean. Key Feature
FREE
ZigZag Market Structure Breakout Pro ZigZag Extras Display BreakOut points is a MetaTrader 5 indicator for traders who use ZigZag, breakout points, market structure, BOS, CHoCH, swing high, swing low, support and resistance, and higher timeframe bias in their trading analysis. Main Benefits Displays confirmed ZigZag swing highs and swing lows Marks BOS Up, BOS Down, CHoCH Up and CHoCH Down Shows Depth Highest High and Depth Lowest Low lines Adds HH, HL, LH and LL structure labels Includes HTF bi
The indicator to trade price consolidation is designed to identify price contraction and alerts us on formation. It does this by analyzing historical price data and identifying price action patterns. The algorithm then uses this information to mark the zone , potential targets and liquidity lines, giving us valuable insights into market behavior.  Traders can adjust parameters such as colors ,alerts types and how many  previously formed zones to display on chart . Furthermore, the indicator can
Ric
Sabina Fik
With this indicator, you can   predict future price behavior   for a certain number of bars ahead, giving you the ability to anticipate market dynamics. The indicator draws a   forecast line , which models potential future price values based on sophisticated algorithms analyzing past data. This information can be leveraged not only for market entry and exit decisions but also for setting or adjusting stop-loss levels to better manage your positions. Application of the Forecast The data provided
SR Zones & Pivot Panel EA - All-in-One Trading Tool SR Zones & Pivot Panel EA   is a powerful hybrid tool that combines automatic   Support/Resistance Zones ,   Daily Pivot Points , and a   Compact Trading Panel   into one interface. It helps traders visualize key price levels on any timeframe while executing trades quickly and efficiently. Designed for precision and speed, this tool keeps your chart clean while providing all the data you need for intraday trading. Key Features 1. Automati
ShooterSignal ShooterSignal is a multi-timeframe market structure indicator for MetaTrader 5. The indicator analyzes price data and identifies swing points used to display market structure on the chart. Market Structure The indicator identifies: Higher High (HH) Higher Low (HL) Lower High (LH) Lower Low (LL) These structural points are displayed on the chart according to the selected timeframe. Structure Events ShooterSignal can display structural events based on detected price movement, includ
RelicusRoad Daily Pivots는 MetaTrader 4와 MetaTrader 5용 일간 피벗 포인트 지표로, 전일 범위를 Fibonacci 레벨로 나누고 마이너스 100퍼센트부터 플러스 200퍼센트까지 위아래로 연장합니다. 고전적인 floor pivot 대신, 직전에 완료된 범위를 저가가 0%, 고가가 100%인 척도로 다룹니다. 열아홉 개의 레벨이 차트 오른쪽 가장자리에 촘촘한 색상 마커로 표시되므로, 오늘 움직임의 크기를 전일 범위의 일부 또는 배수로 읽을 수 있습니다. 작동 방식 지표는 직전에 완료된 기준 기간의 고가와 저가를 가져와 그 범위의 각 비율마다 레벨을 배치합니다: level = low + ratio x (high - low). 주말 봉은 건너뛰므로 월요일의 기준은 마지막 거래일입니다. 기준 기간은 차트 시간대에서 정해집니다. 내부 구간, 회색: 0%, 23.6%, 38.2%, 50.0%, 61.8%, 78.6%, 100%. 상단 구간, 초록: +123
FREE
support resistance levels indicator   mt5: 이 도구는 차트에서 지원 및 저항선과 피보나치 수준을 식별하고 플롯하는 다중 시간대 지표로, 인간의 눈과 동일한 정확도로 작동합니다. TW 외환 지원 및 저항 수준은 복잡한 알고리즘을 갖추고 있어 차트를 스캔하여 이전 가격 안정화 및 반등 수준을 식별하고 터치 횟수를 기록합니다. 수동으로 지원 및 저항 수준과 피보나치 되돌림을 그리는 데 지치셨습니까? 이 제품의 기능을 확인해 보세요. 놀라울 것입니다. 제품 특징: 1. 소규모 및 대규모 수준: 고급 알고리즘을 사용하여 소규모 및 대규모 수준을 사용자 취향에 맞게 사용자 정의하고 추가 수준을 제거할 수 있습니다. 2. 수준 터치 횟수: TW 지원 저항 수준과 브레이크 mt5, 각 수준이 과거에 몇 번 터치되었는지 계산하여 제공하여 각 수준의 강도를 평가할 수 있습니다. 3. 피보나치 수준: 마지막 파도의 피보나치 수준이 동적으로 그려져, 이러한
Murphy Order Block is a highly optimized and visually clean indicator for identifying key institutional zones based on pure market structure logic. It is designed for traders who follow Smart Money Concepts (SMC), ICT-style OB trading, and structure-based break & retest strategies. This indicator dynamically detects and draws: - **1 valid Bullish Order Block (Buy Zone)** - **1 valid Bearish Order Block (Sell Zone)** ### Key Features: **Market Structure-Based Logic**   - Uses swing high
Mechanical SR mt5
Part-time Day Trader
Mechanical Support Resistance Automatically calculates support and resistance levels using vertical price-profile analysis with pivot-style updates. Mechanical Support Resistance sits between a traditional support/resistance indicator , a pivot indicator , and a vertical profile indicator . Like an S/R indicator, it identifies important price levels. Like a pivot indicator, those levels remain fixed for a defined period and refresh on a scheduled daily, weekly, or monthly basis. And like a verti
Projection of Phi
Nestor Jose Mendez Boza
Projection of Phi   Is a technical indicator that calculates dynamic support and resistance levels. It uses angular geometric projections and mathematical ratios to identify market expansion ranges. Features: Dynamic Fibonacci Expansion: Extension level projection Geometric Calculation: Angular analysis and mathematical ratios Visualization: Graphical objects with informative labels Compatibility: M1 to H4 timeframes Applications: Identification of zones for trade management Analysis of volatil
FREE
Point and Fignure (P&F) chart plots price against changes in direction by plotting a column of Xs as the price rises and a column of Os as the price falls. Features Support for several kinds of price types - High/Low and Close. Clean and easy-to-read chart. Displays column high and low prices as indicator values. Support for both 4 and 5-digit brokers. Customizeable colors. Advantages Filter insignificant price movements and noise. Less noise and more stable work. Focus on important price move
KT Asian Breakout Indicator MT5
KEENBASE SOFTWARE SOLUTIONS
아시아 세션 범위 표시 KT Asian Breakout Indicator는 4시간 아시아 세션 구간의 고가와 저가를 표시하고 범위가 완성된 뒤의 가격을 모니터링합니다. GMT Offset은 세션을 브로커 서버 시간에 맞추며, Draw Session Box는 차트의 범위 표시를 제어합니다. 돌파와 거래 레벨을 함께 확인 가격이 세션 고가 위에서 마감되면 상승 화살표가 표시됩니다. 가격이 세션 저가 아래에서 마감되면 하락 화살표가 표시됩니다. Draw Stoploss and Profit Targets를 활성화하면 진입선, 범위 반대편의 Stop Loss, 계산된 3개의 목표 레벨이 차트에 추가됩니다. 상승 돌파: 세션 저가를 보호 레벨로 사용합니다. 하락 돌파: 세션 고가를 보호 레벨로 사용합니다. 목표 1, 2, 3: 범위 크기와 현재 변동성을 바탕으로 단계별 참고 레벨을 제공합니다. 돌파 상태: 돌파 캔들이 세션 범위에 비해 비정상적으로 큰 경우를 식별합니다. 과거 신호 성과 검토
Traditional Pivot Points Pro is a professional MQL5 indicator designed to display accurate pivot levels with an automatic session-based calculation logic. It plots the main pivot point (P) together with resistance and support levels R1, R2, S1, and S2 in a clean and readable format. The indicator is built for traders who want a simple and efficient way to identify key market levels, potential reversals, intraday support and resistance zones, and price reaction areas. It is especially useful for
Detailed Description: The   Pivot Point Pro Indicator   is a powerful all-in-one fully customizable indicator that takes care of five pivot point methods (Classic, Fibonacci, Woodie, Camarilla, DeMark). It automatically plots pivot levels and midpoints, highlights key reversal zones and sends alerts when price approaches these levels.  Unlike the free Pivot Point Classic version, this Pro indicator allows users to customize more settings,   analyze current and historical pivot points and  use al
The Angle Prices indicator is a tool that calculates the price angle based on price analysis, interpreting the time vector in the form of price points on the price chart. In other words, the X axis and Y axis are represented as price points, so you can actually calculate the angle with two axes of the same dimension. This allows traders to obtain information about the direction of price movement and possible entry or exit points for trades. Let's look at the main characteristics and interpretat
AxisGuard Pro
Muhammad Andiya Nafhan
AxisGuard Pro Professional Pivot, Support & Resistance Indicator for MetaTrader 5 AxisGuard Pro is a professional analytical indicator designed to help traders identify important market levels without overcrowding the chart. It provides a clean view of Pivot Points, Support and Resistance levels with powerful multi-timeframe control. Suitable for: Forex Gold Indices Crypto Other MetaTrader 5 supported symbols Main Features Multi-Timeframe P
MT4 버전: https://www.mql5.com/en/market/product/157679 MT5 버전: https://www.mql5.com/en/market/product/157680 지지선/저항선 - 스마트 시장 구조 레벨 전문 트레이더와 자동화 시스템을 위해 설계된 깔끔하고 지능적이며 신뢰성 높은 지지선 및 저항선 지표입니다. 지지선/저항선은 프랙탈, ATR 기반 가격 세분화, 다중 시간대 분석을 결합한 고급 클러스터링 알고리즘을 사용하여 실제 시장 레벨을 감지하도록 설계되었습니다. 이 지표는 무작위 또는 노이즈가 있는 선을 그리는 대신, 가격이 반복적으로 반응한 통계적으로 검증된 레벨을 생성합니다. 따라서 재량 거래, 알고리즘 거래, 위험 관리 및 돌파 검증에 이상적입니다. 주요 기능 고급 지지/저항 엔진 ATR 스케일 그리드 분할 사용 상단 및 하단 프랙탈을 클러스터링하여 매우 정확한 구조적 레벨 생성 정확도 모드(높음/중간/낮음)를 사용하여 노이즈 필터링
Divergence Sync MT5
Pavel Verveyko
5 (1)
Divergence and Convergence are important harbingers of reversals in stock markets. The Divergence Sync indicator is designed to automatically search for divergences on a large number of indicators with different parameters. The search for divergences is carried out on these indicators: (CCI, CHO, DeMarker, MACD, MFI, Momentum, OBV, OsMA, RSI, Stochastic, WPR,   Awesome Oscillator ). To search for divergences, you can use one technical indicator or search simultaneously on any number of indicat
UFO Market Structure & Fibo Pro UFO (Unfilled Order Institutional) zone + Non-Repaint Market Structure + Golden Fibonacci Entry Stop trading like retail. Start tracking institutions. UFO Market Structure & Fibo Pro is an all-in-one visual assistant designed to automatically map Institutional Supply & Demand, Market Structure, and Golden Fibonacci entries. No more subjective drawing, no more lagging indicators. Just pure, objective institutional footprints. UNIVERSAL MARKET COMPATIBILITY Work
Owl Smart Levels MT5
Sergey Ermolov
4.03 (32)
추세를 따라 거래할 때 가장 어려운 점은 레벨을 찾는 것이 아니라, 어디에서 진입이 실제로 유효한지를 이해하는 것입니다. 가격은 종종 레벨에 반응하지만 움직임이 이어지지 않는 경우가 많으며, 이는 잘못된 진입이나 기회 상실로 이어집니다. Owl Smart Levels는 단순히 레벨만 표시하는 것이 아니라 , 시장 구조와 되돌림을 기반으로 형성된 구간을 보여줍니다. 이를 통해 진입 포인트를 다르게 평가할 수 있으며 일부 잘못된 신호를 피할 수 있습니다. Owl Smart Levels 시스템 구성 Owl Smart Levels 는 단순한 레벨 표시가 아니라, 각 요소가 서로 보완하는 완전한 트레이딩 모델 입니다. 구성 요소: Owl Smart Levels (지표) 추세 방향, 되돌림 구간, 그리고 사전에 정의된 진입, StopLoss, TakeProfit 레벨을 표시 시스템 가이드 실제 거래에서 신호를 어떻게 활용할지 설명: 어떤 상황을 고려하고 어떤 상황을 건너뛸지, 그리고 거래
이 제품의 구매자들이 또한 구매함
SMART TREND TRADING SYSTEM — 특별 혜택 트레이딩 시스템, 자동매매 EA, 교육과 지원을 하나로. MT5용 Smart Trend Trading System을 99 USD에 구매하고, 시스템의 신호를 자동매매에 활용할 수 있는 Smart Universal Expert Advisor를 무료로 받으세요 . STTS는 추세 방향, 진입·청산 신호, 반전 구간, 주요 가격 수준을 차트에 모아 보여줍니다. 시스템을 참고해 수동으로 거래하거나, 포함된 EA를 연결하여 선택한 설정에 따라 자동으로 거래를 실행할 수 있습니다. 현재 가격인 99 USD는 앞으로 이루어지는 30건의 구매에 적용됩니다. 이후 가격은 149 USD로 인상됩니다. 전체 패키지 구성 구매 시 다음 항목이 포함됩니다. • MT5용 Smart Trend Trading System. • Smart Universal Expert Advisor — 무료. • 전체 STTS PDF 사용자 설명서. • STTS
Trend Sniper X
Sarvarbek Abduvoxobov
4.9 (39)
Trend Sniper X 는 트레이더가 추세 방향과 잠재적 반전 지점을 명확하고 정확하게 포착할 수 있도록 도와주는 MetaTrader 5용 멀티 타임프레임 추세 추종 지표입니다. MT4용: https://www.mql5.com/en/market/product/193245 가격 정보: 현재 가격은 프로모션 할인가이며, 향후 업데이트 및 새로운 기능이 출시됨에 따라 변동될 수 있습니다. 보너스 혜택: 본 지표 전용 무료 자동매매 Assistant EA를 받으시려면 구매 후 작성자에게 메시지를 보내주시기 바랍니다. Code2Profit 채널 멀티 타임프레임 분석으로 시장을 마스터하세요! Trend Sniper X로 승률을 극대화하는 방법: 핵심 규칙 및 세션 팁 기술 사양 플랫폼 MetaTrader 5 지표 유형 멀티 타임프레임 추세 지표 운용 타임프레임 모든 차트 타임프레임 지원, 독립적으로 선택 가능한 상위 타임프레임(M1–MN1) 주요 상품 외환, 금(XAUUSD) 및 기타 C
ARIPoint
Temirlan Kdyrkhan
1 (4)
ARIPoint is a powerful trading companion designed to generate high-probability entry signals with dynamic TP/SL/DP levels based on volatility. Built-in performance tracking shows win/loss stats, PP1/PP2 hits, and success rates all updated live. Key Features: Buy/Sell signals with adaptive volatility bands Real-time TP/SL/DP levels based on ATR Built-in MA Filter with optional ATR/StdDev volatility Performance stats panel (Success, Profit/Loss, PP1/PP2) Alerts via popup, sound, push, or email Cu
Gann Made Easy MT5
Oleg Rodin
5 (10)
Gann Made Easy 는 mr.의 이론을 사용하여 최고의 거래 원칙을 기반으로 하는 전문적이고 사용하기 쉬운 Forex 거래 시스템입니다. W.D. 간. 이 표시기는 Stop Loss 및 Take Profit Levels를 포함하여 정확한 BUY 및 SELL 신호를 제공합니다. PUSH 알림을 사용하여 이동 중에도 거래할 수 있습니다. 구매 후 거래 방법 안내 및 유용한 추가 지표를 무료로 받으시려면 저에게 연락주세요! 아마도 Gann 거래 방법에 대해 이미 여러 번 들었을 것입니다. 일반적으로 Gann의 이론은 초보자 거래자뿐만 아니라 이미 거래 경험이 있는 사람들에게도 매우 복잡한 것입니다. Gann의 거래 방식은 이론적으로 적용하기 쉽지 않기 때문입니다. 나는 그 지식을 연마하고 Forex 지표에 최고의 원칙을 적용하기 위해 몇 년을 보냈습니다. 표시기는 적용하기가 매우 쉽습니다. 차트에 첨부하고 간단한 거래 권장 사항을 따르기만 하면 됩니다. 지표는 지속적으로 시장 분석
Neuro Poseidon MT5
Daria Rezueva
4.75 (52)
Neuro Poseidon is a new indicator by Daria Rezueva. It combines precise trading signals with adaptive TP/SL levels - creating best possible trades as a result! Message me and get  Neuro Poseidon Assistant  as a gift to automize your trading process! What makes it stand out? 1. Proven profitability on all assets and timeframes 2. Only confirmed BUY and SELL signals present on the chart 3. Adaptive TP & SL levels generated by the software for each trade 4. Easy to understand - suitable for al
M1 Sniper MT5
Oleg Rodin
5 (7)
M1 SNIPER 는 사용하기 쉬운 거래 지표 시스템입니다. M1 시간대에 맞춰 설계된 화살표 지표입니다. 이 지표는 M1 시간대 스캘핑을 위한 단독 시스템으로 사용할 수 있으며, 기존 거래 시스템의 일부로도 사용할 수 있습니다. 이 거래 시스템은 M1 시간대 거래용으로 특별히 설계되었지만, 다른 시간대에도 사용할 수 있습니다. 원래는 XAUUSD와 BTCUSD 거래를 위해 이 방법을 설계했지만, 다른 시장 거래에도 유용하다는 것을 알게 되었습니다. 이 지표의 신호는 추세 방향과 반대로 거래될 수 있습니다. 저는 지표의 신호를 활용하여 양방향으로 거래할 수 있도록 돕는 특별한 거래 기법을 알려드립니다. 이 방법은 특별한 동적 지지선과 저항선 가격 영역을 활용하는 것을 기반으로 합니다. 구매하시면 M1 SNIPER 화살표 지표를 바로 다운로드하실 수 있습니다. 또한, 아래 스크린샷에 표시된 Apollo Dynamic SR 지표는 M1 SNIPER 도구를 사용하는 모든 사용자에게 무료로
Entry Points Pro for MT5
Yury Orlov
4.52 (151)
전설이 돌아왔습니다: Entry Points Pro 10. MQL5 마켓 Top-3 자리를 3년간 지켜온 전설적인 지표의 재출시입니다. 수백 개의 호평 리뷰(두 버전 합산 589개), 매일 이 지표로 거래하는 수천 명의 트레이더, 31,000회 이상의 데모 다운로드   MT4+MT5 . 지난 5년간 여러분이 남긴 리뷰를 하나도 빠짐없이 읽었고, 약속 대신 그 답을 버전 10에 담았습니다. 1999년부터 시장에서 활동하며 정직함과 자신의 평판, 그리고 고객을 소중히 여기는 개발자가 만들었습니다. Entry Points Pro의 진입 시그널은 절대 리페인팅되지 않습니다. 그리고 이번에는 개발자의 말뿐이 아니라 검증 가능한 사실입니다: 확정 시그널은 캔들 종가에서만 표시되며, 자동화 테스트에서 리페인팅 0건 이 확인되었습니다(EURUSD, XAUUSD, BTCUSD에서 2,486,568회의 불변조건 검사 — 위반 0건). 검증 방법은 공개되어 있으니 전략 테스터에서 직접 재현해 보실 수
Auto Optimized SpeedAngle 은 지속적인 워크포워드 최적화(Walk-Forward Optimization, WFO)를 통해 곡선 적합(curve-fitting)을 제거한 기관 수준의 모멘텀 벡터화 시스템입니다. 시장 체제가 바뀔 때 성능이 떨어지는 정적 입력에 의존하는 대신, 이 지표는 표본 외(Out-of-Sample, OOS) 검증을 사용하여 매개변수를 동적으로 재보정하며, 표시되는 신호가 과거의 우연이 아닌 진정한 통계적 우위를 나타내도록 보장합니다. 핵심 기관용 프레임워크 워크포워드 최적화 엔진: 핵심 알고리즘은 수천 가지의 룩백(lookback) 및 임계값 조합을 지속적으로 스캔하며, 데이터를 인샘플(in-sample)과 표본 외(out-of-sample) 세트로 엄격하게 분리합니다. 미지의 데이터 환경에서 수학적 우수성이 증명된 경우에만 새로운 매개변수 구성을 채택합니다. 정량적 목적 함수: 순수한 총이익을 쫓는 대신, 최적화 엔진은 기관 수준의 안정성
Unix Scalper
Issam Kassas
4 (4)
UNIX SCALPER — 특별 혜택 매매 기회를 찾고, 거래 계획을 확인하고, 실행 방법을 선택하세요. MT5용 UNIX Scalper를 99 USD에 구매하면 신호 자동매매에 사용할 수 있는 Smart Universal Expert Advisor를 무료로 받으실 수 있습니다. UNIX Scalper는 시장 분석, BUY/SELL/WAIT 판단, Entry, Stop Loss, TP1 및 TP2 가격 수준을 하나의 정돈된 패널에 제공합니다. 거래 계획에 따라 수동으로 매매하거나, 포함된 EA를 연결하여 선택한 설정에 따라 자동으로 실행할 수 있습니다. 현재 가격인 99 USD는 앞으로 30건의 구매에 적용됩니다. 이후 가격은 149 USD로 인상됩니다. 전체 패키지 구성 구매 시 다음 항목이 포함됩니다. • MT5용 UNIX Scalper. • Smart Universal Expert Advisor — 무료. • UNIX Scalper 전체 PDF 사용자 매뉴얼. • UNIX
Welcome to ENTRY IN THE ZONE AND SMC MULTI TIMEFRAME / SPECIAL BENEFIT FOR OUR MQL5 CUSTOMERS  FREE ACCESS TO THE NEW TOOL —COMING SOON —   Learn More on Our Official Website : https://www.fableedge.net Entry In The Zone and SMC Multi Timeframe is a real-time market analysis tool based on Smart Money Concepts (SMC), designed to analyze market structure, price direction, and key trading zones. It supports both Single-Timeframe Analysis and Multi-Timeframe Analysis, providing a clearer view of the
Atomic Analyst MT5
Issam Kassas
4.47 (60)
ATOMIC ANALYST — 특별 혜택 시장 분석 도구, 자동매매 EA, 교육과 지원을 하나로. MT5용 Atomic Analyst를 99 USD에 구매하고, 지표의 신호를 자동매매에 활용할 수 있는 Smart Universal Expert Advisor를 무료로 받으세요 . Atomic Analyst는 가격 움직임 분석, 추세 방향, 진입·청산 신호, 손절 수준, 여러 익절 수준을 차트에 모아 보여줍니다. 분석을 참고해 수동으로 거래하거나, 포함된 EA를 연결하여 선택한 설정에 따라 자동으로 거래를 실행할 수 있습니다. 현재 가격인 99 USD는 앞으로 이루어지는 30건의 구매에 적용됩니다. 이후 가격은 149 USD로 인상됩니다. 전체 패키지 구성 구매 시 다음 항목이 포함됩니다. • MT5용 Atomic Analyst. • Smart Universal Expert Advisor — 무료. • 전체 Atomic Analyst PDF 사용자 설명서. • Atomic Ana
Power Candles MT5
Daniel Stein
4.58 (12)
Power Candles V3 - 자체 최적화 강도 지표 파워 캔들 V3는 적용된 모든 차트에서 통화 및 상품의 강세를 실행 가능한 거래 계획으로 전환합니다. 단순히 캔들에 색상을 입히는 대신, 백그라운드에서 실시간 자동 최적화를 수행하여 현재 보고 있는 종목에 대한 최적의 손절매, 익절 및 신호 임계값을 제공합니다. 한 번의 클릭으로 실시간 거래에 적용할 수 있으며, 진입점, 손절매 및 익절 선이 정확한 가격에 맞춰 차트에 표시되고, 방향과 함께 알림이 발령됩니다. 이 도구는 Stein Investments 에코시스템의 일부입니다. 18개 이상의 도구와 함께 당신의 1대1 AI 트레이딩 멘토 Max.  항상 대기 중, 모든 인디케이터를 깊이 있게 이해, 무언가를 차근차근 생각해보고 싶은 순간에 도움을 줍니다.  https://stein.investments 에서 만나보세요 매 종가 바마다 3,000회 이상의 트레이딩 시뮬레이션. 9가지 강도 상태. 2가지 전략을 병렬로 테스트.
Adaptive Price Action Engine 지표를 구매하면 EA(자동매매 프로그램)가 무료 멀티 타임프레임 기반 자기 최적화 추세 & 캔들 패턴 분석 시스템 시장은 끊임없이 변화하며, 모든 Price Action 패턴이 모든 시장 환경에서 동일한 가치를 가지는 것은 아닙니다. Adaptive Price Action Engine 은 변화하는 시장 환경에 적응할 수 있도록 설계되었으며, 추세 구조, 멀티 타임프레임 분석, 캔들 패턴 및 통계적 최적화 를 하나의 분석 프레임워크로 결합합니다. 두 가지 적응형 모드 Dual Alpha Trend Mode 낮은 타임프레임과 높은 타임프레임에서 적합한 Alpha Trend 파라미터를 자동으로 탐색하여, 최근 시장 움직임에 맞춰 추세 분석을 조정합니다. Candlestick + Alpha Mode Alpha Trend를 통한 시장 국면 분석과 22개의 상승 및 하락 캔들 패턴 을 결합합니다. 모든 패턴을 동일하게 취급하는 대신, 다양
통화 강도 마법사는 성공적인 거래를 위한 올인원 솔루션을 제공하는 매우 강력한 지표입니다. 표시기는 여러 시간 프레임의 모든 통화 데이터를 사용하여 이 또는 해당 외환 쌍의 힘을 계산합니다. 이 데이터는 특정 통화의 힘을 확인하는 데 사용할 수 있는 사용하기 쉬운 통화 지수 및 통화 전력선의 형태로 표시됩니다. 필요한 것은 거래하려는 차트에 표시기를 부착하는 것뿐입니다. 표시기는 거래하는 통화의 실제 강세를 보여줍니다. 지표는 또한 추세와 거래할 때 유리하게 사용할 수 있는 구매 및 판매 거래량 압력의 극한값을 보여줍니다. 지표는 또한 피보나치에 기반한 가능한 대상을 보여줍니다. 표시기는 PUSH 알림을 포함한 모든 유형의 알림을 제공합니다. 구매 후 연락주세요. 나는 당신과 거래 팁을 공유하고 당신에게 무료로 훌륭한 보너스 지표를 줄 것입니다! 나는 당신에게 행복하고 유익한 거래를 기원합니다!
M1 Quantum MT5
Hamed Dehgani
4.2 (10)
M1 Quantum을 이용한 실시간 트레이딩 신호 : 신호   ( Quantum Trade Assistant 에 의해 거래가 자동으로 실행되며, 이 제품에 무료 로 포함되어 있습니다.) 최신 소식: 버전 1.64가 출시되었습니다. 이제 모든 거래에는 해당 지지/저항 구간 뒤에 Stop Loss가 설정됩니다. 또한 이번 버전에서는 EA의 성능을 향상시키기 위해 Smart Close 기능이 개선되었습니다. 8월 9일부터 라이브 신호는 버전 1.64로 운영되고 있습니다. 가격 계획: 현재 가격: $169 (얼리 어답터 혜택) 다음 예정 가격: $189 예정 소매 가격: $299 개발자 안내: 구매 후 저에게 연락하시면 최신 권장 설정 파일(Set File) , 사용 팁, 그리고 다른 M1 Quantum 사용자들과 소통할 수 있는 VIP 지원 그룹 초대장을 받으실 수 있습니다. 자주 묻는 질문 - 설정 파일 - 설치 가이드 M1 Quantum 은 M1 전용 전문 트레이딩 시스템으로, 손
PZ Trend Trading MT5
PZ TRADING SLU
3.8 (5)
Capture every opportunity: your go-to indicator for profitable trend trading Trend Trading is an indicator designed to profit as much as possible from trends taking place in the market, by timing pullbacks and breakouts. It finds trading opportunities by analyzing what the price is doing during established trends. [ Installation Guide | Update Guide | Troubleshooting | FAQ | All Products ] Trade financial markets with confidence and efficiency Profit from established trends without getting whips
Scalper Vault 는 성공적인 스캘핑에 필요한 모든 것을 제공하는 전문 스캘핑 시스템입니다. 이 표시기는 외환 및 바이너리 옵션 거래자가 사용할 수 있는 완전한 거래 시스템입니다. 권장 시간 프레임은 M5입니다. 시스템은 추세 방향으로 정확한 화살표 신호를 제공합니다. 또한 상단 및 하단 신호와 Gann 시장 수준을 제공합니다.  이 시스템은 사용하기가 매우 쉽습니다. 원하는 시장 지역의 화살표만 따라가면 됩니다. 엑시트는 가격이 적정 수준에 도달하거나 시장의 고점 또는 저점 신호가 나타날 때 수행됩니다.  표시기는 PUSH 알림을 포함한 모든 유형의 경고를 제공합니다. 인디케이터 구매 후 연락주세요. 내 개인 거래 권장 사항과 훌륭한 보너스 지표를 무료로 공유합니다! 나는 당신에게 행복하고 유익한 거래를 기원합니다!
Divergence Bomber
Ihor Otkydach
4.89 (94)
이 지표를 구매하신 분께는 다음과 같은 혜택이 무료로 제공됩니다: 각 거래를 자동으로 관리하고, 손절/익절 수준을 설정하며, 전략 규칙에 따라 거래를 종료하는 전용 도우미 툴 "Bomber Utility" 다양한 자산에 맞게 지표를 설정할 수 있는 셋업 파일(Set Files) "최소 위험", "균형 잡힌 위험", "관망 전략" 모드로 설정 가능한 Bomber Utility의 셋업 파일 이 전략을 빠르게 설치, 설정, 시작할 수 있도록 돕는 단계별 영상 매뉴얼 주의: 위의 모든 보너스를 받기 위해서는 MQL5 개인 메시지 시스템을 통해 판매자에게 연락해 주세요. 독창적인 커스텀 지표인 “Divergence Bomber(다이버전스 봄버)”를 소개합니다. 이 지표는 MACD 다이버전스(괴리) 전략을 기반으로 한 올인원(All-in-One) 거래 시스템입니다. 이 기술 지표의 주요 목적은 가격과 MACD 지표 간의 다이버전스를 감지하고, **향후 가격이 어느 방향으로 움직일지를 알려주
UZFX {SSS} 스캘핑 스마트 시그널 v5.0 MT5는 급변하는 시장에서 정확한 실시간 시그널을 필요로 하는 스캘퍼, 데이 트레이더, 스윙 트레이더를 위해 설계된 리페인팅이 없는 고성능 트레이딩 지표입니다. (UZFX-LABS)에서 개발한 이 지표는 가격 움직임 분석, 추세 확인 및 스마트 필터링을 결합하여 모든 통화 쌍과 시간대에서 높은 확률의 매수 및 매도 신호, 경고 신호, 추세 지속 기회를 생성합니다. 거래에 대한 망설임을 멈추고, 명확성, 정밀성, 그리고 규율 있는 시장 실행을 원하는 트레이더를 위해 설계된 체계적인 신호 시스템을 따르기 시작하세요. 제 말을 믿으세요. 이 지표는 MQL5에서 구할 수 있는 최고의 지표 중 하나입니다. 그러니 절대 놓치지 마세요!! “현명한 트레이더를 위한 스마트 신호” 지금 최신 버전 5.0이 출시되었으며, 사전 공지 없이 가격이 최대 $499.99까지 인상될 수 있으니 기회를 놓치기 전에 서둘러 구매하세요!! 최종 구매 전! 무료 체
SkyHammer Signal Pro
Shengzu Zhong
5 (4)
SkyHammer Signal Pro Entry, SL, TP 레벨이 고정되는 전문 No-Repaint 추세 신호 인디케이터 SkyHammer Signal Pro는 명확하고 고정되며 검증 가능한 신호를 원하는 트레이더를 위해 설계된 구조적인 추세 및 모멘텀 신호 인디케이터입니다. 특히 M1 및 M5 같은 낮은 시간대에서 가장 효과적으로 작동합니다. 이 인디케이터는 시장의 고점이나 저점을 예측하려고 하지 않습니다. 대신 신호를 생성하기 전에 확인된 시장 구조, 추세 방향, 모멘텀 강도, 건강한 변동성, 그리고 목표까지의 충분한 공간을 기다립니다. 주요 기능 고정 신호 메커니즘 신호가 확인되면 화살표, Entry, Stop Loss, TP1, TP2 레벨이 차트에 영구적으로 고정됩니다. 이후 캔들 움직임 때문에 신호가 사라지거나, 이동하거나, 변경되지 않습니다. 이를 통해 트레이더는 각 신호를 명확하게 검토할 수 있으며, 실시간 시장에서 신호가 사라지는 일반적인 문제를 피할 수 있습니다
The Oracle Pro
Ottaviano De Cicco
5 (1)
The Oracle Pro: Synthetic Multi-Timeframe Bias Engine for MT5 ️ Summer Launch Offer — Get The Oracle Pro for USD 199 (early buyers). Price rises with traction; final price USD 399. The Oracle Pro is a premium multi-timeframe bias engine for MetaTrader 5, built for demanding and professional traders. It answers one question with discipline: what is the directional bias on each timeframe right now, how strong is it, and how much do the timeframes agree? Everything is computed on closed bars only
PZ Divergence Trading MT5
PZ TRADING SLU
3.71 (7)
Unlock hidden profits: accurate divergence trading for all markets Tricky to find and scarce in frequency, divergences are one of the most reliable trading scenarios. This indicator finds and scans for regular and hidden divergences automatically using your favourite oscillator. [ Installation Guide | Update Guide | Troubleshooting | FAQ | All Products  ] Easy to trade Finds regular and hidden divergences Supports many well known oscillators Implements trading signals based on breakouts Displays
Crystal Heikin Ashi Signals
Muhammad Jawad Shabir
5 (4)
Crystal Heikin Ashi Signals—Professional Trend & Signal Detection Indicator Advanced Heikin Ashi Visualization with Intelligent Signal System for Manual & Automated Trading Final Price: $149 ---------> Price goes up $10 after every 10 sales . Limited slots available — act fast . Overview User Guide PDF Crystal Heikin Ashi Signals is a professional-grade MetaTrader 5 indicator that combines pure Heikin Ashi candle visualization with an advanced momentum-shift detection system. Designed for both m
DayTrader PRO
Davit Beridze
5 (4)
DayTrader PRO DayTrader PRO는 존 에러스(John Ehlers)의 Laguerre 필터와 강력한 자동 최적화 엔진을 결합한 고급 트레이딩 지표입니다. 고정된 파라미터를 사용하는 대신, 최근 시장 상황을 바탕으로 최적의 설정을 자동으로 검색하므로 지속적인 수동 조정 없이도 변화하는 시장 변동성에 대응할 수 있습니다. 이 지표는 명확한 매수(BUY) 및 매도(SELL) 신호를 생성하며, 현재 시장 변동성을 기준으로 계산된 적응형 손절매(Stop Loss) 및 익절(Take Profit) 레벨을 제공합니다. 내장된 추세, 효율성 지수(Efficiency Ratio), 변동성 및 캔들 필터 기능은 저품질의 진입 신호를 제거하여 신호의 정확도를 높여줍니다. 실시간 성능 대시보드에서는 현재 최적화된 설정값, 수익 요인(Profit Factor), 승률(Win Rate), 최대 낙폭(Drawdown) 및 기타 트레이딩 통계를 확인할 수 있습니다. 또한 DayTrader PR
Mahra Pro Indicator MT5
Mahra Said Mohammed Al Kaabi
Mahra Pro Indicator MT5 Overview Mahra Pro is a MetaTrader 5 chart indicator designed to support structured analysis of XAUUSD (Gold). It combines trend, momentum, volatility and price-structure conditions to identify potential buy and sell setups and display them directly on the chart. The indicator does not open, modify or close trades. All trading decisions and order execution remain under the user's control. Main features • Buy and sell signal arrows on the chart. • Fast and slow EMA lines w
Precision Spike Detector
Francisco Mandomo Simbine
5 (2)
Precision Spike Detector V3 – Institutional-Grade AI Trading System Attention: The price increases by US$50 for every 10 purchases.  Final price: US$599 Precision Spike Detector V3   is a   state-of-the-art, institutional-grade market analysis system   for   MetaTrader 5 , designed to detect   high-probability market movements   in synthetic indices such as   Boom, Crash, GainX, and PainX . After purchase, send me a private message to receive the optimized configuration files,  the installation
Volume Profile Multiple — 알고리즘 트레이딩을 위한 버퍼 지원 다중 블록 볼륨 프로파일 타임프레임을 바꿀 때마다 볼륨 프로파일을 블록별로 다시 그리고 재계산하는 데 지치셨나요? Volume Profile Multiple 은 차트에 여러 개의 연속된 볼륨 프로파일을 자동으로 그려주어, 마지막으로 표시된 구간뿐만 아니라 시장의 각 구간에서 기관의 관심이 실제로 어디에 있었는지를 보여줍니다. 이 지표가 하는 일 이 지표는 가격 히스토리를 N개의 캔들 단위로 블록화합니다(블록 개수와 블록당 캔들 수는 자유롭게 설정 가능). 각 블록마다 완전한 볼륨 프로파일을 계산합니다: 컨트롤 포인트(POC), 밸류 에어리어 상단/하단(VAH/VAL), 그리고 고거래량 구간과 저거래량 구간(HVN/LVN)입니다. 그 결과 블록별 시장 구조를 시각화한 지도가 만들어지며, 이를 통해 실제 거래량 기반의 매집 구간, 지지/저항, 그리고 밸류 에어리어 간 가격 순환을 파악할 수 있습니다. 알고
Quantum Direction 은 시장 방향을 파악하고, 초기 추세 변화를 감지하며, 필터링된 진입 및 청산 신호를 제공하도록 설계된 전문 추세 추종 지표입니다. 이 지표에는 MQL5 Market에서 무료로 제공되는 전문 거래 관리 도구 Quantum Trade Assistant 가 포함되어 있습니다. Quantum Direction 에 직접 연결하여 유효한 신호가 발생하면 자동으로 거래를 실행하거나, 설정된 청산 조건이 충족되면 자동으로 거래를 종료할 수 있습니다. 무료 Quantum Trade Assistant 다운로드 이 지표의 주요 기능: 다중 로직 추세 감지 — 여러 시장 분석 조건을 결합하여 잠재적인 추세 시작과 추세 방향 변화를 감지합니다. 세션 필터 — 선택한 거래 세션에 신호를 집중하여 시장 활동과 변동성이 높은 시간대의 시장 기회를 분석하는 데 도움을 줍니다. 상위 타임프레임 필터 — 상위 타임프레임을 사용하여 시장 방향을 확인하고 단기 돌파 또는 일시적인 시장
Gold Beaver Signals
Arnold Bobrinskii
Gold Beaver Signals 는 프로 브레이크아웃 로봇이 금 시장 어디에서 진입할지를 — 실제로 일어나기 전에 — 차트 위에 바로 보여줍니다. 라이브 증명 약속이 아닙니다. 동일한 전략이 언제든 확인할 수 있는 실제 공개 라이브 시그널에서 운영되고 있습니다: https://www.mql5.com/en/signals/2375536 무엇을 하는지, 쉽게 설명하면 이 인디케이터는 저희 트레이딩 로봇과 똑같은 방식으로 금을 관찰합니다. 중요한 레벨 아래에서 가격 압력이 쌓이면 차트에 브레이크아웃 라인 을 그립니다: 가격 위의 녹색 라인 — 가격이 이 레벨을 돌파하면 로봇은 매수합니다 가격 아래의 빨간 라인 — 가격이 이 레벨을 돌파하면 로봇은 매도합니다 모든 라인에 목표가(T1, T2, T3) 가 표시되어 거래의 목표를 항상 알 수 있습니다 여러 전략이 같은 레벨에서 일치하면 라인이 굵어집니다(x2, x3) — 더 강한 신호입니다 라인은 절대 리페인트되거나 다시 그려지지 않습니다.
Gartley Hunter Multi
Siarhei Vashchylka
5 (12)
Gartley Hunter Multi - An indicator for searching for harmonic patterns simultaneously on dozens of trading instruments and on all possible timeframes. Manual (Be sure to read before purchasing) | Version for MT4 Advantages 1. Patterns: Gartley, Butterfly, Shark, Crab. Bat, Alternate Bat, Deep Crab, Cypher 2. Simultaneous search for patterns on dozens of trading instruments and on all possible timeframes 3. Search for patterns of all possible sizes. From the smallest to the largest 4. All fou
제작자의 제품 더 보기
ChangingTrends
Evgeniy Zhdan
지표는 가장 가능성이 높은 추세 정지/반전 영역, 확실한 추세 이동 영역을 계산합니다. 계산은 다음을 고려합니다. 가격 변화율; 차트의 상대 편차 각도; 가격 움직임의 평균 진폭; "안락 지대"를 떠나는 가격; ATR 표시기의 값. 가격이 정지/반전 영역에 들어갈 때 표시기가 경고를 생성할 수 있습니다. 설정 전체 길이를 그립니다. - 차트가 끝날 때까지 영역을 그립니다. 정지 상승 추세 표시 - 상승 추세의 정지/반전 영역을 표시합니다. Show UP-trend - 자신감 있는 상승세 영역을 표시합니다. 하락 추세 표시 - 확실한 하락 추세 영역을 표시합니다. 정지 하락 추세 표시 - 하락 추세의 정지/반전 영역을 표시합니다. 영역 변경 경고 - 가격이 추세 중지/변경 영역에 들어갈 때 경고를 생성합니다. 다음은 각 거래 영역에 대한 색상 설정입니다.


Buy and sell zones
Evgeniy Zhdan
5 (2)
평면 및 추세를 결정하기 위한 표시기. 가격이 2개의 히스토그램과 2개의 선(빨간색 및 파란색) 중 하나보다 낮으면 판매 영역입니다. 이 버전의 표시기를 구매할 때 하나의 실제 계정과 하나의 데모 계정에 대한 MT4 버전 - 선물로(수신하려면 개인 메시지를 작성하세요)! 가격이 2개의 히스토그램과 2개의 선(빨간색 및 파란색) 중 하나보다 높으면 구매 영역입니다. MT4 버전:   https://www.mql5.com/en/market/product/3793 가격이 두 라인 사이 또는 히스토그램 영역에 있으면 시장에 명확한 추세가 없습니다. 간단히 말해서 시장은 평평합니다. 표시기의 작업은 스크린샷에 더 명확하게 표시됩니다. 지표는 선행 데이터를 얻는 데 사용할 수 있습니다. 또는 현재 추세의 상태를 확인합니다.
SuperTrend
Evgeniy Zhdan
2.5 (2)
The Supertrend Expert Advisor The Supertrend Expert Advisor with averaging elements. It has been developed during three months until I finally got good results. It is not a scalper. The minimum balance to start trading - 100 $. Is automatically adjusted to the 4 and 5-digit prices. Has an efficient risk management system. The lot and limit on the maximum lot is automatically calculated based on the settings specified in the EA. As a result, you have a complete automated trading system. Download
Stardust
Evgeniy Zhdan
StarDust searches for divergences in the values of several indicators considering them as signs of flat and enters the market if a relatively steady trend is detected. The Expert Advisor trades "basic" symbols with a low spread. The best results are achieved on М15. The EA automatically adjusts to 4 and 5-digit quote flows. Settings Comment_to_orders – comment to a placed order. The field can be left blank if no comment is required. MM – enable money management with automatic setting of a worki
Top Floor
Evgeniy Zhdan
The EA catches the price when it moves against the trend in an effort to open an order in an opposite direction (direction of the main trend). Screenshots illustrate examples of entries and the strategy gist. The EA uses stop losses depending on values of ATR. Settings: Lot_ - if Risk_ = 0, the EA will trade this lot; Risk_ - risk per one trade. Stop loss is taken into account; koeff_ATR - coefficient multiplied by the ATR value to calculate stop loss (the bigger the value, the bigger stop loss
FastBoom
Evgeniy Zhdan
The FastBoom EA finds the most probable points of price pullback/reverse and places an order. It places averaging orders if the price moves further against take profit. Settings of the EA: Lots - initial lot; LotExponent - multiplier for following orders (Martingale). 1 - no multiplier. TakeProfit - take profit in points; Stochastic Settings InpKPeriod - K Period of Stochastic InpDPeriod - D Period of Stochastic InpSlowing - Stochastic Slowing LevHigh - level for sell positions of Stochastic L
The Expert Advisor calculates the double/triple divergence of volumes, and starts trading. It uses a unique formula of lot calculation, which greatly improves stability of trading. Recommended TF - 1h. Currency pair - EURUSD , but the EA can be used on any trading instruments which are not subject to high volatility. Settings mode - trading direction can be set manually; close - order close level (details on the screenshot); Step between orders - step between orders in points; Maximum orders -
OrderOnLine
Evgeniy Zhdan
The Expert Advisor opens orders from the horizontal line, the a trader can set on any level by dragging using the mouse or by changing the line properties. For example, when a horizontal line is above the current price, the EA will open a Buy order once the horizontal line is reached. And vice versa: If the line is below the current price, the EA will open a sell order once the line is crossed. A buy crossover of the line is: opening of the current candlestick below the horizontal line; the curr
SellerATR
Evgeniy Zhdan
5 (1)
The Expert Advisor only sells. Recommended currency pairs : EURUSD; GBPUSD; USDCHF; USDJPY; USDCAD; AUDUSD; EURGBP; EURAUD; EURCHF; EURJPY; GBPCHF; CADJPY; GBPJPY; AUDNZD; AUDCAD; AUDCHF; AUDJPY; CHFJPY; EURNZD; EURCAD; CADCHF; NZDJPY; NZDUSD. Timeframe: H1. Percent% manages closing both loss-making and profitable deals based on the account overall status. Using the EA on 23 symbols mentioned above allows the robot to cope with the drawdown in case of a long trend. While positions on some pairs
Illusion
Evgeniy Zhdan
3 (2)
The Illusion EA uses the probability theory - after a series of consecutive virtual losses - i.e. right during a flat the EA already starts trading in the trend. In addition, the EA considers the ratio of bullish/bearish candles on the higher timeframes to determine the greatest probability of the price movement direction. Only 1 order can be opened at a time. In case of a loss the following order will be placed with an increased lot (the multiplication coefficient is set in the parameters). The
GoldenCoast
Evgeniy Zhdan
The indicator plots a trend line and determines the levels for opening trades, in case the price goes "too far" away from the trend level. More detailed information is available in the screenshots. Settings Away from the trend line - distance from the trend line to the trades level; Arrow Signal for deals - enable displaying an arrow when the price reaches the trades level; Size of Arrow - size of the arrow; Alert Signal for deals - enable generating alerts when the price reaches the trades lev
Turbina
Evgeniy Zhdan
5 (4)
The axiom of the Forex market is that any trend will be broken. The Expert Advisor determines trend direction (the pink line), and calculates levels for opening opposite orders depending on the settings. The value of Away from the trend line for Deal will be different for each pair and timeframe, depending on the volatility of the trading instrument. Next orders can be opened with an increased lot (a static lot is used by default). See the screenshots to understand the idea of the Expert Advisor
Odysseus
Evgeniy Zhdan
The Expert Advisor determines the moments of strong movements and opens a position in the direction of the most probable price movement. The strategy always uses stop loss and take profit. Several independent orders can be in the market (the maximum number is set in parameters). The goal of the EA's underlying trading system is the quantitative excess of the number of profitable deals over the number of losing ones. Recommended: EURUSD 5m; GBPUSD 5m; USDJPY 5m. The Expert Advisor is able to work
Vise
Evgeniy Zhdan
Vise is a trend indicator. The upper and lower lines follow the price showing the prevailing price direction. Frequent breakthroughs of the upper line indicate a bullish trend, while frequent breakthroughs of the lower line indicate a bearish one. Parameters Points for UpLine - initial number of points for the upper line; Points for DownLine - initial number of points for the lower line. During the breakthrough of the upper level (line), this level shifts upwards by Points for UpLine. If the up
Twinkle
Evgeniy Zhdan
Twinkle is a trend-based scalper using stop loss and take profit invisible to the broker. The EA does not look for trend reversals. The EA catches strong market movements and opens orders in the direction of the trend. Your broker will not see the order closing levels. The EA closes orders independently when reaching the take profit or stop loss levels specified in the settings. Recommended trading symbols: EURUSD M5, GBPUSD M5. ECN accounts with 5 digits quotes are recommended. Expert Advisor
Shine
Evgeniy Zhdan
4.75 (4)
This Expert Advisor implements elements of the Martingale system. Orders are opened at a specified distance from the moving average. The Parabolic SAR indicator and certain technical details are used to ensure the most accurate entries. The EA is highly customizable. It is recommended for simultaneous use on 4 currency pairs: EURUSD M15; GBPUSD M15; USDJPY M15; USDCAD M15. Despite good stability, it is advisable to disable the EA operation during the days rich in news releases. Configurations P
LuckyCase
Evgeniy Zhdan
LuckyCase is an Expert Advisor with martingale elements. The EA strategy is based on a significant "deviation" of the price from SAR inadicator and the Bands levels breakthrough point. The money management system is an essential part of the EA. It starts working after a trade is opened. Trades are closed after accumulating specified points of market orders, by deposit % or after an opposite side of the channel is broken through. The default EA settings are meant for: EURUSD M15; USDJPY M15. The
Elize
Evgeniy Zhdan
The Elize Expert Advisor has been designed to work with the EURCHF currency pair. It considers the peculiarities of this trading instrument, its behavior and dependence on the behavior of other currencies. In particular, when the currencies of the European countries (EURUSD, GBPUSD, EURNOK, EURCHF) move in the same direction, the EA starts its operation and opens a deal in the trend direction of the European currencies. In the event of price rollbacks, the EA uses a unique method for making the
AllTrendLines
Evgeniy Zhdan
4 (1)
Brief Description of the All Trend Lines Indicator The indicator analyzes the wave structure of the market. What it displays on the chart: First. Wave pivots (semaphores) • Red markers – wave highs • Yellow markers – wave lows • Yellow-green markers – additional local extremes Second. Trend lines • Purple/blue lines – trends based on highs (resistance/support) • Beige/green lines – trends based on lows • Lines are built automatically by connecting wave pivots of the same type Third. Main trend
FastTraffic
Evgeniy Zhdan
The Expert Advisor has been specifically developed for trading gold (Spot Gold). The strategy is based on Fibo levels calculated from the previous (first) candle High/Low and the width of the current and lower timeframes channel. If important Fibo levels of different orders are located in a single price channel (within a spread), the EA defines this channel as the target for price movement and starts operation. Martingale and averaging are not used. Each order is independent and is accompanied b
Jazz
Evgeniy Zhdan
The algorithm of this Expert Advisor determines the significant price levels, where the trend often turns into a flat or reverses. Stochastic Oscillator serves as an additional filter of overbought/oversold zones. The EA sets stop loss and take profit after opening an order. The underlying trailing strategy applies a trailing stop. The EA is recommended for simultaneously use on three trading instruments: EURUSD M5, GBPUSD M5, EURCHF M5. Settings: Comment to order - comment to orders. MaxRisk -
Panther
Evgeniy Zhdan
The Expert Advisor looks for technical analysis patterns formed on the higher (hourly) timeframe to start working on the 5-minute chart. Technical analysis patterns used: double top/double bottom, head/shoulders, flag, expanding/narrowing triangles. The Relative Vigor Index technical indicator is used as the filter for opening deals. It is based on the idea that on the bull market the closing price is, as a rule, higher, than the opening price. It is the other way round on the bear market. This
Spook
Evgeniy Zhdan
The Expert Advisor calculates the divergence on the current and higher timeframes. In case the divergences coincide, the EA starts its operation. Deals have strict take profit and stop loss levels. Each deal is managed by trailing stop. The strategy involves the use of a tight stop-loss. Therefore, losing deals and/or series of losing deals are not uncommon. This EA is not suitable for those who have difficulties coping with losing deals. The EA is recommended for simultaneous use on the followi
Grand
Evgeniy Zhdan
The Expert Advisor has been developed specifically for the features of the CHFJPY currency pair. The EA's algorithm determines the direction of the current trend and starts operation. In case of a price reversal within the current trend, the EA adds additional orders. If trend changes, the EA starts to work in the direction contrary to the initial grid of orders. If there were no conditions for closing orders and the trend direction changed again, the EA continues to work with the "first" grid o
Intensive
Evgeniy Zhdan
The Expert Advisor algorithm determines on daily charts those candlestick patterns, which set the intraday trading direction. The trading EA determines how long the price is moving in overbought/oversold zones and starts working in the direction of the expected trend movement. Each position is accompanied with a tight stop loss and take profit. Only one active position can be open in the market. The EA was developed and tested using 99% quality quotes. The Expert Advisor has a built-in news filt
Slender
Evgeniy Zhdan
The strategy of this Expert Advisor is based on a hedging system, which implies placing opposite orders. The EA algorithm determines trend beginning and opens a position in the trend direction. In case of a wrong entry, the EA tries to neutralize the drawdown through opposite (hedging) orders at a preset interval (Coefficient of counter orders). Orders are closed when one of the two values ​​is reached - profit in percent or profit in points. The EA does not use lot increase. The EA wast tested
Dreamer
Evgeniy Zhdan
Советник работает по принципу хеджирования с периодическими "перекосами" в сторону трендовых направлений. Направления тренда советник определяет на основании стандартного индикатора Parabolic Stop and Reverse system (SAR). Уникальная стратегия установки балансирующих позиций позволяет избегать больших просадок даже при самых не благоприятных рыночных условиях. Параметры по умолчанию рекомендуется использовать на торговом инструменте: GBPJPY 15m. Разработка и оптимизация параметров производились
Snoot
Evgeniy Zhdan
5 (1)
This Expert Advisor works using a grid in the direction of a trend movement with the step between opened positions defined in the settings. The positions are closed by the total take profit. The Parabolic SAR standard indicator is used to filter order opening, which comes in the MetaTrader 4 package. The EA has been developed and tested using 99,9% quality of quotes. Operation of the EA in real time can be viewed in the signals . The best trading results have been achieved on CHFJPY M15. Settin
Solipsism
Evgeniy Zhdan
The Expert Advisor builds channels based on the data obtained using ATR and MA indicators according to the equations: Upper channel border = MA + ATR * (FIBO); Lower channel border = MA - ATR * (FIBO), where FIBO has the following values: Style of Trade - Aggressive = 1.61852; Style of Trade - Average = 3.26704; Style of Trade - Calm = 4.85556. Trades are opened inside the channel with the intervals defined in the settings. Long and short positions are opened independently. Positions are closed
The trading statistics indicator notifies the trader of the aggregate income of the trading account for different time intervals. The indicator has wide display settings on the graph. There is a choice of one of the two display languages on the chart- English and Russian. Settings Indicator language (ENG, RUS) - Select the language to display on the chart; To control the magic (-1: any magic) - Entering the Magic for control (-1: any Magic); Angle of indicator tie - Selecting the angle of the c
필터:
리뷰 없음
리뷰 답변