Ric

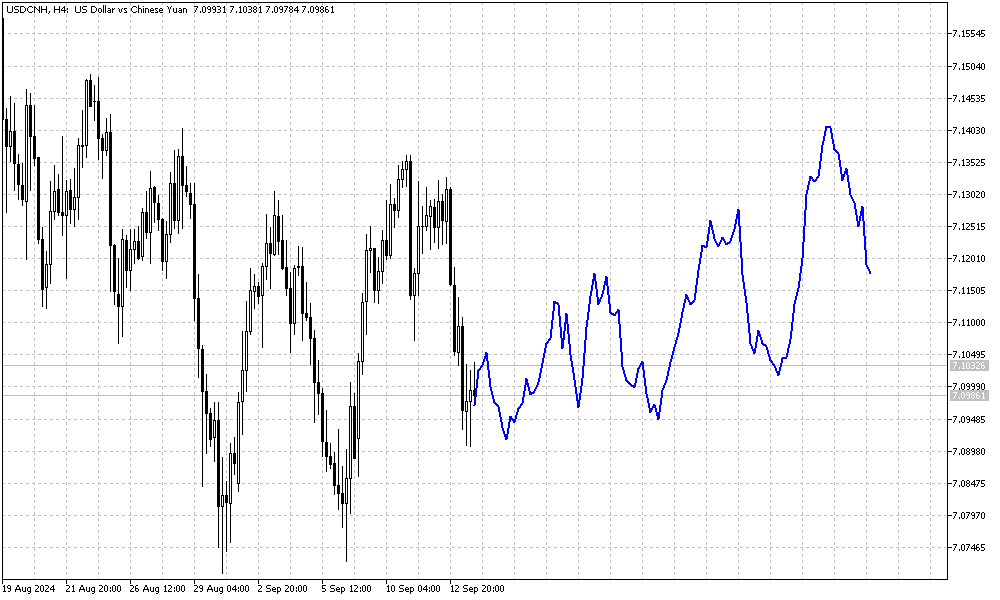
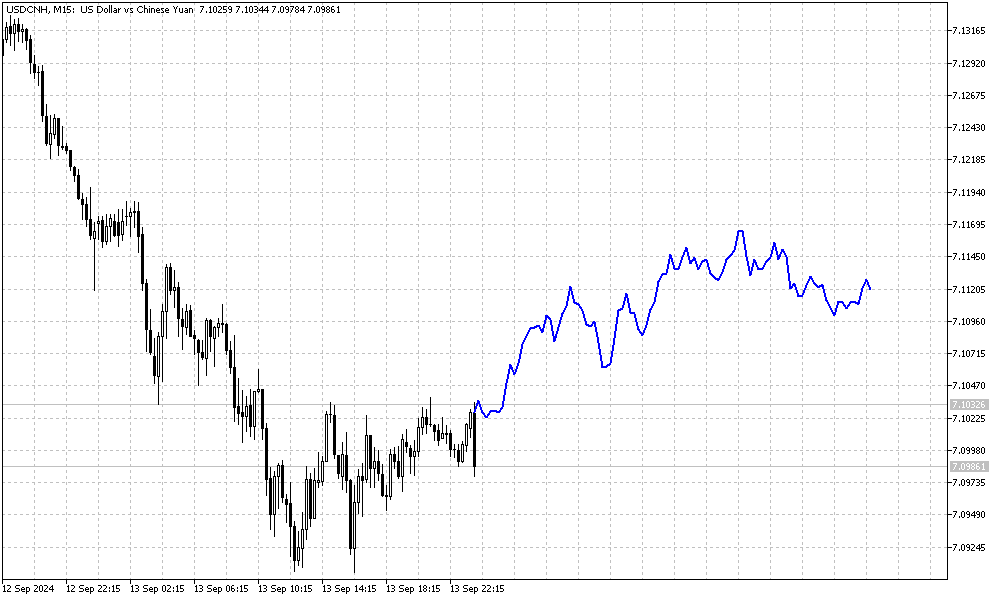
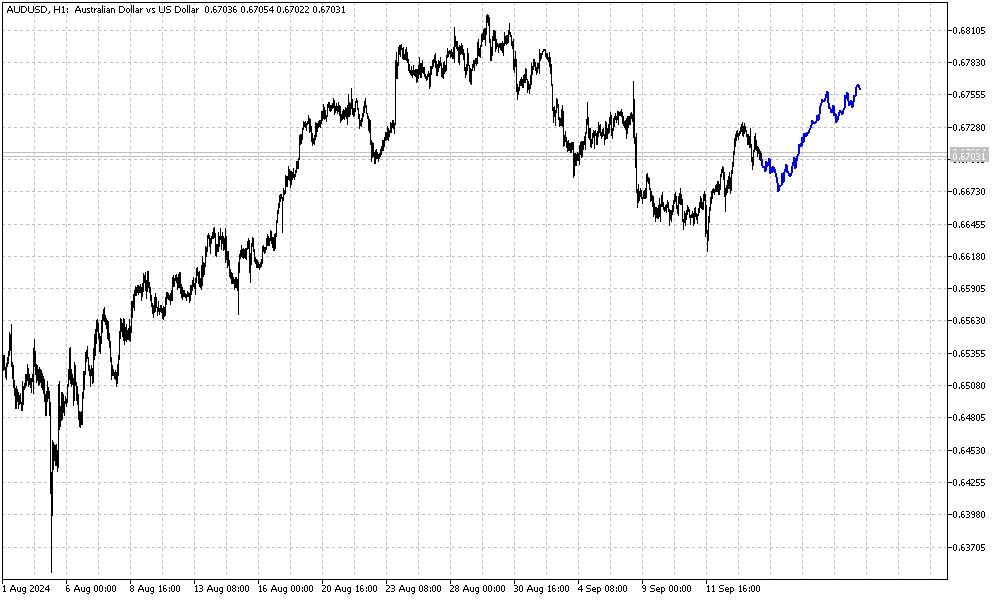
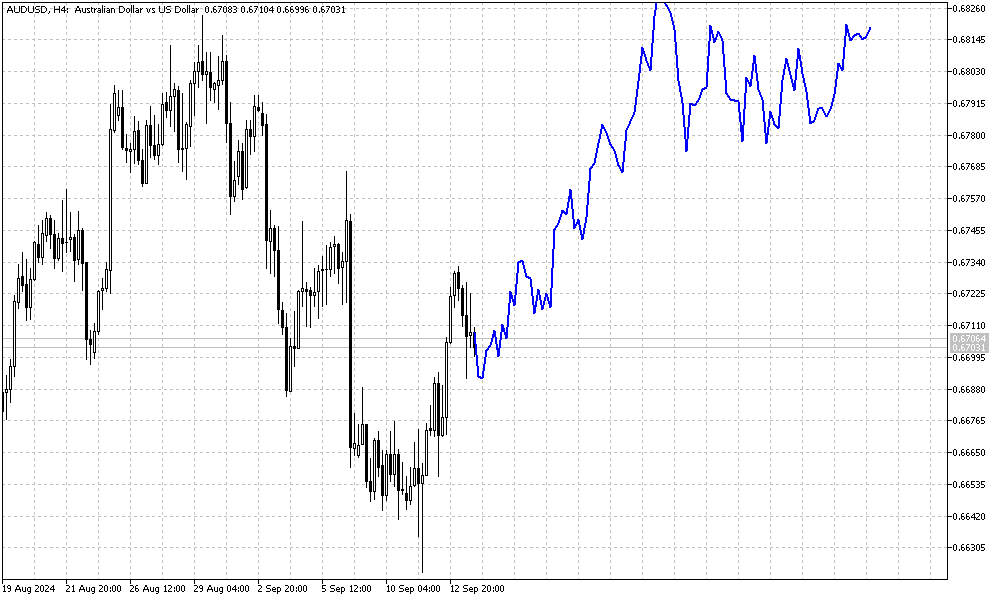
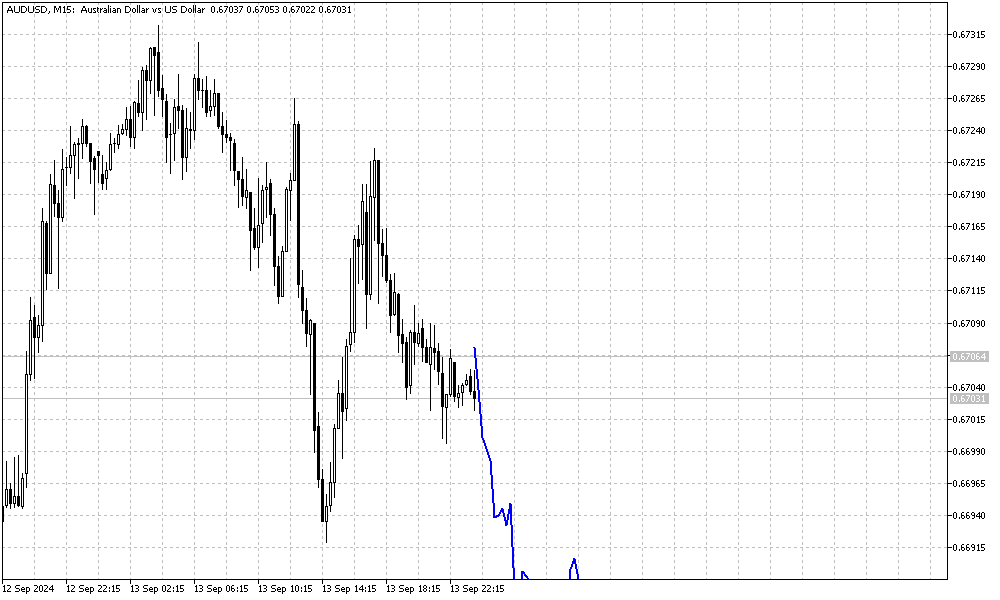
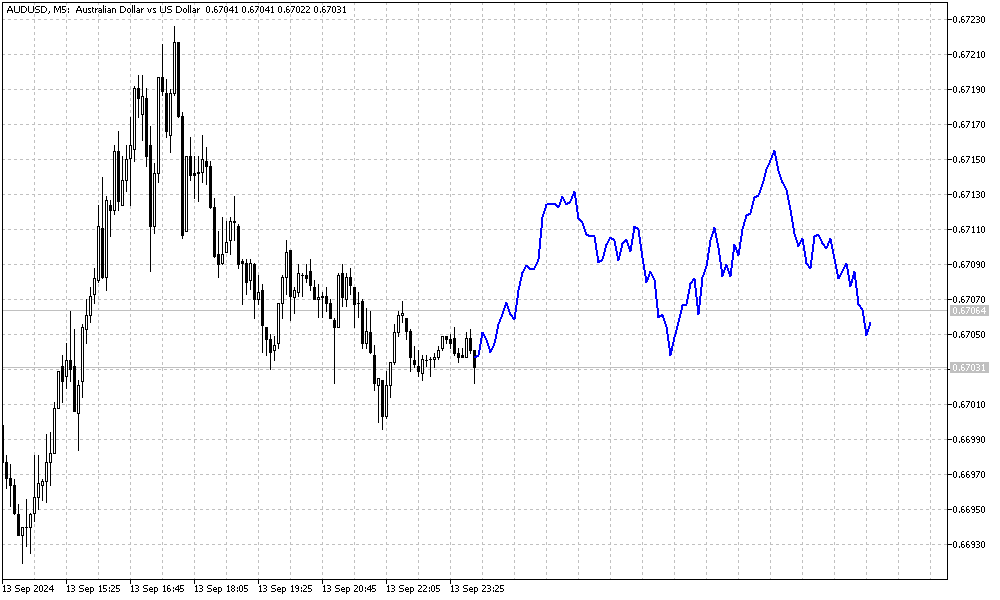
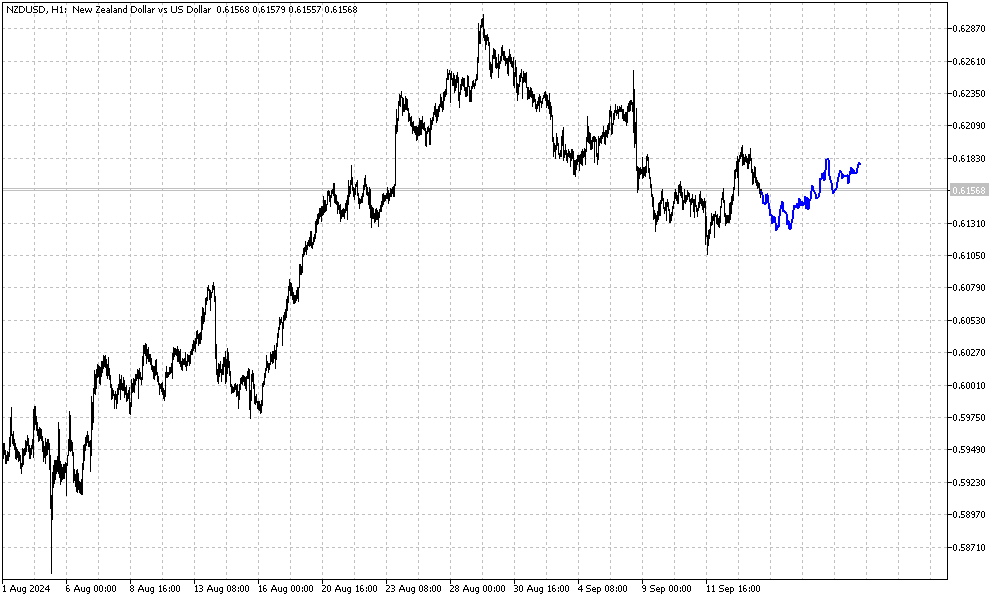
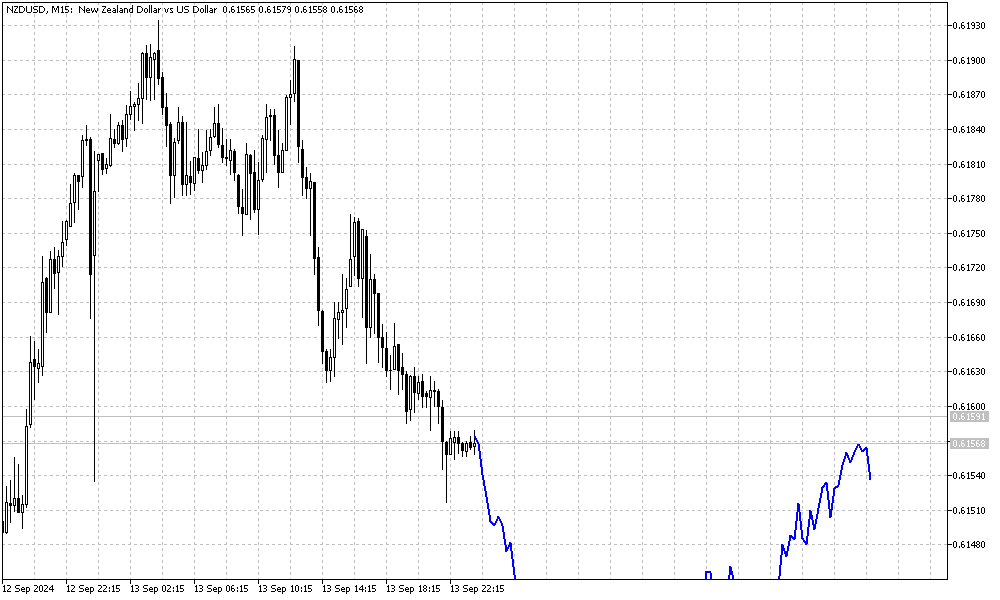
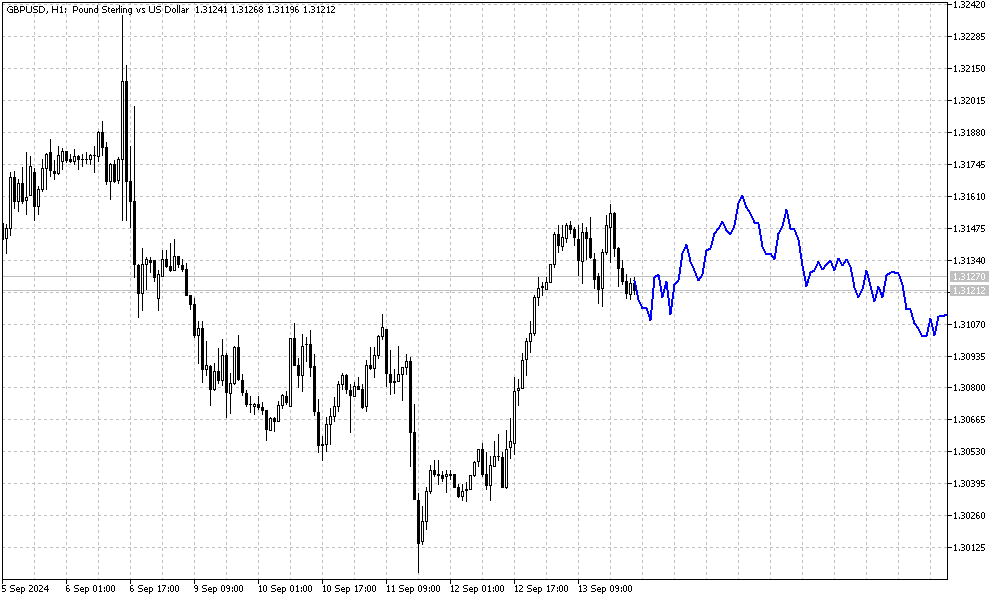
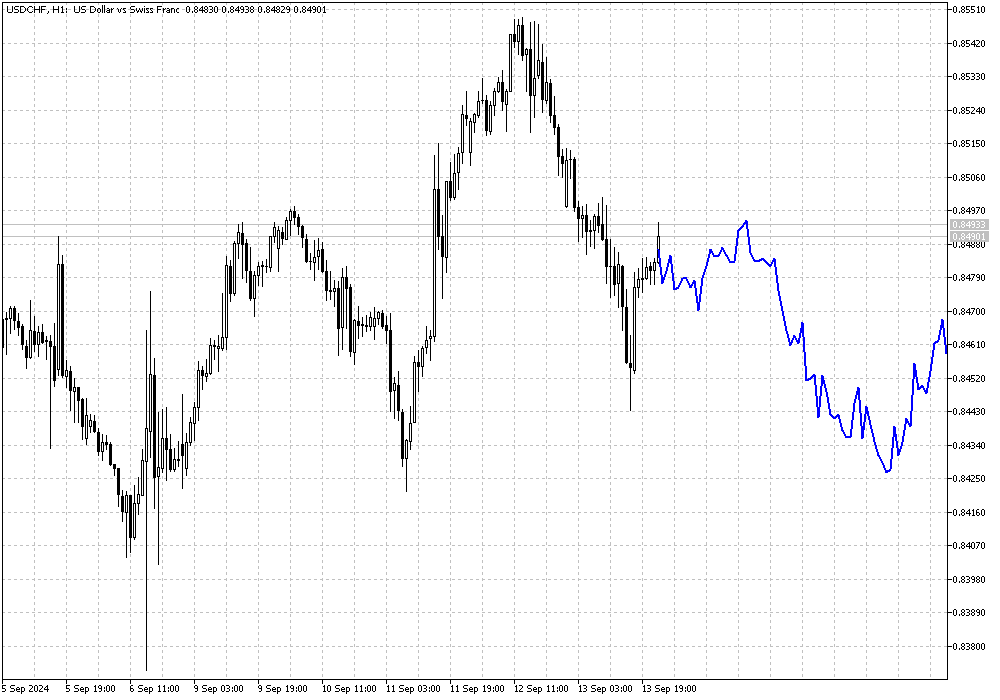
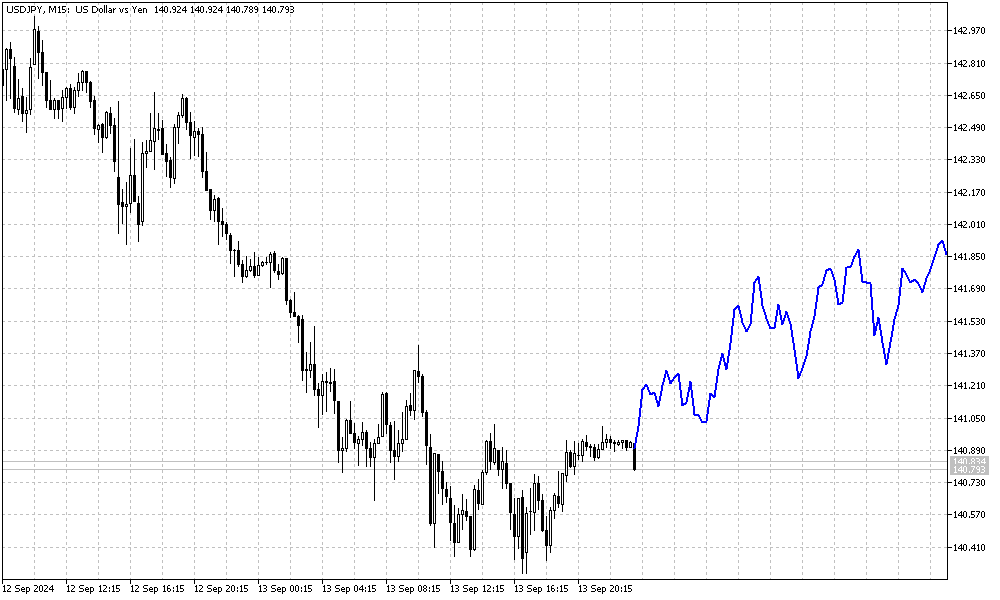
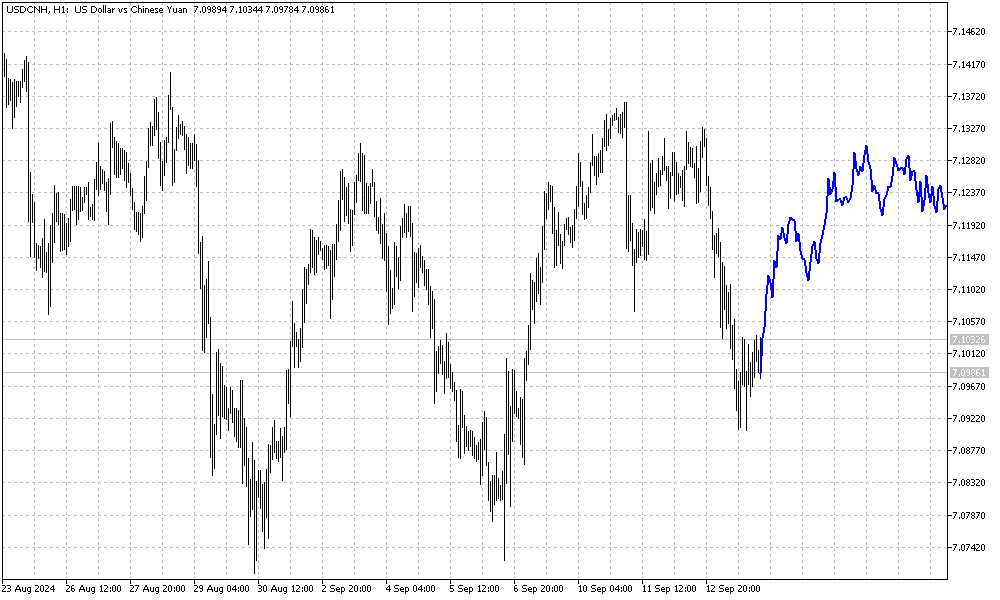
With this indicator, you can predict future price behavior for a certain number of bars ahead, giving you the ability to anticipate market dynamics. The indicator draws a forecast line, which models potential future price values based on sophisticated algorithms analyzing past data. This information can be leveraged not only for market entry and exit decisions but also for setting or adjusting stop-loss levels to better manage your positions.

Application of the Forecast

The data provided by the indicator can be utilized for:

  • Opening/closing positions: The forecasted data helps identify optimal entry and exit points in the market, reducing the likelihood of making decisions based on short-term price fluctuations.
  • Setting and adjusting stop-losses: Accurate price predictions allow for more precise placement of protective stops and enable adjustments in response to changing market conditions, thereby safeguarding your positions from excessive losses and improving trade management.

Key Indicator Parameters

The indicator can be customized with several important parameters:

  • HistoricBars: Determines the number of historical bars used for analysis. A larger dataset enables more thorough analysis, allowing the identification of long-term market trends and behavior patterns.

  • FutureBars: This parameter sets the number of bars for price prediction. The greater the number of future bars, the further the forecast extends, though this can increase the margin of error. It helps balance the length of the forecast with its accuracy.

  • Prediction: The prediction depth coefficient defines how far ahead the indicator "looks" into the future. Higher values may be used for long-term analysis, while lower values are suited for short-term forecasts. Selecting the right coefficient is crucial for aligning with your trading strategy.

Usage Recommendations

  • Timeframe: The indicator can be used across various timeframes, but to minimize the risk of false signals, it is recommended to set the timeframe to H15 or higher.

  • Risk Management: While this indicator provides valuable predictions, it is still important to account for potential false signals, particularly on lower timeframes. Using a small stop-loss can help manage risk and protect your capital.

Conclusion

This indicator is a powerful tool for technical analysis, allowing traders to forecast price movements and make more informed trading decisions. Its flexible settings enable customization to fit various strategies, and its ability to project several bars ahead offers a key advantage for successful trading in the financial markets.
Recommended products
Veltrion Smart Fibonacci   is a clean automatic Fibonacci structure overlay for MetaTrader 5. It automatically detects recent swing highs and swing lows, then draws key Fibonacci retracement levels directly on the chart. The indicator is designed to help traders visualize market structure, retracement zones, and the golden zone without manually drawing Fibonacci tools. Key Features Automatic swing high and swing low detection Clean Fibonacci retracement overlay Horizontal Fibonacci levels for a
TCM SMC Indicator for MetaTrader 5 marks market structure on your chart: supply and demand zones, breaks of structure, liquidity grabs and fair value gaps. Everything is calculated from closed candles. What it shows - Fresh supply and demand zones, extended to the right until price returns to them, with the option to also show zones that have been revisited - Breaks of structure (BOS), labelled on the chart - Liquidity grabs (LQG), where price runs a recent high or low and turns back - Fair valu
Smart Money Structure & Precision Trading Indicator (MT5) Smart Money Structure & Precision Trading Indicator  is a powerful Smart Money Concepts (SMC) indicator for MetaTrader 5, designed to help traders identify high-probability entries with institutional logic . This indicator automatically detects market structure in real time , highlights key liquidity levels , and provides clear, non-repainting signals so you can trade with confidence and precision. Whether you are a scalper, day trader, o
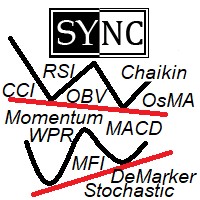
Divergence Sync MT5
Pavel Verveyko
5 (1)
Divergence and Convergence are important harbingers of reversals in stock markets. The Divergence Sync indicator is designed to automatically search for divergences on a large number of indicators with different parameters. The search for divergences is carried out on these indicators: (CCI, CHO, DeMarker, MACD, MFI, Momentum, OBV, OsMA, RSI, Stochastic, WPR,   Awesome Oscillator ). To search for divergences, you can use one technical indicator or search simultaneously on any number of indicat
"Manual channel drawing? Not anymore. Let the market structure reveal itself automatically." "Track long-term price zones 24/7, in real-time." Real Trader Pain Points Identifying pivot points manually takes   huge time   and   effort Difficult to adapt to   high volatility   and pinpoint   reliable channels Copy Ideas "Markets never sleep. Why should your analysis stop?" "Dozens of assets a day—how do you keep up?" Core Claim AutoChannels   automatically reads market structure , reducin
Trend Compass — Adaptive Trend Indicator with Multi-Timeframe Confirmation for MetaTrader 5 Overview Trend Compass is a MetaTrader 5 indicator that combines an adaptive trend line, a dynamic volatility channel, and a multi-timeframe confirmation panel in a single tool. Unlike classic moving averages, the line speeds up or slows down on its own depending on how efficiently price is actually moving — so it lags less in trends and stays quieter in ranging markets. The indicator is non-repainting: v

MetaHelper
Volodymyr Tseibei
This indicator automatically calculates and displays classic pivot points on your chart, helping identify key support and resistance levels for the current trading session. Features: · Plots Pivot (PP), Resistance 1-2 (R1, R2), and Support 1-2 (S1, S2) levels · Includes current close price line for reference · Color-coded lines: Blue for pivot, Red for resistances, Green for supports · Automatic calculation based on previous day's high, low, and close · Continuous lines across the chart for e
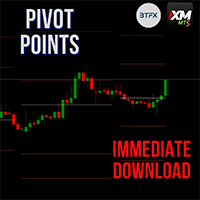
BTFX Pivot Points
Bradley Thomas Farrington
The BTFX Pivot Points is an indicator which calculates the Support and Resistance levels for each day. By using this indicator the pivot levels point out clear targets to aim for. The resistance levels are shown in purple above the silver pivot line. The support levels are shown in Orange and can be found below the silver pivot line. This indicators works very well when used with The BTFX Daybreak Indicator. For a more in depth explanation of these indicators please watch the Youtube video attac
GP Confluence Scanner MT5 Advanced Multi-Timeframe Market Structure & Confluence Analysis Don't get stopped out easily again! GP Confluence Scanner MT5 is an advanced technical analysis indicator designed to reveal important market levels, hidden support and resistance, and multiple technical confluences before entering a setup. Rather than relying on a single indicator, GP Confluence Scanner examines multiple technical factors to identify areas where significant market reactions may occur. Key
Projection of Phi
Nestor Jose Mendez Boza
Projection of Phi   Is a technical indicator that calculates dynamic support and resistance levels. It uses angular geometric projections and mathematical ratios to identify market expansion ranges. Features: Dynamic Fibonacci Expansion: Extension level projection Geometric Calculation: Angular analysis and mathematical ratios Visualization: Graphical objects with informative labels Compatibility: M1 to H4 timeframes Applications: Identification of zones for trade management Analysis of volatil
FREE
Smart Trendlines MT5
Suvashish Halder
5 (3)
Smart Trendlines – No.1 Trendlines Indicator Smart Trendlines is a precision tool that automatically draws trendlines based on every valid pivot point, helping traders identify key support and resistance zones. It continuously adjusts as new market pivots form, providing a live and accurate reflection of price structure. Whether you’re tracking trends, preparing for reversals, or anticipating breakouts — this indicator keeps you one step ahead. It works seamlessly across all assets including For
UFO Market Structure & Fibo Pro UFO (Unfilled Order Institutional) zone + Non-Repaint Market Structure + Golden Fibonacci Entry Stop trading like retail. Start tracking institutions. UFO Market Structure & Fibo Pro is an all-in-one visual assistant designed to automatically map Institutional Supply & Demand, Market Structure, and Golden Fibonacci entries. No more subjective drawing, no more lagging indicators. Just pure, objective institutional footprints. UNIVERSAL MARKET COMPATIBILITY Work
MarketMagnet
Kelly Adediran Raymond
Are you ready to take your trading journey to new heights? Look no further than MarketMagnet, this groundbreaking indicator designed to propel your trading success with excitement and accuracy. Powered by the convergence of Momentum and CCI (Commodity Channel Index), MarketMagnet equips traders with the ultimate tool to determine direction and entry prices for a wide range of recommended currency pairs and instruments. It is designed for traders seeking to scalp for a few pips on lower timeframe
Product Name: FXmans Pro SMC Structure Description: Navigate the markets with institutional precision. FXmans Pro SMC Structure is an advanced, algorithmically optimized indicator designed to decode Smart Money Concepts (SMC) directly on your chart. Built on a highly secure and lightweight engine, this tool avoids the lag of standard pivot points by utilizing Bill Williams' Fractal logic for laser-accurate market structure mapping. Whether you are a day trader or a swing trader, this indicator f
Forex Uncovered PRO v4.60 Professional Support & Resistance Breakout Indicator for MetaTrader 5 Overview Forex Uncovered PRO v4.60 is a professional Support & Resistance Breakout indicator built for MetaTrader 5. Unlike traditional trend indicators, Forex Uncovered focuses on Price Action by automatically identifying significant swing highs and swing lows, building dynamic support and resistance zones, and detecting confirmed breakout opportunities. To reduce false signals, the indicator combine
Rocket Trend
Andriy Sydoruk
The Rocket Trend indicator is trending. The indicator draws two-color points connected by lines along the chart. This is a trend indicator, it is an algorithmic indicator. It is easy to work and understand when a blue circle appears, you need to buy, when a red one appears, sell. The indicator is used for scalping and pipsing, and has proven itself well. Rocket Trend is available for analyzing the direction of the trend for a specific period of time. Ideal for novice traders learning the laws o
Pivot Confluence Zones   is a   technical analysis indicator for MT4 and MT5   designed to identify   retracement zones ,   reversal areas , and   support and resistance levels   by combining   Pivot Points ,   Fibonacci Retracement ,   ATR , and   ADR   into a single trading workspace. Instead of relying on a single technical tool, the indicator searches for   confluence zones   where multiple trading levels overlap, helping traders evaluate areas that may attract increased market attention. To
SR Zones & Pivot Panel EA - All-in-One Trading Tool SR Zones & Pivot Panel EA   is a powerful hybrid tool that combines automatic   Support/Resistance Zones ,   Daily Pivot Points , and a   Compact Trading Panel   into one interface. It helps traders visualize key price levels on any timeframe while executing trades quickly and efficiently. Designed for precision and speed, this tool keeps your chart clean while providing all the data you need for intraday trading. Key Features 1. Automati
MasterCharts
Alexander Berger
You can think of these indicators as moving pivot points. MasterChartsTrading Price Action Indicators show good price levels to enter or exit a trade. The Blue indicator line serves as a Bullish Trend setter. If your instrument closes above the Blue line, we think about going Long (buying). When your trading instrument closes below the Red line, we think about Shorting (selling). It is very easy to read price action if you have a reference point. These support/resistance lines are there to help
Owl Smart Levels MT5
Sergey Ermolov
4.03 (32)
When trading with the trend, the main difficulty is not finding a level, but understanding where an entry is actually valid. Price often reacts to levels but fails to follow through — which leads to false entries or missed moves. Owl Smart Levels does not just show levels , but zones formed based on market structure and pullbacks. This allows you to evaluate entry points differently and avoid a portion of false signals. What is included in the Owl Smart Levels system? Owl Smart Levels is not ju
TD Sequential Pro for MT5: The Ultimate Market Reversal Blueprint Are you tired of guessing where a trend ends? Are you sick of buying "the dip" only to watch the market drop lower? Stop gambling. Start trading with mathematical precision. TD Sequential Pro is a institutional-grade trend-exhaustion indicator fully optimized for MetaTrader 5. Based on Tom DeMark’s legendary time-and-price mechanics, this software tracks smart money accumulation and distribution phases in real-time, delivering th
VP RSI Reversal Signal Arrows — Product Description Short Description VP RSI Reversal Signal Arrows is a clean MetaTrader 5 indicator that displays buy and sell reversal arrows when RSI exits oversold or overbought zones, with an optional moving average trend filter. Main Description VP RSI Reversal Signal Arrows is a visual technical analysis indicator for MetaTrader 5. It is designed for manual traders who want a simple RSI-based reversal assistant directly on the price chart. The indicator
Murphy Order Block is a highly optimized and visually clean indicator for identifying key institutional zones based on pure market structure logic. It is designed for traders who follow Smart Money Concepts (SMC), ICT-style OB trading, and structure-based break & retest strategies. This indicator dynamically detects and draws: - **1 valid Bullish Order Block (Buy Zone)** - **1 valid Bearish Order Block (Sell Zone)** ### Key Features: **Market Structure-Based Logic**   - Uses swing high
If you like this product, please give it a  5 star rating as a token of appreciation. This indicator calculates and draws pivot points and support/resistance levels for both daily and weekly timeframes: Pivot (central) level Support levels S1, S2, S3 Resistance levels R1, R2, R3 It allows showing daily, weekly, or both sets of pivots , giving traders visual references for potential support/resistance areas. Pivot mode: Choose which pivots to display (weekly, daily, or both). Colors and style: C
FREE
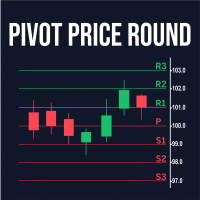
Pivot Price Round
Pablo Filipe Soares De Almeida
Pivot Round Price is an indicator based on the classic Pivot Points formulas (Classic Pivots), maintaining exactly the original calculations of support, resistance, and central pivot, without changing any part of the standard mathematics used. The difference and main advantage of this indicator is that the levels are automatically adjusted to rounded prices, making visualization easier on assets with multiple decimal places and making the levels much more relevant on the actual asset chart. With
Stochastic Horizontal Line Alert for MT5 Turn your Stochastic horizontal levels into automatic alerts. Simply draw a line on the Stochastic window and let the indicator monitor it for you.  Your Stochastic levels are monitored automatically — so you don't have to watch the chart all the time. Stochastic Horizontal Line Alert is a simple and convenient MetaTrader 5 indicator that monitors horizontal levels drawn in the Stochastic Oscillator window and automatically alerts you when the Stochasti
The indicator is the advanced form of the MetaTrader 4 standard Fibonacci tool. It is unique and very reasonable for serious Fibonacci traders. Key Features Drawing of Fibonacci retracement and expansion levels in a few seconds by using hotkeys. Auto adjusting of retracement levels once the market makes new highs/lows. Ability to edit/remove any retracement & expansion levels on chart. Auto snap to exact high and low of bars while plotting on chart. Getting very clear charts even though many ret
Fair Value Gap (FVG) & Inversion Fair Value Gap (iFVG) – TradingLabs ID In the ICT (Inner Circle Trader) and Smart Money Concepts (SMC) methodology, a Fair Value Gap (FVG)—also known as an Imbalance—occurs when the price moves with extreme momentum, leaving behind a void of liquidity. These unfilled gaps act as magnets for future price action, making them the most high-probability retracement and entry zones for professional traders. But not all FVGs are created equal. How do you know which gap
Fractal Support & Resistance Automatic Support and Resistance Indicator Based on Fractal Structure Short Description Fractal Support & Resistance is a technical analysis indicator that automatically identifies and displays support and resistance levels using fractal-based price structure detection. Overview Fractal Support & Resistance is an indicator designed to detect support and resistance zones using configurable fractal logic. The indicator automatically scans historical price structure an
ShooterSignal ShooterSignal is a multi-timeframe market structure indicator for MetaTrader 5. The indicator analyzes price data and identifies swing points used to display market structure on the chart. Market Structure The indicator identifies: Higher High (HH) Higher Low (HL) Lower High (LH) Lower Low (LL) These structural points are displayed on the chart according to the selected timeframe. Structure Events ShooterSignal can display structural events based on detected price movement, includ
Buyers of this product also purchase
Entry Points Pro shows you where to enter, where to put the stop and what lot to trade — before you place the order. PRICE Now 199 USD: 8 copies at this price, then 249 USD. The final price is 349 USD. I make my money trading the markets, and I show it, so I don't need to sell this indicator to everyone. It is a tool for traders who think for themselves, not a magic button. No breakout, no trade. A gray arrow is a cancelled signal: price did not break the signal candle, so there was no entry
Gann Made Easy   is a professional and easy to use Forex trading system which is based on the best principles of trading using the theory of W.D. Gann. The indicator provides accurate BUY and SELL signals including Stop Loss and Take Profit levels. You can trade even on the go using PUSH notifications. PLEASE CONTACT ME AFTER PURCHASE TO GET TRADING  INSTRUCTIONS   AND GREAT EXTRA INDICATORS  FOR FREE! Probably you already heard about the Gann trading methods before. Usually the Gann theory is a
Ultra Indicator
Ihor Otkydach
5 (1)
ULTRA is a technical indicator that operates on an “all-in-one” basis—it independently analyzes the market, generates trading signals, displays levels for setting stop-loss orders, and suggests when to close trades to lock in profits or minimize losses. In other words, it doesn't matter if you don't know how to analyze the market, determine levels—where to set your stop-loss—or struggle with money management. ULTRA will do all of that for you! BUYER BONUS: After purchasing the ULTRA indicator, s
Boba Analysis Suite
Trade Ready Solutions LLC
5 (2)
Boba Analysis Suite Boba Analysis Suite is an analytical indicator for MetaTrader 5. It brings market structure, relevant price zones and broader market context together in a single chart view. Developed through practical experience as a trader and trading coach, it supports a structured analysis process: assessing market direction, identifying important levels and considering multiple timeframes together. Analysis in Context Individual signals gain meaning through context. Boba Analysis Suite h
M1 Sniper MT5
Oleg Rodin
5 (7)
M1 SNIPER  is an easy to use trading indicator system. It is an arrow indicator which is designed for M1 time frame. The indicator can be used as a standalone system for scalping on M1 time frame and it can be used as a part of your existing trading system. Though this trading system was designed specifically for short-term trading, it still can be helpful for all traders. This trading system can be used with any forex pair and time frame, though lower time frames are recommended from M1 up to M
Apex Patterns PRO Buy Indicator - Get Expert Advisor Based on it for FREE. Self-Optimizing Chart Pattern & Breakout Intelligence Traditional pattern scanners rely on fixed inputs, often underperforming when market volatility and structures shift. Apex Patterns PRO is designed to adapt to changing market conditions by combining structural chart pattern recognition, momentum filtering, and statistical self-optimization into one analytical framework. Adaptive Scanning Engine Self-Optimizing Patter
SQN Max indicator for MT5 by ITC
Renaud Herve Francois Candel
Sqn Max Indicator Sqn Max is an exclusive indicator to trade the market with high effectiveness. The indicator is based on price action, volatility and trend. This indicator is as simple as possible but not too simple. The indicator can generate alerts to ease the trading process. You don't have to stay all day in front of your screen. The indicator can be used with any class of assets and with any time frame. It is possible to achieve better results trading our list of selected assets. We achi
Divergence Bomber
Ihor Otkydach
4.89 (94)
Each buyer of this indicator also receives the following for free: The custom utility "Bomber Utility", which automatically manages every trade, sets Stop Loss and Take Profit levels, and closes trades according to the rules of this strategy Set files for configuring the indicator for various assets Set files for configuring Bomber Utility in the following modes: "Minimum Risk", "Balanced Risk", and "Wait-and-See Strategy" A step-by-step video manual to help you quickly install, configure, and
Currency Strength Wizard   is a very powerful indicator that provides you with all-in-one solution for successful trading. The indicator calculates the power of this or that forex pair using the data of all currencies on multiple time frames. This data is represented in a form of easy to use currency index and currency power lines which you can use to see the power of this or that currency. All you need is attach the indicator to the chart you want to trade and the indicator will show you real s
Multi Currency Strength and Momentum Indicator MT5 Dynamic Forex28 Navigator is the evolution of our long-time, popular indicators, combining the power of five in one: Advanced Currency Strength28 Indicator (700 reviews) Advanced Currency IMPULSE with ALERT (530 reviews) Currency Strength EXOTICS GOLD Impulse with Alert CS28 Combo Signals (recent Bonus) No need to buy four indicators and stack them on your charts. All of it is merged into one powerful indicator: the strength of the 28 Forex pair
Azimuth Pro
Ottaviano De Cicco
5 (7)
Azimuth Pro V2: Synthetic Fractal Structure and Confirmed Entries for MT5 Overview Azimuth Pro is a multi-level swing structure indicator by Merkava Labs . Four nested swing layers, swing-anchored VWAP, ABC pattern detection, three-timeframe structural filtering, and closed-bar confirmed entries — one chart, one workflow from micro-swings to macro-cycles. This is not a blind signal product. It is a structure-first workflow for traders who care about location, context, and timing. 1. What Change
ARICoins
Temirlan Kdyrkhan
ARICoin is a powerful trading companion designed to generate high-probability entry signals with dynamic TP/SL/DP levels based on volatility. Built-in performance tracking shows win/loss stats, PP1/PP2 hits, and success rates all updated live. Key Features: Buy/Sell signals with adaptive volatility bands Real-time TP/SL/DP levels based on ATR Built-in MA Filter with optional ATR/StdDev volatility Performance stats panel (Success, Profit/Loss, PP1/PP2) Alerts via popup, sound, push, or email Cust
Neuro Poseidon MT5
Daria Rezueva
4.68 (53)
Neuro Poseidon is a new indicator by Daria Rezueva. It combines precise trading signals with adaptive TP/SL levels - creating best possible trades as a result! Message me and get  Neuro Poseidon Assistant  as a gift to automize your trading process! What makes it stand out? 1. Proven profitability on all assets and timeframes 2. Only confirmed BUY and SELL signals present on the chart 3. Adaptive TP & SL levels generated by the software for each trade 4. Easy to understand - suitable for al
Advanced Supply Demand MT5
Bernhard Schweigert
4.53 (15)
Best Solution for any Newbie or Expert Trader! This indicator is a unique, high quality and affordable trading tool because we have incorporated a number of proprietary features and a new formula. With this update, you will be able to show double timeframe zones. You will not only be able to show a higher TF but to show both, the chart TF, PLUS the higher TF: SHOWING NESTED ZONES. All Supply Demand traders will love it. :) Important Information Revealed Maximize the potential of Advanced Supply
ScalpPoint
Temirlan Kdyrkhan
ScalpPoint is a powerful trading companion designed to generate high-probability entry signals with dynamic TP/SL/DP levels based on volatility. Built-in performance tracking shows win/loss stats, PP1/PP2 hits, and success rates — all updated live. Key Features: Buy/Sell signals with adaptive volatility bands Real-time TP/SL/DP levels based on ATR Built-in MA Filter with optional ATR/StdDev volatility Performance stats panel (Success, Profit/Loss, PP1/PP2) Alerts via popup, sound, push, or emai
Superhero
Ihor Otkydach
5 (3)
The SUPERHERO indicator is a multi-currency trading system designed on an "all-inclusive" basis. The indicator independently analyzes the market and provides signals on when to open and close trades. It uses Stop Loss and Take Profit orders. The R:R ratio is 1:1. This system can send push notifications to your smartphone, so you can place trades "on the go" without needing to be tied to a PC. It's perfect for proprietary trading firms. A BONUS FOR EVERY CUSTOMER: Every buyer of this indicator wi
Bill Williams Advanced
Siarhei Vashchylka
5 (11)
Bill Williams Advanced is designed for automatic chart analysis using Bill Williams' "Profitunity" system. The indicator analyzes four timeframes at once. Manual (Be sure to read before purchasing) Advantages 1. Analyzes the chart using Bill Williams' "Profitunity" system. Signals are displayed in a table in the corner of the screen and on the price chart. 2. Finds all known AO and AC signals, as well as zone signals. Equipped with a trend filter based on the Alligator. 3. Finds "Divergence Bar
Naked Forex Kangaroo Tail Pro Indicator Kangaroo Tail Pro Indicator is a pattern recognition indicator for Forex, Stocks, Indices, Futures, Commodities and Cryptos. The Kangaroo Tail is a multi-bar pattern. The Kangaroo Tail pattern is very effective and is very simple to trade. The strategy that comes with the Kangaroo Tail is based on price action. The indicator does what it was designed for: displaying Kangaroo Tail patterns.     Don't expect to follow the up and down arrows and make mone
AriFocus
Temirlan Kdyrkhan
AriFocus - Non-Repainting Buy/Sell Signals AriFocus - one clear signal. AriFocus marks buy and sell signals directly on the chart and suggests a stop-loss level for each one. Every signal is confirmed on bar close and never repaints. - Buy/sell arrows, confirmed on bar close - Suggested stop-loss level for every signal - Trend band and candle coloring to show direction at a glance - 10 ready-made presets, or your own settings (14 calculation methods) - Pop-up, push and email alerts with entr
Boom Crash GainX PainX Spike Detector Overview Boom Crash GainX PainX Spike Detector is a professional analytical indicator for Deriv synthetic indices. It is designed to identify potential spike opportunities using multiple technical indicators, price movement analysis, and tick-based cycle monitoring. The indicator supports both market directions in one tool: Boom and GainX: BUY signals for potential upward spikes. Crash and PainX: SELL signals for potential downward spikes. The indicator auto
Volatility Master for MetaTrader is a real-time dashboard tool that scans up to  50 symbols  to identify high-volatility , trending markets instantly. With bullish/bearish signals, customizable alerts, and a user-friendly interface, it helps you avoid range-bound conditions and focus on high-probability trades. Clarity leads to confidence. Trade confidently and protect your capital effectively with this powerful dashboard. We don't offer free or bonus indicators in exchange of reviews from you.
Scalper Vault is a powerful, fully-equipped trading system designed for traders who want to achieve consistency in intraday trading . This high-precision indicator serves as a complete, standalone trading system that delivers institutional-grade analysis for both Forex and Binary Options traders. PLEASE CONTACT ME AFTER PURCHASE TO GET MY TRADING TIPS PLUS A GREAT BONUS! By eliminating the guesswork and complex manual analysis, Scalper Vault allows you to focus purely on execution using easy to
FX Sniper Orange Indicator FX Sniper Orange is an exclusive indicator to spot situations where market has gone too far and market could reverse soon after. The indicator displays arrows in your chart indicating probable future price action (see screenshot attached). FX Sniper Orange never repaints. Once candle is closed signal is confirmed and arrow will never disappear. Users of the indicator can setup alerts when new arrows are displayed in the chart. Inputs of the indicator are: Distanc
ARIPoint
Temirlan Kdyrkhan
1 (4)
ARIPoint is a powerful trading companion designed to generate high-probability entry signals with dynamic TP/SL/DP levels based on volatility. Built-in performance tracking shows win/loss stats, PP1/PP2 hits, and success rates all updated live. Key Features: Buy/Sell signals with adaptive volatility bands Real-time TP/SL/DP levels based on ATR Built-in MA Filter with optional ATR/StdDev volatility Performance stats panel (Success, Profit/Loss, PP1/PP2) Alerts via popup, sound, push, or email Cu
SkyHammer Signal Pro Professional No-Repaint Trend Signal Indicator with Locked Entry, SL and TP Levels SkyHammer Signal Pro is a structured trend and momentum signal indicator designed for traders who want clear, fixed, and verifiable trading signals. It works best on lower timeframes such as M1 and M5 . The indicator does not try to predict tops or bottoms. Instead, it waits for confirmed market structure, trend direction, momentum strength, volatility quality, and target space before generati
Zain Gold Scalping
Ahmed Gamal Abdel Nasser Mohamed
A complete price-action analysis tool built around dual independent entry logic, each confirmed against a volatility band, combined with a configurable set of nine optional confirmation filters that let you shape exactly how conservative or aggressive the tool's signals behave. Core Strategy Two independent entry setups, each triggering only when price moves outside a dynamic volatility band — giving two distinct ways to spot potential reversal points, which can be used together or separately.
Ziva LSE System
Hassan Abdullah Hassan Al Balushi
ZIVA LSE System A Professional Liquidity & Structure Execution Framework Executive Overview ZIVA LSE System is a professionally engineered analytical framework designed to interpret market behavior through structural logic and liquidity dynamics. It is not positioned as a conventional indicator. Rather, it functions as a structured execution environment that organizes price action into a clear, disciplined decision-making model. The system is built to deliver consistency, clarity, and controlled
Btmm state engine pro
Garry James Goodchild
5 (4)
BTMM State Engine Pro by G-Labs — Beat The Market Maker indicator for MetaTrader 5. Asian session range, London and New York kill zones, level progression (L1/L2/L3), peak formation detection (PFH/PFL), entry signals, and a multi-pair scanner from one chart for BTMM and Trend Trading traders Stop scanning charts one pair at a time. The State Engine tracks the BTMM daily cycle automatically — Asian box, room boundaries, level blocks, peak formations, and filtered entries — while the scanner das
Meridian Pro
Ottaviano De Cicco
4 (3)
Meridian Pro 2.00: Professional Multi-Timeframe Trend Matrix for MT5 Meridian Pro 2.00 is a professional adaptive trend matrix for MetaTrader 5. It combines the original Meridian trend engine, a clean chart ribbon, closed-bar signal arrows, an 8-timeframe dashboard, Fuel momentum, weighted consensus, synthetic HTF processing and chart-native higher-timeframe context lines. The goal is simple: read current trend, multi-timeframe structure, strength, momentum and EA-ready state from one discipline
The Oracle Pro
Ottaviano De Cicco
5 (1)
The Oracle Pro: Synthetic Multi-Timeframe Bias Engine for MT5 The Oracle Pro is a premium multi-timeframe bias engine for MetaTrader 5, built for demanding and professional traders. It answers one question with discipline: what is the directional bias on each timeframe right now, how strong is it, and how much do the timeframes agree? Everything is computed on closed bars only - no repainting. The Oracle Pro is a multi-factor consensus system. It combines proprietary indicators and optimized alg
More from author
Trend Radar — Expert Advisor for MetaTrader 4 Overview Trend Radar is an Expert Advisor (EA) for MetaTrader 4 that opens trades based on a proprietary price-channel analysis model, filtered by slope angle and corridor width. The EA combines clear signal logic with flexible risk management and full control over every stage of trade management — from entry to trailing stop. How It Works Channel analysis. The EA builds a price channel from the last SignalBarCount bars and determines its overall dir
The Compare Graphs indicator is an analysis tool that allows traders to compare two or more graphs on the same chart window. This indicator is commonly used in trading platforms such as MetaTrader and provides a clearer comparison of different financial instruments or time frames. Functions of the Compare Graphs indicator may include: Selecting Charts: The trader can select the charts he wants to compare, such as price charts of different currency pairs or indicators on the same chart. Setting
The   Angle Prices   indicator is a tool that calculates the price angle based on price analysis, interpreting the time vector in the form of price points on the price chart. In other words, the X axis and Y axis are represented as price points, so you can actually calculate the angle with two axes of the same dimension. This allows traders to obtain information about the direction of price movement and possible entry or exit points for trades. Let's look at the main characteristics and interpr
The " Fortune Long " bot works using pending orders and reacts to a channel breakdown with the direction of work in the channel; it is necessary to correctly calculate the levels of entry, stop loss, take profit, and the level of deviation of the pending order from the price. The bot needs to be optimized for 2 years with a forward period of 1/2. Once optimization is complete, select the best settings and save them. Work for 6 months. The bot automatically calculates all levels and the entry le
In the world of trading, one of the main concerns is finding a reliable trading system. Meet the TrendEdge Channel indicator - your reliable companion in this search. Developed based on complex mathematical calculations, this indicator predicts the most likely short-term price movements. TrendEdge Channel is designed specifically to identify trends in price movements. Thanks to it, you can quickly determine not only the direction of the trend, but also the levels of interaction between buyers
With the growth of information technology and the increasing number of participants in financial markets, traditional analysis tools are becoming less effective. Conventional technical indicators, such as the moving average or stochastic, in their pure form are unable to accurately determine the direction of the trend or its reversal. Is it possible to find an indicator that remains effective for 14 years without changing its parameters, and at the same time adapts to market changes? Yes, such
Misio
Sabina Fik
Misio - can be used as an independent trading system. The indicator determines the market trend, ignoring sharp fluctuations and noise around the average price. It displays the trending movement with potential stop points. Simple, clear and effective use. The indicator does not redraw and does not lag. Suitable for all currency pairs and all timeframes. Interpretation: The location of the rate above or below the shadows indicates the presence of a trend. A move into the shadows signals a pos
Trend Divergence Indicator: Your Essential Tool for Market Analysis The Trend Divergence Indicator is a powerful tool designed to assist traders in identifying market trends and pinpointing entry points with precision. By leveraging price divergence, this indicator enhances your trading strategy, offering reliable insights and filtering unnecessary signals. Key Features and Benefits of the Trend Divergence Indicator Accurate Trend Analysis: The Trend Divergence Indicator uses price divergence t
The "BioStar" indicator is an innovative tool for trend analysis on the Forex market. It has unique capabilities and a wide range of settings that will help traders make informed decisions when trading. This indicator is based on the analysis of the market trend and helps to identify the direction of price movement. It uses various mathematical algorithms and statistical methods to determine the strength and stability of the trend in the market. One of the key features of the "BioStar" indica
Core Drift Index: Your Reliable Guide in the World of Trading Core Drift Index is an innovative trend indicator designed for precise detection of market directions and reversal points . This powerful tool enables traders to optimize their investments , minimize risk, and maximize profit. Key Features and Benefits Intuitive Trend Detection Core Drift Index clearly shows trend direction, helping traders make timely entry and exit decisions. High Probability of Success With its high accuracy
Warp Range Sensor: The Color of Your Trend Warp Range Sensor is a trend direction indicator that visually displays the current market condition by coloring bars red and blue based on trend direction. What Does Warp Range Sensor Do? Identifies the Current Trend Direction Blue bars indicate an uptrend Red bars signal a downtrend Universal Application Compatible with all currency pairs and timeframes , from short-term scalping to long-term trading. Powered by Market Context & Historical Data W
Pointer Trend Switch — precision trend reversal indicator Pointer Trend Switch is a high-precision arrow indicator designed to detect key moments of trend reversal based on asymmetric price behavior within a selected range of bars. It identifies localized price impulses by analyzing how far price deviates from the opening level, helping traders find accurate entry points before a trend visibly shifts. This indicator is ideal for scalping, intraday strategies, and swing trading, and performs equa
TrendCore Adaptive FX — Smart Expert Advisor for Confident and Adaptive Forex Trading TrendCore Adaptive FX   is a powerful, fully automated trading robot designed for consistent performance in the Forex market. It combines trend-based technical analysis, adaptive lot management, and solid capital protection strategies to ensure robust and efficient trading under real market conditions. Whether you're a professional trader or a long-term investor, this EA offers an intelligent solution to a
FlexiTrade Bot: Trade Smart, Not Blind Ditch the guesswork.   FlexiTrade Bot   is more than just a trading tool — it’s an intelligent trading engine built for traders who value   speed, precision, and adaptability . With real-time market analysis and pattern recognition, FlexiTrade delivers actionable signals with razor-sharp accuracy so you can focus on results, not reaction.   What Sets FlexiTrade Apart? Market Structure Awareness Unlike bots that rely on rigid indicator rules,   FlexiTr
AlphaTrader: Your Intelligent Partner in Forex Trading AlphaTrader   is an advanced trading system that utilizes automated analysis and trading strategies to optimize decision-making in the Forex market. Built using geometric patterns and cutting-edge algorithms, this bot detects pricing patterns, providing precise signals for successful trades.   Why Choose AlphaTrader? AlphaTrader is not just a trading bot; it’s a   full-fledged partner   designed to help you manage your capital as efficien
Acceleration Bias — Price Acceleration Impulse Indicator Acceleration Bias   is a modern analytical tool designed to measure changes in price acceleration and visualize impulse asymmetry using a robust mathematical model. This indicator is intended for traders working with market volatility, impulse phases, and price-movement structure, as well as those who need algorithmic, rule-based analytical support. Purpose and Core Concept Unlike traditional oscillators that analyze only velocity changes
Structural Equilibrium: A New Era of Adaptive Market Analysis As information technology advances and market participation grows, traditional analytical tools often face declining efficiency. Standard technical indicators frequently struggle to interpret the complexities of modern, algorithm-driven market structures. Structural Equilibrium was developed as a high-performance solution featuring a multi-level adaptive smoothing mechanism. This core logic allows the tool to maintain its analytical r
Phase Analytics Pro: Advanced Cyclic Market Analyzer Phase Analytics Pro is a sophisticated technical tool designed for traders who prioritize mathematical precision over lag-heavy traditional indicators. Based on the principles of digital signal processing, this indicator decomposes price action into phase and quadrature components to identify the dominant market cycle. How it works: The algorithm calculates the instantaneous phase of the market, allowing it to distinguish between trending and
Ось відформатований текст без альтернативних назв у дужках: Latency Edge Scalpel Latency Edge Scalpel is a high-frequency, institutional-grade trading solution engineered for high-precision scalping in the decentralized Forex market. This is not a simple grid or martingale bot; it is a sophisticated mathematical tool designed to exploit micro-structural price gaps and momentary volatility imbalances. The Algorithmic Core At its heart, Latency Edge Scalpel operates on a hybrid volatility-filterin
Sub Algo is a revolutionary indicator for MQL4/MQL5 that transforms how algorithmic strategies are built and executed. Instead of writing endless if–else conditions, Sub Algo provides a complete visual configuration system with: 6 independent logical operations Adaptive thresholding Automatic Buy/Sell symmetry Simple dropdown menus and input parameters This is not a library . This is a ready-to-use professional indicator that converts any combination of technical indicators into precise logical
Orynth P&F Chart Overlay – Clean Trend Visualizer Orynth is a professional technical analysis tool that brings the power of Point and Figure (P&F) charting directly onto your standard candlestick chart. It filters out market noise by focusing solely on meaningful price movement, allowing traders to identify clear trends and reversals without the distraction of minor fluctuations. Unlike traditional P&F charts that open in a separate window, Orynth overlays price "boxes" directly on your main cha
Trend Sonar — Adaptive Trend Indicator with Multi-Timeframe Confirmation for MetaTrader 4 Overview Trend Sonar is a MetaTrader 4 indicator that combines an adaptive trend line, an ATR-based volatility channel, and a multi-timeframe confirmation panel in a single tool. The line speeds up or slows down on its own depending on how efficiently price is actually moving — so it lags less in trends and stays quieter in ranging markets. The indicator is non-repainting: values on closed bars are final an
Piticular
Sabina Fik
Piticular — Professional Trading Expert Advisor Piticular   is a professional Expert Advisor built for precise, disciplined, and consistent trading. It blends smart market structure analysis with flexible money management and strict risk control across every trade series. Designed for traders who value predictability, transparent logic, and full control over fine-tuning the strategy to their own style. Key Features Flexible Lot Management Fixed lot size (ManualLotSize) Automatic risk calculation
EN — Description Meridian Pulse   is a trend-following indicator for MetaTrader 4 that plots a smooth, color-coded line directly on the chart to reveal the current market direction at a glance. It combines adaptive volatility measurement (ATR-based step sizing) with a step-MA trend engine, automatically switching color — gray for neutral, blue for an emerging bullish phase, and green for a confirmed uptrend — as market conditions shift. Key Features Adaptive step size calculated from average vol
Vertex Rebound — Micro-Range Reversion & Volatility-Surge Breakout EA (Spread-Sensitive, Short-Holding-Period System) Vertex Rebound is a dual-logic automated system operating on a very short statistical lookback: a compatible price channel is rebuilt on every tick from an M1 moving average and a bands indicator over a 3-bar window, giving the EA a live estimate of the instrument's short-term equilibrium range. Two complementary signal families are derived from this channel: a   mean-reversion  
Aurum Cascade — Adaptive Chain-Entry Expert Advisor for MetaTrader 4 Overview Aurum Cascade combines a momentum-and-volatility confirmation stack with a chain-order (cascading) execution model. Rather than acting on a single indicator signal, it waits for agreement across trend direction, momentum, volatility expansion, and price inclination before committing to a trade — then manages exposure through a controlled, capped chain of orders instead of a single fixed position. It is built for trader
Momentum Snap Markers — Instant Visual Reversal Alerts for MetaTrader 4 Overview Stop staring at raw oscillator lines trying to guess where momentum actually turns. Momentum Snap Markers does the reading for you — it watches momentum shift out of extreme territory and drops a clean, unmistakable arrow directly on your chart the moment it happens, paired with an optional sound alert so you never miss the move while you're away from the screen. Built for traders who want a fast, at-a-glance read o
The Plasma Trend indicator is a simple technical indication that is used to determine the current trend direction in the market. The Plasma Trend indicator is a powerful tool for determining the direction of the trend in the Forex market. It is based on both standard technical indicators and proprietary mathematical calculations, which provides a more accurate and reliable trend determination. Its implementation in the form of lines of two colors simplifies the visual determination of a change
Cryo
Sabina Fik
5 (1)
Cryo is based on the process of identifying the rate of change in price growth and allows you to find entry and exit points from the market. A fundamental technical indicator that allows you to assess the current market situation in order to enter the market of the selected currency pair in a trend and with minimal risk. The Cryo indicator was created on the basis of the original indicators for searching for extremes, the indicator is well suited for determining a reversal or a large sharp jer
The Angle Prices indicator is a tool that calculates the price angle based on price analysis, interpreting the time vector in the form of price points on the price chart. In other words, the X axis and Y axis are represented as price points, so you can actually calculate the angle with two axes of the same dimension. This allows traders to obtain information about the direction of price movement and possible entry or exit points for trades. Let's look at the main characteristics and interpretat
Filter:
No reviews
Reply to review