WaveMarkers

Wave Markers: mappa delle onde adattiva con dashboard multi-timeframe

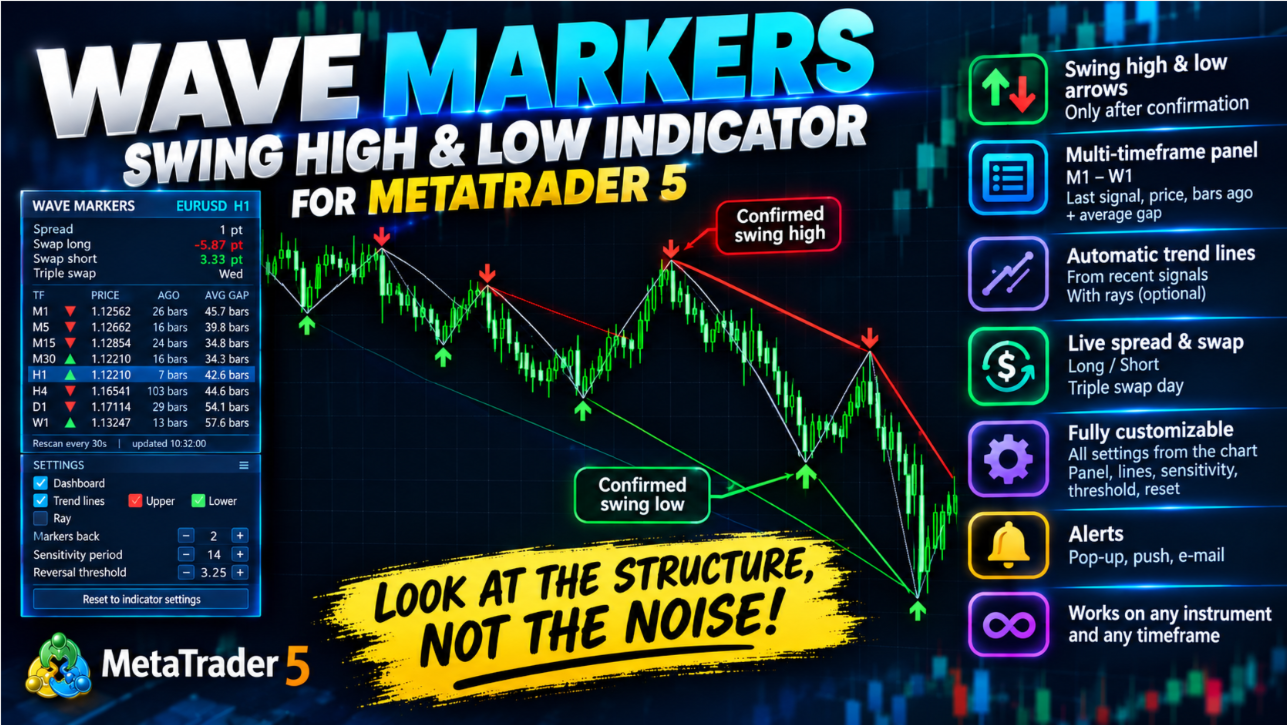
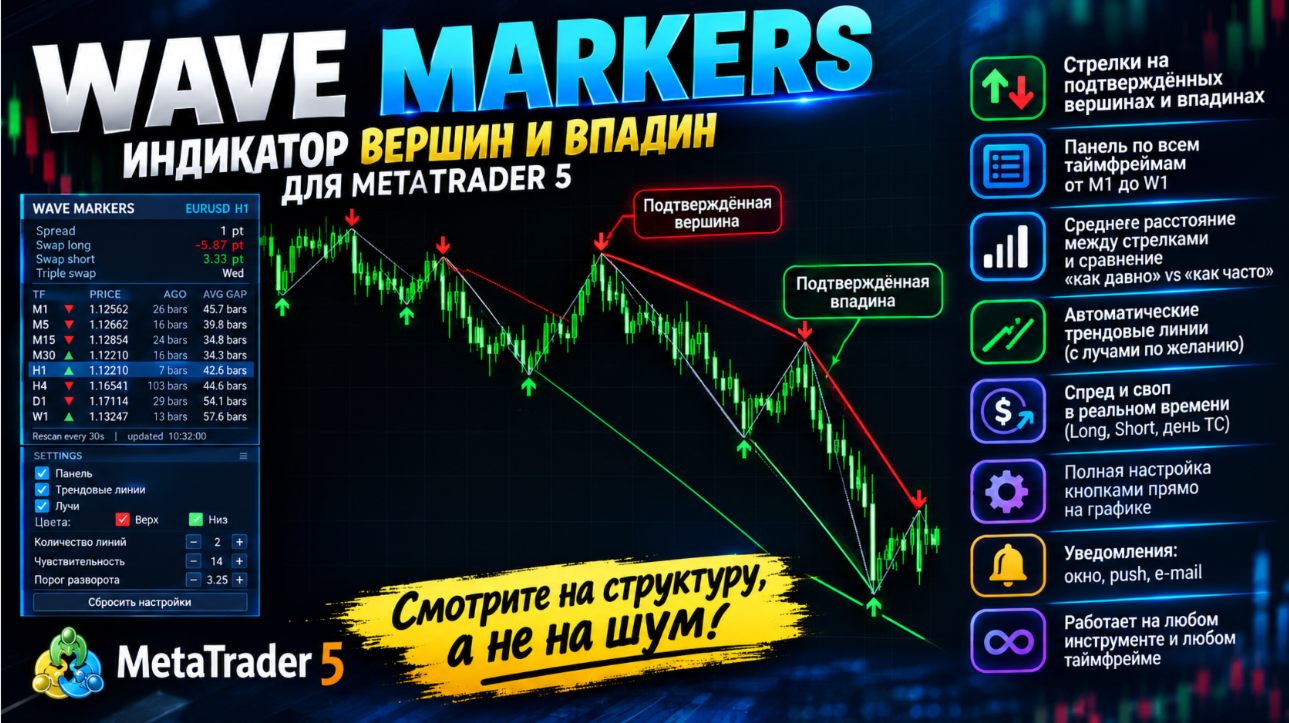
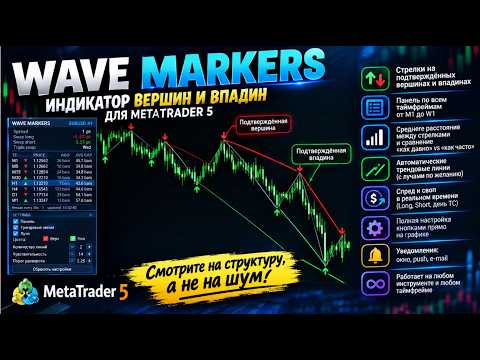
Vedi la vera struttura del mercato, non il rumore: massimi e minimi di swing confermati, linee di tendenza che li attraversano e la situazione di tutti i timeframe, da M1 a W1, in un unico pannello.

Che cos'è

Wave Markers è un indicatore di struttura grafica per MetaTrader 5. Individua i punti di svolta del prezzo (massimi e minimi di swing), li segnala con frecce pulite e costruisce intorno a essi strumenti di lavoro: linee di tendenza, una tabella di tutti i timeframe, oltre a spread e swap in tempo reale.

Non dà ordini di «compra» o «vendi» e non promette risultati. Fa una cosa sola e la fa con cura: mostrarti dove il mercato ha davvero girato, così puoi leggere la struttura in modo più rapido e coerente.

Perché non è un altro ZigZag

Uno ZigZag classico usa una distanza fissa (punti o percentuale) per decidere che cosa conta come inversione. Quel numero unico è quasi sempre sbagliato: troppo grande in un mercato tranquillo (si perdono onde reali), troppo piccolo in uno veloce (si raccoglie rumore).

Wave Markers funziona in modo diverso:

  • La soglia di inversione si adatta alla volatilità corrente. Si misura in multipli del movimento tipico del mercato stesso: si allarga quando il mercato accelera e si restringe quando si calma. Una stessa impostazione si comporta in modo sensato su major, oro, indici e criptovalute, e su timeframe diversi.
  • Un marcatore compare solo dopo che l'inversione è confermata. Il prezzo deve allontanarsi davvero dall'estremo della misura della soglia. Nessuno sguardo al futuro e nessun tentativo di indovinare un massimo mentre la candela è ancora in corso.
  • Il ritardo di conferma è onesto e prevedibile. Lo determina la soglia che scegli: una soglia più alta significa meno onde, più importanti e confermate più tardi; una soglia più bassa significa marcatori più frequenti e più rapidi.
  • La logica è identica su ogni timeframe, così la dashboard confronta cose confrontabili.

Vantaggi principali

  • Marcatori puliti e leggibili: una freccia verso il basso su ogni massimo di swing confermato, una freccia verso l'alto su ogni minimo
  • Soglia adattiva alla volatilità invece di un numero fisso
  • Linee di tendenza automatiche attraverso gli ultimi marcatori, con semirette opzionali
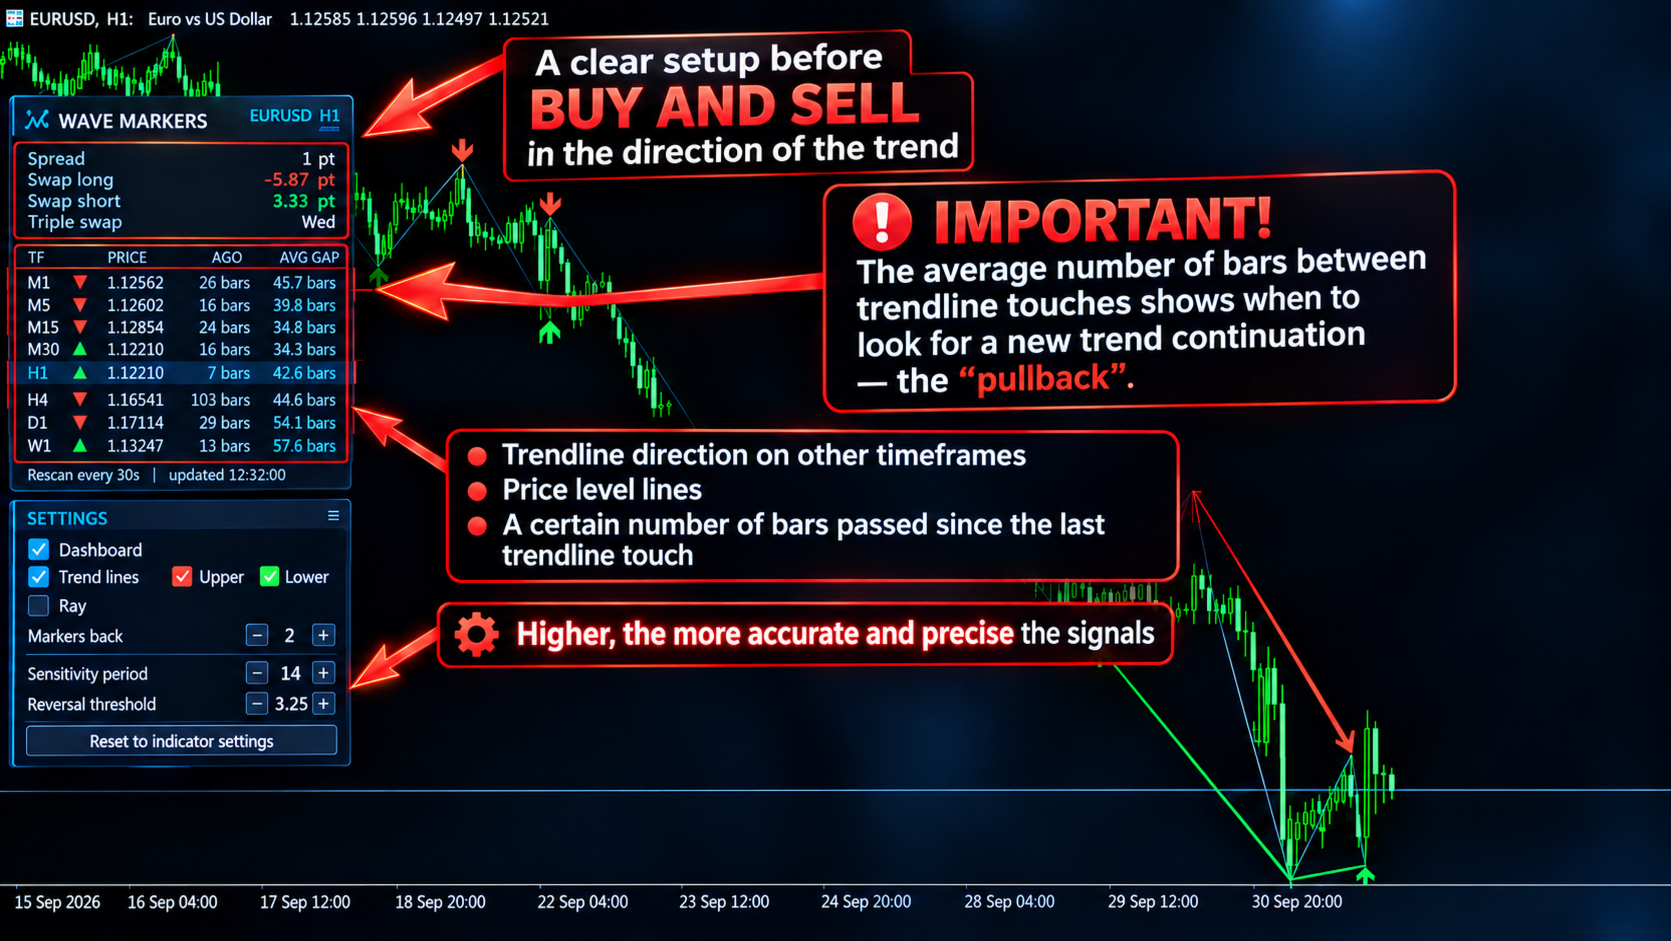
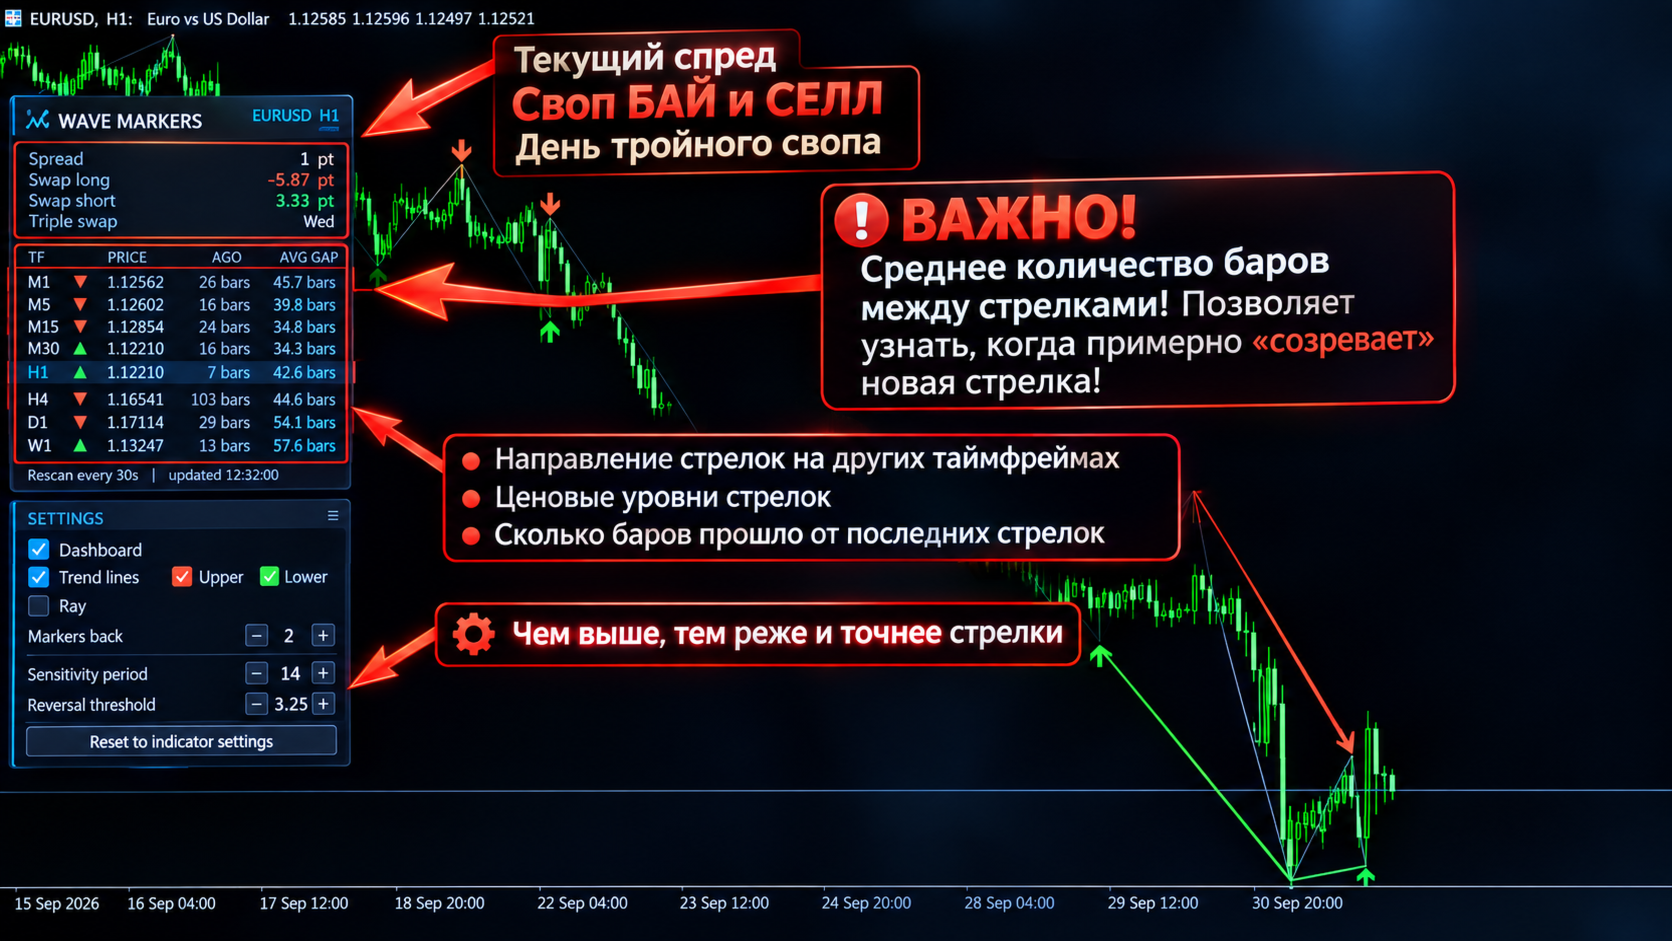
  • Dashboard per tutti i timeframe da M1 a W1: direzione dell'ultimo marcatore, suo prezzo, quante candele fa è comparso e distanza media tra marcatori della stessa direzione
  • Spread e swap (long, short e giorno del triplo swap) in tempo reale nello stesso pannello
  • Lo storico mancante sugli altri timeframe viene richiesto e caricato automaticamente
  • Leggero per il terminale: i marcatori sul grafico vengono ricalcolati una volta per ogni nuova candela e gli altri timeframe tramite timer, non a ogni tick
  • Tutto si controlla direttamente sul grafico, senza aprire la finestra delle impostazioni
  • Avvisi popup, notifiche push ed e-mail a ogni nuovo marcatore
  • Funziona su qualsiasi strumento e su qualsiasi timeframe

Che cosa vedi sul grafico

Marcatori e linea delle onde. Frecce sui massimi e minimi di swing confermati, a scelta unite da una linea sottile, così le onde si leggono a colpo d'occhio.

Linee di tendenza. L'indicatore traccia linee attraverso gli ultimi massimi di swing e, separatamente, attraverso gli ultimi minimi. Scegli tu quanti segmenti disegnare: con 1, una linea attraverso gli ultimi due marcatori di quel tipo; con 2, gli ultimi tre marcatori uniti da due linee, e così via. Le linee possono essere prolungate verso destra come semirette oppure restare segmenti che iniziano e finiscono esattamente sul massimo o sul minimo della candela.

Dashboard multi-timeframe. Una riga per ogni timeframe, da M1 a W1:

  • la direzione dell'ultimo marcatore (▼ massimo, ▲ minimo)
  • il suo prezzo
  • quante candele fa è comparso
  • il numero medio di candele tra marcatori di quella direzione su tutto lo storico analizzato

Confrontare «quanto tempo fa» con «ogni quanto succede di solito» aiuta a capire in fretta in che fase del proprio ritmo si trova un timeframe.

Spread e swap. Lo spread corrente si aggiorna a ogni tick e può essere evidenziato quando supera il livello che imposti. Swap long, swap short e giorno del triplo swap sono mostrati con le unità corrette per lo strumento.

Pannello di controllo sul grafico

Sotto il pannello principale c'è una scheda compatta di impostazioni. Con essa puoi:

  • nascondere o mostrare il pannello principale per vedere la parte di grafico che copre
  • attivare o disattivare le linee di tendenza, separatamente quelle superiori e quelle inferiori
  • attivare o disattivare le semirette
  • cambiare il numero di linee con i pulsanti «−» e «+»
  • cambiare il periodo di sensibilità e la soglia di inversione con «−» e «+» e vedere subito il risultato
  • ripristinare tutto ai valori dell'indicatore con un clic
  • trascinare l'intero pannello in qualsiasi punto del grafico dalla barra del titolo

I valori della finestra delle impostazioni sono il punto di partenza. Da lì in poi prevale ciò che scegli sul grafico. Il cambio di timeframe mantiene le tue scelte e il pulsante di ripristino riporta i valori originali.

Come possono usarlo i trader

  • Leggere la struttura del mercato: massimi e minimi crescenti e decrescenti, e i punti in cui la struttura si rompe
  • Ottenere automaticamente livelli di swing e linee di tendenza rilevanti invece di tracciarli a mano
  • Valutare più timeframe a colpo d'occhio prima di prendere una decisione
  • Confrontare il ritmo dei marcatori tra i timeframe
  • Tenere sotto controllo il costo di spread e swap senza lasciare il grafico

Wave Markers è uno strumento di analisi. Non garantisce alcun risultato di trading e ogni decisione resta tua. Prova sempre ogni impostazione prima su un conto demo.

Da sapere

  • Poiché un marcatore viene confermato solo dopo che il prezzo ha invertito, compare sempre con un ritardo. È una scelta di progetto e l'entità del ritardo si regola con la soglia di inversione.
  • Gli altri timeframe vengono caricati dallo storico del tuo broker. Se un timeframe mostra «loading...», il terminale sta ancora costruendo le sue candele.
  • Per gli avvisi via e-mail, nel terminale deve essere configurata la posta (Strumenti → Opzioni → E-mail).

Impostazioni

Wave Markers

  • Wave markers: sensitivity period: su quante candele si misura il movimento tipico del mercato. Valori brevi reagiscono più in fretta ai cambi di volatilità, valori lunghi sono più stabili. 14 è un buon punto di partenza.
  • Wave markers: reversal threshold, x sensitivity: quanto il prezzo deve allontanarsi da un estremo, in multipli del movimento tipico, perché un marcatore venga confermato. Più alto significa meno onde, più importanti e confermate più tardi; più basso significa più marcatori, prima, ma con più rumore.
  • Analysis depth, bars (per timeframe): quante candele indietro analizza l'indicatore su ogni timeframe. Più profondità significa più storico sul grafico e nelle statistiche del pannello.

Chart Display

  • Show wave markers on chart: attiva o disattiva le frecce.
  • Connect wave markers with a line: unisce i marcatori consecutivi con una linea sottile, così le onde sono facili da seguire.
  • Swing high marker color: colore delle frecce sui massimi di swing.
  • Swing low marker color: colore delle frecce sui minimi di swing.
  • Connecting line color: colore della linea che unisce i marcatori.
  • Marker size (1-5): dimensione delle frecce.
  • Connecting line width (1-5): spessore della linea che unisce i marcatori.

Dashboard

  • Show info panel on chart: mostra la dashboard e la scheda di controllo sul grafico. Se disattivata, l'indicatore lavora solo con i valori di questa finestra di impostazioni.
  • Panel offset X, px: posizione orizzontale iniziale del pannello. In seguito puoi trascinarlo con il mouse.
  • Panel offset Y, px: posizione verticale iniziale del pannello.
  • Other timeframes re-check interval, sec: ogni quanto vengono ricontrollati gli altri timeframe. Il grafico corrente si aggiorna a ogni nuova candela; questo parametro riguarda solo la tabella (minimo 5 secondi).
  • Spread highlight level, points (0 = off): il valore dello spread diventa arancione quando supera questo livello. Zero disattiva l'evidenziazione.

Alerts (current timeframe)

  • Popup alert on new wave marker: mostra una finestra di avviso del terminale quando viene confermato un nuovo marcatore.
  • Push notification on new wave marker: invia una notifica al telefono (richiede il MetaQuotes ID nelle impostazioni del terminale).
  • E-mail notification on new wave marker: invia un'e-mail (richiede la configurazione della posta nel terminale).

Trend Lines (through wave markers)

  • Draw trend lines through wave markers: interruttore generale di tutte le linee di tendenza.
  • Lines through upper markers (highs): disegna linee attraverso i massimi di swing.
  • Lines through lower markers (lows): disegna linee attraverso i minimi di swing.
  • Number of lines per side (markers back, 1-50): quanti segmenti disegnare per ciascun lato. Con 1, una linea attraverso gli ultimi due marcatori; con 2, gli ultimi tre marcatori uniti da due linee, e così via.
  • Extend all lines to the right (ray): prolunga ogni linea verso destra fino al bordo del grafico. Se disattivato, ogni linea inizia e finisce sui suoi marcatori.
  • Upper line color: colore delle linee attraverso i massimi di swing.
  • Lower line color: colore delle linee attraverso i minimi di swing.
  • Line style: continua, tratteggiata, punteggiata e così via.
  • Line width (1-5, solid style only): spessore delle linee. MetaTrader applica spessori superiori a 1 solo alle linee continue.
  • Draw lines behind the chart: disegna le linee sotto le candele invece che sopra.
Prodotti consigliati
The indicator plots flexible support and resistance levels (dots). A special phase of movement is used for construction. Levels are formed dynamically, that is, each new candle can continue the level or complete it. The level can provide resistance or support to the price even where it is no longer there. Also, support and resistance levels can change roles. The importance of levels is affected by: the amount of time the level is formed and the number of touches. The significance of these lev
In the context of trading, Malaysia SNR (Support and Resistance) refers to the technical analysis of support and resistance levels in financial markets, particularly for stocks, indices, or other assets traded. This is single timeframe version. Multiple timeframe version is avaiable here . There are three type of Malaysia SNR level Classic , GAP and Flipped 1. Classic Support is the price level at which an asset tends to stop falling and may start to rebound. It acts as a "floor" where demand is
MetaHelper
Volodymyr Tseibei
This indicator automatically calculates and displays classic pivot points on your chart, helping identify key support and resistance levels for the current trading session. Features: · Plots Pivot (PP), Resistance 1-2 (R1, R2), and Support 1-2 (S1, S2) levels · Includes current close price line for reference · Color-coded lines: Blue for pivot, Red for resistances, Green for supports · Automatic calculation based on previous day's high, low, and close · Continuous lines across the chart for e
BTFX Pivot Points
Bradley Thomas Farrington
The BTFX Pivot Points is an indicator which calculates the Support and Resistance levels for each day. By using this indicator the pivot levels point out clear targets to aim for. The resistance levels are shown in purple above the silver pivot line. The support levels are shown in Orange and can be found below the silver pivot line. This indicators works very well when used with The BTFX Daybreak Indicator. For a more in depth explanation of these indicators please watch the Youtube video attac
Veltrion Smart Fibonacci   is a clean automatic Fibonacci structure overlay for MetaTrader 5. It automatically detects recent swing highs and swing lows, then draws key Fibonacci retracement levels directly on the chart. The indicator is designed to help traders visualize market structure, retracement zones, and the golden zone without manually drawing Fibonacci tools. Key Features Automatic swing high and swing low detection Clean Fibonacci retracement overlay Horizontal Fibonacci levels for a
Structure Levels (Highs & Lows) Indicator for MetaTrader 5 Decode Market DNA — Trade with Institutional Precision Description: The Structure Levels (Highs & Lows) Indicator is your secret weapon to map the market’s hidden roadmap. Designed for traders who think in terms of price action and market structure, this tool automatically identifies critical swing highs and swing lows, transforming chaotic charts into a clear blueprint of support/resistance zones, breakout opportunities, and trend rev
Fair Value Gap (FVG) & Inversion Fair Value Gap (iFVG) – TradingLabs ID Nelle metodologie ICT (Inner Circle Trader) e Smart Money Concepts (SMC), un Fair Value Gap (FVG)—noto anche come squilibrio (imbalance)—si verifica quando il prezzo si muove con un momento estremo, lasciando dietro di sé un vuoto di liquidità. Questi vuoti non colmati agiscono come magneti per la futura azione dei prezzi, rendendoli le zone di ritracciamento e di ingresso a più alta probabilità per i trader professionisti.
这是一个基于前一个交易日的最高价、最低价和收盘价来计算的枢轴点指标,具体公式如下: 计算前一日的 Pivot Point (枢轴点): Pivot = (High + Low + Close) / 3 计算 Resistance 1 (R1) 、 Support 1 (S1) ​ 等: R1 = (2 * Pivot) - Low S1 = (2 * Pivot) - High R2 = Pivot + (High - Low) S2 = Pivot - (High - Low) 与市面上其他的枢轴点指标相比,该指标主要有以下4个特点: 1、可以修改交易日的开始时间; 2、可以设定支撑压力线的颜色; 3、可以设定是否显示各个支撑压力线对应的价格; 4、可以设定天数用以显示枢轴点的历史记录; 开发这个指标的最初目的是为了解决设定交易日开始时间的问题,接下来会进一步说明。基于计算公式,我们需要获得上一个交易日的最高价、最低价和收盘价,在夏令时,北京时间6点是开市时间,大多数交易平台服务器的0点对应的是北京时间的6点,但是香港的服务器6点才是对应的是北京时间的6点。如果你有多个平台,且存在
Support Resistance Break Zones PRO was built for a common problem I often see when trading XAUUSD and other fast-moving symbols: support and resistance levels are visible, but the chart becomes difficult to read when breakouts, retests and false breaks happen around the same area. Current price: $79 - increases by $10 after every 20 purchases until reaching the final price of $129 . Next price: $89 . Complete Buyer Kit: 42 Professional Resources included at no additional cost. MT5 Presets, PDF

Multichart V and H Line Sync Overview Multichart V and H Line Sync is the essential tool for multi-timeframe traders. It instantly synchronizes your Horizontal Support/Resistance Lines and Vertical Time Lines across all open charts of the same symbol. Stop drawing the same levels on M5, H1, and D1 charts manually. With this tool, draw a line once, and it automatically replicates on every other timeframe. Perfect for keeping your technical analysis consistent and your workspace clean. Key Feature
FREE
ZigZag Market Structure Breakout Pro ZigZag Extras Display BreakOut points is a MetaTrader 5 indicator for traders who use ZigZag, breakout points, market structure, BOS, CHoCH, swing high, swing low, support and resistance, and higher timeframe bias in their trading analysis. Main Benefits Displays confirmed ZigZag swing highs and swing lows Marks BOS Up, BOS Down, CHoCH Up and CHoCH Down Shows Depth Highest High and Depth Lowest Low lines Adds HH, HL, LH and LL structure labels Includes HTF bi
The indicator to trade price consolidation is designed to identify price contraction and alerts us on formation. It does this by analyzing historical price data and identifying price action patterns. The algorithm then uses this information to mark the zone , potential targets and liquidity lines, giving us valuable insights into market behavior.  Traders can adjust parameters such as colors ,alerts types and how many  previously formed zones to display on chart . Furthermore, the indicator can
Ric
Sabina Fik
With this indicator, you can   predict future price behavior   for a certain number of bars ahead, giving you the ability to anticipate market dynamics. The indicator draws a   forecast line , which models potential future price values based on sophisticated algorithms analyzing past data. This information can be leveraged not only for market entry and exit decisions but also for setting or adjusting stop-loss levels to better manage your positions. Application of the Forecast The data provided
SR Zones & Pivot Panel EA - All-in-One Trading Tool SR Zones & Pivot Panel EA   is a powerful hybrid tool that combines automatic   Support/Resistance Zones ,   Daily Pivot Points , and a   Compact Trading Panel   into one interface. It helps traders visualize key price levels on any timeframe while executing trades quickly and efficiently. Designed for precision and speed, this tool keeps your chart clean while providing all the data you need for intraday trading. Key Features 1. Automati
ShooterSignal ShooterSignal is a multi-timeframe market structure indicator for MetaTrader 5. The indicator analyzes price data and identifies swing points used to display market structure on the chart. Market Structure The indicator identifies: Higher High (HH) Higher Low (HL) Lower High (LH) Lower Low (LL) These structural points are displayed on the chart according to the selected timeframe. Structure Events ShooterSignal can display structural events based on detected price movement, includ
RelicusRoad Daily Pivots è un indicatore di punti pivot giornalieri per MetaTrader 4 e MetaTrader 5 che divide il range del giorno precedente in livelli Fibonacci e li estende sopra e sotto di esso, da meno 100 a più 200 per cento. Invece dei classici floor pivot, il range completato precedente viene trattato come una scala in cui il minimo è 0% e il massimo è 100%. Diciannove livelli vengono stampati come brevi marcatori colorati al bordo destro del grafico, così l'ampiezza del movimento di ogg
FREE
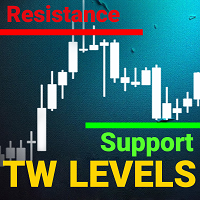
support resistance levels indicator mt5: Questo strumento è un indicatore multi-timeframe che identifica e traccia le linee di supporto e resistenza, così come i livelli di Fibonacci, su un grafico con la stessa precisione dell'occhio umano. I livelli di supporto e resistenza TW per il forex hanno un algoritmo complesso che scansiona il grafico per identificare i precedenti livelli di stabilizzazione dei prezzi e rimbalzi, registrando il numero di tocchi. Sei stanco di disegnare manualmente i
Murphy Order Block is a highly optimized and visually clean indicator for identifying key institutional zones based on pure market structure logic. It is designed for traders who follow Smart Money Concepts (SMC), ICT-style OB trading, and structure-based break & retest strategies. This indicator dynamically detects and draws: - **1 valid Bullish Order Block (Buy Zone)** - **1 valid Bearish Order Block (Sell Zone)** ### Key Features: **Market Structure-Based Logic**   - Uses swing high
Mechanical SR mt5
Part-time Day Trader
Mechanical Support Resistance Automatically calculates support and resistance levels using vertical price-profile analysis with pivot-style updates. Mechanical Support Resistance sits between a traditional support/resistance indicator , a pivot indicator , and a vertical profile indicator . Like an S/R indicator, it identifies important price levels. Like a pivot indicator, those levels remain fixed for a defined period and refresh on a scheduled daily, weekly, or monthly basis. And like a verti
Projection of Phi
Nestor Jose Mendez Boza
Projection of Phi   Is a technical indicator that calculates dynamic support and resistance levels. It uses angular geometric projections and mathematical ratios to identify market expansion ranges. Features: Dynamic Fibonacci Expansion: Extension level projection Geometric Calculation: Angular analysis and mathematical ratios Visualization: Graphical objects with informative labels Compatibility: M1 to H4 timeframes Applications: Identification of zones for trade management Analysis of volatil
FREE
Point and Fignure (P&F) chart plots price against changes in direction by plotting a column of Xs as the price rises and a column of Os as the price falls. Features Support for several kinds of price types - High/Low and Close. Clean and easy-to-read chart. Displays column high and low prices as indicator values. Support for both 4 and 5-digit brokers. Customizeable colors. Advantages Filter insignificant price movements and noise. Less noise and more stable work. Focus on important price move
KT Asian Breakout Indicator MT5
KEENBASE SOFTWARE SOLUTIONS
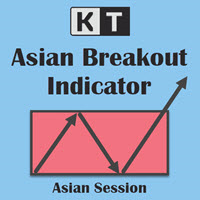
Traccia l'intervallo della sessione asiatica KT Asian Breakout Indicator segna il massimo e il minimo di una finestra di quattro ore della sessione asiatica e controlla il prezzo dopo il completamento dell'intervallo. Il parametro GMT Offset allinea la sessione all'ora del server del broker, mentre Draw Session Box controlla la visualizzazione dell'intervallo. Osserva insieme il breakout e i livelli operativi Una freccia rialzista appare quando il prezzo chiude sopra il massimo della sessione. U
Traditional Pivot Points Pro is a professional MQL5 indicator designed to display accurate pivot levels with an automatic session-based calculation logic. It plots the main pivot point (P) together with resistance and support levels R1, R2, S1, and S2 in a clean and readable format. The indicator is built for traders who want a simple and efficient way to identify key market levels, potential reversals, intraday support and resistance zones, and price reaction areas. It is especially useful for
Detailed Description: The   Pivot Point Pro Indicator   is a powerful all-in-one fully customizable indicator that takes care of five pivot point methods (Classic, Fibonacci, Woodie, Camarilla, DeMark). It automatically plots pivot levels and midpoints, highlights key reversal zones and sends alerts when price approaches these levels.  Unlike the free Pivot Point Classic version, this Pro indicator allows users to customize more settings,   analyze current and historical pivot points and  use al
The Angle Prices indicator is a tool that calculates the price angle based on price analysis, interpreting the time vector in the form of price points on the price chart. In other words, the X axis and Y axis are represented as price points, so you can actually calculate the angle with two axes of the same dimension. This allows traders to obtain information about the direction of price movement and possible entry or exit points for trades. Let's look at the main characteristics and interpretat
AxisGuard Pro
Muhammad Andiya Nafhan
AxisGuard Pro Professional Pivot, Support & Resistance Indicator for MetaTrader 5 AxisGuard Pro is a professional analytical indicator designed to help traders identify important market levels without overcrowding the chart. It provides a clean view of Pivot Points, Support and Resistance levels with powerful multi-timeframe control. Suitable for: Forex Gold Indices Crypto Other MetaTrader 5 supported symbols Main Features Multi-Timeframe P
Versione MT4: https://www.mql5.com/en/market/product/157679 Versione MT5: https://www.mql5.com/en/market/product/157680 Supporto e Resistenza — Livelli di Struttura di Mercato Intelligenti Un indicatore di Supporto e Resistenza pulito, intelligente e altamente affidabile, pensato per trader professionisti e sistemi automatizzati. Supporto e Resistenza è progettato per rilevare i veri livelli di mercato utilizzando un algoritmo di clustering avanzato che combina frattali, segmentazione dei pr
Divergence Sync MT5
Pavel Verveyko
5 (1)
Divergence and Convergence are important harbingers of reversals in stock markets. The Divergence Sync indicator is designed to automatically search for divergences on a large number of indicators with different parameters. The search for divergences is carried out on these indicators: (CCI, CHO, DeMarker, MACD, MFI, Momentum, OBV, OsMA, RSI, Stochastic, WPR,   Awesome Oscillator ). To search for divergences, you can use one technical indicator or search simultaneously on any number of indicat
UFO Market Structure & Fibo Pro UFO (Unfilled Order Institutional) zone + Non-Repaint Market Structure + Golden Fibonacci Entry Stop trading like retail. Start tracking institutions. UFO Market Structure & Fibo Pro is an all-in-one visual assistant designed to automatically map Institutional Supply & Demand, Market Structure, and Golden Fibonacci entries. No more subjective drawing, no more lagging indicators. Just pure, objective institutional footprints. UNIVERSAL MARKET COMPATIBILITY Work
Owl Smart Levels MT5
Sergey Ermolov
4.03 (32)
Quando si opera seguendo il trend, la difficoltà principale non è trovare un livello, ma capire dove un ingresso è realmente valido. Il prezzo spesso reagisce ai livelli, ma non riesce a proseguire il movimento — il che porta a ingressi falsi o opportunità perse. Owl Smart Levels non si limita a mostrare livelli , ma evidenzia zone basate sulla struttura di mercato e sui pullback. Questo consente di valutare i punti di ingresso in modo diverso ed evitare una parte dei segnali falsi. Cosa includ
Gli utenti di questo prodotto hanno anche acquistato
SMART TREND TRADING SYSTEM — OFFERTA SPECIALE Il tuo sistema di trading. Il tuo EA per l’automazione. La tua formazione e il tuo supporto. Acquista Smart Trend Trading System per MT5 a 99 USD e ricevi Smart Universal Expert Advisor GRATIS per automatizzare i segnali del sistema. STTS riunisce la direzione del trend, i segnali di entrata e uscita, le zone di inversione e i livelli di prezzo importanti direttamente sul grafico. Segui il sistema manualmente oppure collega l’EA incluso per eseguire
Trend Sniper X
Sarvarbek Abduvoxobov
4.9 (39)
Trend Sniper X è un indicatore trend-following multi-timeframe per MetaTrader 5 che aiuta i trader a identificare la direzione del trend e i potenziali punti di inversione con chiarezza e precisione. per MT4: https://www.mql5.com/en/market/product/193245 Informazioni sul prezzo: Il prezzo attuale è promozionale ed è soggetto a modifiche con il rilascio di futuri aggiornamenti e nuove funzionalità. Offerta Bonus: Per ricevere GRATIS l'Auto-Trade Assistant EA per questo indicatore, invia un messa
ARIPoint
Temirlan Kdyrkhan
1 (4)
ARIPoint is a powerful trading companion designed to generate high-probability entry signals with dynamic TP/SL/DP levels based on volatility. Built-in performance tracking shows win/loss stats, PP1/PP2 hits, and success rates all updated live. Key Features: Buy/Sell signals with adaptive volatility bands Real-time TP/SL/DP levels based on ATR Built-in MA Filter with optional ATR/StdDev volatility Performance stats panel (Success, Profit/Loss, PP1/PP2) Alerts via popup, sound, push, or email Cu
Gann Made Easy è un sistema di trading Forex professionale e facile da usare che si basa sui migliori principi del trading utilizzando la teoria di mr. WD Gann. L'indicatore fornisce segnali ACQUISTA e VENDI accurati, inclusi i livelli di Stop Loss e Take Profit. Puoi fare trading anche in movimento utilizzando le notifiche PUSH. CONTATTAMI DOPO L'ACQUISTO PER RICEVERE GRATUITAMENTE LE ISTRUZIONI DI TRADING E OTTIMI INDICATORI EXTRA! Probabilmente hai già sentito parlare molte volte dei metodi d
Neuro Poseidon MT5
Daria Rezueva
4.75 (52)
Neuro Poseidon is a new indicator by Daria Rezueva. It combines precise trading signals with adaptive TP/SL levels - creating best possible trades as a result! Message me and get  Neuro Poseidon Assistant  as a gift to automize your trading process! What makes it stand out? 1. Proven profitability on all assets and timeframes 2. Only confirmed BUY and SELL signals present on the chart 3. Adaptive TP & SL levels generated by the software for each trade 4. Easy to understand - suitable for al
M1 Sniper MT5
Oleg Rodin
5 (7)
M1 SNIPER   è un sistema di indicatori di trading facile da usare. Si tratta di un indicatore a freccia progettato per l'intervallo temporale M1. L'indicatore può essere utilizzato come sistema autonomo per lo scalping sull'intervallo temporale M1 e come parte del tuo sistema di trading esistente. Sebbene questo sistema di trading sia stato progettato specificamente per il trading sull'intervallo temporale M1, può comunque essere utilizzato anche con altri intervalli temporali. Inizialmente ho p
La leggenda ritorna: Entry Points Pro 10. Il rilancio del leggendario indicatore che per 3 anni è rimasto nella Top-3 del MQL5 Market. Centinaia di recensioni entusiaste (589 su due versioni), migliaia di trader lo usano ogni giorno per operare, 31.000+ download della demo   MT4+MT5 . Ho letto ogni vostra recensione degli ultimi cinque anni — e invece di promesse ho inserito nella versione 10 le risposte. Dall'autore che opera sui mercati dal 1999 e tiene all'onestà, alla propria reputazione e a
Auto Optimized SpeedAngle è un sistema di vettorizzazione del momento di livello istituzionale che elimina l'overfitting ( curve-fitting ) attraverso l'ottimizzazione continua Walk-Forward (WFO). Invece di affidarsi a input statici che si degradano quando i regimi di mercato cambiano, l'indicatore recalibra dinamicamente i suoi parametri utilizzando la validazione Out-of-Sample (OOS), assicurando che i segnali visualizzati rappresentino reali vantaggi statistici anziché anomalie storiche. Quadro
Unix Scalper
Issam Kassas
4 (4)
UNIX SCALPER — OFFERTA SPECIALE Individua il setup. Esamina il piano. Scegli come operare. Acquista UNIX Scalper per MT5 a 99 USD e ricevi Smart Universal Expert Advisor GRATIS per automatizzarne i segnali. UNIX Scalper riunisce analisi di mercato, indicazioni BUY/SELL/WAIT e livelli Entry, Stop Loss, TP1 e TP2 in un unico pannello organizzato. Segui il piano di trading manualmente oppure collega l’EA incluso per eseguire automaticamente le operazioni secondo le impostazioni scelte. Il prezzo at
Welcome to ENTRY IN THE ZONE AND SMC MULTI TIMEFRAME / SPECIAL BENEFIT FOR OUR MQL5 CUSTOMERS  FREE ACCESS TO THE NEW TOOL —COMING SOON —   Learn More on Our Official Website : https://www.fableedge.net Entry In The Zone and SMC Multi Timeframe is a real-time market analysis tool based on Smart Money Concepts (SMC), designed to analyze market structure, price direction, and key trading zones. It supports both Single-Timeframe Analysis and Multi-Timeframe Analysis, providing a clearer view of the
Atomic Analyst MT5
Issam Kassas
4.47 (60)
ATOMIC ANALYST — OFFERTA SPECIALE La tua analisi di mercato. Il tuo EA per l’automazione. La tua formazione e il tuo supporto. Acquista Atomic Analyst per MT5 a 99 USD e ricevi Smart Universal Expert Advisor GRATIS per automatizzare i segnali dell’indicatore. Atomic Analyst riunisce l’azione del prezzo, la direzione del trend, i segnali di entrata e uscita, lo Stop Loss e diversi livelli di Take Profit direttamente sul grafico. Opera manualmente utilizzando la sua analisi oppure collega l’EA in
Power Candles MT5
Daniel Stein
4.58 (12)
Power Candles V3 - Indicatore di forza ad ottimizzazione automatica Power Candles V3 trasforma la forza delle valute e degli strumenti in un piano di trading attuabile su ogni grafico a cui è collegato. Invece di limitarsi a colorare le candele, esegue un'auto-ottimizzazione in tempo reale in background e ti fornisce i migliori valori di Stop Loss, Take Profit e soglia di segnale per il simbolo che hai davanti. Basta un clic per adottarlo nel trading live: i raggi di ingresso, Stop Loss e Take P
Adaptive Price Action Engine Acquista un indicatore, ricevi l'EA gratis Analisi Auto-Ottimizzata del Trend e dei Pattern Candlestick Multi-Timeframe I mercati cambiano continuamente e non tutti i pattern di Price Action hanno lo stesso valore in ogni condizione di mercato. Adaptive Price Action Engine è progettato per adattarsi alle condizioni di mercato in continua evoluzione, combinando struttura del trend, analisi Multi-Timeframe, pattern Candlestick e ottimizzazione statistica in un unico fr
Currency Strength Wizard   è un indicatore molto potente che ti fornisce una soluzione all-in-one per un trading di successo. L'indicatore calcola la potenza di questa o quella coppia forex utilizzando i dati di tutte le valute su più intervalli di tempo. Questi dati sono rappresentati in una forma di indice di valuta facile da usare e linee elettriche di valuta che puoi utilizzare per vedere il potere di questa o quella valuta. Tutto ciò di cui hai bisogno è collegare l'indicatore al grafico ch
M1 Quantum MT5
Hamed Dehgani
4.2 (10)
Segnali di Trading Live con M1 Quantum: Segnale   (Operazione eseguita automaticamente dal Quantum Trade Assistant , incluso gratuitamente con questo prodotto.) Ultime notizie: La versione 1.64 è stata rilasciata. Ora tutte le operazioni hanno uno Stop Loss posizionato dietro le relative zone di Supporto/Resistenza. Anche la funzione Smart Close è stata migliorata per aumentare le prestazioni dell'EA in questa versione. Dal 9 agosto, il segnale live è in esecuzione sulla versione 1.64. Piano pr
PZ Trend Trading MT5
PZ TRADING SLU
3.8 (5)
Capture every opportunity: your go-to indicator for profitable trend trading Trend Trading is an indicator designed to profit as much as possible from trends taking place in the market, by timing pullbacks and breakouts. It finds trading opportunities by analyzing what the price is doing during established trends. [ Installation Guide | Update Guide | Troubleshooting | FAQ | All Products ] Trade financial markets with confidence and efficiency Profit from established trends without getting whips
Scalper Vault   è un sistema di scalping professionale che ti fornisce tutto il necessario per scalping di successo. Questo indicatore è un sistema di trading completo che può essere utilizzato dai trader di forex e opzioni binarie. L'intervallo di tempo consigliato è M5. Il sistema fornisce segnali di freccia accurati nella direzione della tendenza. Ti fornisce anche i segnali più alti e più bassi e i livelli di mercato di Gann. Gli indicatori forniscono tutti i tipi di avvisi, comprese le noti
Divergence Bomber
Ihor Otkydach
4.89 (94)
Ogni acquirente dell’indicatore riceverà inoltre gratuitamente: L’utilità esclusiva “Bomber Utility”, che gestisce automaticamente ogni operazione, imposta i livelli di Stop Loss e Take Profit e chiude le posizioni secondo le regole della strategia I file di configurazione (set file) per adattare l’indicatore a diversi asset I set file per configurare il Bomber Utility in tre modalità: “Rischio Minimo”, “Rischio Bilanciato” e “Strategia di Attesa” Una guida video passo-passo per installare, con
L'indicatore UZFX {SSS} Scalping Smart Signals v5.0 MT5 è un indicatore di trading ad alte prestazioni che non subisce ripaint, progettato per scalper, day trader e swing trader che necessitano di segnali accurati e in tempo reale in mercati in rapida evoluzione. Sviluppato da (UZFX-LABS), questo indicatore combina l’analisi dell’azione dei prezzi, la conferma del trend e il filtraggio intelligente per generare segnali di acquisto e vendita ad alta probabilità, segnali di allerta e opportunità d
SkyHammer Signal Pro Indicatore professionale di segnali trend no-repaint con livelli Entry, SL e TP bloccati SkyHammer Signal Pro è un indicatore strutturato di trend e momentum, progettato per trader che desiderano segnali chiari, fissi e verificabili. Funziona al meglio su timeframe bassi, come M1 e M5 . L’indicatore non cerca di prevedere massimi o minimi del mercato. Attende invece una struttura di mercato confermata, una chiara direzione del trend, forza del momentum, volatilità sana e spa
The Oracle Pro
Ottaviano De Cicco
5 (1)
The Oracle Pro: Synthetic Multi-Timeframe Bias Engine for MT5 ️ Summer Launch Offer — Get The Oracle Pro for USD 199 (early buyers). Price rises with traction; final price USD 399. The Oracle Pro is a premium multi-timeframe bias engine for MetaTrader 5, built for demanding and professional traders. It answers one question with discipline: what is the directional bias on each timeframe right now, how strong is it, and how much do the timeframes agree? Everything is computed on closed bars only
PZ Divergence Trading MT5
PZ TRADING SLU
3.71 (7)
Unlock hidden profits: accurate divergence trading for all markets Tricky to find and scarce in frequency, divergences are one of the most reliable trading scenarios. This indicator finds and scans for regular and hidden divergences automatically using your favourite oscillator. [ Installation Guide | Update Guide | Troubleshooting | FAQ | All Products  ] Easy to trade Finds regular and hidden divergences Supports many well known oscillators Implements trading signals based on breakouts Displays
Crystal Heikin Ashi Signals
Muhammad Jawad Shabir
5 (4)
Crystal Heikin Ashi Signals—Professional Trend & Signal Detection Indicator Advanced Heikin Ashi Visualization with Intelligent Signal System for Manual & Automated Trading Final Price: $149 ---------> Price goes up $10 after every 10 sales . Limited slots available — act fast . Overview User Guide PDF Crystal Heikin Ashi Signals is a professional-grade MetaTrader 5 indicator that combines pure Heikin Ashi candle visualization with an advanced momentum-shift detection system. Designed for both m
DayTrader PRO
Davit Beridze
5 (4)
DayTrader PRO DayTrader PRO è un indicatore di trading avanzato che combina il filtro Laguerre di John Ehlers con un potente motore di auto-ottimizzazione. Invece di utilizzare parametri fissi, l'indicatore ricerca automaticamente le migliori impostazioni in base alle condizioni recenti del mercato, aiutandoti ad adattarti alla volatilità variabile senza costanti aggiustamenti manuali. L'indicatore genera segnali chiari di ACQUISTO (BUY) e VENDITA (SELL), insieme a livelli adattivi di Stop Loss
Mahra Pro Indicator MT5
Mahra Said Mohammed Al Kaabi
Mahra Pro Indicator MT5 Overview Mahra Pro is a MetaTrader 5 chart indicator designed to support structured analysis of XAUUSD (Gold). It combines trend, momentum, volatility and price-structure conditions to identify potential buy and sell setups and display them directly on the chart. The indicator does not open, modify or close trades. All trading decisions and order execution remain under the user's control. Main features • Buy and sell signal arrows on the chart. • Fast and slow EMA lines w
Precision Spike Detector
Francisco Mandomo Simbine
5 (2)
Precision Spike Detector V3 – Institutional-Grade AI Trading System Attention: The price increases by US$50 for every 10 purchases.  Final price: US$599 Precision Spike Detector V3   is a   state-of-the-art, institutional-grade market analysis system   for   MetaTrader 5 , designed to detect   high-probability market movements   in synthetic indices such as   Boom, Crash, GainX, and PainX . After purchase, send me a private message to receive the optimized configuration files,  the installation
Volume Profile Multiple — Profili di Volume Multipli con Buffer per il Trading Algoritmico Stanco di ridisegnare il Volume Profile blocco per blocco, ricalcolando tutto ogni volta che cambi timeframe? Volume Profile Multiple traccia automaticamente più profili di volume consecutivi sul grafico, rivelando dove si è realmente concentrato l'interesse istituzionale in ogni tratto del mercato — non solo nell'ultimo intervallo visibile. Cosa fa l'indicatore per te L'indicatore suddivide lo storico dei
Quantum Direction è un indicatore professionale di trend following progettato per identificare la direzione del mercato, rilevare i cambiamenti iniziali del trend e fornire segnali filtrati di ingresso e uscita. Questo indicatore include gratuitamente Quantum Trade Assistant , uno strumento professionale per la gestione delle operazioni disponibile sul MQL5 Market. Può collegarsi direttamente a Quantum Direction e aprire automaticamente le operazioni quando appare un segnale valido, oppure chiud
Gold Beaver Signals ti mostra, direttamente sul grafico, dove un robot professionale di breakout entrerebbe nel mercato dell'oro — prima che accada. Prova dal vivo Non è una promessa. Le stesse strategie girano su un segnale reale e pubblico che puoi controllare in qualsiasi momento: https://www.mql5.com/en/signals/2375536 Cosa fa, in parole semplici L'indicatore osserva l'oro esattamente come il nostro robot di trading. Quando il prezzo accumula pressione sotto un livello importante, disegna un
Gartley Hunter Multi
Siarhei Vashchylka
5 (12)
Gartley Hunter Multi - An indicator for searching for harmonic patterns simultaneously on dozens of trading instruments and on all possible timeframes. Manual (Be sure to read before purchasing) | Version for MT4 Advantages 1. Patterns: Gartley, Butterfly, Shark, Crab. Bat, Alternate Bat, Deep Crab, Cypher 2. Simultaneous search for patterns on dozens of trading instruments and on all possible timeframes 3. Search for patterns of all possible sizes. From the smallest to the largest 4. All fou
Altri dall’autore
L'indicatore calcola le aree di arresto/inversione di tendenza più probabili, le aree di movimento di tendenza sicure. Il calcolo considera: il tasso di variazione del prezzo; l'angolo di deviazione relativa del grafico; l'ampiezza media dei movimenti di prezzo; il prezzo che esce dalla sua "zona di comfort"; i valori dell'indicatore ATR. L'indicatore può generare un avviso quando il prezzo entra in un'area di stop/inversione. Impostazioni Disegna l'intera lunghezza? - disegnare le aree fino
Buy and sell zones
Evgeniy Zhdan
5 (2)
Indicator for determining flat and trend. If the price is below any of the two histograms and two lines (red and blue), this is a sell zone. When purchasing this version of the indicator, MT5 version for one real and one demo account - as a gift (to receive, write me a private message)! If the price is above any of the two histograms and two lines (red and blue), this is a buy zone. MT5 version:  https://www.mql5.com/en/market/product/70409 If the price is between two lines or in the zone of
SuperTrend
Evgeniy Zhdan
2.5 (2)
The Supertrend Expert Advisor The Supertrend Expert Advisor with averaging elements. It has been developed during three months until I finally got good results. It is not a scalper. The minimum balance to start trading - 100 $. Is automatically adjusted to the 4 and 5-digit prices. Has an efficient risk management system. The lot and limit on the maximum lot is automatically calculated based on the settings specified in the EA. As a result, you have a complete automated trading system. Download
Stardust
Evgeniy Zhdan
StarDust searches for divergences in the values of several indicators considering them as signs of flat and enters the market if a relatively steady trend is detected. The Expert Advisor trades "basic" symbols with a low spread. The best results are achieved on М15. The EA automatically adjusts to 4 and 5-digit quote flows. Settings Comment_to_orders – comment to a placed order. The field can be left blank if no comment is required. MM – enable money management with automatic setting of a worki
Top Floor
Evgeniy Zhdan
The EA catches the price when it moves against the trend in an effort to open an order in an opposite direction (direction of the main trend). Screenshots illustrate examples of entries and the strategy gist. The EA uses stop losses depending on values of ATR. Settings: Lot_ - if Risk_ = 0, the EA will trade this lot; Risk_ - risk per one trade. Stop loss is taken into account; koeff_ATR - coefficient multiplied by the ATR value to calculate stop loss (the bigger the value, the bigger stop loss
FastBoom
Evgeniy Zhdan
The FastBoom EA finds the most probable points of price pullback/reverse and places an order. It places averaging orders if the price moves further against take profit. Settings of the EA: Lots - initial lot; LotExponent - multiplier for following orders (Martingale). 1 - no multiplier. TakeProfit - take profit in points; Stochastic Settings InpKPeriod - K Period of Stochastic InpDPeriod - D Period of Stochastic InpSlowing - Stochastic Slowing LevHigh - level for sell positions of Stochastic L
The Expert Advisor calculates the double/triple divergence of volumes, and starts trading. It uses a unique formula of lot calculation, which greatly improves stability of trading. Recommended TF - 1h. Currency pair - EURUSD , but the EA can be used on any trading instruments which are not subject to high volatility. Settings mode - trading direction can be set manually; close - order close level (details on the screenshot); Step between orders - step between orders in points; Maximum orders -
OrderOnLine
Evgeniy Zhdan
The Expert Advisor opens orders from the horizontal line, the a trader can set on any level by dragging using the mouse or by changing the line properties. For example, when a horizontal line is above the current price, the EA will open a Buy order once the horizontal line is reached. And vice versa: If the line is below the current price, the EA will open a sell order once the line is crossed. A buy crossover of the line is: opening of the current candlestick below the horizontal line; the curr
SellerATR
Evgeniy Zhdan
5 (1)
The Expert Advisor only sells. Recommended currency pairs : EURUSD; GBPUSD; USDCHF; USDJPY; USDCAD; AUDUSD; EURGBP; EURAUD; EURCHF; EURJPY; GBPCHF; CADJPY; GBPJPY; AUDNZD; AUDCAD; AUDCHF; AUDJPY; CHFJPY; EURNZD; EURCAD; CADCHF; NZDJPY; NZDUSD. Timeframe: H1. Percent% manages closing both loss-making and profitable deals based on the account overall status. Using the EA on 23 symbols mentioned above allows the robot to cope with the drawdown in case of a long trend. While positions on some pairs
Illusion
Evgeniy Zhdan
3 (2)
The Illusion EA uses the probability theory - after a series of consecutive virtual losses - i.e. right during a flat the EA already starts trading in the trend. In addition, the EA considers the ratio of bullish/bearish candles on the higher timeframes to determine the greatest probability of the price movement direction. Only 1 order can be opened at a time. In case of a loss the following order will be placed with an increased lot (the multiplication coefficient is set in the parameters). The
The indicator plots a trend line and determines the levels for opening trades, in case the price goes "too far" away from the trend level. More detailed information is available in the screenshots. Settings Away from the trend line - distance from the trend line to the trades level; Arrow Signal for deals - enable displaying an arrow when the price reaches the trades level; Size of Arrow - size of the arrow; Alert Signal for deals - enable generating alerts when the price reaches the trades lev
Turbina
Evgeniy Zhdan
5 (4)
The axiom of the Forex market is that any trend will be broken. The Expert Advisor determines trend direction (the pink line), and calculates levels for opening opposite orders depending on the settings. The value of Away from the trend line for Deal will be different for each pair and timeframe, depending on the volatility of the trading instrument. Next orders can be opened with an increased lot (a static lot is used by default). See the screenshots to understand the idea of the Expert Advisor
Odysseus
Evgeniy Zhdan
The Expert Advisor determines the moments of strong movements and opens a position in the direction of the most probable price movement. The strategy always uses stop loss and take profit. Several independent orders can be in the market (the maximum number is set in parameters). The goal of the EA's underlying trading system is the quantitative excess of the number of profitable deals over the number of losing ones. Recommended: EURUSD 5m; GBPUSD 5m; USDJPY 5m. The Expert Advisor is able to work
Vise
Evgeniy Zhdan
Vise is a trend indicator. The upper and lower lines follow the price showing the prevailing price direction. Frequent breakthroughs of the upper line indicate a bullish trend, while frequent breakthroughs of the lower line indicate a bearish one. Parameters Points for UpLine - initial number of points for the upper line; Points for DownLine - initial number of points for the lower line. During the breakthrough of the upper level (line), this level shifts upwards by Points for UpLine. If the up
Twinkle
Evgeniy Zhdan
Twinkle is a trend-based scalper using stop loss and take profit invisible to the broker. The EA does not look for trend reversals. The EA catches strong market movements and opens orders in the direction of the trend. Your broker will not see the order closing levels. The EA closes orders independently when reaching the take profit or stop loss levels specified in the settings. Recommended trading symbols: EURUSD M5, GBPUSD M5. ECN accounts with 5 digits quotes are recommended. Expert Advisor
Shine
Evgeniy Zhdan
4.75 (4)
This Expert Advisor implements elements of the Martingale system. Orders are opened at a specified distance from the moving average. The Parabolic SAR indicator and certain technical details are used to ensure the most accurate entries. The EA is highly customizable. It is recommended for simultaneous use on 4 currency pairs: EURUSD M15; GBPUSD M15; USDJPY M15; USDCAD M15. Despite good stability, it is advisable to disable the EA operation during the days rich in news releases. Configurations P
LuckyCase
Evgeniy Zhdan
LuckyCase is an Expert Advisor with martingale elements. The EA strategy is based on a significant "deviation" of the price from SAR inadicator and the Bands levels breakthrough point. The money management system is an essential part of the EA. It starts working after a trade is opened. Trades are closed after accumulating specified points of market orders, by deposit % or after an opposite side of the channel is broken through. The default EA settings are meant for: EURUSD M15; USDJPY M15. The
Elize
Evgeniy Zhdan
The Elize Expert Advisor has been designed to work with the EURCHF currency pair. It considers the peculiarities of this trading instrument, its behavior and dependence on the behavior of other currencies. In particular, when the currencies of the European countries (EURUSD, GBPUSD, EURNOK, EURCHF) move in the same direction, the EA starts its operation and opens a deal in the trend direction of the European currencies. In the event of price rollbacks, the EA uses a unique method for making the
AllTrendLines
Evgeniy Zhdan
4 (1)
Brief Description of the All Trend Lines Indicator The indicator analyzes the wave structure of the market. What it displays on the chart: First. Wave pivots (semaphores) • Red markers – wave highs • Yellow markers – wave lows • Yellow-green markers – additional local extremes Second. Trend lines • Purple/blue lines – trends based on highs (resistance/support) • Beige/green lines – trends based on lows • Lines are built automatically by connecting wave pivots of the same type Third. Main trend
FastTraffic
Evgeniy Zhdan
The Expert Advisor has been specifically developed for trading gold (Spot Gold). The strategy is based on Fibo levels calculated from the previous (first) candle High/Low and the width of the current and lower timeframes channel. If important Fibo levels of different orders are located in a single price channel (within a spread), the EA defines this channel as the target for price movement and starts operation. Martingale and averaging are not used. Each order is independent and is accompanied b
Jazz
Evgeniy Zhdan
The algorithm of this Expert Advisor determines the significant price levels, where the trend often turns into a flat or reverses. Stochastic Oscillator serves as an additional filter of overbought/oversold zones. The EA sets stop loss and take profit after opening an order. The underlying trailing strategy applies a trailing stop. The EA is recommended for simultaneously use on three trading instruments: EURUSD M5, GBPUSD M5, EURCHF M5. Settings: Comment to order - comment to orders. MaxRisk -
Panther
Evgeniy Zhdan
The Expert Advisor looks for technical analysis patterns formed on the higher (hourly) timeframe to start working on the 5-minute chart. Technical analysis patterns used: double top/double bottom, head/shoulders, flag, expanding/narrowing triangles. The Relative Vigor Index technical indicator is used as the filter for opening deals. It is based on the idea that on the bull market the closing price is, as a rule, higher, than the opening price. It is the other way round on the bear market. This
Spook
Evgeniy Zhdan
The Expert Advisor calculates the divergence on the current and higher timeframes. In case the divergences coincide, the EA starts its operation. Deals have strict take profit and stop loss levels. Each deal is managed by trailing stop. The strategy involves the use of a tight stop-loss. Therefore, losing deals and/or series of losing deals are not uncommon. This EA is not suitable for those who have difficulties coping with losing deals. The EA is recommended for simultaneous use on the followi
Grand
Evgeniy Zhdan
The Expert Advisor has been developed specifically for the features of the CHFJPY currency pair. The EA's algorithm determines the direction of the current trend and starts operation. In case of a price reversal within the current trend, the EA adds additional orders. If trend changes, the EA starts to work in the direction contrary to the initial grid of orders. If there were no conditions for closing orders and the trend direction changed again, the EA continues to work with the "first" grid o
Intensive
Evgeniy Zhdan
The Expert Advisor algorithm determines on daily charts those candlestick patterns, which set the intraday trading direction. The trading EA determines how long the price is moving in overbought/oversold zones and starts working in the direction of the expected trend movement. Each position is accompanied with a tight stop loss and take profit. Only one active position can be open in the market. The EA was developed and tested using 99% quality quotes. The Expert Advisor has a built-in news filt
Slender
Evgeniy Zhdan
The strategy of this Expert Advisor is based on a hedging system, which implies placing opposite orders. The EA algorithm determines trend beginning and opens a position in the trend direction. In case of a wrong entry, the EA tries to neutralize the drawdown through opposite (hedging) orders at a preset interval (Coefficient of counter orders). Orders are closed when one of the two values ​​is reached - profit in percent or profit in points. The EA does not use lot increase. The EA wast tested
Dreamer
Evgeniy Zhdan
Советник работает по принципу хеджирования с периодическими "перекосами" в сторону трендовых направлений. Направления тренда советник определяет на основании стандартного индикатора Parabolic Stop and Reverse system (SAR). Уникальная стратегия установки балансирующих позиций позволяет избегать больших просадок даже при самых не благоприятных рыночных условиях. Параметры по умолчанию рекомендуется использовать на торговом инструменте: GBPJPY 15m. Разработка и оптимизация параметров производились
Snoot
Evgeniy Zhdan
5 (1)
This Expert Advisor works using a grid in the direction of a trend movement with the step between opened positions defined in the settings. The positions are closed by the total take profit. The Parabolic SAR standard indicator is used to filter order opening, which comes in the MetaTrader 4 package. The EA has been developed and tested using 99,9% quality of quotes. Operation of the EA in real time can be viewed in the signals . The best trading results have been achieved on CHFJPY M15. Settin
Solipsism
Evgeniy Zhdan
The Expert Advisor builds channels based on the data obtained using ATR and MA indicators according to the equations: Upper channel border = MA + ATR * (FIBO); Lower channel border = MA - ATR * (FIBO), where FIBO has the following values: Style of Trade - Aggressive = 1.61852; Style of Trade - Average = 3.26704; Style of Trade - Calm = 4.85556. Trades are opened inside the channel with the intervals defined in the settings. Long and short positions are opened independently. Positions are closed
The trading statistics indicator notifies the trader of the aggregate income of the trading account for different time intervals. The indicator has wide display settings on the graph. There is a choice of one of the two display languages on the chart- English and Russian. Settings Indicator language (ENG, RUS) - Select the language to display on the chart; To control the magic (-1: any magic) - Entering the Magic for control (-1: any Magic); Angle of indicator tie - Selecting the angle of the c
Filtro:
Nessuna recensione
Rispondi alla recensione