WaveMarkers

Wave Markers: Çoklu zaman dilimli panele sahip uyarlanabilir dalga haritası

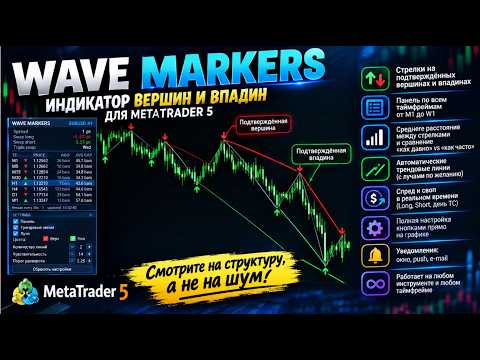
Gürültüyü değil, piyasanın gerçek yapısını görün: onaylanmış salınım tepeleri ve dipleri, bunlardan geçen trend çizgileri ve M1'den W1'e kadar tüm zaman dilimlerinin durumu, tek bir panelde.

Nedir?

Wave Markers, MetaTrader 5 için bir grafik yapısı göstergesidir. Fiyatın dönüş noktalarını (salınım tepeleri ve salınım dipleri) bulur, bunları net oklarla işaretler ve çevresinde çalışma araçları kurar: trend çizgileri, tüm zaman dilimlerini gösteren bir tablo, ayrıca anlık spread ve swap bilgisi.

"Al" veya "sat" komutu vermez ve herhangi bir sonuç vaat etmez. Tek bir işi yapar ve onu titizlikle yapar: piyasanın gerçekte nerede döndüğünü göstererek yapıyı daha hızlı ve daha tutarlı okumanıza yardımcı olur.

Neden sıradan bir ZigZag değil?

Klasik bir ZigZag, neyin dönüş sayılacağına sabit bir mesafeyle (puan veya yüzde) karar verir. Bu tek sayı çoğu zaman yanlıştır: sakin piyasada çok büyüktür (gerçek dalgaları kaçırırsınız), hızlı piyasada çok küçüktür (gürültü toplarsınız).

Wave Markers farklı çalışır:

  • Dönüş eşiği, güncel volatiliteye göre kendini ayarlar. Eşik, piyasanın kendi tipik hareketinin katları cinsinden ölçülür: piyasa hareketlendiğinde genişler, sakinleştiğinde daralır. Aynı ayar; majör paritelerde, altında, endekslerde ve kripto paralarda, ayrıca farklı zaman dilimlerinde mantıklı davranır.
  • İşaretçi, ancak dönüş onaylandıktan sonra görünür. Fiyatın uç noktadan eşik kadar gerçekten uzaklaşması gerekir. Geleceğe bakma yoktur ve mum hâlâ oluşurken tepe tahmin edilmez.
  • Onay gecikmesi açık ve öngörülebilirdir. Gecikmeyi seçtiğiniz eşik belirler: daha yüksek eşik, daha az ama daha önemli dalgalar ve daha geç onay demektir; daha düşük eşik, daha sık ve daha hızlı işaretçiler demektir.
  • Mantık her zaman diliminde aynıdır, böylece panel birbiriyle karşılaştırılabilir şeyleri karşılaştırır.

Başlıca avantajlar

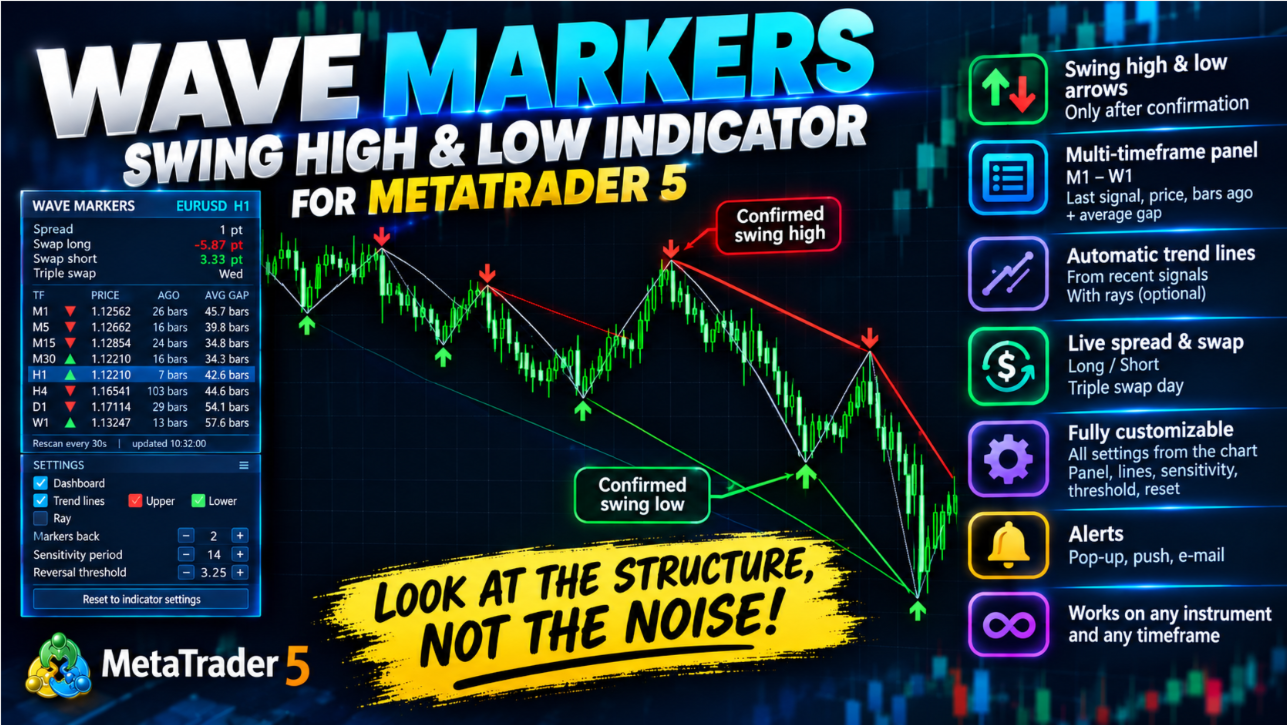
  • Temiz, okunaklı işaretçiler: her onaylanmış salınım tepesinde aşağı ok, her salınım dibinde yukarı ok
  • Sabit bir sayı yerine volatiliteye uyum sağlayan eşik
  • Son işaretçilerden geçen otomatik trend çizgileri, isteğe bağlı ışınlarla
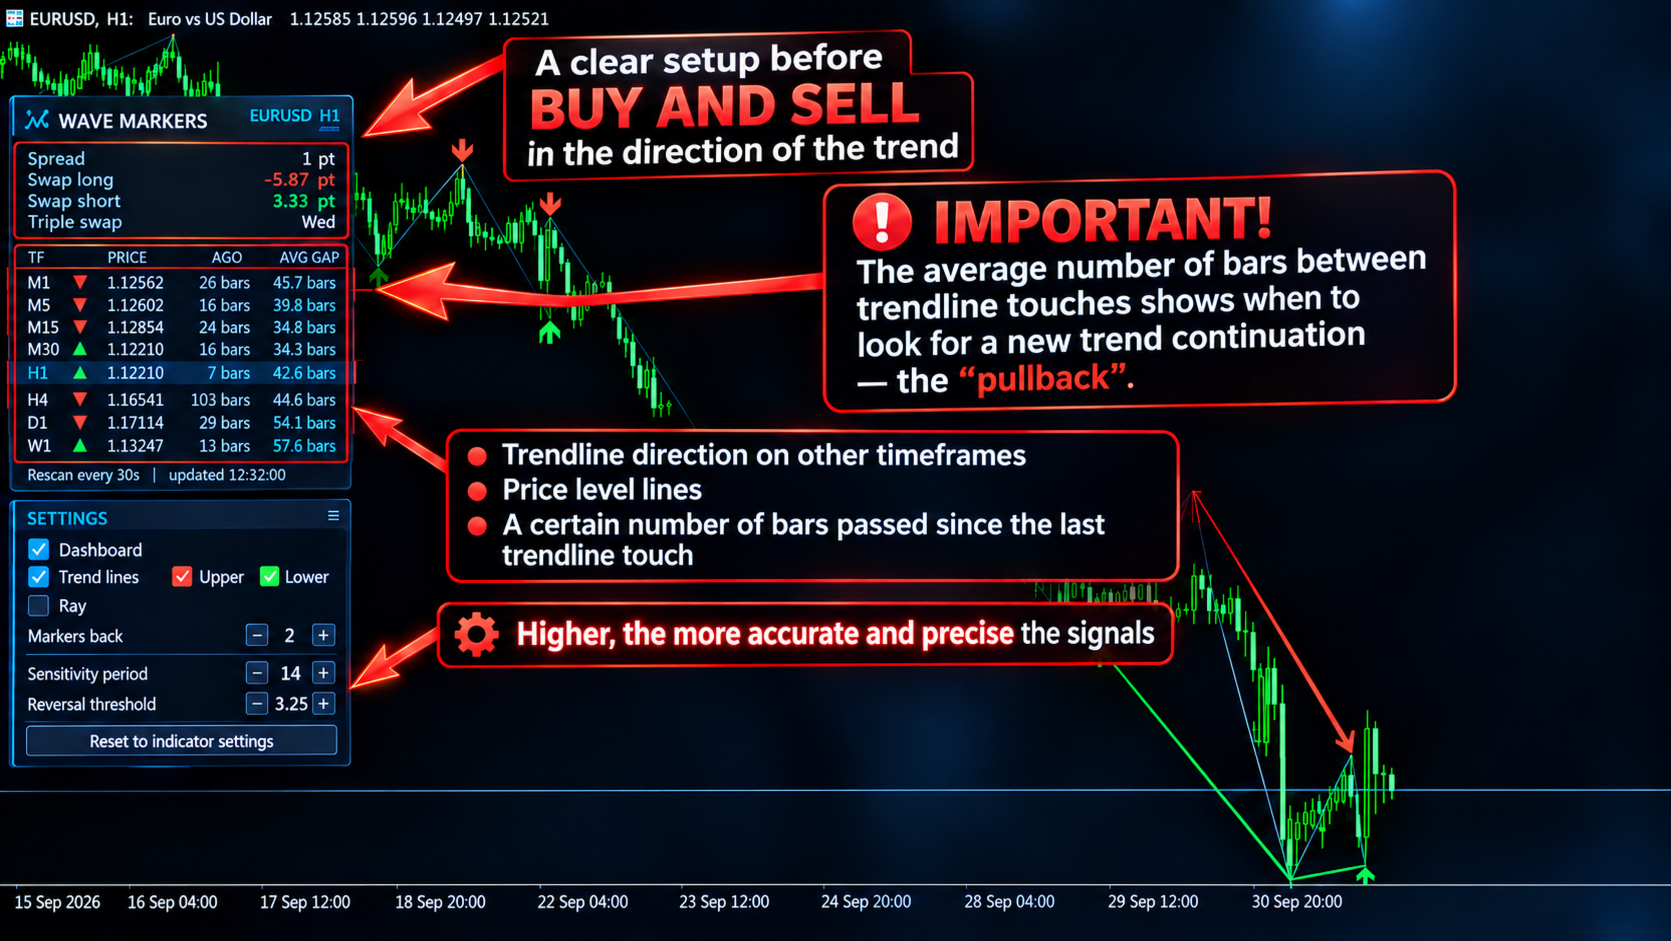
  • M1'den W1'e tüm zaman dilimleri için panel: son işaretçinin yönü, fiyatı, kaç mum önce göründüğü ve aynı yöndeki işaretçiler arasındaki ortalama aralık
  • Aynı panelde anlık spread ve swap (long, short ve üçlü swap günü)
  • Diğer zaman dilimlerinde eksik geçmiş otomatik olarak istenir ve yüklenir
  • Terminale hafif: grafikteki işaretçiler her yeni mumda bir kez yeniden hesaplanır, diğer zaman dilimleri her tikte değil zamanlayıcıyla kontrol edilir
  • Ayarlar penceresini açmadan her şeyi doğrudan grafikten kontrol edebilirsiniz
  • Her yeni işaretçide açılır pencere, push ve e-posta bildirimleri
  • Her enstrümanda ve her zaman diliminde çalışır

Grafikte neler görürsünüz?

İşaretçiler ve dalga çizgisi. Onaylanmış salınım tepelerinde ve diplerinde oklar görünür. İsterseniz ince bir çizgiyle birleştirilerek dalgalar tek bakışta okunur.

Trend çizgileri. Gösterge, son salınım tepelerinden ve ayrı olarak son salınım diplerinden geçen çizgiler çizer. Kaç parça çizileceğini siz seçersiniz: 1 ise o türün son iki işaretçisinden geçen tek çizgi; 2 ise son üç işaretçinin iki çizgiyle birleştirilmesi, ve böyle devam eder. Çizgiler sağa doğru ışın olarak uzatılabilir ya da mumun en yüksek veya en düşük noktasında tam olarak başlayıp biten parçalar olarak bırakılabilir.

Çoklu zaman dilimi paneli. M1'den W1'e her zaman dilimi için bir satır:

  • son işaretçinin yönü (▼ tepe, ▲ dip)
  • fiyatı
  • kaç mum önce göründüğü
  • analiz edilen tüm geçmişte bu yöndeki işaretçiler arasındaki ortalama mum sayısı

"Ne kadar önce" ile "genelde ne sıklıkla" değerlerini karşılaştırmak, bir zaman diliminin ritminin hangi aşamasında olduğunu hızla sezmenizi sağlar.

Spread ve swap. Güncel spread her tikte güncellenir ve belirlediğiniz seviyeyi aştığında vurgulanabilir. Long swap, short swap ve üçlü swap günü, enstrümana uygun birimlerle gösterilir.

Grafik üzerindeki kontrol paneli

Ana panelin altında kompakt bir ayar kartı bulunur. Bununla şunları yapabilirsiniz:

  • ana paneli gizleyip göstererek onun kapattığı grafik bölümünü görmek
  • trend çizgilerini açıp kapatmak; üstteki ve alttaki çizgileri ayrı ayrı yönetmek
  • ışınları açıp kapatmak
  • "−" ve "+" düğmeleriyle çizgi sayısını değiştirmek
  • "−" ve "+" düğmeleriyle duyarlılık periyodunu ve dönüş eşiğini değiştirip sonucu anında görmek
  • tek tıkla her şeyi gösterge ayarlarındaki değerlere döndürmek
  • tüm paneli başlık çubuğundan tutup grafikte istediğiniz yere sürüklemek

Ayarlar penceresindeki değerler başlangıç noktasıdır. Bundan sonra grafikte yaptığınız seçimler geçerli olur. Zaman dilimini değiştirmek seçimlerinizi korur, sıfırlama düğmesi ise özgün değerleri geri getirir.

Trader'lar nasıl kullanabilir?

  • Piyasa yapısını okumak: yükselen ve alçalan tepeler ve dipler, yapının bozulduğu yerler
  • Önemli salınım seviyelerini ve trend çizgilerini elle çizmek yerine otomatik elde etmek
  • Karar vermeden önce birkaç zaman dilimine tek bakışta göz atmak
  • İşaretçilerin ritmini zaman dilimleri arasında karşılaştırmak
  • Grafikten ayrılmadan spread ve swap maliyetini takip etmek

Wave Markers bir analiz aracıdır. Hiçbir işlem sonucunu garanti etmez ve her karar size aittir. Herhangi bir ayarı önce demo hesapta test edin.

Bilmeniz gerekenler

  • İşaretçi, ancak fiyat dönüş yaptıktan sonra onaylandığı için her zaman gecikmeyle görünür. Bu tasarım gereğidir ve gecikmenin büyüklüğünü dönüş eşiği belirler.
  • Diğer zaman dilimleri brokerınızın geçmişinden yüklenir. Bir zaman dilimi "loading..." gösteriyorsa terminal o dilimin mumlarını hâlâ oluşturuyor demektir.
  • E-posta bildirimleri için terminalde e-postanın kurulmuş olması gerekir (Araçlar → Seçenekler → E-posta).

Ayarlar

Wave Markers

  • Wave markers: sensitivity period: Piyasanın tipik hareketinin kaç mumla ölçüleceği. Kısa değerler volatilite değişimlerine daha hızlı tepki verir, uzun değerler daha kararlıdır. 14, iyi bir başlangıç noktasıdır.
  • Wave markers: reversal threshold, x sensitivity: Bir işaretçinin onaylanması için fiyatın bir uç noktadan, tipik hareketin kaç katı kadar uzaklaşması gerektiği. Yüksek değer, daha az ama daha önemli dalgalar ve daha geç onay demektir; düşük değer, daha fazla ve daha erken işaretçi, ama daha fazla gürültü demektir.
  • Analysis depth, bars (per timeframe): Göstergenin her zaman diliminde kaç mum geriye gidip analiz yapacağı. Derinlik arttıkça grafikte ve panel istatistiklerinde daha fazla geçmiş olur.

Chart Display

  • Show wave markers on chart: Okları açar veya kapatır.
  • Connect wave markers with a line: Ardışık işaretçileri ince bir çizgiyle birleştirir, böylece dalgaları izlemek kolaylaşır.
  • Swing high marker color: Salınım tepelerindeki okların rengi.
  • Swing low marker color: Salınım diplerindeki okların rengi.
  • Connecting line color: İşaretçileri birleştiren çizginin rengi.
  • Marker size (1-5): Okların boyutu.
  • Connecting line width (1-5): İşaretçileri birleştiren çizginin kalınlığı.

Dashboard

  • Show info panel on chart: Paneli ve grafikteki kontrol kartını gösterir. Kapatılırsa gösterge yalnızca bu ayarlar penceresindeki değerlerle çalışır.
  • Panel offset X, px: Panelin yatay başlangıç konumu. Sonrasında fareyle sürükleyebilirsiniz.
  • Panel offset Y, px: Panelin dikey başlangıç konumu.
  • Other timeframes re-check interval, sec: Diğer zaman dilimlerinin ne sıklıkla yeniden kontrol edileceği. Güncel grafik her yeni mumda güncellenir; bu parametre yalnızca tabloyu etkiler (en az 5 saniye).
  • Spread highlight level, points (0 = off): Spread değeri bu seviyeyi aştığında turuncuya döner. 0 vurgulamayı kapatır.

Alerts (current timeframe)

  • Popup alert on new wave marker: Yeni bir işaretçi onaylandığında terminalde uyarı penceresi gösterir.
  • Push notification on new wave marker: Telefonunuza bildirim gönderir (terminal ayarlarında MetaQuotes ID gerektirir).
  • E-mail notification on new wave marker: E-posta gönderir (terminalde e-posta kurulumu gerektirir).

Trend Lines (through wave markers)

  • Draw trend lines through wave markers: Tüm trend çizgileri için ana anahtar.
  • Lines through upper markers (highs): Salınım tepelerinden geçen çizgiler çizer.
  • Lines through lower markers (lows): Salınım diplerinden geçen çizgiler çizer.
  • Number of lines per side (markers back, 1-50): Her yön için kaç parça çizileceği. 1 ise son iki işaretçiden geçen tek çizgi; 2 ise son üç işaretçinin iki çizgiyle birleştirilmesi, ve böyle devam eder.
  • Extend all lines to the right (ray): Her çizgiyi sağa, grafiğin kenarına kadar uzatır. Kapalıysa her çizgi kendi işaretçilerinde başlar ve biter.
  • Upper line color: Salınım tepelerinden geçen çizgilerin rengi.
  • Lower line color: Salınım diplerinden geçen çizgilerin rengi.
  • Line style: Düz, kesikli, noktalı vb.
  • Line width (1-5, solid style only): Çizgilerin kalınlığı. MetaTrader, 1'den büyük kalınlıkları yalnızca düz çizgilere uygular.
  • Draw lines behind the chart: Çizgileri mumların üstüne değil, altına çizer.
Önerilen ürünler
The indicator plots flexible support and resistance levels (dots). A special phase of movement is used for construction. Levels are formed dynamically, that is, each new candle can continue the level or complete it. The level can provide resistance or support to the price even where it is no longer there. Also, support and resistance levels can change roles. The importance of levels is affected by: the amount of time the level is formed and the number of touches. The significance of these lev
In the context of trading, Malaysia SNR (Support and Resistance) refers to the technical analysis of support and resistance levels in financial markets, particularly for stocks, indices, or other assets traded. This is single timeframe version. Multiple timeframe version is avaiable here . There are three type of Malaysia SNR level Classic , GAP and Flipped 1. Classic Support is the price level at which an asset tends to stop falling and may start to rebound. It acts as a "floor" where demand is
MetaHelper
Volodymyr Tseibei
This indicator automatically calculates and displays classic pivot points on your chart, helping identify key support and resistance levels for the current trading session. Features: · Plots Pivot (PP), Resistance 1-2 (R1, R2), and Support 1-2 (S1, S2) levels · Includes current close price line for reference · Color-coded lines: Blue for pivot, Red for resistances, Green for supports · Automatic calculation based on previous day's high, low, and close · Continuous lines across the chart for e
BTFX Pivot Points
Bradley Thomas Farrington
The BTFX Pivot Points is an indicator which calculates the Support and Resistance levels for each day. By using this indicator the pivot levels point out clear targets to aim for. The resistance levels are shown in purple above the silver pivot line. The support levels are shown in Orange and can be found below the silver pivot line. This indicators works very well when used with The BTFX Daybreak Indicator. For a more in depth explanation of these indicators please watch the Youtube video attac
Veltrion Smart Fibonacci   is a clean automatic Fibonacci structure overlay for MetaTrader 5. It automatically detects recent swing highs and swing lows, then draws key Fibonacci retracement levels directly on the chart. The indicator is designed to help traders visualize market structure, retracement zones, and the golden zone without manually drawing Fibonacci tools. Key Features Automatic swing high and swing low detection Clean Fibonacci retracement overlay Horizontal Fibonacci levels for a
Structure Levels (Highs & Lows) Indicator for MetaTrader 5 Decode Market DNA — Trade with Institutional Precision Description: The Structure Levels (Highs & Lows) Indicator is your secret weapon to map the market’s hidden roadmap. Designed for traders who think in terms of price action and market structure, this tool automatically identifies critical swing highs and swing lows, transforming chaotic charts into a clear blueprint of support/resistance zones, breakout opportunities, and trend rev
Fair Value Gap (FVG) & Inversion Fair Value Gap (iFVG) – TradingLabs ID (Adil Değer Boşluğu ve Tersine Dönmüş Adil Değer Boşluğu) ICT (Inner Circle Trader) ve Smart Money Concepts (SMC) metodolojisinde, Fair Value Gap (FVG)—dengesizlik (imbalance) olarak da bilinir—fiyat aşırı bir momentumla hareket ederek arkasında bir likidite boşluğu bıraktığında oluşur. Bu doldurulmamış boşluklar, gelecekteki fiyat hareketleri için birer mıknatıs görevi görerek profesyonel yatırımcılar için en yüksek olasılı
这是一个基于前一个交易日的最高价、最低价和收盘价来计算的枢轴点指标,具体公式如下: 计算前一日的 Pivot Point (枢轴点): Pivot = (High + Low + Close) / 3 计算 Resistance 1 (R1) 、 Support 1 (S1) ​ 等: R1 = (2 * Pivot) - Low S1 = (2 * Pivot) - High R2 = Pivot + (High - Low) S2 = Pivot - (High - Low) 与市面上其他的枢轴点指标相比,该指标主要有以下4个特点: 1、可以修改交易日的开始时间; 2、可以设定支撑压力线的颜色; 3、可以设定是否显示各个支撑压力线对应的价格; 4、可以设定天数用以显示枢轴点的历史记录; 开发这个指标的最初目的是为了解决设定交易日开始时间的问题,接下来会进一步说明。基于计算公式,我们需要获得上一个交易日的最高价、最低价和收盘价,在夏令时,北京时间6点是开市时间,大多数交易平台服务器的0点对应的是北京时间的6点,但是香港的服务器6点才是对应的是北京时间的6点。如果你有多个平台,且存在
Support Resistance Break Zones PRO was built for a common problem I often see when trading XAUUSD and other fast-moving symbols: support and resistance levels are visible, but the chart becomes difficult to read when breakouts, retests and false breaks happen around the same area. Current price: $79 - increases by $10 after every 20 purchases until reaching the final price of $129 . Next price: $89 . Complete Buyer Kit: 42 Professional Resources included at no additional cost. MT5 Presets, PDF
Multichart V and H Line Sync Overview Multichart V and H Line Sync is the essential tool for multi-timeframe traders. It instantly synchronizes your Horizontal Support/Resistance Lines and Vertical Time Lines across all open charts of the same symbol. Stop drawing the same levels on M5, H1, and D1 charts manually. With this tool, draw a line once, and it automatically replicates on every other timeframe. Perfect for keeping your technical analysis consistent and your workspace clean. Key Feature
FREE
ZigZag Market Structure Breakout Pro ZigZag Extras Display BreakOut points is a MetaTrader 5 indicator for traders who use ZigZag, breakout points, market structure, BOS, CHoCH, swing high, swing low, support and resistance, and higher timeframe bias in their trading analysis. Main Benefits Displays confirmed ZigZag swing highs and swing lows Marks BOS Up, BOS Down, CHoCH Up and CHoCH Down Shows Depth Highest High and Depth Lowest Low lines Adds HH, HL, LH and LL structure labels Includes HTF bi
The indicator to trade price consolidation is designed to identify price contraction and alerts us on formation. It does this by analyzing historical price data and identifying price action patterns. The algorithm then uses this information to mark the zone , potential targets and liquidity lines, giving us valuable insights into market behavior.  Traders can adjust parameters such as colors ,alerts types and how many  previously formed zones to display on chart . Furthermore, the indicator can
Ric
Sabina Fik
With this indicator, you can   predict future price behavior   for a certain number of bars ahead, giving you the ability to anticipate market dynamics. The indicator draws a   forecast line , which models potential future price values based on sophisticated algorithms analyzing past data. This information can be leveraged not only for market entry and exit decisions but also for setting or adjusting stop-loss levels to better manage your positions. Application of the Forecast The data provided
SR Zones & Pivot Panel EA - All-in-One Trading Tool SR Zones & Pivot Panel EA   is a powerful hybrid tool that combines automatic   Support/Resistance Zones ,   Daily Pivot Points , and a   Compact Trading Panel   into one interface. It helps traders visualize key price levels on any timeframe while executing trades quickly and efficiently. Designed for precision and speed, this tool keeps your chart clean while providing all the data you need for intraday trading. Key Features 1. Automati
ShooterSignal ShooterSignal is a multi-timeframe market structure indicator for MetaTrader 5. The indicator analyzes price data and identifies swing points used to display market structure on the chart. Market Structure The indicator identifies: Higher High (HH) Higher Low (HL) Lower High (LH) Lower Low (LL) These structural points are displayed on the chart according to the selected timeframe. Structure Events ShooterSignal can display structural events based on detected price movement, includ
RelicusRoad Daily Pivots, MetaTrader 4 ve MetaTrader 5 için bir günlük pivot noktası göstergesidir; önceki günün aralığını Fibonacci seviyelerine böler ve eksi yüzde 100'den artı yüzde 200'e kadar bunun üstüne ve altına uzatır. Klasik floor pivotları yerine, önceki tamamlanmış aralık; dibin yüzde 0, tepenin ise yüzde 100 olduğu bir ölçek olarak ele alınır. On dokuz seviye, grafiğin sağ kenarında kompakt renkli işaretler olarak basılır, bu yüzden bugünün hareketinin büyüklüğü dünün aralığının bir
FREE
support resistance levels indicator mt5: Bu araç, insan gözünün aynı doğruluğuyla bir grafikte destek ve direnç çizgilerini, ayrıca Fibonacci seviyelerini tanımlayan ve çizen çok zamanlı bir göstergedir. Forex için TW destek ve direnç seviyeleri, fiyat stabilizasyonu ve sıçramalarının önceki seviyelerini belirlemek için grafiği tarayan karmaşık bir algoritmaya sahiptir ve dokunuş sayısını kaydeder. Destek ve direnç seviyelerini ve Fibonacci geri çekilmelerini manuel olarak çizmeye mi yoruldun
Murphy Order Block is a highly optimized and visually clean indicator for identifying key institutional zones based on pure market structure logic. It is designed for traders who follow Smart Money Concepts (SMC), ICT-style OB trading, and structure-based break & retest strategies. This indicator dynamically detects and draws: - **1 valid Bullish Order Block (Buy Zone)** - **1 valid Bearish Order Block (Sell Zone)** ### Key Features: **Market Structure-Based Logic**   - Uses swing high
Mechanical SR mt5
Part-time Day Trader
Mechanical Support Resistance Automatically calculates support and resistance levels using vertical price-profile analysis with pivot-style updates. Mechanical Support Resistance sits between a traditional support/resistance indicator , a pivot indicator , and a vertical profile indicator . Like an S/R indicator, it identifies important price levels. Like a pivot indicator, those levels remain fixed for a defined period and refresh on a scheduled daily, weekly, or monthly basis. And like a verti
Projection of Phi
Nestor Jose Mendez Boza
Projection of Phi   Is a technical indicator that calculates dynamic support and resistance levels. It uses angular geometric projections and mathematical ratios to identify market expansion ranges. Features: Dynamic Fibonacci Expansion: Extension level projection Geometric Calculation: Angular analysis and mathematical ratios Visualization: Graphical objects with informative labels Compatibility: M1 to H4 timeframes Applications: Identification of zones for trade management Analysis of volatil
FREE
Point and Fignure (P&F) chart plots price against changes in direction by plotting a column of Xs as the price rises and a column of Os as the price falls. Features Support for several kinds of price types - High/Low and Close. Clean and easy-to-read chart. Displays column high and low prices as indicator values. Support for both 4 and 5-digit brokers. Customizeable colors. Advantages Filter insignificant price movements and noise. Less noise and more stable work. Focus on important price move
Asya seansı aralığını işaretleyin KT Asian Breakout Indicator, Asya seansındaki dört saatlik bir pencerenin en yüksek ve en düşük seviyelerini işaretler ve aralık tamamlandıktan sonra fiyatı izler. GMT Offset ayarı seansı broker sunucu saatinizle hizalarken Draw Session Box görünür aralığı kontrol eder. Kırılımı ve işlem seviyelerini birlikte görün Fiyat seansın en yüksek seviyesinin üzerinde kapandığında yükseliş oku görünür. Fiyat seansın en düşük seviyesinin altında kapandığında düşüş oku gör

Traditional Pivot Points Pro is a professional MQL5 indicator designed to display accurate pivot levels with an automatic session-based calculation logic. It plots the main pivot point (P) together with resistance and support levels R1, R2, S1, and S2 in a clean and readable format. The indicator is built for traders who want a simple and efficient way to identify key market levels, potential reversals, intraday support and resistance zones, and price reaction areas. It is especially useful for
Detailed Description: The   Pivot Point Pro Indicator   is a powerful all-in-one fully customizable indicator that takes care of five pivot point methods (Classic, Fibonacci, Woodie, Camarilla, DeMark). It automatically plots pivot levels and midpoints, highlights key reversal zones and sends alerts when price approaches these levels.  Unlike the free Pivot Point Classic version, this Pro indicator allows users to customize more settings,   analyze current and historical pivot points and  use al
The Angle Prices indicator is a tool that calculates the price angle based on price analysis, interpreting the time vector in the form of price points on the price chart. In other words, the X axis and Y axis are represented as price points, so you can actually calculate the angle with two axes of the same dimension. This allows traders to obtain information about the direction of price movement and possible entry or exit points for trades. Let's look at the main characteristics and interpretat
AxisGuard Pro
Muhammad Andiya Nafhan
AxisGuard Pro Professional Pivot, Support & Resistance Indicator for MetaTrader 5 AxisGuard Pro is a professional analytical indicator designed to help traders identify important market levels without overcrowding the chart. It provides a clean view of Pivot Points, Support and Resistance levels with powerful multi-timeframe control. Suitable for: Forex Gold Indices Crypto Other MetaTrader 5 supported symbols Main Features Multi-Timeframe P
MT4 Sürümü: https://www.mql5.com/en/market/product/157679 MT5 Sürümü: https://www.mql5.com/en/market/product/157680 Destek Direnç — Akıllı Piyasa Yapısı Seviyeleri Profesyonel yatırımcılar ve otomatik sistemler için tasarlanmış, temiz, akıllı ve son derece güvenilir bir Destek ve Direnç göstergesi. Destek Direnç, Fraktallar, ATR tabanlı fiyat segmentasyonu ve çoklu zaman dilimi analizini birleştiren gelişmiş bir kümeleme algoritması kullanarak gerçek piyasa seviyelerini tespit etmek üzere ta
Divergence Sync MT5
Pavel Verveyko
5 (1)
Divergence and Convergence are important harbingers of reversals in stock markets. The Divergence Sync indicator is designed to automatically search for divergences on a large number of indicators with different parameters. The search for divergences is carried out on these indicators: (CCI, CHO, DeMarker, MACD, MFI, Momentum, OBV, OsMA, RSI, Stochastic, WPR,   Awesome Oscillator ). To search for divergences, you can use one technical indicator or search simultaneously on any number of indicat
UFO Market Structure & Fibo Pro UFO (Unfilled Order Institutional) zone + Non-Repaint Market Structure + Golden Fibonacci Entry Stop trading like retail. Start tracking institutions. UFO Market Structure & Fibo Pro is an all-in-one visual assistant designed to automatically map Institutional Supply & Demand, Market Structure, and Golden Fibonacci entries. No more subjective drawing, no more lagging indicators. Just pure, objective institutional footprints. UNIVERSAL MARKET COMPATIBILITY Work
Owl Smart Levels MT5
Sergey Ermolov
4.03 (32)
Trend yönünde işlem yaparken asıl zorluk bir seviye bulmak değil, girişin gerçekten nerede geçerli olduğunu anlamaktır. Fiyat genellikle seviyelere tepki verir ancak hareket devam etmez — bu da yanlış girişlere veya kaçırılan fırsatlara yol açar. Owl Smart Levels sadece seviyeleri göstermez , aynı zamanda piyasa yapısı ve geri çekilmelere dayalı bölgeler oluşturur. Bu, giriş noktalarını farklı şekilde değerlendirmenizi sağlar ve bazı hatalı sinyallerden kaçınmanıza yardımcı olur. Owl Smart Leve
Bu ürünün alıcıları ayrıca şunları da satın alıyor
SMART TREND TRADING SYSTEM — ÖZEL TEKLİF İşlem sisteminiz. Otomasyon EA’nız. Eğitiminiz ve desteğiniz. MT5 için Smart Trend Trading System’i 99 USD karşılığında satın alın; sistemin sinyallerini otomatik işleme dönüştürmek için Smart Universal Expert Advisor’a ÜCRETSİZ sahip olun . STTS; trend yönünü, giriş ve çıkış sinyallerini, dönüş bölgelerini ve önemli fiyat seviyelerini doğrudan grafiğinizde bir araya getirir. Sistemi manuel işlemler için kullanabilir veya pakete dahil EA’yı bağlayarak se
Trend Sniper X
Sarvarbek Abduvoxobov
4.9 (39)
Trend Sniper X , tüccarların trend yönünü ve olası dönüş noktalarını netlik ve hassasiyetle belirlemelerine yardımcı olan MetaTrader 5 için çoklu zaman dilimli bir trend takip göstergesidir. MT4 için: https://www.mql5.com/en/market/product/193245 Fiyat Bilgisi: Mevcut fiyat tanıtım amaçlıdır ve gelecek güncellemeler ile yeni özellikler yayınlandıkça değişebilir. Bonus Fırsatı: Bu indikatör için ÜCRETSİZ Oto-Trade Assistant EA'yı almak için lütfen satın aldıktan sonra yazara mesaj gönderin. Code
ARIPoint
Temirlan Kdyrkhan
1 (4)
ARIPoint is a powerful trading companion designed to generate high-probability entry signals with dynamic TP/SL/DP levels based on volatility. Built-in performance tracking shows win/loss stats, PP1/PP2 hits, and success rates all updated live. Key Features: Buy/Sell signals with adaptive volatility bands Real-time TP/SL/DP levels based on ATR Built-in MA Filter with optional ATR/StdDev volatility Performance stats panel (Success, Profit/Loss, PP1/PP2) Alerts via popup, sound, push, or email Cu
Gann Made Easy , bay teorisini kullanarak ticaretin en iyi ilkelerine dayanan, profesyonel ve kullanımı kolay bir Forex ticaret sistemidir. WD Gann. Gösterge, Zararı Durdur ve Kâr Al Seviyeleri dahil olmak üzere doğru SATIN AL ve SAT sinyalleri sağlar. PUSH bildirimlerini kullanarak hareket halindeyken bile işlem yapabilirsiniz. Satın alma işleminden sonra, alım satım talimatlarını ve harika ek göstergeleri ücretsiz olarak almak için lütfen benimle iletişime geçin! Muhtemelen Gann ticaret yöntem
Neuro Poseidon MT5
Daria Rezueva
4.75 (52)
Neuro Poseidon is a new indicator by Daria Rezueva. It combines precise trading signals with adaptive TP/SL levels - creating best possible trades as a result! Message me and get  Neuro Poseidon Assistant  as a gift to automize your trading process! What makes it stand out? 1. Proven profitability on all assets and timeframes 2. Only confirmed BUY and SELL signals present on the chart 3. Adaptive TP & SL levels generated by the software for each trade 4. Easy to understand - suitable for al
M1 Sniper MT5
Oleg Rodin
5 (7)
M1 SNIPER   kullanımı kolay bir işlem göstergesi sistemidir. M1 zaman dilimi için tasarlanmış bir ok göstergesidir. Gösterge, M1 zaman diliminde scalping için bağımsız bir sistem olarak kullanılabilir ve mevcut işlem sisteminizin bir parçası olarak kullanılabilir. Bu işlem sistemi özellikle M1'de işlem yapmak için tasarlanmış olsa da, diğer zaman dilimleriyle de kullanılabilir. Başlangıçta bu yöntemi XAUUSD ve BTCUSD ticareti için tasarladım. Ancak bu yöntemi diğer piyasalarda işlem yaparken de
Efsane geri dönüyor: Entry Points Pro 10. MQL5 Market'te 3 yıl boyunca ilk 3'te kalan efsanevi indikatörün yeniden lansmanı. Yüzlerce övgü dolu yorum (iki sürümde toplam 589), her gün binlerce trader onunla işlem yapıyor, 31.000+ demo indirmesi   MT4+MT5 . Beş yıl boyunca yazdığınız her yorumu okudum — ve söz vermek yerine yanıtları 10. sürümün içine işledim. 1999'dan beri piyasada olan ve dürüstlüğe, itibarına ve müşterilerine değer veren bir yazardan. Entry Points Pro, işleme giriş sinyallerin
Auto Optimized SpeedAngle , sürekli İleriye Dönük Optimizasyon (Walk-Forward Optimization, WFO) yoluyla eğri uydurmayı (curve-fitting) ortadan kaldıran kurumsal düzeyde bir momentum vektörleme sistemidir. Piyasa rejimleri değiştiğinde etkinliğini yitiren statik girdilere güvenmek yerine, gösterge, örneklem dışı (Out-of-Sample, OOS) doğrulama kullanarak parametrelerini dinamik olarak yeniden kalibre eder ve böylece gösterilen sinyallerin geçmişteki rastgele anomalileri değil, gerçek bir istatisti
Unix Scalper
Issam Kassas
4 (4)
UNIX SCALPER — ÖZEL TEKLİF İşlem fırsatını belirleyin. Planı görün. Nasıl işlem yapacağınıza karar verin. MT5 için UNIX Scalper’ı 99 USD karşılığında satın alın, sinyallerini otomatik işlemlere dönüştürmek için Smart Universal Expert Advisor’a ÜCRETSİZ sahip olun. UNIX Scalper; piyasa analizini, BUY/SELL/WAIT kararlarını ve Entry, Stop Loss, TP1 ve TP2 seviyelerini düzenli bir panelde bir araya getirir. İşlem planını manuel olarak uygulayın veya pakete dahil EA’yı bağlayarak seçtiğiniz ayarlara
Welcome to ENTRY IN THE ZONE AND SMC MULTI TIMEFRAME / SPECIAL BENEFIT FOR OUR MQL5 CUSTOMERS  FREE ACCESS TO THE NEW TOOL —COMING SOON —   Learn More on Our Official Website : https://www.fableedge.net Entry In The Zone and SMC Multi Timeframe is a real-time market analysis tool based on Smart Money Concepts (SMC), designed to analyze market structure, price direction, and key trading zones. It supports both Single-Timeframe Analysis and Multi-Timeframe Analysis, providing a clearer view of the
Atomic Analyst MT5
Issam Kassas
4.47 (60)
ATOMIC ANALYST — ÖZEL TEKLİF Piyasa analiziniz. Otomasyon EA’nız. Eğitiminiz ve desteğiniz. MT5 için Atomic Analyst’i 99 USD karşılığında satın alın; göstergenin sinyallerini otomatik işleme dönüştürmek için Smart Universal Expert Advisor’a ÜCRETSİZ sahip olun . Atomic Analyst; fiyat hareketini, trend yönünü, giriş ve çıkış sinyallerini, Stop Loss ve birden fazla Take Profit seviyesini doğrudan grafiğinizde bir araya getirir. Analizinden yararlanarak manuel işlem yapabilir veya pakete dahil EA’
Power Candles MT5
Daniel Stein
4.58 (12)
Power Candles V3 - Kendi Kendini Optimize Eden Güç Göstergesi Power Candles V3, döviz ve enstrüman gücünü, eklendiği her grafikte eyleme geçirilebilir bir ticaret planına dönüştürür. Sadece mumları renklendirmek yerine, arka planda canlı bir otomatik optimizasyon çalıştırır ve önünüzdeki sembol için en iyi Stop Loss, Take Profit ve sinyal eşiğini size sunar. Tek bir tıklama ile canlı ticarete uyarlanır - giriş, Stop Loss ve Take Profit ışınları grafikte tam fiyatlarla görünür ve uyarılar yön bil
Adaptive Price Action Engine Göstergeyi al, EA'sı (Uzman Danışman) bedava gelsin Kendi Kendini Optimize Eden Multi-Timeframe Trend ve Mum Formasyonu Analizi Piyasalar sürekli değişir ve her Price Action formasyonu her piyasa koşulunda aynı değere sahip değildir. Adaptive Price Action Engine , değişen piyasa koşullarına uyum sağlamak amacıyla trend yapısını, Multi-Timeframe analizini, mum formasyonlarını ve istatistiksel optimizasyonu tek bir analiz sistemi içerisinde birleştirir. İki Adaptif Mod
Currency Strength Wizard , başarılı ticaret için size hepsi bir arada çözüm sağlayan çok güçlü bir göstergedir. Gösterge, birden çok zaman dilimindeki tüm para birimlerinin verilerini kullanarak şu veya bu forex çiftinin gücünü hesaplar. Bu veriler, şu veya bu para biriminin gücünü görmek için kullanabileceğiniz, kullanımı kolay para birimi endeksi ve para birimi güç hatları biçiminde temsil edilir. İhtiyacınız olan tek şey, işlem yapmak istediğiniz tabloya göstergeyi eklemektir ve gösterge size
M1 Quantum MT5
Hamed Dehgani
4.2 (10)
M1 Quantum ile Canlı İşlem Sinyalleri : Sinyal   (İşlem otomatik olarak Quantum Trade Assistant tarafından gerçekleştirilmiştir ve bu ürüne ücretsiz olarak dahildir.) Son Haberler: Sürüm 1.64 yayınlandı. Artık tüm işlemlerde Stop Loss, ilgili Destek/Direnç bölgelerinin arkasına yerleştiriliyor. Bu sürümde EA'nın performansını artırmak için Smart Close fonksiyonu da geliştirildi. 9 Ağustos'tan bu yana canlı sinyal Sürüm 1.64 üzerinde çalışıyor. Fiyat Planı: Güncel Fiyat: $169 (Erken kullanıcı te
PZ Trend Trading MT5
PZ TRADING SLU
3.8 (5)
Capture every opportunity: your go-to indicator for profitable trend trading Trend Trading is an indicator designed to profit as much as possible from trends taking place in the market, by timing pullbacks and breakouts. It finds trading opportunities by analyzing what the price is doing during established trends. [ Installation Guide | Update Guide | Troubleshooting | FAQ | All Products ] Trade financial markets with confidence and efficiency Profit from established trends without getting whips
Scalper Vault , başarılı bir scalping için ihtiyacınız olan her şeyi size sağlayan profesyonel bir scalping sistemidir. Bu gösterge, forex ve ikili opsiyon tüccarları tarafından kullanılabilecek eksiksiz bir ticaret sistemidir. Önerilen zaman çerçevesi M5'tir. Sistem size trend yönünde doğru ok sinyalleri sağlar. Ayrıca size üst ve alt sinyaller ve Gann piyasa seviyeleri sağlar. Göstergeler, PUSH bildirimleri dahil her türlü uyarıyı sağlar. Göstergeyi satın aldıktan sonra lütfen benimle iletişim
Divergence Bomber
Ihor Otkydach
4.89 (94)
Bu göstergeyi satın alan herkese aşağıdaki ekstra içerikler ücretsiz olarak sunulmaktadır: Her işlemi otomatik olarak yöneten, Stop Loss ve Take Profit seviyelerini ayarlayan ve işlemleri strateji kurallarına göre kapatan özel yardımcı araç: "Bomber Utility" Göstergenin farklı varlıklar üzerinde kullanılmasına yönelik ayar dosyaları (set dosyaları) Bomber Utility için 3 farklı modda kullanım sunan ayar dosyaları: "Minimum Risk", "Dengeli Risk" ve "Bekle-Gör Stratejisi" Bu ticaret stratejisini
UZFX {SSS} Scalping Smart Signals v5.0 MT5, hızlı hareket eden piyasalarda doğru ve gerçek zamanlı sinyaller bekleyen scalperlar, günlük işlemciler ve swing işlemciler için tasarlanmış, yeniden çizilmeyen yüksek performanslı bir işlem göstergesidir. (UZFX-LABS) tarafından geliştirilen bu gösterge, fiyat hareketi analizi, trend teyidi ve akıllı filtrelemeyi bir araya getirerek tüm döviz çiftleri ve zaman dilimlerinde yüksek olasılıklı alım ve satım sinyalleri, Uyarı Sinyalleri ve Trend Devam Fırs
SkyHammer Signal Pro Entry, SL ve TP seviyeleri kilitlenen profesyonel no-repaint trend sinyal indikatörü SkyHammer Signal Pro, net, sabit ve doğrulanabilir sinyaller isteyen yatırımcılar için tasarlanmış yapılandırılmış bir trend ve momentum sinyal indikatörüdür. En iyi M1 ve M5 gibi düşük zaman dilimlerinde çalışır. İndikatör piyasanın tepe veya dip noktalarını tahmin etmeye çalışmaz. Bunun yerine sinyal üretmeden önce onaylanmış piyasa yapısı, trend yönü, momentum gücü, sağlıklı volatilite ve
The Oracle Pro
Ottaviano De Cicco
5 (1)
The Oracle Pro: Synthetic Multi-Timeframe Bias Engine for MT5 ️ Summer Launch Offer — Get The Oracle Pro for USD 199 (early buyers). Price rises with traction; final price USD 399. The Oracle Pro is a premium multi-timeframe bias engine for MetaTrader 5, built for demanding and professional traders. It answers one question with discipline: what is the directional bias on each timeframe right now, how strong is it, and how much do the timeframes agree? Everything is computed on closed bars only
Unlock hidden profits: accurate divergence trading for all markets Tricky to find and scarce in frequency, divergences are one of the most reliable trading scenarios. This indicator finds and scans for regular and hidden divergences automatically using your favourite oscillator. [ Installation Guide | Update Guide | Troubleshooting | FAQ | All Products  ] Easy to trade Finds regular and hidden divergences Supports many well known oscillators Implements trading signals based on breakouts Displays
Crystal Heikin Ashi Signals
Muhammad Jawad Shabir
5 (4)
Crystal Heikin Ashi Signals—Professional Trend & Signal Detection Indicator Advanced Heikin Ashi Visualization with Intelligent Signal System for Manual & Automated Trading Final Price: $149 ---------> Price goes up $10 after every 10 sales . Limited slots available — act fast . Overview User Guide PDF Crystal Heikin Ashi Signals is a professional-grade MetaTrader 5 indicator that combines pure Heikin Ashi candle visualization with an advanced momentum-shift detection system. Designed for both m
DayTrader PRO
Davit Beridze
5 (4)
DayTrader PRO DayTrader PRO, John Ehlers'in Laguerre filtresini güçlü bir otomatik optimizasyon motoruyla birleştiren gelişmiş bir alım satım indikatörüdür. Sabit parametreler kullanmak yerine, indikatör yakın piyasa koşullarına göre en iyi ayarları otomatik olarak arar ve sürekli manuel ayarlamalar yapmadan değişen piyasa volatilitesine uyum sağlamanıza yardımcı olur. İndikatör, net ALIM (BUY) ve SATIM (SELL) sinyallerinin yanı sıra mevcut piyasa volatilitesinden hesaplanan adaptif Stop Loss ve
Mahra Pro Indicator MT5
Mahra Said Mohammed Al Kaabi
Mahra Pro Indicator MT5 Overview Mahra Pro is a MetaTrader 5 chart indicator designed to support structured analysis of XAUUSD (Gold). It combines trend, momentum, volatility and price-structure conditions to identify potential buy and sell setups and display them directly on the chart. The indicator does not open, modify or close trades. All trading decisions and order execution remain under the user's control. Main features • Buy and sell signal arrows on the chart. • Fast and slow EMA lines w
Precision Spike Detector
Francisco Mandomo Simbine
5 (2)
Precision Spike Detector V3 – Institutional-Grade AI Trading System Attention: The price increases by US$50 for every 10 purchases.  Final price: US$599 Precision Spike Detector V3   is a   state-of-the-art, institutional-grade market analysis system   for   MetaTrader 5 , designed to detect   high-probability market movements   in synthetic indices such as   Boom, Crash, GainX, and PainX . After purchase, send me a private message to receive the optimized configuration files,  the installation
Volume Profile Multiple — Algoritmik Ticaret için Buffer Destekli Çoklu Hacim Profili Her zaman diliminde her seferinde Volume Profile'ı bloktan bloğa yeniden çizip yeniden hesaplamaktan yoruldunuz mu? Volume Profile Multiple , grafik üzerinde birbirini takip eden birden çok hacim profilini otomatik olarak çizer ve kurumsal ilginin sadece son görünür aralıkta değil, piyasanın her bölümünde gerçekte nerede yoğunlaştığını ortaya koyar. Bu gösterge sizin için ne yapar? Gösterge, fiyat geçmişini her
Quantum Direction , piyasa yönünü belirlemek, trend değişimlerinin erken aşamalarını tespit etmek ve filtrelenmiş giriş ve çıkış sinyalleri sağlamak için tasarlanmış profesyonel bir trend takip göstergesidir. Bu gösterge, MQL5 Market'te ücretsiz olarak sunulan profesyonel bir işlem yönetim aracı olan Quantum Trade Assistant 'ı içerir. Quantum Direction 'a doğrudan bağlanabilir ve geçerli bir sinyal oluştuğunda işlemleri otomatik olarak açabilir veya yapılandırılmış çıkış koşulları karşılandığınd
Gold Beaver Signals , profesyonel bir kırılma robotunun altın piyasasına nereden gireceğini — henüz gerçekleşmeden — doğrudan grafiğinizde gösterir. Canlı kanıt Bu bir vaat değil. Aynı stratejiler, istediğiniz an inceleyebileceğiniz gerçek ve herkese açık bir canlı sinyalde çalışıyor: https://www.mql5.com/en/signals/2375536 Ne yapar, basitçe Gösterge, altını bizim ticaret robotumuzla aynı şekilde izler. Fiyat önemli bir seviyenin altında baskı biriktirdiğinde grafiğinize bir kırılma çizgisi çize
Gartley Hunter Multi
Siarhei Vashchylka
5 (12)
Gartley Hunter Multi - An indicator for searching for harmonic patterns simultaneously on dozens of trading instruments and on all possible timeframes. Manual (Be sure to read before purchasing) | Version for MT4 Advantages 1. Patterns: Gartley, Butterfly, Shark, Crab. Bat, Alternate Bat, Deep Crab, Cypher 2. Simultaneous search for patterns on dozens of trading instruments and on all possible timeframes 3. Search for patterns of all possible sizes. From the smallest to the largest 4. All fou
Yazarın diğer ürünleri
Gösterge, en olası trend durdurma/geri dönüş alanlarını, kendinden emin trend hareket alanlarını hesaplar. Hesaplama şunları dikkate alır: fiyat değişim oranı; grafiğin göreli sapma açısı; fiyat hareketlerinin ortalama genliği; "konfor bölgesini" terk eden fiyat; ATR göstergesinin değerleri. Gösterge, fiyat bir durdurma/geri dönüş alanına girdiğinde bir Uyarı oluşturabilir. Ayarlar Tüm uzunluğu çiz? - grafiğin sonuna kadar alanları çizin; YUKARI trendi durdur - bir yükseliş trendinin durma/ge
Indicator for determining flat and trend. If the price is below any of the two histograms and two lines (red and blue), this is a sell zone. When purchasing this version of the indicator, MT5 version for one real and one demo account - as a gift (to receive, write me a private message)! If the price is above any of the two histograms and two lines (red and blue), this is a buy zone. MT5 version:  https://www.mql5.com/en/market/product/70409 If the price is between two lines or in the zone of
SuperTrend
Evgeniy Zhdan
2.5 (2)
The Supertrend Expert Advisor The Supertrend Expert Advisor with averaging elements. It has been developed during three months until I finally got good results. It is not a scalper. The minimum balance to start trading - 100 $. Is automatically adjusted to the 4 and 5-digit prices. Has an efficient risk management system. The lot and limit on the maximum lot is automatically calculated based on the settings specified in the EA. As a result, you have a complete automated trading system. Download
Stardust
Evgeniy Zhdan
StarDust searches for divergences in the values of several indicators considering them as signs of flat and enters the market if a relatively steady trend is detected. The Expert Advisor trades "basic" symbols with a low spread. The best results are achieved on М15. The EA automatically adjusts to 4 and 5-digit quote flows. Settings Comment_to_orders – comment to a placed order. The field can be left blank if no comment is required. MM – enable money management with automatic setting of a worki
Top Floor
Evgeniy Zhdan
The EA catches the price when it moves against the trend in an effort to open an order in an opposite direction (direction of the main trend). Screenshots illustrate examples of entries and the strategy gist. The EA uses stop losses depending on values of ATR. Settings: Lot_ - if Risk_ = 0, the EA will trade this lot; Risk_ - risk per one trade. Stop loss is taken into account; koeff_ATR - coefficient multiplied by the ATR value to calculate stop loss (the bigger the value, the bigger stop loss
FastBoom
Evgeniy Zhdan
The FastBoom EA finds the most probable points of price pullback/reverse and places an order. It places averaging orders if the price moves further against take profit. Settings of the EA: Lots - initial lot; LotExponent - multiplier for following orders (Martingale). 1 - no multiplier. TakeProfit - take profit in points; Stochastic Settings InpKPeriod - K Period of Stochastic InpDPeriod - D Period of Stochastic InpSlowing - Stochastic Slowing LevHigh - level for sell positions of Stochastic L
The Expert Advisor calculates the double/triple divergence of volumes, and starts trading. It uses a unique formula of lot calculation, which greatly improves stability of trading. Recommended TF - 1h. Currency pair - EURUSD , but the EA can be used on any trading instruments which are not subject to high volatility. Settings mode - trading direction can be set manually; close - order close level (details on the screenshot); Step between orders - step between orders in points; Maximum orders -
OrderOnLine
Evgeniy Zhdan
The Expert Advisor opens orders from the horizontal line, the a trader can set on any level by dragging using the mouse or by changing the line properties. For example, when a horizontal line is above the current price, the EA will open a Buy order once the horizontal line is reached. And vice versa: If the line is below the current price, the EA will open a sell order once the line is crossed. A buy crossover of the line is: opening of the current candlestick below the horizontal line; the curr
SellerATR
Evgeniy Zhdan
5 (1)
The Expert Advisor only sells. Recommended currency pairs : EURUSD; GBPUSD; USDCHF; USDJPY; USDCAD; AUDUSD; EURGBP; EURAUD; EURCHF; EURJPY; GBPCHF; CADJPY; GBPJPY; AUDNZD; AUDCAD; AUDCHF; AUDJPY; CHFJPY; EURNZD; EURCAD; CADCHF; NZDJPY; NZDUSD. Timeframe: H1. Percent% manages closing both loss-making and profitable deals based on the account overall status. Using the EA on 23 symbols mentioned above allows the robot to cope with the drawdown in case of a long trend. While positions on some pairs
Illusion
Evgeniy Zhdan
3 (2)
The Illusion EA uses the probability theory - after a series of consecutive virtual losses - i.e. right during a flat the EA already starts trading in the trend. In addition, the EA considers the ratio of bullish/bearish candles on the higher timeframes to determine the greatest probability of the price movement direction. Only 1 order can be opened at a time. In case of a loss the following order will be placed with an increased lot (the multiplication coefficient is set in the parameters). The
The indicator plots a trend line and determines the levels for opening trades, in case the price goes "too far" away from the trend level. More detailed information is available in the screenshots. Settings Away from the trend line - distance from the trend line to the trades level; Arrow Signal for deals - enable displaying an arrow when the price reaches the trades level; Size of Arrow - size of the arrow; Alert Signal for deals - enable generating alerts when the price reaches the trades lev
Turbina
Evgeniy Zhdan
5 (4)
The axiom of the Forex market is that any trend will be broken. The Expert Advisor determines trend direction (the pink line), and calculates levels for opening opposite orders depending on the settings. The value of Away from the trend line for Deal will be different for each pair and timeframe, depending on the volatility of the trading instrument. Next orders can be opened with an increased lot (a static lot is used by default). See the screenshots to understand the idea of the Expert Advisor
Odysseus
Evgeniy Zhdan
The Expert Advisor determines the moments of strong movements and opens a position in the direction of the most probable price movement. The strategy always uses stop loss and take profit. Several independent orders can be in the market (the maximum number is set in parameters). The goal of the EA's underlying trading system is the quantitative excess of the number of profitable deals over the number of losing ones. Recommended: EURUSD 5m; GBPUSD 5m; USDJPY 5m. The Expert Advisor is able to work
Vise
Evgeniy Zhdan
Vise is a trend indicator. The upper and lower lines follow the price showing the prevailing price direction. Frequent breakthroughs of the upper line indicate a bullish trend, while frequent breakthroughs of the lower line indicate a bearish one. Parameters Points for UpLine - initial number of points for the upper line; Points for DownLine - initial number of points for the lower line. During the breakthrough of the upper level (line), this level shifts upwards by Points for UpLine. If the up
Twinkle
Evgeniy Zhdan
Twinkle is a trend-based scalper using stop loss and take profit invisible to the broker. The EA does not look for trend reversals. The EA catches strong market movements and opens orders in the direction of the trend. Your broker will not see the order closing levels. The EA closes orders independently when reaching the take profit or stop loss levels specified in the settings. Recommended trading symbols: EURUSD M5, GBPUSD M5. ECN accounts with 5 digits quotes are recommended. Expert Advisor
Shine
Evgeniy Zhdan
4.75 (4)
This Expert Advisor implements elements of the Martingale system. Orders are opened at a specified distance from the moving average. The Parabolic SAR indicator and certain technical details are used to ensure the most accurate entries. The EA is highly customizable. It is recommended for simultaneous use on 4 currency pairs: EURUSD M15; GBPUSD M15; USDJPY M15; USDCAD M15. Despite good stability, it is advisable to disable the EA operation during the days rich in news releases. Configurations P
LuckyCase
Evgeniy Zhdan
LuckyCase is an Expert Advisor with martingale elements. The EA strategy is based on a significant "deviation" of the price from SAR inadicator and the Bands levels breakthrough point. The money management system is an essential part of the EA. It starts working after a trade is opened. Trades are closed after accumulating specified points of market orders, by deposit % or after an opposite side of the channel is broken through. The default EA settings are meant for: EURUSD M15; USDJPY M15. The
Elize
Evgeniy Zhdan
The Elize Expert Advisor has been designed to work with the EURCHF currency pair. It considers the peculiarities of this trading instrument, its behavior and dependence on the behavior of other currencies. In particular, when the currencies of the European countries (EURUSD, GBPUSD, EURNOK, EURCHF) move in the same direction, the EA starts its operation and opens a deal in the trend direction of the European currencies. In the event of price rollbacks, the EA uses a unique method for making the
AllTrendLines
Evgeniy Zhdan
4 (1)
Brief Description of the All Trend Lines Indicator The indicator analyzes the wave structure of the market. What it displays on the chart: First. Wave pivots (semaphores) • Red markers – wave highs • Yellow markers – wave lows • Yellow-green markers – additional local extremes Second. Trend lines • Purple/blue lines – trends based on highs (resistance/support) • Beige/green lines – trends based on lows • Lines are built automatically by connecting wave pivots of the same type Third. Main trend
FastTraffic
Evgeniy Zhdan
The Expert Advisor has been specifically developed for trading gold (Spot Gold). The strategy is based on Fibo levels calculated from the previous (first) candle High/Low and the width of the current and lower timeframes channel. If important Fibo levels of different orders are located in a single price channel (within a spread), the EA defines this channel as the target for price movement and starts operation. Martingale and averaging are not used. Each order is independent and is accompanied b
Jazz
Evgeniy Zhdan
The algorithm of this Expert Advisor determines the significant price levels, where the trend often turns into a flat or reverses. Stochastic Oscillator serves as an additional filter of overbought/oversold zones. The EA sets stop loss and take profit after opening an order. The underlying trailing strategy applies a trailing stop. The EA is recommended for simultaneously use on three trading instruments: EURUSD M5, GBPUSD M5, EURCHF M5. Settings: Comment to order - comment to orders. MaxRisk -
Panther
Evgeniy Zhdan
The Expert Advisor looks for technical analysis patterns formed on the higher (hourly) timeframe to start working on the 5-minute chart. Technical analysis patterns used: double top/double bottom, head/shoulders, flag, expanding/narrowing triangles. The Relative Vigor Index technical indicator is used as the filter for opening deals. It is based on the idea that on the bull market the closing price is, as a rule, higher, than the opening price. It is the other way round on the bear market. This
Spook
Evgeniy Zhdan
The Expert Advisor calculates the divergence on the current and higher timeframes. In case the divergences coincide, the EA starts its operation. Deals have strict take profit and stop loss levels. Each deal is managed by trailing stop. The strategy involves the use of a tight stop-loss. Therefore, losing deals and/or series of losing deals are not uncommon. This EA is not suitable for those who have difficulties coping with losing deals. The EA is recommended for simultaneous use on the followi
Grand
Evgeniy Zhdan
The Expert Advisor has been developed specifically for the features of the CHFJPY currency pair. The EA's algorithm determines the direction of the current trend and starts operation. In case of a price reversal within the current trend, the EA adds additional orders. If trend changes, the EA starts to work in the direction contrary to the initial grid of orders. If there were no conditions for closing orders and the trend direction changed again, the EA continues to work with the "first" grid o
Intensive
Evgeniy Zhdan
The Expert Advisor algorithm determines on daily charts those candlestick patterns, which set the intraday trading direction. The trading EA determines how long the price is moving in overbought/oversold zones and starts working in the direction of the expected trend movement. Each position is accompanied with a tight stop loss and take profit. Only one active position can be open in the market. The EA was developed and tested using 99% quality quotes. The Expert Advisor has a built-in news filt
Slender
Evgeniy Zhdan
The strategy of this Expert Advisor is based on a hedging system, which implies placing opposite orders. The EA algorithm determines trend beginning and opens a position in the trend direction. In case of a wrong entry, the EA tries to neutralize the drawdown through opposite (hedging) orders at a preset interval (Coefficient of counter orders). Orders are closed when one of the two values ​​is reached - profit in percent or profit in points. The EA does not use lot increase. The EA wast tested
Dreamer
Evgeniy Zhdan
Советник работает по принципу хеджирования с периодическими "перекосами" в сторону трендовых направлений. Направления тренда советник определяет на основании стандартного индикатора Parabolic Stop and Reverse system (SAR). Уникальная стратегия установки балансирующих позиций позволяет избегать больших просадок даже при самых не благоприятных рыночных условиях. Параметры по умолчанию рекомендуется использовать на торговом инструменте: GBPJPY 15m. Разработка и оптимизация параметров производились
Snoot
Evgeniy Zhdan
5 (1)
This Expert Advisor works using a grid in the direction of a trend movement with the step between opened positions defined in the settings. The positions are closed by the total take profit. The Parabolic SAR standard indicator is used to filter order opening, which comes in the MetaTrader 4 package. The EA has been developed and tested using 99,9% quality of quotes. Operation of the EA in real time can be viewed in the signals . The best trading results have been achieved on CHFJPY M15. Settin
Solipsism
Evgeniy Zhdan
The Expert Advisor builds channels based on the data obtained using ATR and MA indicators according to the equations: Upper channel border = MA + ATR * (FIBO); Lower channel border = MA - ATR * (FIBO), where FIBO has the following values: Style of Trade - Aggressive = 1.61852; Style of Trade - Average = 3.26704; Style of Trade - Calm = 4.85556. Trades are opened inside the channel with the intervals defined in the settings. Long and short positions are opened independently. Positions are closed
The trading statistics indicator notifies the trader of the aggregate income of the trading account for different time intervals. The indicator has wide display settings on the graph. There is a choice of one of the two display languages on the chart- English and Russian. Settings Indicator language (ENG, RUS) - Select the language to display on the chart; To control the magic (-1: any magic) - Entering the Magic for control (-1: any Magic); Angle of indicator tie - Selecting the angle of the c
Filtrele:
Değerlendirme yok
Değerlendirmeye yanıt