WaveMarkers

Wave Markers : carte des vagues adaptative avec tableau de bord multi-unités de temps

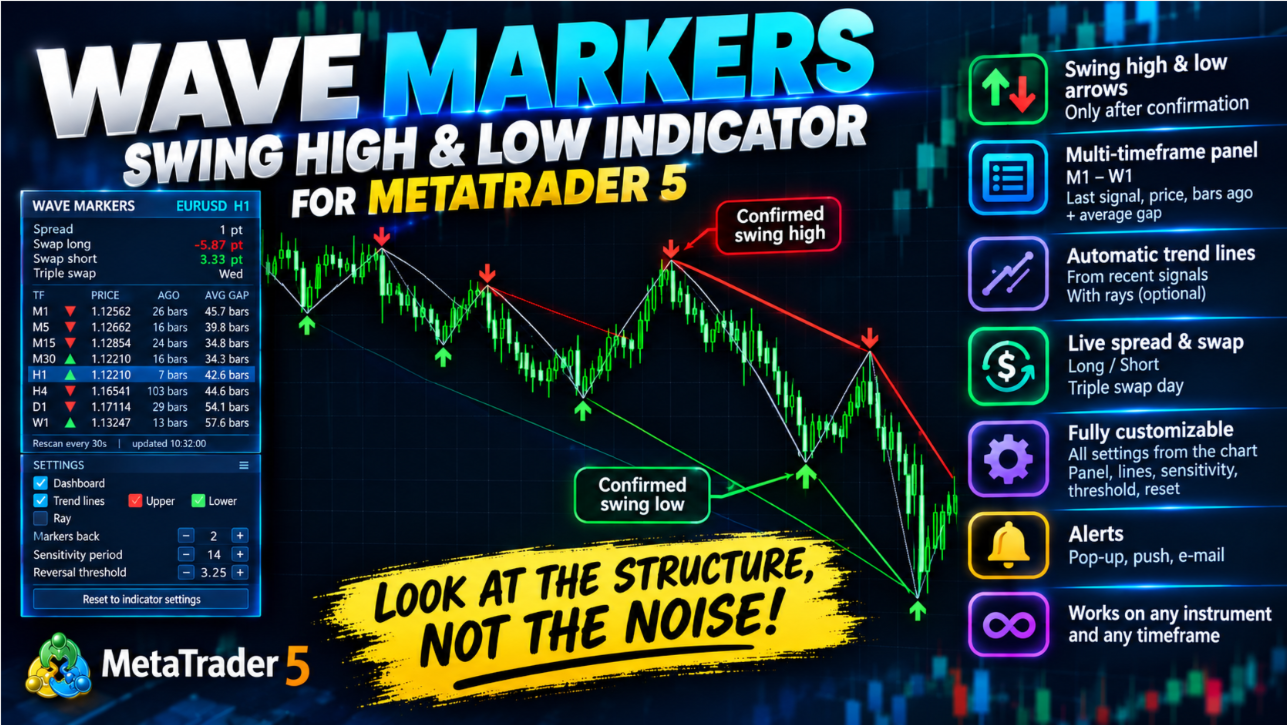
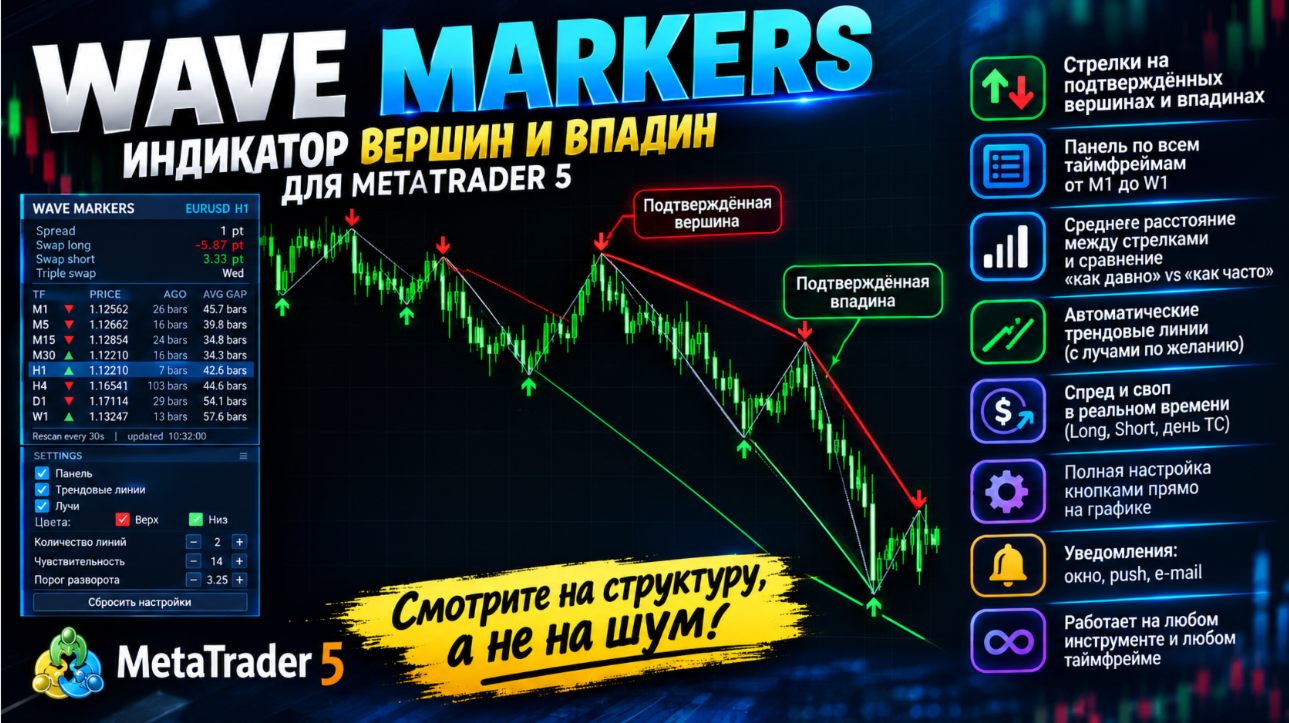
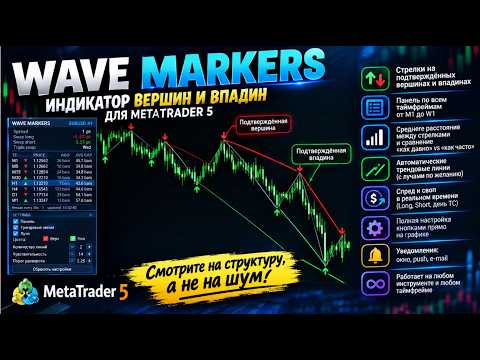
Voyez la vraie structure du marché, et non le bruit : plus hauts et plus bas de swing confirmés, lignes de tendance qui passent par eux, et la situation de toutes les unités de temps, de M1 à W1, dans un seul panneau.

De quoi s'agit-il ?

Wave Markers est un indicateur de structure graphique pour MetaTrader 5. Il repère les points de retournement du prix (plus hauts et plus bas de swing), les marque par des flèches nettes et construit autour d'eux des outils de travail : lignes de tendance, tableau de toutes les unités de temps, ainsi que le spread et le swap en temps réel.

Il ne donne aucun ordre d'« achat » ou de « vente » et ne promet aucun résultat. Il fait une seule chose, et il la fait avec soin : vous montrer où le marché s'est réellement retourné, afin que vous lisiez la structure plus vite et de façon plus cohérente.

Pourquoi ce n'est pas un ZigZag de plus

Un ZigZag classique utilise une distance fixe (points ou pourcentage) pour décider de ce qui compte comme un retournement. Ce chiffre unique est presque toujours inadapté : trop grand sur un marché calme (on manque de vraies vagues), trop petit sur un marché rapide (on récolte du bruit).

Wave Markers fonctionne autrement :

  • Le seuil de retournement s'adapte à la volatilité actuelle. Il se mesure en multiples du mouvement typique du marché lui-même : il s'élargit quand le marché s'emballe et se resserre quand il se calme. Un même réglage se comporte de façon sensée sur les paires majeures, l'or, les indices et les cryptomonnaies, ainsi que sur différentes unités de temps.
  • Un marqueur n'apparaît qu'une fois le retournement confirmé. Le prix doit réellement s'éloigner de l'extrême de la valeur du seuil. Il n'y a ni anticipation du futur, ni devinette d'un sommet pendant que la bougie est encore en cours.
  • Le délai de confirmation est honnête et prévisible. Il est défini par le seuil que vous choisissez : un seuil plus élevé donne moins de vagues, plus importantes et confirmées plus tard ; un seuil plus bas donne des marqueurs plus fréquents et plus rapides.
  • La logique est identique sur chaque unité de temps, de sorte que le tableau de bord compare des choses comparables.

Principaux atouts

  • Des marqueurs nets et lisibles : une flèche vers le bas sur chaque plus haut de swing confirmé, une flèche vers le haut sur chaque plus bas
  • Un seuil adaptatif à la volatilité plutôt qu'un chiffre fixe
  • Des lignes de tendance automatiques par les derniers marqueurs, avec demi-droites en option
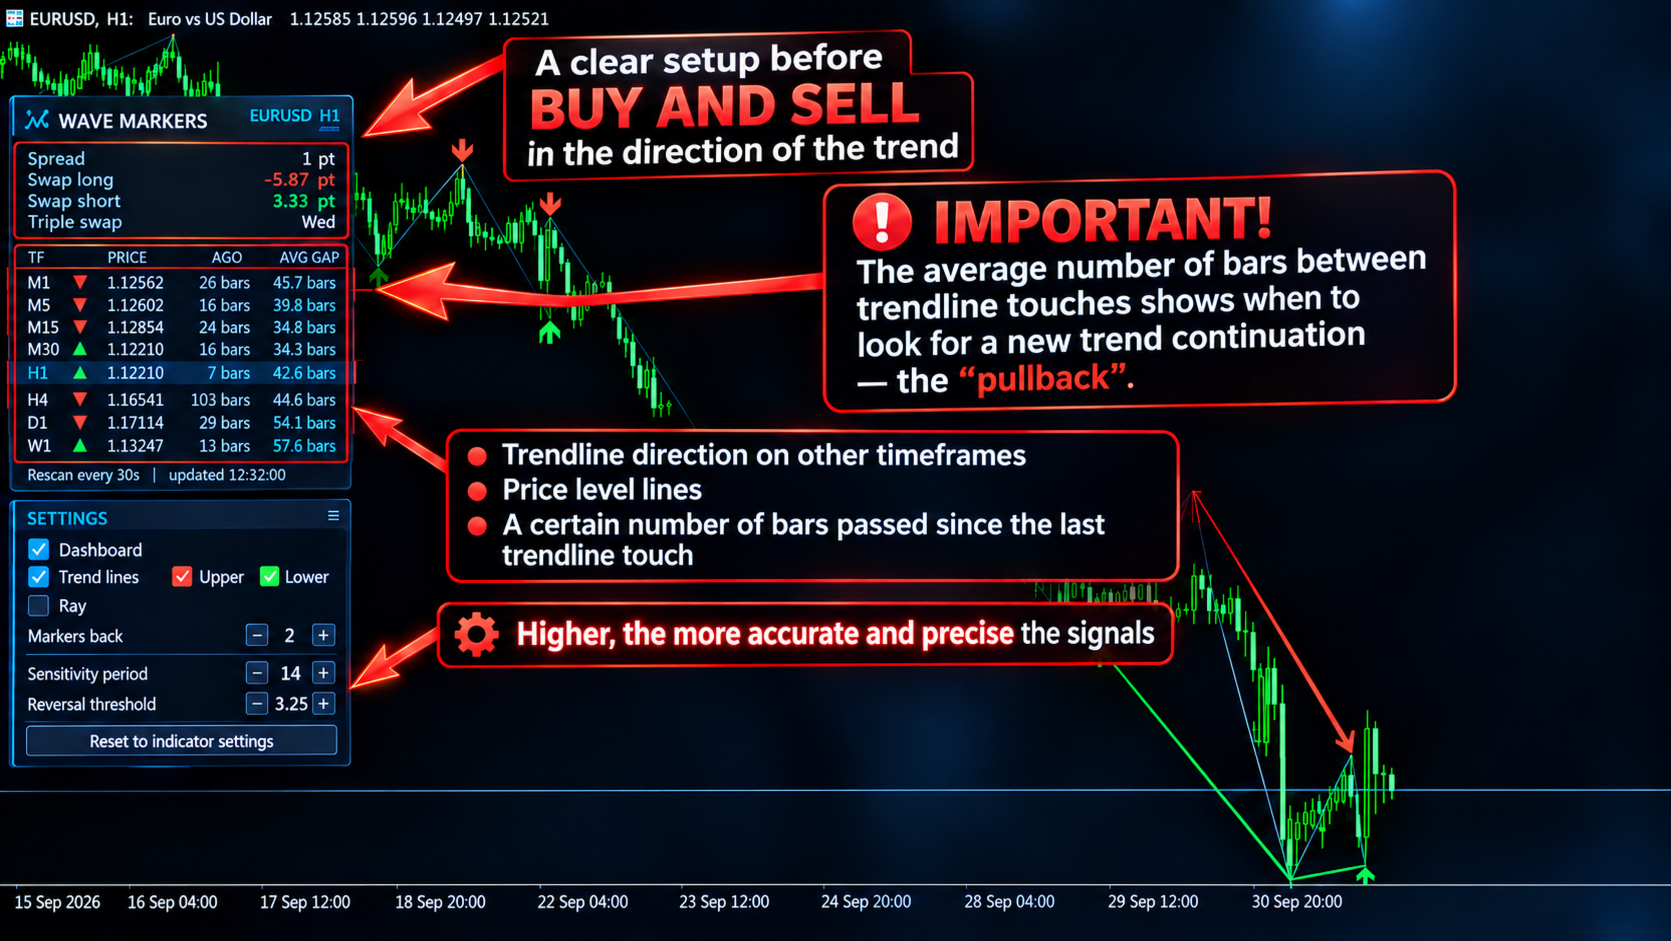
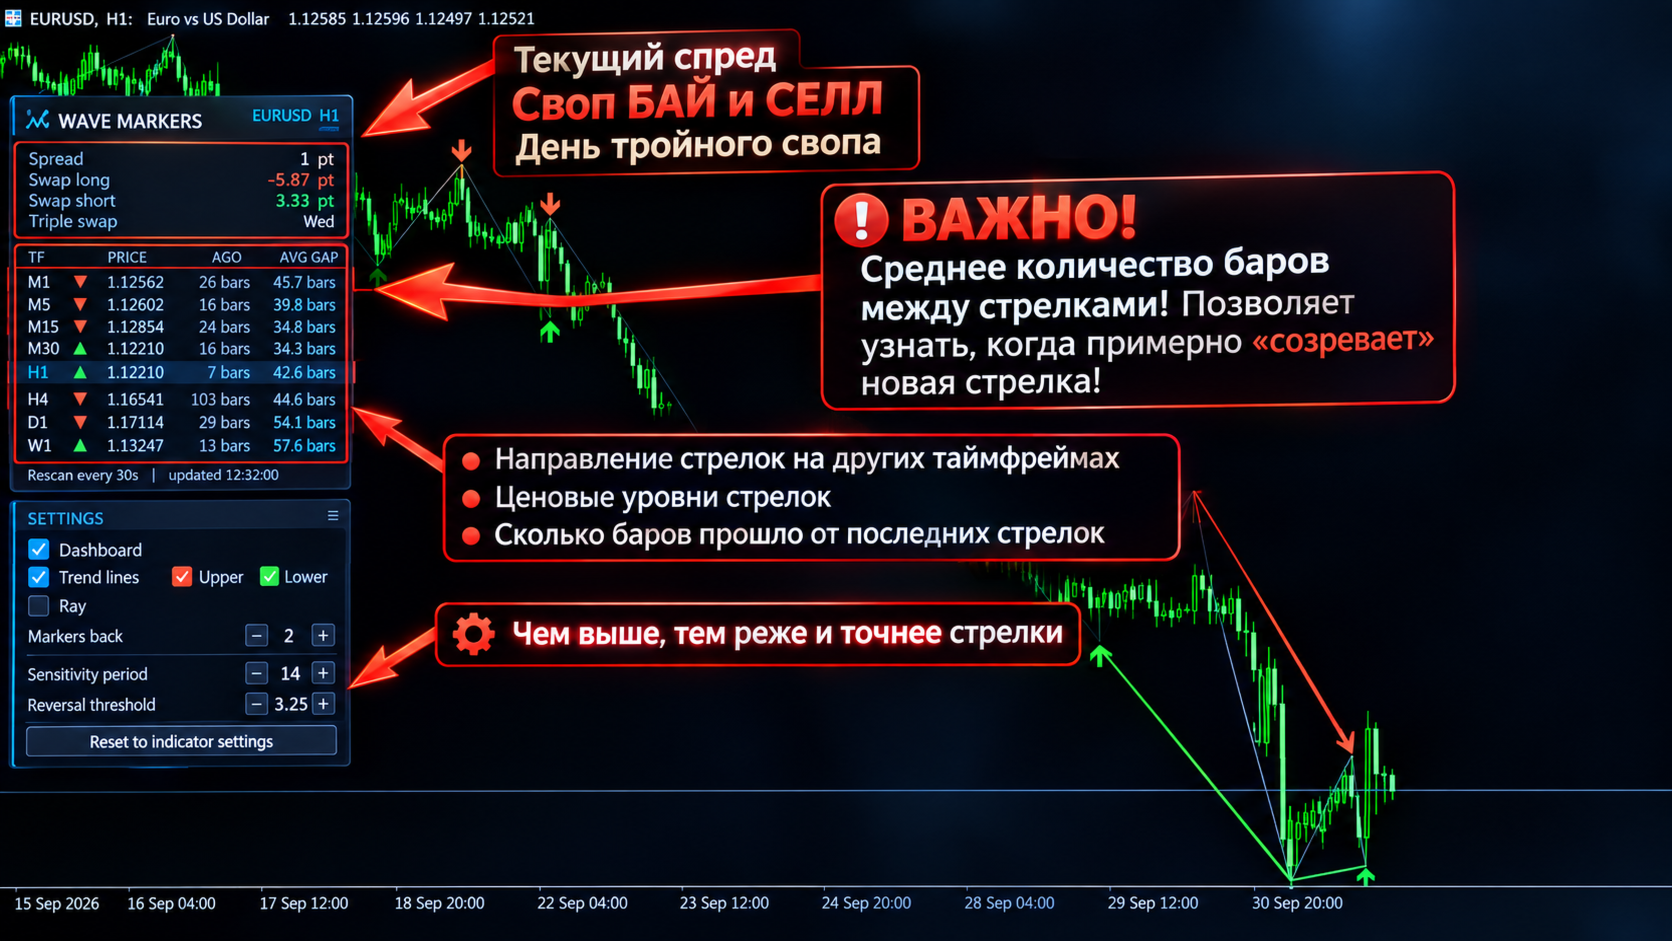
  • Un tableau de bord pour toutes les unités de temps de M1 à W1 : direction du dernier marqueur, son prix, il y a combien de bougies il est apparu, et l'écart moyen entre les marqueurs de même direction
  • Le spread et le swap (long, court et jour du triple swap) en temps réel dans le même panneau
  • L'historique manquant sur les autres unités de temps est demandé et chargé automatiquement
  • Léger pour le terminal : les marqueurs du graphique sont recalculés une fois par nouvelle bougie, et les autres unités de temps par minuterie, et non à chaque tick
  • Tout se pilote directement sur le graphique, sans ouvrir la fenêtre des paramètres
  • Alertes par fenêtre contextuelle, notifications push et e-mail à chaque nouveau marqueur
  • Fonctionne sur tout instrument et sur toute unité de temps

Ce que vous voyez sur le graphique

Marqueurs et ligne de vagues. Des flèches sur les plus hauts et plus bas de swing confirmés, éventuellement reliées par un trait fin pour que les vagues se lisent d'un coup d'œil.

Lignes de tendance. L'indicateur trace des lignes par les derniers plus hauts de swing et, séparément, par les derniers plus bas. Vous choisissez le nombre de segments à dessiner : avec 1, une ligne par les deux derniers marqueurs de ce type ; avec 2, les trois derniers marqueurs reliés par deux lignes, et ainsi de suite. Les lignes peuvent être prolongées vers la droite sous forme de demi-droites, ou rester des segments qui commencent et se terminent exactement sur le plus haut ou le plus bas de la bougie.

Tableau de bord multi-unités de temps. Une ligne par unité de temps, de M1 à W1 :

  • la direction du dernier marqueur (▼ plus haut, ▲ plus bas)
  • son prix
  • il y a combien de bougies il est apparu
  • le nombre moyen de bougies entre les marqueurs de cette direction sur tout l'historique analysé

Comparer « il y a combien de temps » avec « à quelle fréquence cela arrive d'habitude » permet de sentir rapidement à quel stade de son rythme se trouve une unité de temps.

Spread et swap. Le spread actuel se met à jour à chaque tick et peut être mis en évidence lorsqu'il dépasse le niveau que vous avez défini. Le swap long, le swap court et le jour du triple swap s'affichent avec les unités adaptées à l'instrument.

Panneau de commande sur le graphique

Sous le panneau principal se trouve une carte de réglages compacte. Elle vous permet de :

  • masquer ou afficher le panneau principal pour voir la partie du graphique qu'il recouvre
  • activer ou désactiver les lignes de tendance, séparément pour les supérieures et les inférieures
  • activer ou désactiver les demi-droites
  • modifier le nombre de lignes avec les boutons « − » et « + »
  • modifier la période de sensibilité et le seuil de retournement avec « − » et « + » et voir le résultat immédiatement
  • tout remettre aux valeurs de l'indicateur en un clic
  • faire glisser tout le panneau n'importe où sur le graphique par sa barre de titre

Les valeurs de la fenêtre des paramètres sont le point de départ. Ensuite, ce que vous choisissez sur le graphique prend le relais. Un changement d'unité de temps conserve vos choix, et le bouton de réinitialisation rétablit les valeurs d'origine.

Comment les traders peuvent l'utiliser

  • Lire la structure du marché : plus hauts et plus bas croissants ou décroissants, et les endroits où la structure se rompt
  • Obtenir automatiquement des niveaux de swing et des lignes de tendance pertinents au lieu de les tracer à la main
  • Évaluer plusieurs unités de temps d'un coup d'œil avant de prendre une décision
  • Comparer le rythme des marqueurs d'une unité de temps à l'autre
  • Surveiller le coût du spread et du swap sans quitter le graphique

Wave Markers est un outil d'analyse. Il ne garantit aucun résultat de trading, et chaque décision reste la vôtre. Testez toujours un réglage d'abord sur un compte démo.

Bon à savoir

  • Comme un marqueur n'est confirmé qu'après le retournement du prix, il apparaît toujours avec un délai. C'est voulu, et l'ampleur du délai se règle avec le seuil de retournement.
  • Les autres unités de temps sont chargées depuis l'historique de votre courtier. Si une unité de temps affiche « loading... », le terminal est encore en train de construire ses bougies.
  • Pour les alertes par e-mail, la messagerie doit être configurée dans le terminal (Outils → Options → E-mail).

Paramètres

Wave Markers

  • Wave markers: sensitivity period : sur combien de bougies on mesure le mouvement typique du marché. Les valeurs courtes réagissent plus vite aux variations de volatilité, les valeurs longues sont plus stables. 14 est un bon point de départ.
  • Wave markers: reversal threshold, x sensitivity : de combien le prix doit s'éloigner d'un extrême, en multiples du mouvement typique, pour qu'un marqueur soit confirmé. Plus élevé : moins de vagues, plus importantes et confirmées plus tard. Plus bas : plus de marqueurs, plus tôt, mais avec davantage de bruit.
  • Analysis depth, bars (per timeframe) : combien de bougies en arrière l'indicateur analyse sur chaque unité de temps. Plus la profondeur est grande, plus il y a d'historique sur le graphique et dans les statistiques du panneau.

Chart Display

  • Show wave markers on chart : active ou désactive les flèches.
  • Connect wave markers with a line : relie les marqueurs consécutifs par un trait fin pour que les vagues soient faciles à suivre.
  • Swing high marker color : couleur des flèches sur les plus hauts de swing.
  • Swing low marker color : couleur des flèches sur les plus bas de swing.
  • Connecting line color : couleur de la ligne qui relie les marqueurs.
  • Marker size (1-5) : taille des flèches.
  • Connecting line width (1-5) : épaisseur de la ligne qui relie les marqueurs.

Dashboard

  • Show info panel on chart : affiche le tableau de bord et la carte de commande sur le graphique. Si l'option est désactivée, l'indicateur ne fonctionne qu'avec les valeurs de cette fenêtre de paramètres.
  • Panel offset X, px : position horizontale initiale du panneau. Vous pourrez ensuite le déplacer à la souris.
  • Panel offset Y, px : position verticale initiale du panneau.
  • Other timeframes re-check interval, sec : à quelle fréquence les autres unités de temps sont revérifiées. Le graphique actuel se met à jour à chaque nouvelle bougie ; ce paramètre ne concerne que le tableau (minimum 5 secondes).
  • Spread highlight level, points (0 = off) : la valeur du spread devient orange lorsqu'elle dépasse ce niveau. 0 désactive la mise en évidence.

Alerts (current timeframe)

  • Popup alert on new wave marker : affiche une fenêtre d'alerte du terminal lorsqu'un nouveau marqueur est confirmé.
  • Push notification on new wave marker : envoie une notification sur votre téléphone (nécessite le MetaQuotes ID dans les paramètres du terminal).
  • E-mail notification on new wave marker : envoie un e-mail (nécessite la configuration de la messagerie dans le terminal).

Trend Lines (through wave markers)

  • Draw trend lines through wave markers : interrupteur général de toutes les lignes de tendance.
  • Lines through upper markers (highs) : trace des lignes par les plus hauts de swing.
  • Lines through lower markers (lows) : trace des lignes par les plus bas de swing.
  • Number of lines per side (markers back, 1-50) : combien de segments tracer de chaque côté. Avec 1, une ligne par les deux derniers marqueurs ; avec 2, les trois derniers marqueurs reliés par deux lignes, et ainsi de suite.
  • Extend all lines to the right (ray) : prolonge chaque ligne vers la droite jusqu'au bord du graphique. Si l'option est désactivée, chaque ligne commence et se termine sur ses marqueurs.
  • Upper line color : couleur des lignes passant par les plus hauts de swing.
  • Lower line color : couleur des lignes passant par les plus bas de swing.
  • Line style : continu, tirets, pointillés, etc.
  • Line width (1-5, solid style only) : épaisseur des lignes. MetaTrader n'applique les épaisseurs supérieures à 1 qu'aux lignes continues.
  • Draw lines behind the chart : dessine les lignes sous les bougies plutôt qu'au-dessus.
Produits recommandés
The indicator plots flexible support and resistance levels (dots). A special phase of movement is used for construction. Levels are formed dynamically, that is, each new candle can continue the level or complete it. The level can provide resistance or support to the price even where it is no longer there. Also, support and resistance levels can change roles. The importance of levels is affected by: the amount of time the level is formed and the number of touches. The significance of these lev
In the context of trading, Malaysia SNR (Support and Resistance) refers to the technical analysis of support and resistance levels in financial markets, particularly for stocks, indices, or other assets traded. This is single timeframe version. Multiple timeframe version is avaiable here . There are three type of Malaysia SNR level Classic , GAP and Flipped 1. Classic Support is the price level at which an asset tends to stop falling and may start to rebound. It acts as a "floor" where demand is
MetaHelper
Volodymyr Tseibei
This indicator automatically calculates and displays classic pivot points on your chart, helping identify key support and resistance levels for the current trading session. Features: · Plots Pivot (PP), Resistance 1-2 (R1, R2), and Support 1-2 (S1, S2) levels · Includes current close price line for reference · Color-coded lines: Blue for pivot, Red for resistances, Green for supports · Automatic calculation based on previous day's high, low, and close · Continuous lines across the chart for e
BTFX Pivot Points
Bradley Thomas Farrington
The BTFX Pivot Points is an indicator which calculates the Support and Resistance levels for each day. By using this indicator the pivot levels point out clear targets to aim for. The resistance levels are shown in purple above the silver pivot line. The support levels are shown in Orange and can be found below the silver pivot line. This indicators works very well when used with The BTFX Daybreak Indicator. For a more in depth explanation of these indicators please watch the Youtube video attac
Veltrion Smart Fibonacci   is a clean automatic Fibonacci structure overlay for MetaTrader 5. It automatically detects recent swing highs and swing lows, then draws key Fibonacci retracement levels directly on the chart. The indicator is designed to help traders visualize market structure, retracement zones, and the golden zone without manually drawing Fibonacci tools. Key Features Automatic swing high and swing low detection Clean Fibonacci retracement overlay Horizontal Fibonacci levels for a
Structure Levels (Highs & Lows) Indicator for MetaTrader 5 Decode Market DNA — Trade with Institutional Precision Description: The Structure Levels (Highs & Lows) Indicator is your secret weapon to map the market’s hidden roadmap. Designed for traders who think in terms of price action and market structure, this tool automatically identifies critical swing highs and swing lows, transforming chaotic charts into a clear blueprint of support/resistance zones, breakout opportunities, and trend rev
Fair Value Gap (FVG) & Inversion Fair Value Gap (iFVG) – TradingLabs ID Dans la méthodologie ICT (Inner Circle Trader) et Smart Money Concepts (SMC), un Fair Value Gap (FVG) – également connu sous le nom de déséquilibre (imbalance) – se produit lorsque le prix évolue avec une dynamique extrême, laissant derrière lui un vide de liquidité. Ces écarts non comblés agissent comme des aimants pour l'action future des prix, ce qui en fait les zones de retracement et d'entrée à plus forte probabilité po
这是一个基于前一个交易日的最高价、最低价和收盘价来计算的枢轴点指标,具体公式如下: 计算前一日的 Pivot Point (枢轴点): Pivot = (High + Low + Close) / 3 计算 Resistance 1 (R1) 、 Support 1 (S1) ​ 等: R1 = (2 * Pivot) - Low S1 = (2 * Pivot) - High R2 = Pivot + (High - Low) S2 = Pivot - (High - Low) 与市面上其他的枢轴点指标相比,该指标主要有以下4个特点: 1、可以修改交易日的开始时间; 2、可以设定支撑压力线的颜色; 3、可以设定是否显示各个支撑压力线对应的价格; 4、可以设定天数用以显示枢轴点的历史记录; 开发这个指标的最初目的是为了解决设定交易日开始时间的问题,接下来会进一步说明。基于计算公式,我们需要获得上一个交易日的最高价、最低价和收盘价,在夏令时,北京时间6点是开市时间,大多数交易平台服务器的0点对应的是北京时间的6点,但是香港的服务器6点才是对应的是北京时间的6点。如果你有多个平台,且存在
Support Resistance Break Zones PRO was built for a common problem I often see when trading XAUUSD and other fast-moving symbols: support and resistance levels are visible, but the chart becomes difficult to read when breakouts, retests and false breaks happen around the same area. Current price: $79 - increases by $10 after every 20 purchases until reaching the final price of $129 . Next price: $89 . Complete Buyer Kit: 42 Professional Resources included at no additional cost. MT5 Presets, PDF
Multichart V and H Line Sync Overview Multichart V and H Line Sync is the essential tool for multi-timeframe traders. It instantly synchronizes your Horizontal Support/Resistance Lines and Vertical Time Lines across all open charts of the same symbol. Stop drawing the same levels on M5, H1, and D1 charts manually. With this tool, draw a line once, and it automatically replicates on every other timeframe. Perfect for keeping your technical analysis consistent and your workspace clean. Key Feature
FREE
ZigZag Market Structure Breakout Pro ZigZag Extras Display BreakOut points is a MetaTrader 5 indicator for traders who use ZigZag, breakout points, market structure, BOS, CHoCH, swing high, swing low, support and resistance, and higher timeframe bias in their trading analysis. Main Benefits Displays confirmed ZigZag swing highs and swing lows Marks BOS Up, BOS Down, CHoCH Up and CHoCH Down Shows Depth Highest High and Depth Lowest Low lines Adds HH, HL, LH and LL structure labels Includes HTF bi
The indicator to trade price consolidation is designed to identify price contraction and alerts us on formation. It does this by analyzing historical price data and identifying price action patterns. The algorithm then uses this information to mark the zone , potential targets and liquidity lines, giving us valuable insights into market behavior.  Traders can adjust parameters such as colors ,alerts types and how many  previously formed zones to display on chart . Furthermore, the indicator can
Ric
Sabina Fik
With this indicator, you can   predict future price behavior   for a certain number of bars ahead, giving you the ability to anticipate market dynamics. The indicator draws a   forecast line , which models potential future price values based on sophisticated algorithms analyzing past data. This information can be leveraged not only for market entry and exit decisions but also for setting or adjusting stop-loss levels to better manage your positions. Application of the Forecast The data provided
SR Zones & Pivot Panel EA - All-in-One Trading Tool SR Zones & Pivot Panel EA   is a powerful hybrid tool that combines automatic   Support/Resistance Zones ,   Daily Pivot Points , and a   Compact Trading Panel   into one interface. It helps traders visualize key price levels on any timeframe while executing trades quickly and efficiently. Designed for precision and speed, this tool keeps your chart clean while providing all the data you need for intraday trading. Key Features 1. Automati
ShooterSignal ShooterSignal is a multi-timeframe market structure indicator for MetaTrader 5. The indicator analyzes price data and identifies swing points used to display market structure on the chart. Market Structure The indicator identifies: Higher High (HH) Higher Low (HL) Lower High (LH) Lower Low (LL) These structural points are displayed on the chart according to the selected timeframe. Structure Events ShooterSignal can display structural events based on detected price movement, includ
RelicusRoad Daily Pivots est un indicateur de points pivots journaliers pour MetaTrader 4 et MetaTrader 5 qui divise la plage du jour précédent en niveaux de Fibonacci et les prolonge au-dessus et en dessous, de moins 100 à plus 200 pour cent. Au lieu de pivots classiques de type floor, la plage précédente terminée est traitée comme une échelle où le plus bas vaut 0 % et le plus haut 100 %. Dix-neuf niveaux sont imprimés sous forme de petits repères colorés au bord droit du graphique, si bien qu
FREE
support resistance levels indicator   mt5: Cet outil est un indicateur multi-temporels qui identifie et trace les lignes de support et de résistance, ainsi que les niveaux de Fibonacci, sur un graphique avec la même précision que l'œil humain. Les niveaux de support et de résistance TW pour le forex disposent d'un algorithme complexe qui scanne le graphique pour identifier les niveaux précédents de stabilisation des prix et de rebond, en enregistrant le nombre de touches. Êtes-vous fatigué de
Murphy Order Block is a highly optimized and visually clean indicator for identifying key institutional zones based on pure market structure logic. It is designed for traders who follow Smart Money Concepts (SMC), ICT-style OB trading, and structure-based break & retest strategies. This indicator dynamically detects and draws: - **1 valid Bullish Order Block (Buy Zone)** - **1 valid Bearish Order Block (Sell Zone)** ### Key Features: **Market Structure-Based Logic**   - Uses swing high
Mechanical SR mt5
Part-time Day Trader
Mechanical Support Resistance Automatically calculates support and resistance levels using vertical price-profile analysis with pivot-style updates. Mechanical Support Resistance sits between a traditional support/resistance indicator , a pivot indicator , and a vertical profile indicator . Like an S/R indicator, it identifies important price levels. Like a pivot indicator, those levels remain fixed for a defined period and refresh on a scheduled daily, weekly, or monthly basis. And like a verti
Projection of Phi
Nestor Jose Mendez Boza
Projection of Phi   Is a technical indicator that calculates dynamic support and resistance levels. It uses angular geometric projections and mathematical ratios to identify market expansion ranges. Features: Dynamic Fibonacci Expansion: Extension level projection Geometric Calculation: Angular analysis and mathematical ratios Visualization: Graphical objects with informative labels Compatibility: M1 to H4 timeframes Applications: Identification of zones for trade management Analysis of volatil
FREE
Point and Fignure (P&F) chart plots price against changes in direction by plotting a column of Xs as the price rises and a column of Os as the price falls. Features Support for several kinds of price types - High/Low and Close. Clean and easy-to-read chart. Displays column high and low prices as indicator values. Support for both 4 and 5-digit brokers. Customizeable colors. Advantages Filter insignificant price movements and noise. Less noise and more stable work. Focus on important price move
Tracez la plage de la session asiatique KT Asian Breakout Indicator marque le plus haut et le plus bas d'une fenêtre de quatre heures de la session asiatique, puis surveille le prix une fois la plage terminée. Le paramètre GMT Offset aligne la session sur l'heure du serveur de votre courtier, tandis que Draw Session Box contrôle l'affichage de la plage. Visualisez ensemble la cassure et les niveaux de transaction Une flèche haussière apparaît lorsque le prix clôture au-dessus du plus haut de la
Traditional Pivot Points Pro is a professional MQL5 indicator designed to display accurate pivot levels with an automatic session-based calculation logic. It plots the main pivot point (P) together with resistance and support levels R1, R2, S1, and S2 in a clean and readable format. The indicator is built for traders who want a simple and efficient way to identify key market levels, potential reversals, intraday support and resistance zones, and price reaction areas. It is especially useful for
Detailed Description: The   Pivot Point Pro Indicator   is a powerful all-in-one fully customizable indicator that takes care of five pivot point methods (Classic, Fibonacci, Woodie, Camarilla, DeMark). It automatically plots pivot levels and midpoints, highlights key reversal zones and sends alerts when price approaches these levels.  Unlike the free Pivot Point Classic version, this Pro indicator allows users to customize more settings,   analyze current and historical pivot points and  use al
The Angle Prices indicator is a tool that calculates the price angle based on price analysis, interpreting the time vector in the form of price points on the price chart. In other words, the X axis and Y axis are represented as price points, so you can actually calculate the angle with two axes of the same dimension. This allows traders to obtain information about the direction of price movement and possible entry or exit points for trades. Let's look at the main characteristics and interpretat
AxisGuard Pro
Muhammad Andiya Nafhan
AxisGuard Pro Professional Pivot, Support & Resistance Indicator for MetaTrader 5 AxisGuard Pro is a professional analytical indicator designed to help traders identify important market levels without overcrowding the chart. It provides a clean view of Pivot Points, Support and Resistance levels with powerful multi-timeframe control. Suitable for: Forex Gold Indices Crypto Other MetaTrader 5 supported symbols Main Features Multi-Timeframe P
Version MT4 : https://www.mql5.com/en/market/product/157679 Version MT5 : https://www.mql5.com/en/market/product/157680 Support et Résistance — Niveaux de structure de marché intelligents Un indicateur de support et de résistance clair, intelligent et extrêmement fiable, conçu pour les traders professionnels et les systèmes automatisés. L’indicateur Support et Résistance détecte les véritables niveaux de marché grâce à un algorithme de clustering avancé qui combine les fractales, la segment
Divergence Sync MT5
Pavel Verveyko
5 (1)
Divergence and Convergence are important harbingers of reversals in stock markets. The Divergence Sync indicator is designed to automatically search for divergences on a large number of indicators with different parameters. The search for divergences is carried out on these indicators: (CCI, CHO, DeMarker, MACD, MFI, Momentum, OBV, OsMA, RSI, Stochastic, WPR,   Awesome Oscillator ). To search for divergences, you can use one technical indicator or search simultaneously on any number of indicat
UFO Market Structure & Fibo Pro UFO (Unfilled Order Institutional) zone + Non-Repaint Market Structure + Golden Fibonacci Entry Stop trading like retail. Start tracking institutions. UFO Market Structure & Fibo Pro is an all-in-one visual assistant designed to automatically map Institutional Supply & Demand, Market Structure, and Golden Fibonacci entries. No more subjective drawing, no more lagging indicators. Just pure, objective institutional footprints. UNIVERSAL MARKET COMPATIBILITY Work
Owl Smart Levels MT5
Sergey Ermolov
4.03 (32)
Lors du trading dans le sens de la tendance, la principale difficulté n’est pas de trouver un niveau, mais de comprendre où une entrée est réellement valide. Le prix réagit souvent aux niveaux, mais ne parvient pas à poursuivre le mouvement — ce qui entraîne des entrées erronées ou des opportunités manquées. Owl Smart Levels ne se contente pas d’afficher des niveaux , mais des zones formées à partir de la structure du marché et des retracements. Cela permet d’évaluer les points d’entrée différem
Les acheteurs de ce produit ont également acheté
SMART TREND TRADING SYSTEM — OFFRE SPÉCIALE Votre système de trading. Votre EA d’automatisation. Votre formation et votre accompagnement. Achetez Smart Trend Trading System pour MT5 à 99 USD et recevez Smart Universal Expert Advisor GRATUITEMENT pour automatiser ses signaux. STTS réunit la direction de la tendance, les signaux d’entrée et de sortie, les zones de retournement et les niveaux de prix importants directement sur votre graphique. Suivez le système manuellement ou connectez l’EA inclus
Trend Sniper X
Sarvarbek Abduvoxobov
4.9 (39)
Trend Sniper X est un indicateur de suivi de tendance multi-unités de temps pour MetaTrader 5 qui aide les traders à identifier la direction de la tendance et les points d'inversion potentiels avec clarté et précision. pour MT4: https://www.mql5.com/en/market/product/193245 Informations sur le prix : Le prix actuel est un prix promotionnel et est susceptible de changer lors des prochaines mises à jour et nouvelles fonctionnalités. Offre bonus : Pour obtenir GRATUITEMENT l'Auto-Trade Assistant E
ARIPoint
Temirlan Kdyrkhan
1 (4)
ARIPoint is a powerful trading companion designed to generate high-probability entry signals with dynamic TP/SL/DP levels based on volatility. Built-in performance tracking shows win/loss stats, PP1/PP2 hits, and success rates all updated live. Key Features: Buy/Sell signals with adaptive volatility bands Real-time TP/SL/DP levels based on ATR Built-in MA Filter with optional ATR/StdDev volatility Performance stats panel (Success, Profit/Loss, PP1/PP2) Alerts via popup, sound, push, or email Cu
Gann Made Easy   est un système de trading Forex professionnel et facile à utiliser qui est basé sur les meilleurs principes de trading en utilisant la théorie de mr. WD Gann. L'indicateur fournit des signaux d'ACHAT et de VENTE précis, y compris les niveaux Stop Loss et Take Profit. Vous pouvez échanger même en déplacement en utilisant les notifications PUSH. VEUILLEZ ME CONTACTER APRÈS L'ACHAT POUR RECEVOIR GRATUITEMENT DES INSTRUCTIONS DE TRADING ET D'EXCELLENTS INDICATEURS SUPPLÉMENTAIRES! V
Neuro Poseidon MT5
Daria Rezueva
4.75 (52)
Neuro Poseidon is a new indicator by Daria Rezueva. It combines precise trading signals with adaptive TP/SL levels - creating best possible trades as a result! Message me and get  Neuro Poseidon Assistant  as a gift to automize your trading process! What makes it stand out? 1. Proven profitability on all assets and timeframes 2. Only confirmed BUY and SELL signals present on the chart 3. Adaptive TP & SL levels generated by the software for each trade 4. Easy to understand - suitable for al
M1 Sniper MT5
Oleg Rodin
5 (7)
M1 SNIPER   est un système d'indicateurs de trading facile à utiliser. Il s'agit d'un indicateur à flèche conçu pour l'unité de temps M1. Cet indicateur peut être utilisé seul pour le scalping sur l'unité de temps M1 ou intégré à votre système de trading existant. Bien que conçu spécifiquement pour le trading sur l'unité de temps M1, ce système peut également être utilisé avec d'autres unités de temps. Initialement, j'avais conçu cette méthode pour le trading du XAUUSD et du BTCUSD. Cependant, j
La légende est de retour : Entry Points Pro 10. La relance de l'indicateur légendaire qui s'est maintenu 3 ans dans le Top-3 du MQL5 Market. Des centaines d'avis enthousiastes (589 sur les deux versions), des milliers de traders l'utilisent chaque jour, 31 000+ téléchargements de la démo   MT4+MT5 . J'ai lu chacun de vos avis publiés en cinq ans — et au lieu de promettre, j'ai intégré les réponses directement dans la version 10. Par un auteur présent sur les marchés depuis 1999, qui tient à l'ho
Auto Optimized SpeedAngle est un système de vectorisation du momentum de niveau institutionnel qui élimine l'ajustement de courbe ( curve-fitting ) grâce à une optimisation continue par avancement ( Walk-Forward Optimization , WFO). Plutôt que de s'appuyer sur des entrées statiques qui se dégradent lorsque les régimes de marché changent, l'indicateur recalibre dynamiquement ses paramètres en utilisant une validation hors échantillon ( Out-of-Sample , OOS), garantissant ainsi que les signaux affi
Unix Scalper
Issam Kassas
4 (4)
UNIX SCALPER — OFFRE SPÉCIALE Repérez la configuration. Consultez le plan. Choisissez comment intervenir. Achetez UNIX Scalper pour MT5 à 99 USD et recevez Smart Universal Expert Advisor GRATUITEMENT pour automatiser ses signaux. UNIX Scalper réunit l’analyse du marché, les décisions BUY/SELL/WAIT et les niveaux Entry, Stop Loss, TP1 et TP2 dans un panneau organisé. Suivez le plan de trading manuellement ou connectez l’EA inclus pour une exécution automatique selon vos paramètres. Le prix actuel
Welcome to ENTRY IN THE ZONE AND SMC MULTI TIMEFRAME / SPECIAL BENEFIT FOR OUR MQL5 CUSTOMERS  FREE ACCESS TO THE NEW TOOL —COMING SOON —   Learn More on Our Official Website : https://www.fableedge.net Entry In The Zone and SMC Multi Timeframe is a real-time market analysis tool based on Smart Money Concepts (SMC), designed to analyze market structure, price direction, and key trading zones. It supports both Single-Timeframe Analysis and Multi-Timeframe Analysis, providing a clearer view of the
Atomic Analyst MT5
Issam Kassas
4.47 (60)
ATOMIC ANALYST — OFFRE SPÉCIALE Votre analyse de marché. Votre EA d’automatisation. Votre formation et votre accompagnement. Achetez Atomic Analyst pour MT5 à 99 USD et recevez Smart Universal Expert Advisor GRATUITEMENT pour automatiser ses signaux. Atomic Analyst réunit l’action des prix, la direction de la tendance, les signaux d’entrée et de sortie, le Stop Loss et plusieurs niveaux de Take Profit directement sur votre graphique. Tradez manuellement à l’aide de son analyse ou connectez l’EA
Power Candles MT5
Daniel Stein
4.58 (12)
Power Candles V3 - Indicateur de force à optimisation automatique Power Candles V3 transforme la force des devises et des instruments en un plan de trading exploitable sur chaque graphique auquel il est associé. Au lieu de se contenter de colorer les bougies, il effectue une optimisation automatique en temps réel en arrière-plan et vous fournit les meilleurs niveaux de Stop Loss, Take Profit et seuils de signal pour le symbole que vous avez sous les yeux. Un simple clic suffit pour l'adopter en
Adaptive Price Action Engine Achetez un indicateur, obtenez l'EA gratuitement Analyse auto-optimisée des tendances et des figures de chandeliers Multi-Timeframe Les marchés évoluent constamment, et tous les modèles de Price Action n’ont pas la même valeur dans toutes les conditions de marché. Adaptive Price Action Engine a été conçu pour s’adapter aux changements du marché en combinant structure de tendance, analyse Multi-Timeframe, figures de chandeliers et optimisation statistique au sein d’un
Currency Strength Wizard   est un indicateur très puissant qui vous offre une solution tout-en-un pour un trading réussi. L'indicateur calcule la puissance de telle ou telle paire de devises en utilisant les données de toutes les devises sur plusieurs périodes. Ces données sont représentées sous la forme d'un indice de devise facile à utiliser et de lignes électriques de devise que vous pouvez utiliser pour voir la puissance de telle ou telle devise. Tout ce dont vous avez besoin est d'attacher
M1 Quantum MT5
Hamed Dehgani
4.2 (10)
Signaux de Trading en Direct avec M1 Quantum : Signal   (L’opération est exécutée automatiquement par le Quantum Trade Assistant , inclus gratuitement avec ce produit.) Dernières nouvelles : La version 1.64 a été publiée. Toutes les transactions disposent désormais d’un Stop Loss placé derrière les zones de support/résistance correspondantes. La fonction Smart Close a également été améliorée afin d’augmenter les performances de l’EA dans cette version. Depuis le 9 août, le signal en direct fonc
PZ Trend Trading MT5
PZ TRADING SLU
3.8 (5)
Capture every opportunity: your go-to indicator for profitable trend trading Trend Trading is an indicator designed to profit as much as possible from trends taking place in the market, by timing pullbacks and breakouts. It finds trading opportunities by analyzing what the price is doing during established trends. [ Installation Guide | Update Guide | Troubleshooting | FAQ | All Products ] Trade financial markets with confidence and efficiency Profit from established trends without getting whips
Scalper Vault   est un système de scalpage professionnel qui vous fournit tout ce dont vous avez besoin pour un scalpage réussi. Cet indicateur est un système de trading complet qui peut être utilisé par les traders de forex et d'options binaires. Le délai recommandé est M5. Le système vous fournit des signaux fléchés précis dans le sens de la tendance. Il vous fournit également des signaux supérieurs et inférieurs et des niveaux de marché Gann. Les indicateurs fournissent tous les types d'alert
Divergence Bomber
Ihor Otkydach
4.89 (94)
Chaque acheteur de cet indicateur reçoit également gratuitement : L’outil exclusif « Bomber Utility », qui accompagne automatiquement chaque opération de trading, fixe les niveaux de Stop Loss et de Take Profit, et clôture les positions selon les règles de la stratégie Des fichiers de configuration (set files) pour adapter l’indicateur à différents actifs Des set files pour configurer le Bomber Utility selon différents modes : « Risque Minimum », « Risque Équilibré » et « Stratégie d’Attente »
L'indicateur UZFX {SSS} Scalping Smart Signals v5.0 MT5 est un indicateur de trading haute performance sans « repaint », conçu pour les scalpers, les day traders et les swing traders qui recherchent des signaux précis et en temps réel sur des marchés très volatils. Développé par (UZFX-LABS), cet indicateur combine l'analyse de l'action des cours, la confirmation des tendances et un filtrage intelligent pour générer des signaux d'achat et de vente à forte probabilité, des signaux d'alerte et des
SkyHammer Signal Pro Indicateur professionnel de signaux de tendance sans repaint, avec niveaux Entry, SL et TP verrouillés SkyHammer Signal Pro est un indicateur de tendance et de momentum structuré, conçu pour les traders qui recherchent des signaux clairs, fixes et vérifiables. Il fonctionne le mieux sur les timeframes courts, comme M1 et M5 . L’indicateur ne cherche pas à prédire les sommets ou les creux du marché. Il attend plutôt une structure de marché confirmée, une direction de tendance
The Oracle Pro
Ottaviano De Cicco
5 (1)
The Oracle Pro: Synthetic Multi-Timeframe Bias Engine for MT5 ️ Summer Launch Offer — Get The Oracle Pro for USD 199 (early buyers). Price rises with traction; final price USD 399. The Oracle Pro is a premium multi-timeframe bias engine for MetaTrader 5, built for demanding and professional traders. It answers one question with discipline: what is the directional bias on each timeframe right now, how strong is it, and how much do the timeframes agree? Everything is computed on closed bars only
Unlock hidden profits: accurate divergence trading for all markets Tricky to find and scarce in frequency, divergences are one of the most reliable trading scenarios. This indicator finds and scans for regular and hidden divergences automatically using your favourite oscillator. [ Installation Guide | Update Guide | Troubleshooting | FAQ | All Products  ] Easy to trade Finds regular and hidden divergences Supports many well known oscillators Implements trading signals based on breakouts Displays
Crystal Heikin Ashi Signals
Muhammad Jawad Shabir
5 (4)
Crystal Heikin Ashi Signals—Professional Trend & Signal Detection Indicator Advanced Heikin Ashi Visualization with Intelligent Signal System for Manual & Automated Trading Final Price: $149 ---------> Price goes up $10 after every 10 sales . Limited slots available — act fast . Overview User Guide PDF Crystal Heikin Ashi Signals is a professional-grade MetaTrader 5 indicator that combines pure Heikin Ashi candle visualization with an advanced momentum-shift detection system. Designed for both m
DayTrader PRO
Davit Beridze
5 (4)
DayTrader PRO DayTrader PRO est un indicateur de trading avancé qui combine le filtre Laguerre de John Ehlers avec un puissant moteur d'auto-optimisation. Au lieu d'utiliser des paramètres fixes, l'indicateur recherche automatiquement les meilleurs réglages en fonction des conditions récentes du marché, vous aidant à vous adapter à la volatilité changeante sans ajustements manuels constants. L'indicateur génère des signaux clairs d'ACHAT (BUY) et de VENTE (SELL), accompagnés de niveaux de Stop L
Mahra Pro Indicator MT5
Mahra Said Mohammed Al Kaabi
Mahra Pro Indicator MT5 Overview Mahra Pro is a MetaTrader 5 chart indicator designed to support structured analysis of XAUUSD (Gold). It combines trend, momentum, volatility and price-structure conditions to identify potential buy and sell setups and display them directly on the chart. The indicator does not open, modify or close trades. All trading decisions and order execution remain under the user's control. Main features • Buy and sell signal arrows on the chart. • Fast and slow EMA lines w
Precision Spike Detector
Francisco Mandomo Simbine
5 (2)
Precision Spike Detector V3 – Institutional-Grade AI Trading System Attention: The price increases by US$50 for every 10 purchases.  Final price: US$599 Precision Spike Detector V3   is a   state-of-the-art, institutional-grade market analysis system   for   MetaTrader 5 , designed to detect   high-probability market movements   in synthetic indices such as   Boom, Crash, GainX, and PainX . After purchase, send me a private message to receive the optimized configuration files,  the installation
Volume Profile Multiple — Profils de Volume Multiples avec Buffers pour le Trading Algorithmique Fatigué de redessiner le Volume Profile bloc par bloc, en devant tout recalculer à chaque changement de timeframe ? Volume Profile Multiple trace automatiquement plusieurs profils de volume consécutifs sur le graphique, révélant où l'intérêt institutionnel s'est réellement concentré dans chaque section du marché — et pas seulement sur la dernière plage visible. Ce que l'indicateur fait pour vous L'in
Quantum Direction est un indicateur professionnel de suivi de tendance conçu pour identifier la direction du marché, détecter les changements de tendance à leurs débuts et fournir des signaux d'entrée et de sortie filtrés. Cet indicateur inclut gratuitement Quantum Trade Assistant , un outil professionnel de gestion des transactions disponible sur le MQL5 Market. Il peut se connecter directement à Quantum Direction et ouvrir automatiquement des positions lorsqu’un signal valide apparaît, ou ferm
Gold Beaver Signals vous montre, directement sur votre graphique, où un robot professionnel de cassures entrerait sur le marché de l'or — avant que cela n'arrive. Preuve en direct Ce n'est pas une promesse. Les mêmes stratégies tournent sur un signal réel et public que vous pouvez inspecter à tout moment : https://www.mql5.com/en/signals/2375536 Ce qu'il fait, en termes simples L'indicateur surveille l'or exactement comme notre robot de trading. Quand le prix accumule de la pression sous un nive
Gartley Hunter Multi
Siarhei Vashchylka
5 (12)
Gartley Hunter Multi - An indicator for searching for harmonic patterns simultaneously on dozens of trading instruments and on all possible timeframes. Manual (Be sure to read before purchasing) | Version for MT4 Advantages 1. Patterns: Gartley, Butterfly, Shark, Crab. Bat, Alternate Bat, Deep Crab, Cypher 2. Simultaneous search for patterns on dozens of trading instruments and on all possible timeframes 3. Search for patterns of all possible sizes. From the smallest to the largest 4. All fou
Plus de l'auteur
L'indicateur calcule les zones d'arrêt / d'inversion de tendance les plus probables, les zones de mouvement de tendance confiantes. Le calcul considère : le taux de variation des prix ; l'angle de déviation relative de la carte ; l'amplitude moyenne des mouvements de prix ; le prix sortant de sa « zone de confort » ; les valeurs de l'indicateur ATR. L'indicateur peut générer une alerte lorsque le prix entre dans une zone d'arrêt/d'inversion. Paramètres Dessiner toute la longueur ? - tracer l
Buy and sell zones
Evgeniy Zhdan
5 (2)
Indicator for determining flat and trend. If the price is below any of the two histograms and two lines (red and blue), this is a sell zone. When purchasing this version of the indicator, MT5 version for one real and one demo account - as a gift (to receive, write me a private message)! If the price is above any of the two histograms and two lines (red and blue), this is a buy zone. MT5 version:  https://www.mql5.com/en/market/product/70409 If the price is between two lines or in the zone of
SuperTrend
Evgeniy Zhdan
2.5 (2)
The Supertrend Expert Advisor The Supertrend Expert Advisor with averaging elements. It has been developed during three months until I finally got good results. It is not a scalper. The minimum balance to start trading - 100 $. Is automatically adjusted to the 4 and 5-digit prices. Has an efficient risk management system. The lot and limit on the maximum lot is automatically calculated based on the settings specified in the EA. As a result, you have a complete automated trading system. Download
Stardust
Evgeniy Zhdan
StarDust searches for divergences in the values of several indicators considering them as signs of flat and enters the market if a relatively steady trend is detected. The Expert Advisor trades "basic" symbols with a low spread. The best results are achieved on М15. The EA automatically adjusts to 4 and 5-digit quote flows. Settings Comment_to_orders – comment to a placed order. The field can be left blank if no comment is required. MM – enable money management with automatic setting of a worki
Top Floor
Evgeniy Zhdan
The EA catches the price when it moves against the trend in an effort to open an order in an opposite direction (direction of the main trend). Screenshots illustrate examples of entries and the strategy gist. The EA uses stop losses depending on values of ATR. Settings: Lot_ - if Risk_ = 0, the EA will trade this lot; Risk_ - risk per one trade. Stop loss is taken into account; koeff_ATR - coefficient multiplied by the ATR value to calculate stop loss (the bigger the value, the bigger stop loss
FastBoom
Evgeniy Zhdan
The FastBoom EA finds the most probable points of price pullback/reverse and places an order. It places averaging orders if the price moves further against take profit. Settings of the EA: Lots - initial lot; LotExponent - multiplier for following orders (Martingale). 1 - no multiplier. TakeProfit - take profit in points; Stochastic Settings InpKPeriod - K Period of Stochastic InpDPeriod - D Period of Stochastic InpSlowing - Stochastic Slowing LevHigh - level for sell positions of Stochastic L
The Expert Advisor calculates the double/triple divergence of volumes, and starts trading. It uses a unique formula of lot calculation, which greatly improves stability of trading. Recommended TF - 1h. Currency pair - EURUSD , but the EA can be used on any trading instruments which are not subject to high volatility. Settings mode - trading direction can be set manually; close - order close level (details on the screenshot); Step between orders - step between orders in points; Maximum orders -
OrderOnLine
Evgeniy Zhdan
The Expert Advisor opens orders from the horizontal line, the a trader can set on any level by dragging using the mouse or by changing the line properties. For example, when a horizontal line is above the current price, the EA will open a Buy order once the horizontal line is reached. And vice versa: If the line is below the current price, the EA will open a sell order once the line is crossed. A buy crossover of the line is: opening of the current candlestick below the horizontal line; the curr
SellerATR
Evgeniy Zhdan
5 (1)
The Expert Advisor only sells. Recommended currency pairs : EURUSD; GBPUSD; USDCHF; USDJPY; USDCAD; AUDUSD; EURGBP; EURAUD; EURCHF; EURJPY; GBPCHF; CADJPY; GBPJPY; AUDNZD; AUDCAD; AUDCHF; AUDJPY; CHFJPY; EURNZD; EURCAD; CADCHF; NZDJPY; NZDUSD. Timeframe: H1. Percent% manages closing both loss-making and profitable deals based on the account overall status. Using the EA on 23 symbols mentioned above allows the robot to cope with the drawdown in case of a long trend. While positions on some pairs
Illusion
Evgeniy Zhdan
3 (2)
The Illusion EA uses the probability theory - after a series of consecutive virtual losses - i.e. right during a flat the EA already starts trading in the trend. In addition, the EA considers the ratio of bullish/bearish candles on the higher timeframes to determine the greatest probability of the price movement direction. Only 1 order can be opened at a time. In case of a loss the following order will be placed with an increased lot (the multiplication coefficient is set in the parameters). The
The indicator plots a trend line and determines the levels for opening trades, in case the price goes "too far" away from the trend level. More detailed information is available in the screenshots. Settings Away from the trend line - distance from the trend line to the trades level; Arrow Signal for deals - enable displaying an arrow when the price reaches the trades level; Size of Arrow - size of the arrow; Alert Signal for deals - enable generating alerts when the price reaches the trades lev

Turbina
Evgeniy Zhdan
5 (4)
The axiom of the Forex market is that any trend will be broken. The Expert Advisor determines trend direction (the pink line), and calculates levels for opening opposite orders depending on the settings. The value of Away from the trend line for Deal will be different for each pair and timeframe, depending on the volatility of the trading instrument. Next orders can be opened with an increased lot (a static lot is used by default). See the screenshots to understand the idea of the Expert Advisor
Odysseus
Evgeniy Zhdan
The Expert Advisor determines the moments of strong movements and opens a position in the direction of the most probable price movement. The strategy always uses stop loss and take profit. Several independent orders can be in the market (the maximum number is set in parameters). The goal of the EA's underlying trading system is the quantitative excess of the number of profitable deals over the number of losing ones. Recommended: EURUSD 5m; GBPUSD 5m; USDJPY 5m. The Expert Advisor is able to work
Vise
Evgeniy Zhdan
Vise is a trend indicator. The upper and lower lines follow the price showing the prevailing price direction. Frequent breakthroughs of the upper line indicate a bullish trend, while frequent breakthroughs of the lower line indicate a bearish one. Parameters Points for UpLine - initial number of points for the upper line; Points for DownLine - initial number of points for the lower line. During the breakthrough of the upper level (line), this level shifts upwards by Points for UpLine. If the up
Twinkle
Evgeniy Zhdan
Twinkle is a trend-based scalper using stop loss and take profit invisible to the broker. The EA does not look for trend reversals. The EA catches strong market movements and opens orders in the direction of the trend. Your broker will not see the order closing levels. The EA closes orders independently when reaching the take profit or stop loss levels specified in the settings. Recommended trading symbols: EURUSD M5, GBPUSD M5. ECN accounts with 5 digits quotes are recommended. Expert Advisor
Shine
Evgeniy Zhdan
4.75 (4)
This Expert Advisor implements elements of the Martingale system. Orders are opened at a specified distance from the moving average. The Parabolic SAR indicator and certain technical details are used to ensure the most accurate entries. The EA is highly customizable. It is recommended for simultaneous use on 4 currency pairs: EURUSD M15; GBPUSD M15; USDJPY M15; USDCAD M15. Despite good stability, it is advisable to disable the EA operation during the days rich in news releases. Configurations P
LuckyCase
Evgeniy Zhdan
LuckyCase is an Expert Advisor with martingale elements. The EA strategy is based on a significant "deviation" of the price from SAR inadicator and the Bands levels breakthrough point. The money management system is an essential part of the EA. It starts working after a trade is opened. Trades are closed after accumulating specified points of market orders, by deposit % or after an opposite side of the channel is broken through. The default EA settings are meant for: EURUSD M15; USDJPY M15. The
Elize
Evgeniy Zhdan
The Elize Expert Advisor has been designed to work with the EURCHF currency pair. It considers the peculiarities of this trading instrument, its behavior and dependence on the behavior of other currencies. In particular, when the currencies of the European countries (EURUSD, GBPUSD, EURNOK, EURCHF) move in the same direction, the EA starts its operation and opens a deal in the trend direction of the European currencies. In the event of price rollbacks, the EA uses a unique method for making the
AllTrendLines
Evgeniy Zhdan
4 (1)
Brief Description of the All Trend Lines Indicator The indicator analyzes the wave structure of the market. What it displays on the chart: First. Wave pivots (semaphores) • Red markers – wave highs • Yellow markers – wave lows • Yellow-green markers – additional local extremes Second. Trend lines • Purple/blue lines – trends based on highs (resistance/support) • Beige/green lines – trends based on lows • Lines are built automatically by connecting wave pivots of the same type Third. Main trend
FastTraffic
Evgeniy Zhdan
The Expert Advisor has been specifically developed for trading gold (Spot Gold). The strategy is based on Fibo levels calculated from the previous (first) candle High/Low and the width of the current and lower timeframes channel. If important Fibo levels of different orders are located in a single price channel (within a spread), the EA defines this channel as the target for price movement and starts operation. Martingale and averaging are not used. Each order is independent and is accompanied b
Jazz
Evgeniy Zhdan
The algorithm of this Expert Advisor determines the significant price levels, where the trend often turns into a flat or reverses. Stochastic Oscillator serves as an additional filter of overbought/oversold zones. The EA sets stop loss and take profit after opening an order. The underlying trailing strategy applies a trailing stop. The EA is recommended for simultaneously use on three trading instruments: EURUSD M5, GBPUSD M5, EURCHF M5. Settings: Comment to order - comment to orders. MaxRisk -
Panther
Evgeniy Zhdan
The Expert Advisor looks for technical analysis patterns formed on the higher (hourly) timeframe to start working on the 5-minute chart. Technical analysis patterns used: double top/double bottom, head/shoulders, flag, expanding/narrowing triangles. The Relative Vigor Index technical indicator is used as the filter for opening deals. It is based on the idea that on the bull market the closing price is, as a rule, higher, than the opening price. It is the other way round on the bear market. This
Spook
Evgeniy Zhdan
The Expert Advisor calculates the divergence on the current and higher timeframes. In case the divergences coincide, the EA starts its operation. Deals have strict take profit and stop loss levels. Each deal is managed by trailing stop. The strategy involves the use of a tight stop-loss. Therefore, losing deals and/or series of losing deals are not uncommon. This EA is not suitable for those who have difficulties coping with losing deals. The EA is recommended for simultaneous use on the followi
Grand
Evgeniy Zhdan
The Expert Advisor has been developed specifically for the features of the CHFJPY currency pair. The EA's algorithm determines the direction of the current trend and starts operation. In case of a price reversal within the current trend, the EA adds additional orders. If trend changes, the EA starts to work in the direction contrary to the initial grid of orders. If there were no conditions for closing orders and the trend direction changed again, the EA continues to work with the "first" grid o
Intensive
Evgeniy Zhdan
The Expert Advisor algorithm determines on daily charts those candlestick patterns, which set the intraday trading direction. The trading EA determines how long the price is moving in overbought/oversold zones and starts working in the direction of the expected trend movement. Each position is accompanied with a tight stop loss and take profit. Only one active position can be open in the market. The EA was developed and tested using 99% quality quotes. The Expert Advisor has a built-in news filt
Slender
Evgeniy Zhdan
The strategy of this Expert Advisor is based on a hedging system, which implies placing opposite orders. The EA algorithm determines trend beginning and opens a position in the trend direction. In case of a wrong entry, the EA tries to neutralize the drawdown through opposite (hedging) orders at a preset interval (Coefficient of counter orders). Orders are closed when one of the two values ​​is reached - profit in percent or profit in points. The EA does not use lot increase. The EA wast tested
Dreamer
Evgeniy Zhdan
Советник работает по принципу хеджирования с периодическими "перекосами" в сторону трендовых направлений. Направления тренда советник определяет на основании стандартного индикатора Parabolic Stop and Reverse system (SAR). Уникальная стратегия установки балансирующих позиций позволяет избегать больших просадок даже при самых не благоприятных рыночных условиях. Параметры по умолчанию рекомендуется использовать на торговом инструменте: GBPJPY 15m. Разработка и оптимизация параметров производились
Snoot
Evgeniy Zhdan
5 (1)
This Expert Advisor works using a grid in the direction of a trend movement with the step between opened positions defined in the settings. The positions are closed by the total take profit. The Parabolic SAR standard indicator is used to filter order opening, which comes in the MetaTrader 4 package. The EA has been developed and tested using 99,9% quality of quotes. Operation of the EA in real time can be viewed in the signals . The best trading results have been achieved on CHFJPY M15. Settin
Solipsism
Evgeniy Zhdan
The Expert Advisor builds channels based on the data obtained using ATR and MA indicators according to the equations: Upper channel border = MA + ATR * (FIBO); Lower channel border = MA - ATR * (FIBO), where FIBO has the following values: Style of Trade - Aggressive = 1.61852; Style of Trade - Average = 3.26704; Style of Trade - Calm = 4.85556. Trades are opened inside the channel with the intervals defined in the settings. Long and short positions are opened independently. Positions are closed
The trading statistics indicator notifies the trader of the aggregate income of the trading account for different time intervals. The indicator has wide display settings on the graph. There is a choice of one of the two display languages on the chart- English and Russian. Settings Indicator language (ENG, RUS) - Select the language to display on the chart; To control the magic (-1: any magic) - Entering the Magic for control (-1: any Magic); Angle of indicator tie - Selecting the angle of the c
Filtrer:
Aucun avis
Répondre à l'avis