WaveMarkers

Wave Markers:マルチタイムフレーム対応パネル付き・適応型ウェーブマップ

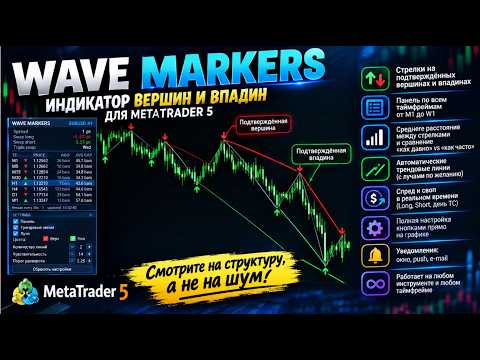
ノイズではなく、相場の本当の構造を。確認済みのスイング高値と安値、それらを結ぶトレンドライン、そして M1 から W1 までの全時間足の状況を、ひとつのパネルにまとめて表示します。

これは何ですか

Wave Markers は MetaTrader 5 用のチャート構造インジケーターです。価格の転換点(スイング高値とスイング安値)を見つけて見やすい矢印で表示し、その周りに実用的なツールを用意します。トレンドライン、全時間足の一覧表、そしてリアルタイムのスプレッドとスワップの表示です。

「買い」「売り」の指示は出さず、成果も約束しません。やることはひとつだけで、それを丁寧に行います。相場が実際にどこで反転したかを示し、構造をより速く、より一貫して読めるようにします。

単なる ZigZag ではない理由

従来の ZigZag は、何を転換とみなすかを固定の距離(ポイントやパーセント)で決めます。この一つの数値は、ほとんどの場面で不適切です。静かな相場では大きすぎて本物の波を見逃し、動きの速い相場では小さすぎてノイズを拾ってしまいます。

Wave Markers は異なる仕組みで動作します。

  • 反転のしきい値が現在のボラティリティに合わせて自動調整されます。 しきい値は相場自身の「典型的な値動き」の倍数で測られ、相場が荒いときは広がり、落ち着いているときは狭まります。同じ設定が、主要通貨ペア、ゴールド、株価指数、暗号資産、そして異なる時間足でも妥当に機能します。
  • 反転が確認されてからはじめてマーカーが表示されます。 価格が極値からしきい値分だけ実際に離れる必要があります。先読みはせず、ローソク足が進行中のうちに天井を推測することもありません。
  • 確認の遅れは明確で予測できます。 遅れの大きさは選択したしきい値で決まります。しきい値を高くすると、波は少なく重要なものになり確認は遅くなります。低くすると、マーカーは頻繁になり速く表示されます。
  • すべての時間足で同じロジックを使います。 そのため、パネル上で比較される内容は同じ基準で揃っています。

主な利点

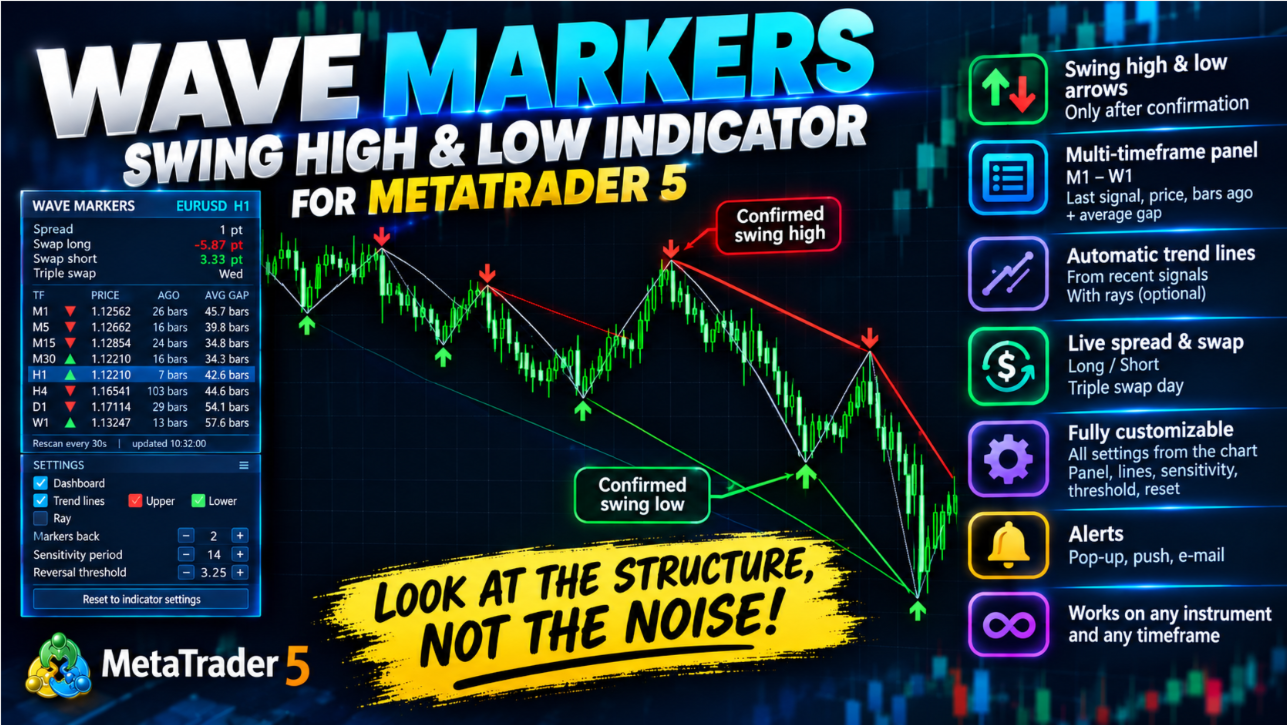
  • 見やすくすっきりしたマーカー:確認済みのスイング高値には下向き矢印、スイング安値には上向き矢印
  • 固定値ではなく、ボラティリティに適応するしきい値
  • 直近のマーカーを通るトレンドラインを自動で描画(レイ表示はオプション)
  • M1 から W1 までの全時間足のパネル:最新マーカーの方向、価格、何本前に出たか、同方向マーカー間の平均間隔
  • 同じパネルにスプレッドとスワップ(ロング、ショート、3倍スワップの曜日)をリアルタイム表示
  • 他の時間足で不足している履歴は自動的に要求・読み込み
  • ターミナルへの負荷が軽い:チャート上のマーカーは新しいバーごとに1回だけ再計算し、他の時間足はタイマーで確認(ティックごとではありません)
  • 設定ウィンドウを開かずに、チャート上ですべて操作可能
  • 新しいマーカーごとに、ポップアップ、プッシュ通知、メール通知に対応
  • あらゆる銘柄、あらゆる時間足で動作

チャート上で見られるもの

マーカーとウェーブライン。 確認済みのスイング高値と安値に矢印を表示します。細い線でつなぐこともでき、波が一目で読み取れます。

トレンドライン。 直近のスイング高値を通る線と、スイング安値を通る線を別々に描画します。描くセグメントの数は自由に選べます。1 なら、そのタイプの直近2つのマーカーを通る1本の線、2 なら直近3つのマーカーを2本の線でつなぎ、以降も同様です。線は右方向にレイ(半直線)として延長することも、ローソク足の高値または安値にぴったり始点と終点を置いた線分のままにすることもできます。

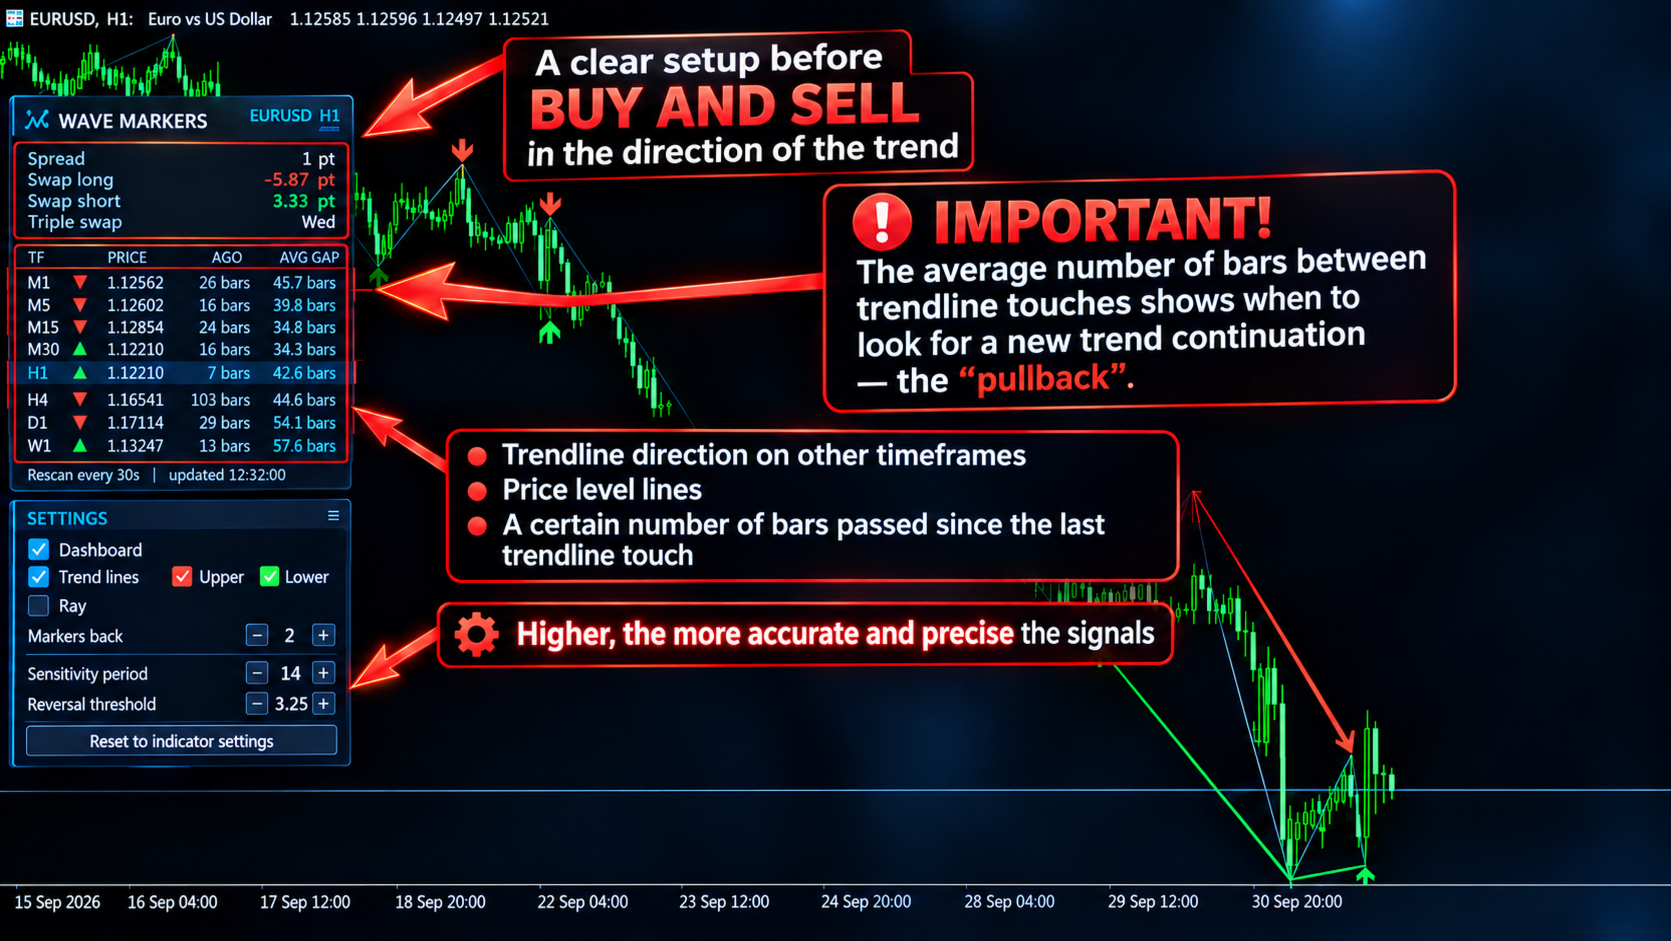
マルチタイムフレーム・パネル。 M1 から W1 まで、時間足ごとに1行ずつ表示します。

  • 最新マーカーの方向(▼ 高値、▲ 安値)
  • その価格
  • 何本前に出現したか
  • 分析した履歴全体での、その方向のマーカー間の平均バー数

「どれくらい前か」と「通常どれくらいの頻度で出るか」を見比べることで、その時間足がリズムのどの段階にあるかを素早くつかめます。

スプレッドとスワップ。 現在のスプレッドはティックごとに更新され、設定した水準を超えると強調表示できます。ロングスワップ、ショートスワップ、3倍スワップの曜日は、銘柄に適した単位で表示されます。

チャート上のコントロールパネル

メインパネルの下に、コンパクトな設定カードがあります。次の操作ができます。

  • メインパネルの表示と非表示の切り替え(隠れていたチャートの部分を確認できます)
  • トレンドラインのオンとオフ(上側と下側を別々に切り替え可能)
  • レイのオンとオフ
  • 「−」「+」ボタンで線の本数を変更
  • 「−」「+」ボタンで感度期間と反転しきい値を変更し、結果をすぐに確認
  • ワンクリックでインジケーター設定の値に戻す
  • タイトルバーをつかんで、パネル全体をチャート上の好きな位置にドラッグ

設定ウィンドウの値が出発点になり、その後はチャート上での選択が優先されます。時間足を切り替えても選択は保持され、リセットボタンで元の値に戻せます。

トレーダーの活用例

  • 相場構造の読み取り:切り上げ・切り下げの高値と安値、構造が崩れる場所
  • 重要なスイングレベルやトレンドラインを、手描きではなく自動で取得
  • 判断の前に、複数の時間足を一目で確認
  • 時間足ごとのマーカーのリズムを比較
  • チャートを離れずに、スプレッドとスワップのコストを把握

Wave Markers は分析ツールです。いかなる取引結果も保証せず、すべての判断はご自身で行うものです。どのような設定も、まずデモ口座でテストしてください。

ご注意いただきたい点

  • マーカーは価格が反転した後に確認されるため、必ず遅れて表示されます。これは設計によるもので、遅れの大きさは反転しきい値で調整できます。
  • 他の時間足のデータは、お使いのブローカーの履歴から読み込まれます。時間足に「loading...」と表示されている場合は、ターミナルがそのバーを構築中です。
  • メール通知を使うには、ターミナルでメールの設定が必要です(ツール → オプション → メール)。

設定項目

Wave Markers

  • Wave markers: sensitivity period:相場の典型的な値動きを何本のバーで測るかを決めます。短くするとボラティリティの変化に素早く反応し、長くすると安定します。14 が出発点としておすすめです。
  • Wave markers: reversal threshold, x sensitivity:マーカーが確認されるために、価格が極値から典型的な値動きの何倍離れる必要があるかを決めます。高くすると、波は少なく重要になり確認は遅くなります。低くすると、マーカーは増えて早く出ますが、ノイズも増えます。
  • Analysis depth, bars (per timeframe):各時間足で何本前のバーまで分析するかを決めます。深くするほど、チャートとパネルの統計に含まれる履歴が増えます。

Chart Display

  • Show wave markers on chart:矢印の表示と非表示を切り替えます。
  • Connect wave markers with a line:隣り合うマーカーを細い線でつなぎ、波を追いやすくします。
  • Swing high marker color:スイング高値の矢印の色です。
  • Swing low marker color:スイング安値の矢印の色です。
  • Connecting line color:マーカーをつなぐ線の色です。
  • Marker size (1-5):矢印の大きさです。
  • Connecting line width (1-5):マーカーをつなぐ線の太さです。

Dashboard

  • Show info panel on chart:パネルとチャート上のコントロールカードを表示します。オフにすると、インジケーターはこの設定ウィンドウの値だけで動作します。
  • Panel offset X, px:パネルの水平方向の初期位置です。その後はマウスでドラッグできます。
  • Panel offset Y, px:パネルの垂直方向の初期位置です。
  • Other timeframes re-check interval, sec:他の時間足を再確認する間隔です。現在のチャートは新しいバーごとに更新され、この設定は表にのみ影響します(最小 5 秒)。
  • Spread highlight level, points (0 = off):スプレッドの値がこの水準を超えるとオレンジ色になります。0 でハイライトをオフにします。

Alerts (current timeframe)

  • Popup alert on new wave marker:新しいマーカーが確認されたときに、ターミナルのアラートウィンドウを表示します。
  • Push notification on new wave marker:スマートフォンに通知を送ります(ターミナル設定の MetaQuotes ID が必要です)。
  • E-mail notification on new wave marker:メールを送信します(ターミナルでのメール設定が必要です)。

Trend Lines (through wave markers)

  • Draw trend lines through wave markers:すべてのトレンドラインを一括でオンまたはオフにします。
  • Lines through upper markers (highs):スイング高値を通る線を描画します。
  • Lines through lower markers (lows):スイング安値を通る線を描画します。
  • Number of lines per side (markers back, 1-50):各側で描くセグメントの数です。1 なら直近2つのマーカーを通る1本の線、2 なら直近3つのマーカーを2本の線でつなぎ、以降も同様です。
  • Extend all lines to the right (ray):すべての線をチャートの右端まで延長します。オフの場合、各線はそれぞれのマーカーで始まり、マーカーで終わります。
  • Upper line color:スイング高値を通る線の色です。
  • Lower line color:スイング安値を通る線の色です。
  • Line style:実線、破線、点線などを選べます。
  • Line width (1-5, solid style only):線の太さです。MetaTrader は、1 を超える太さを実線にのみ適用します。
  • Draw lines behind the chart:線をローソク足の手前ではなく、後ろに描画します。
おすすめのプロダクト
The indicator plots flexible support and resistance levels (dots). A special phase of movement is used for construction. Levels are formed dynamically, that is, each new candle can continue the level or complete it. The level can provide resistance or support to the price even where it is no longer there. Also, support and resistance levels can change roles. The importance of levels is affected by: the amount of time the level is formed and the number of touches. The significance of these lev
In the context of trading, Malaysia SNR (Support and Resistance) refers to the technical analysis of support and resistance levels in financial markets, particularly for stocks, indices, or other assets traded. This is single timeframe version. Multiple timeframe version is avaiable here . There are three type of Malaysia SNR level Classic , GAP and Flipped 1. Classic Support is the price level at which an asset tends to stop falling and may start to rebound. It acts as a "floor" where demand is
This indicator automatically calculates and displays classic pivot points on your chart, helping identify key support and resistance levels for the current trading session. Features: · Plots Pivot (PP), Resistance 1-2 (R1, R2), and Support 1-2 (S1, S2) levels · Includes current close price line for reference · Color-coded lines: Blue for pivot, Red for resistances, Green for supports · Automatic calculation based on previous day's high, low, and close · Continuous lines across the chart for e
BTFX Pivot Points
Bradley Thomas Farrington
BTFXピボットポイントは、毎日のサポートレベルとレジスタンスレベルを計算するインジケーターです。   この指標を使用することにより、ピボットレベルは目標とする明確な目標を示します。   抵抗レベルは、銀色のピボット線の上に紫色で表示されます。   サポートレベルはオレンジ色で表示され、銀色のピボットラインの下にあります。   このインジケーターは、BTFX夜明けインジケーターと一緒に使用すると非常にうまく機能します。   これらの指標の詳細については、添付のYouTubeビデオをご覧ください。   その他のお問い合わせは、メールまたはお電話にてお問い合わせください。   support@besttradesfx.co.uk   01827 842 418
Veltrion Smart Fibonacci   is a clean automatic Fibonacci structure overlay for MetaTrader 5. It automatically detects recent swing highs and swing lows, then draws key Fibonacci retracement levels directly on the chart. The indicator is designed to help traders visualize market structure, retracement zones, and the golden zone without manually drawing Fibonacci tools. Key Features Automatic swing high and swing low detection Clean Fibonacci retracement overlay Horizontal Fibonacci levels for a
Structure Levels (Highs & Lows) Indicator for MetaTrader 5 Decode Market DNA — Trade with Institutional Precision Description: The Structure Levels (Highs & Lows) Indicator is your secret weapon to map the market’s hidden roadmap. Designed for traders who think in terms of price action and market structure, this tool automatically identifies critical swing highs and swing lows, transforming chaotic charts into a clear blueprint of support/resistance zones, breakout opportunities, and trend rev
Fair Value Gap (FVG) & Inversion Fair Value Gap (iFVG) – TradingLabs ID(公正価値ギャップと反転公正価値ギャップ) ICT(インナーサークルトレーダー)およびスマートマネーコンセプト(SMC)の手法において、Fair Value Gap(FVG、インバランスとも呼ばれる)は、価格が極端なモメンタムで動いた際に流動性の空白地帯が残されることで発生します。これらの未埋めのギャップは将来の値動きに対する磁石として機能し、プロのトレーダーにとって最も確率の高い押し目買い・戻り売りおよびエントリーゾーンとなります。 しかし、すべてのFVGが同じではありません。どのギャップに本当の機関投資家の重みがあるのか、どうすればわかるでしょうか? FVG & iFVG Pro インジケーターのご紹介。 私たちは標準的なインバランス検出を次のレベルへと引き上げました。このツールは、新鮮な状態(Fresh)、緩和済み(Mitigated)、そして反転FVG(iFVG)をピンポイントの精度で自動検出するだけでなく、 業界初のダイナミック・スコア
这是一个基于前一个交易日的最高价、最低价和收盘价来计算的枢轴点指标,具体公式如下: 计算前一日的 Pivot Point (枢轴点): Pivot = (High + Low + Close) / 3 计算 Resistance 1 (R1) 、 Support 1 (S1) ​ 等: R1 = (2 * Pivot) - Low S1 = (2 * Pivot) - High R2 = Pivot + (High - Low) S2 = Pivot - (High - Low) 与市面上其他的枢轴点指标相比,该指标主要有以下4个特点: 1、可以修改交易日的开始时间; 2、可以设定支撑压力线的颜色; 3、可以设定是否显示各个支撑压力线对应的价格; 4、可以设定天数用以显示枢轴点的历史记录; 开发这个指标的最初目的是为了解决设定交易日开始时间的问题,接下来会进一步说明。基于计算公式,我们需要获得上一个交易日的最高价、最低价和收盘价,在夏令时,北京时间6点是开市时间,大多数交易平台服务器的0点对应的是北京时间的6点,但是香港的服务器6点才是对应的是北京时间的6点。如果你有多个平台,且存在
Support Resistance Break Zones PRO was built for a common problem I often see when trading XAUUSD and other fast-moving symbols: support and resistance levels are visible, but the chart becomes difficult to read when breakouts, retests and false breaks happen around the same area. Current price: $79 - increases by $10 after every 20 purchases until reaching the final price of $129 . Next price: $89 . Complete Buyer Kit: 42 Professional Resources included at no additional cost. MT5 Presets, PDF
Multichart V and H Line Sync Overview Multichart V and H Line Sync is the essential tool for multi-timeframe traders. It instantly synchronizes your Horizontal Support/Resistance Lines and Vertical Time Lines across all open charts of the same symbol. Stop drawing the same levels on M5, H1, and D1 charts manually. With this tool, draw a line once, and it automatically replicates on every other timeframe. Perfect for keeping your technical analysis consistent and your workspace clean. Key Feature
FREE
ZigZag Market Structure Breakout Pro ZigZag Extras Display BreakOut points is a MetaTrader 5 indicator for traders who use ZigZag, breakout points, market structure, BOS, CHoCH, swing high, swing low, support and resistance, and higher timeframe bias in their trading analysis. Main Benefits Displays confirmed ZigZag swing highs and swing lows Marks BOS Up, BOS Down, CHoCH Up and CHoCH Down Shows Depth Highest High and Depth Lowest Low lines Adds HH, HL, LH and LL structure labels Includes HTF bi
The indicator to trade price consolidation is designed to identify price contraction and alerts us on formation. It does this by analyzing historical price data and identifying price action patterns. The algorithm then uses this information to mark the zone , potential targets and liquidity lines, giving us valuable insights into market behavior.  Traders can adjust parameters such as colors ,alerts types and how many  previously formed zones to display on chart . Furthermore, the indicator can
With this indicator, you can   predict future price behavior   for a certain number of bars ahead, giving you the ability to anticipate market dynamics. The indicator draws a   forecast line , which models potential future price values based on sophisticated algorithms analyzing past data. This information can be leveraged not only for market entry and exit decisions but also for setting or adjusting stop-loss levels to better manage your positions. Application of the Forecast The data provided
SR Zones & Pivot Panel EA - All-in-One Trading Tool SR Zones & Pivot Panel EA   is a powerful hybrid tool that combines automatic   Support/Resistance Zones ,   Daily Pivot Points , and a   Compact Trading Panel   into one interface. It helps traders visualize key price levels on any timeframe while executing trades quickly and efficiently. Designed for precision and speed, this tool keeps your chart clean while providing all the data you need for intraday trading. Key Features 1. Automati
ShooterSignal ShooterSignal is a multi-timeframe market structure indicator for MetaTrader 5. The indicator analyzes price data and identifies swing points used to display market structure on the chart. Market Structure The indicator identifies: Higher High (HH) Higher Low (HL) Lower High (LH) Lower Low (LL) These structural points are displayed on the chart according to the selected timeframe. Structure Events ShooterSignal can display structural events based on detected price movement, includ
RelicusRoad Daily Pivots は MetaTrader 4 および MetaTrader 5 向けの日次ピボットポイントインジケーターで、前日のレンジをフィボナッチレベルに分割し、マイナス 100 パーセントからプラス 200 パーセントまでその上下に延長します。 従来のフロアピボットではなく、直近の確定したレンジを安値が 0%、高値が 100% となるスケールとして扱います。19 本のレベルがチャート右端にコンパクトな色付きマーカーとして表示されるため、当日の値動きの大きさを前日のレンジに対する割合や倍数として読み取れます。 仕組み インジケーターは直前に確定した基準期間の高値と安値を取り、そのレンジの各比率にレベルを配置します。レベル = 安値 + 比率 x (高値 - 安値)。週末の足はスキップされるため、月曜日の基準は直近の取引日になります。基準期間はチャートの時間足から決まります。 内側のセット(グレー):0%、23.6%、38.2%、50.0%、61.8%、78.6%、100%。 上側のセット(緑):+123.6%、+138.2%、+150.0%、+16
FREE
support resistance levels indicator   mt5   : このツールは、チャート上にサポートラインとレジスタンスライン、さらにフィボナッチレベルを同じ精度で識別しプロットするマルチタイムフレームインジケーターです。TWの外国為替サポートとレジスタンスレベルは、複雑なアルゴリズムを使用してチャートをスキャンし、過去の価格安定化および反発レベルを特定し、タッチ数を記録します。 手動でサポートとレジスタンスレベルやフィボナッチリトレースメントを描くのに疲れましたか? この製品の機能をチェックしてみてください。驚くことでしょう。 製品の特徴: 1. マイナーおよびメジャーレベル:高度なアルゴリズムを使用して、マイナーおよびメジャーレベルを好みに応じてカスタマイズし、追加のレベルを削除できます。 2. レベルタッチ数:TWサポートレジスタンスレベルとブレイクmt5では、各レベルが過去に何回タッチされたかを計算し提供します。これにより、各レベルの強さを評価できます。 3. フィボナッチレベル:最後の波のフィボナッチレベルが動的に描画されるため、これ
Murphy Order Block is a highly optimized and visually clean indicator for identifying key institutional zones based on pure market structure logic. It is designed for traders who follow Smart Money Concepts (SMC), ICT-style OB trading, and structure-based break & retest strategies. This indicator dynamically detects and draws: - **1 valid Bullish Order Block (Buy Zone)** - **1 valid Bearish Order Block (Sell Zone)** ### Key Features: **Market Structure-Based Logic**   - Uses swing high
Mechanical Support Resistance Automatically calculates support and resistance levels using vertical price-profile analysis with pivot-style updates. Mechanical Support Resistance sits between a traditional support/resistance indicator , a pivot indicator , and a vertical profile indicator . Like an S/R indicator, it identifies important price levels. Like a pivot indicator, those levels remain fixed for a defined period and refresh on a scheduled daily, weekly, or monthly basis. And like a verti
Projection of Phi   Is a technical indicator that calculates dynamic support and resistance levels. It uses angular geometric projections and mathematical ratios to identify market expansion ranges. Features: Dynamic Fibonacci Expansion: Extension level projection Geometric Calculation: Angular analysis and mathematical ratios Visualization: Graphical objects with informative labels Compatibility: M1 to H4 timeframes Applications: Identification of zones for trade management Analysis of volatil
FREE
Point and Fignure (P&F) chart plots price against changes in direction by plotting a column of Xs as the price rises and a column of Os as the price falls. Features Support for several kinds of price types - High/Low and Close. Clean and easy-to-read chart. Displays column high and low prices as indicator values. Support for both 4 and 5-digit brokers. Customizeable colors. Advantages Filter insignificant price movements and noise. Less noise and more stable work. Focus on important price move
アジア時間帯のレンジを表示 KT Asian Breakout Indicator は、4 時間のアジア時間帯における高値と安値を表示し、レンジ確定後の価格を監視します。GMT Offset でセッションをブローカーのサーバー時刻に合わせ、Draw Session Box でレンジの表示を切り替えられます。 ブレイクアウトと取引水準をまとめて確認 価格がセッション高値より上で確定すると上昇矢印が表示されます。価格がセッション安値より下で確定すると下降矢印が表示されます。Draw Stoploss and Profit Targets を有効にすると、エントリーライン、レンジ反対側の Stop Loss、3 段階の計算済み目標水準がチャートに追加されます。 上方ブレイクアウト: セッション安値を保護水準として使用します。 下方ブレイクアウト: セッション高値を保護水準として使用します。 目標 1、2、3: レンジ幅と現在のボラティリティに基づく段階的な参考水準です。 ブレイクアウト状態: ブレイクアウト足がセッションレンジに対して著しく大きい場合を識別します。 過去のシグナル成績を確認
Traditional Pivot Points Pro is a professional MQL5 indicator designed to display accurate pivot levels with an automatic session-based calculation logic. It plots the main pivot point (P) together with resistance and support levels R1, R2, S1, and S2 in a clean and readable format. The indicator is built for traders who want a simple and efficient way to identify key market levels, potential reversals, intraday support and resistance zones, and price reaction areas. It is especially useful for
Detailed Description: The   Pivot Point Pro Indicator   is a powerful all-in-one fully customizable indicator that takes care of five pivot point methods (Classic, Fibonacci, Woodie, Camarilla, DeMark). It automatically plots pivot levels and midpoints, highlights key reversal zones and sends alerts when price approaches these levels.  Unlike the free Pivot Point Classic version, this Pro indicator allows users to customize more settings,   analyze current and historical pivot points and  use al
The Angle Prices indicator is a tool that calculates the price angle based on price analysis, interpreting the time vector in the form of price points on the price chart. In other words, the X axis and Y axis are represented as price points, so you can actually calculate the angle with two axes of the same dimension. This allows traders to obtain information about the direction of price movement and possible entry or exit points for trades. Let's look at the main characteristics and interpretat
AxisGuard Pro
Muhammad Andiya Nafhan
AxisGuard Pro Professional Pivot, Support & Resistance Indicator for MetaTrader 5 AxisGuard Pro is a professional analytical indicator designed to help traders identify important market levels without overcrowding the chart. It provides a clean view of Pivot Points, Support and Resistance levels with powerful multi-timeframe control. Suitable for: Forex Gold Indices Crypto Other MetaTrader 5 supported symbols Main Features Multi-Timeframe P
MT4 バージョン: https://www.mql5.com/ja/market/product/157679 MT5 バージョン: https://www.mql5.com/ja/market/product/157680 サポート・レジスタンス — スマートな市場構造レベル プロのトレーダーと自動システム向けに開発された、シンプルでインテリジェント、かつ信頼性の高いサポート&レジスタンスインジケーターです。 サポート・レジスタンスは、フラクタル、ATRベースの価格セグメンテーション、マルチタイムフレーム分析を組み合わせた高度なクラスタリングアルゴリズムを用いて、真の市場レベルを検出するように設計されています。 このインジケーターは、ランダムなラインやノイズの多いラインを描くのではなく、価格が繰り返し反応した統計的に検証されたレベルを生成します。そのため、裁量取引、アルゴリズム取引、リスク管理、ブレイクアウト検証に最適です。 主な機能 高度なサポート・レジスタンス・エンジン ATRスケールのグリッドセグメンテーションを使用 上方フラクタルと下方フラクタルをクラスター化し
Divergence and Convergence are important harbingers of reversals in stock markets. The Divergence Sync indicator is designed to automatically search for divergences on a large number of indicators with different parameters. The search for divergences is carried out on these indicators: (CCI, CHO, DeMarker, MACD, MFI, Momentum, OBV, OsMA, RSI, Stochastic, WPR,   Awesome Oscillator ). To search for divergences, you can use one technical indicator or search simultaneously on any number of indicat
UFO Market Structure & Fibo Pro UFO (Unfilled Order Institutional) zone + Non-Repaint Market Structure + Golden Fibonacci Entry Stop trading like retail. Start tracking institutions. UFO Market Structure & Fibo Pro is an all-in-one visual assistant designed to automatically map Institutional Supply & Demand, Market Structure, and Golden Fibonacci entries. No more subjective drawing, no more lagging indicators. Just pure, objective institutional footprints. UNIVERSAL MARKET COMPATIBILITY Work
トレンドに沿ってトレードする際の主な難しさは、レベルを見つけることではなく、どこが実際に有効なエントリーポイントなのかを理解することにあります。 価格はしばしばレベルに反応しますが、動きが継続しないことが多く、その結果、誤ったエントリーや機会損失につながります。 Owl Smart Levels は単にレベルを表示するだけではなく 、市場構造とプルバックに基づいてゾーンを形成します。これにより、エントリーポイントを異なる視点で評価でき、一部の誤シグナルを回避できます。 Owl Smart Levels システムに含まれるもの Owl Smart Levels は単なるレベルの表示ではなく、各要素が連携する 完全なトレードモデル です。 内容は以下の通りです: Owl Smart Levels(インジケーター) トレンド方向、プルバックゾーン、事前定義されたエントリー・StopLoss・TakeProfitレベルを表示 システムガイド 実際のトレードでのシグナルの扱い方を解説:どの状況を考慮し、どれを回避し、どのようにトレードを管理するか トレード判断チェックリスト シグナルを迅
このプロダクトを購入した人は以下も購入しています
SMART TREND TRADING SYSTEM — 特別オファー トレードシステム、自動化EA、学習コンテンツとサポートをひとつに。 MT5用のSmart Trend Trading Systemを99米ドルでご購入いただくと、シグナルの自動売買に使える Smart Universal Expert Advisorを無料でプレゼント します。 STTSは、トレンドの方向、エントリー・決済シグナル、反転ゾーン、重要な価格水準をチャート上にまとめて表示します。システムを参考に手動で取引することも、付属のEAを接続し、ご自身で選んだ設定に基づいて自動売買することもできます。 現在の99米ドルという価格は、これからの30件の購入に適用されます。その後、価格は149米ドルに上がります。 充実のパッケージ内容 ご購入には以下が含まれます。 • MT5用Smart Trend Trading System。 • Smart Universal Expert Advisor — 無料。 • STTSの完全版PDFユーザーマニュアル。 • STTS公式オンラインコース。 • インストールと
Trend Sniper X
Sarvarbek Abduvoxobov
4.9 (39)
Trend Sniper X は、トレードの方向性と潜在的な反転ポイントを明確かつ正確に特定するのに役立つ、MetaTrader 5 用のマルチタイムフレーム・トレンドフォロー指標です。 MT4用: https://www.mql5.com/en/market/product/193245 価格情報: 現在の価格はプロモーション価格であり、今後のアップデートや新機能のリリースに伴い変更される場合があります。 ボーナス特典: このインジケーター用の無料自動売買アシスタントEAを入手するには、購入後に an 著者(開発者)へメッセージをお送りください。 Code2Profit チャンネル マルチタイムフレーム分析で相場をマスターしよう! Trend Sniper X で勝率を最大化する方法:重要なルールとセッションのコツ 技術仕様 プラットフォーム MetaTrader 5 インジケータータイプ マルチタイムフレーム・トレンドインジケーター 操作タイムフレーム あらゆるチャートタイムフレームに対応。個別に選択可能な上位タイムフレーム (M1–MN1) を搭載 主要銘柄 FX、ゴールド (X
ARIPoint
Temirlan Kdyrkhan
1 (4)
ARIPoint is a powerful trading companion designed to generate high-probability entry signals with dynamic TP/SL/DP levels based on volatility. Built-in performance tracking shows win/loss stats, PP1/PP2 hits, and success rates all updated live. Key Features: Buy/Sell signals with adaptive volatility bands Real-time TP/SL/DP levels based on ATR Built-in MA Filter with optional ATR/StdDev volatility Performance stats panel (Success, Profit/Loss, PP1/PP2) Alerts via popup, sound, push, or email Cu
Gann Made Easy   は、ミスター・ギャンの理論を使用した取引の最良の原則に基づいた、プロフェッショナルで使いやすい外国為替取引システムです。 W・D・ガン。このインジケーターは、ストップロスとテイクプロフィットレベルを含む正確な買いと売りのシグナルを提供します。 PUSH通知を利用して外出先でも取引可能です。 ご購入後、取引方法の説明と優れた追加インジケーターを無料で入手するには、私にご連絡ください! おそらく、ギャンの取引手法についてはすでに何度も聞いたことがあるでしょう。通常、ギャンの理論は初心者のトレーダーだけでなく、すでにある程度の取引経験がある人にとっても非常に複雑なものです。なぜなら、ギャンの取引手法は理論的にはそれほど簡単に適用できるものではないからです。私はその知識を磨き、最良の原則を私の外国為替インジケーターに組み込むために数年を費やしました。 このインジケーターは非常に簡単に適用できます。必要なのは、それをチャートに添付し、簡単な取引推奨事項に従うだけです。このインジケーターは常に市場分析の仕事を行い、取引の機会を探します。適切なエントリーポイントを検
Neuro Poseidon is a new indicator by Daria Rezueva. It combines precise trading signals with adaptive TP/SL levels - creating best possible trades as a result! Message me and get  Neuro Poseidon Assistant  as a gift to automize your trading process! What makes it stand out? 1. Proven profitability on all assets and timeframes 2. Only confirmed BUY and SELL signals present on the chart 3. Adaptive TP & SL levels generated by the software for each trade 4. Easy to understand - suitable for al
M1 SNIPER は使いやすいトレーディングインジケーターシステムです。M1時間足向けに設計された矢印インジケーターです。M1時間足でのスキャルピングのためのスタンドアロンシステムとして、また既存のトレーディングシステムの一部としても使用できます。このトレーディングシステムはM1時間足での取引に特化して設計されていますが、他の時間足でも使用できます。元々、この手法はXAUUSDとBTCUSDの取引用に設計しましたが、他の市場においても役立つと考えています。 インジケーターのシグナルは、トレンドの方向と逆方向に取引できます。インジケーターのシグナルを利用して両方向に取引するのに役立つ特別な取引テクニックをご紹介します。この手法は、特別な動的なサポートとレジスタンスの価格帯を利用することに基づいています。 ご購入後、M1 SNIPER矢印インジケーターをすぐにダウンロードできます。さらに、M1 SNIPERツールのすべてのユーザーに、以下のスクリーンショットに表示されているApollo Dynamic SRインジケーターを無料で提供しています。この2つのインジケーターを組み合わせることで
伝説が帰ってきました:Entry Points Pro 10。 MQL5 Marketのトップ3に3年間入り続けた伝説的インジケーターの再始動です。 2つのバージョンで合計589件の高評価レビュー、毎日数千人のトレーダーが実際のトレードに使用し、デモのダウンロードは31,000件以上   MT4+MT5 。 私はこの5年間に寄せられたレビューをすべて読み、約束を並べる代わりに、その答えをバージョン10に組み込みました。1999年から相場に携わり、 誠実さ、自らの評判、そして顧客を大切にする 作者による製品です。 Entry Points Proのエントリーシグナルは、リペイント(再描画)を一切行いません。 そして今回初めて、これは作者の言葉ではなく検証可能な事実になりました。確定シグナルはローソク足の終値確定後にのみ表示され、自動テストで リペイントはゼロ と確認されています(EURUSD、XAUUSD、BTCUSDで2,486,568回の不変条件チェック、違反0件)。検証方法は公開されており、ストラテジーテスターでご自身で再現できます。 ご購入後は、必ずすぐにダイレクトメッセージでご
Auto Optimized SpeedAngle は、継続的なウォークフォワード最適化(WFO:Walk-Forward Optimization)によりカーブフィッティング(過剰最適化)を排除した、機関投資家レベルのモメンタムベクトルシステムです。市場レジームの変化時に効果が低下する静的な入力に依存せず、アウトオブサンプル(OOS)検証を用いてパラメーターを動的に再キャリブレーションすることで、表示されるシグナルが単なる過去の偶然ではなく、確実な統計的優位性に基づいていることを保証します。 主な機関投資家向けフレームワーク ウォークフォワード最適化エンジン: ルックバック期間やしきい値の数千に及ぶ組み合わせを継続的にスキャンし、データをインサンプルとアウトオブサンプルに厳格に分離します。未検証のデータ環境において数学的優位性が証明された場合にのみ、新しいパラメーター設定を採用します。 定量的目的関数: 単なる純利益の追求ではなく、機関投資家レベルの安定性指標をターゲットとします。システム品質ナンバー(SQN)、期待値(1トレードあたりの平均Rマルチプル)、またはネットRの最適化を選
UNIX SCALPER — 特別オファー セットアップを見つけ、取引プランを確認し、取引方法を選ぶ。 MT5用UNIX Scalperを99米ドルで購入すると、シグナルを自動売買に活用できるSmart Universal Expert Advisorが無料で付属します。 UNIX Scalperは、市場分析、BUY/SELL/WAITの判断、Entry、Stop Loss、TP1、TP2の水準を、見やすいパネルにまとめています。取引プランに沿って手動で取引することも、付属のEAを接続し、ご自身の設定に従って自動執行することもできます。 現在の99米ドルの価格は、今後30件の購入に適用されます。その後、価格は149米ドルになります。 パッケージの内容 ご購入には以下が含まれます。 • MT5用UNIX Scalper。 • Smart Universal Expert Advisor — 無料。 • UNIX Scalperの完全版PDFユーザーマニュアル。 • UNIX Scalper公式オンラインコース。 • インストールと設定の手順ガイド。 • 購入者限定コミュニティへ
Welcome to ENTRY IN THE ZONE AND SMC MULTI TIMEFRAME / SPECIAL BENEFIT FOR OUR MQL5 CUSTOMERS  FREE ACCESS TO THE NEW TOOL —COMING SOON —   Learn More on Our Official Website : https://www.fableedge.net Entry In The Zone and SMC Multi Timeframe is a real-time market analysis tool based on Smart Money Concepts (SMC), designed to analyze market structure, price direction, and key trading zones. It supports both Single-Timeframe Analysis and Multi-Timeframe Analysis, providing a clearer view of the
ATOMIC ANALYST — 特別オファー 市場分析、自動化EA、学習コンテンツとサポートをひとつに。 MT5用のAtomic Analystを99米ドルでご購入いただくと、シグナルの自動売買に使える Smart Universal Expert Advisorを無料でプレゼント します。 Atomic Analystは、プライスアクション、トレンドの方向、エントリー・決済シグナル、損切り水準、複数の利確水準をチャート上にまとめて表示します。分析を参考に手動で取引することも、付属のEAを接続し、ご自身で選んだ設定に基づいて自動売買することもできます。 現在の99米ドルという価格は、これからの30件の購入に適用されます。その後、価格は149米ドルに上がります。 充実のパッケージ内容 ご購入には以下が含まれます。 • MT5用Atomic Analyst。 • Smart Universal Expert Advisor — 無料。 • Atomic Analystの完全版PDFユーザーマニュアル。 • Atomic Analyst公式オンラインコース。 • インストールと設
Power Candles V3 - 自己最適化型強弱インジケーター Power Candles V3は 、通貨や銘柄の強さを、適用されたすべてのチャート上で実行可能なトレードプランに変換します。単にローソク足を色分けするだけでなく、バックグラウンドでリアルタイムの自動最適化を実行し、目の前の銘柄に対して最適なストップロス、テイクプロフィット、およびシグナルの閾値を提示します。ワンクリックで実取引に適用でき、エントリーポイント、ストップロス、テイクプロフィットのラインが正確な価格位置にチャート上に表示され、方向性を示すアラートがリアルタイムで発動します。 このツールは、Stein Investmentsのエコシステムの一部です。  18種類以上のツールをすべて閲覧し、AIを活用したセットアップの推奨事項を入手し、  https://stein.investments でコミュニティに参加しましょう クローズしたバーごとに3,000回以上のトレードシミュレーション。9つの強さの状態。2つの戦略を並行してテスト。勝率の高い設定をワンクリックで適用。 なぜこれが必要なのか ほとんどの強
Adaptive Price Action Engine インジケーターを購入すると、EAが無料に マルチタイムフレーム対応・自己最適化トレンド&ローソク足パターン分析 市場環境は常に変化しており、すべてのPrice Actionパターンが、あらゆる市場環境で同じ価値を持つわけではありません。 Adaptive Price Action Engine は、変化する市場環境への適応を目的として、 トレンド構造、マルチタイムフレーム分析、ローソク足パターン、統計的最適化 を1つの分析フレームワークに統合しています。 2つのアダプティブモード Dual Alpha Trend Mode 低い時間足と高い時間足のAlpha Trendパラメータを自動的に探索し、直近の市場動向に合わせてトレンド判定を適応させます。 Candlestick + Alpha Mode Alpha Trendによる市場レジーム判定と、 22種類の強気・弱気ローソク足パターン を組み合わせます。すべてのパターンを同じように扱うのではなく、さまざまなパターンの組み合わせを統計的に評価し、選択された市場環境において過去
通貨強さウィザードは、取引を成功させるためのオールインワン ソリューションを提供する非常に強力な指標です。このインジケーターは、複数の時間枠のすべての通貨のデータを使用して、このまたはその外国為替ペアのパワーを計算します。このデータは、使いやすい通貨インデックスと通貨パワーラインの形式で表され、特定の通貨のパワーを確認するために使用できます。 必要なのは、取引したいチャートにインジケーターを接続することだけです。インジケーターは、取引する通貨の実際の強さを示します。このインジケーターは、トレンドに合わせて取引するときに有利に利用できる売買高の圧力の極値も示します。このインジケーターには、フィボナッチに基づく可能なターゲットも表示されます。 このインジケーターは、PUSH 通知を含むあらゆるタイプのアラートを提供します。 購入後ご連絡下さい。私の取引のヒントをあなたと共有し、素晴らしいボーナスインジケーターを無料で提供します! 幸せで有益な取引をお祈りします。
M1 Quantum を使用したライブトレードシグナル : シグナル (取引は 自動的に Quantum Trade Assistant によって実行され、この製品に 無料 で含まれています。) 最新ニュース: バージョン1.64がリリースされました。現在、すべての取引で、関連するサポート/レジスタンスゾーンの後ろにStop Lossが設定されます。今回のバージョンでは、EAのパフォーマンスを向上させるためにSmart Close機能も改善されました。 8月9日から、ライブシグナルはバージョン1.64で稼働しています。 価格プラン: 現在価格: $169 (早期購入者向けオファー) 次回予定価格: $189 予定小売価格: $299 開発者からのお知らせ: ご購入後、 最新の推奨設定ファイル(Set File) 、運用アドバイス、および他の M1 Quantum ユーザーと交流できる VIPサポートグループ への招待をご希望の場合は、お気軽にご連絡ください。 よくある質問 - 設定ファイル - インストールガイド M1 Quantum は、M1専用のプロフェッショナルトレーディング
トレンドトレーディング は、タイミングのプルバックとブレイクアウトにより、市場で起こっているトレンドから可能な限り利益を得るように設計された指標です。確立されたトレンドの中で価格が何をしているかを分析することにより、取引の機会を見つけます。 [ インストールガイド | 更新ガイド | トラブルシューティング | よくある質問 | すべての製品 ] 自信を持って効率的に金融市場を取引する むち打ちにならずに確立されたトレンドから利益を得る 収益性の高いプルバック、ブレイクアウト、早期の逆転を認識する この指標は、独自の品質とパフォーマンスを分析します 複数時間枠のダッシュボードを実装します インジケーターは再描画されていません 電子メール/音声/視覚アラートを実装します 確立されたトレンドは多くの取引機会を提供しますが、ほとんどのトレンド指標はそれらを完全に無視しています。インジケーターの解釈はかなり簡単です: (1) トレンドの変化 (2) トレンドの方向への後退 (3) トレンドの方向へのブレイクアウト 赤いダッシュ は下降トレンド中の修正です 青いダッシュ は上昇トレンド中
Scalper Vault は、スキャルピングを成功させるために必要なすべてを提供するプロフェッショナルなスキャルピング システムです。このインジケーターは、外国為替およびバイナリー オプションのトレーダーが使用できる完全な取引システムです。推奨される時間枠は M5 です。 システムは、トレンドの方向に正確な矢印シグナルを提供します。また、トップとボトムのシグナルとギャン マーケット レベルも提供します。 インジケーターは、プッシュ通知を含むすべてのタイプのアラートを提供します。 インジケータの購入後にご連絡ください。私の個人的な取引の推奨事項と素晴らしいボーナス指標を無料で共有します! 幸せで有益な取引をお祈りします!
このインジケーターを購入された方には、以下の特典を 無料 で提供しています: 各トレードを自動で管理し、ストップロスとテイクプロフィットを設定し、戦略ルールに基づいてポジションを決済する補助ツール 「Bomber Utility」 様々な銘柄に合わせたインジケーターの設定ファイル(セットファイル) 「最小リスク」、「バランスリスク」、「待機戦略」 の3つのモードで使用できる Bomber Utility 用の設定ファイル このトレーディング戦略をすぐに導入・設定・開始できる ステップバイステップのビデオマニュアル ご注意: 上記の特典を受け取るには、MQL5のプライベートメッセージシステムを通じて販売者にご連絡ください。 オリジナルのカスタムインジケーター 「Divergence Bomber(ダイバージェンス・ボンバー)」 をご紹介します。これは、MACDのダイバージェンス(乖離)戦略に基づいた 「オールインワン」型のトレーディングシステム です。 このテクニカルインジケーターの主な目的は、価格とMACDインジケーターの間に発生するダイバージェンスを検出 し、将来の価格の動きを示
UZFX {SSS} スキャルピング・スマートシグナル v5.0 MT5は、変動の激しい市場において正確かつリアルタイムのシグナルを求めるスキャルパー、デイトレーダー、スイングトレーダー向けに設計された、リペイントのない高性能な取引インジケーターです。(UZFX-LABS)によって開発されたこのインジケーターは、価格行動分析、トレンド確認、スマートフィルタリングを組み合わせることで、すべての通貨ペアおよび時間枠において、高確率の売買シグナル、警告シグナル、トレンド継続の機会を生成します。 トレードの判断に迷うのはもうやめましょう。明確さ、正確さ、そして規律ある市場執行を求めるトレーダーのために設計された、体系的なシグナルシステムに従い始めましょう。 間違いなく、MQL5で入手可能な最高のインジケーターの一つです。絶対に見逃さないでください!!「スマートなトレーダーのためのスマートシグナル」 最新バージョン5.0がリリースされました。価格は予告なく最大499.99ドルまで値上がりする可能性がありますので、チャンスを逃さないようお早めにお求めください!! 購入を決める前に!無料トライアル
SkyHammer Signal Pro Entry、SL、TP レベルを固定表示する、プロ仕様のノーリペイント・トレンドシグナルインジケーター SkyHammer Signal Pro は、明確で固定され、検証可能なシグナルを求めるトレーダー向けに設計された、構造的なトレンド・モメンタム系シグナルインジケーターです。 特に M1 と M5 などの短期時間足で最も効果を発揮します。 このインジケーターは、天井や底を予測するためのものではありません。シグナルを出す前に、確認された市場構造、トレンド方向、モメンタムの強さ、健全なボラティリティ、そしてターゲットまでの十分な値幅を確認します。 主な機能 固定シグナルメカニズム シグナルが確認されると、矢印、Entry、Stop Loss、TP1、TP2 の各レベルはチャート上に永久的に固定されます。 その後のローソク足の動きによって、シグナルが消えたり、移動したり、変更されたりすることはありません。 これにより、トレーダーは各シグナルを明確に確認でき、リアルタイム相場中にシグナルが消えるという一般的な問題を避けることができます。 完全な過去シ
The Oracle Pro
Ottaviano De Cicco
5 (1)
The Oracle Pro:MT5向け合成マルチタイムフレーム・バイアスエンジン ️ サマー・ローンチ・オファー — The Oracle Pro を 199 USD で(早期購入者向け)。価格は普及に応じて上昇します。最終価格 399 USD。 The Oracle Pro は、要求の高いプロのトレーダーのために作られた MetaTrader 5 向けのプレミアム・マルチタイムフレーム バイアスエンジン です。ひとつの問いに規律をもって答えます。すなわち、各タイムフレームの現在の方向バイアスは何か、その強さはどれほどか、そしてタイムフレーム同士はどれだけ一致しているか。すべては確定足のみで計算され、リペイントはありません。 The Oracle Pro はマルチファクター・コンセンサス・システムです。独自のインジケーターと最適化されたアルゴリズムを単一の高度なコンセンサス・ベクトルに統合し、それを単一のインジケーター・インスタンス内で現在足と上位足のスタックにわたって読み取ります。複数のチャートにばらばらのツールを積み重ねる代わりに、です。 これは Oracle コンセンサス手法
発見が困難で頻度が少ないため、分岐は最も信頼できる取引シナリオの1つです。このインジケーターは、お気に入りのオシレーターを使用して、通常の隠れた分岐点を自動的に見つけてスキャンします。 [ インストールガイド | 更新ガイド | トラブルシューティング | よくある質問 | すべての製品 ] 取引が簡単 通常の隠れた発散を見つけます 多くのよく知られている発振器をサポート ブレイクアウトに基づいて取引シグナルを実装します 適切なストップロスおよび利益レベルを表示します 設定可能なオシレーターパラメーター カスタマイズ可能な色とサイズ バー単位でサイズ別に分岐をフィルタリング パフォーマンス統計を実装します 電子メール/音声/視覚アラートを実装します 幅広い市場の見通しを提供するために、異なるオシレーターを使用して、干渉なしで同じチャートにインジケーターを何度もロードできます。このインジケーターは、次のオシレーターをサポートしています。 RSI CCI MACD オスマ 確率的 勢い 素晴らしい発振器 加速器発振器 ウィリアムズパーセントレンジ 相対活力指数 特に外国為替市場では、
Crystal Heikin Ashi Signals—Professional Trend & Signal Detection Indicator Advanced Heikin Ashi Visualization with Intelligent Signal System for Manual & Automated Trading Final Price: $149 ---------> Price goes up $10 after every 10 sales . Limited slots available — act fast . Overview User Guide PDF Crystal Heikin Ashi Signals is a professional-grade MetaTrader 5 indicator that combines pure Heikin Ashi candle visualization with an advanced momentum-shift detection system. Designed for both m
DayTrader PRO DayTrader PROは、ジョン・エリュース(John Ehlers)のラグuerreフィルターと強力な自動最適化エンジンを組み合わせた、高度なトレーディング・インジケーターです。固定されたパラメーターを使用するのではなく、直近の市場状況に基づいて最適な設定を自動的に検索するため、手動による絶え間ない調整をすることなく、変化する市場のボラティリティに適応できます。 本インジケーターは、明確な「買い(BUY)」および「売り(SELL)」シグナルを生成し、現在の市場ボラティリティから算出された適応型のストップロス(Stop Loss)およびテイクプロフィット(Take Profit)レベルを表示します。トレンド、効率レシオ(Efficiency Ratio)、ボラティリティ、およびローソク足フィルターが内蔵されており、精度の低いセットアップを排除し、シグナルの精度を向上させます。 リアルタイム・パフォーマンスパネルには、現在最適化されている設定、プロフィットファクター(Profit Factor)、勝率(Win Rate)、ドローダウン(Drawdown)、
Mahra Pro Indicator MT5 Overview Mahra Pro is a MetaTrader 5 chart indicator designed to support structured analysis of XAUUSD (Gold). It combines trend, momentum, volatility and price-structure conditions to identify potential buy and sell setups and display them directly on the chart. The indicator does not open, modify or close trades. All trading decisions and order execution remain under the user's control. Main features • Buy and sell signal arrows on the chart. • Fast and slow EMA lines w
Precision Spike Detector
Francisco Mandomo Simbine
5 (2)
Precision Spike Detector V3 – Institutional-Grade AI Trading System Attention: The price increases by US$50 for every 10 purchases.  Final price: US$599 Precision Spike Detector V3   is a   state-of-the-art, institutional-grade market analysis system   for   MetaTrader 5 , designed to detect   high-probability market movements   in synthetic indices such as   Boom, Crash, GainX, and PainX . After purchase, send me a private message to receive the optimized configuration files,  the installation
Volume Profile Multiple — アルゴリズム取引対応バッファ付き マルチブロック・ボリュームプロファイル 時間足を変えるたびにボリュームプロファイルを一つずつ描き直し、再計算する手間にうんざりしていませんか? Volume Profile Multiple は、チャート上に複数の連続したボリュームプロファイルを自動的に描画し、直近の表示範囲だけでなく、相場の各区間で機関投資家の関心が実際にどこにあったのかを明らかにします。 この指標が行うこと 本指標は価格履歴をN本のローソク足ごとのブロックに分割し(ブロック数と1ブロックあたりの本数は自由に設定可能)、各ブロックについて完全なボリュームプロファイルを計算します:コントロールポイント(POC)、バリューエリアの上限・下限(VAH/VAL)、高出来高ゾーンと低出来高ゾーン(HVN/LVN)です。結果として、ブロックごとの市場構造を視覚化したマップが得られ、実出来高に基づく蓄積ゾーン、サポート・レジスタンス、バリューエリア間の価格ローテーションの特定に役立ちます。 アルゴリズム取引にも対応 多くのボリュームプロファイル系
Quantum Direction は、市場の方向性を把握し、トレンドの初期変化を検出し、フィルタリングされたエントリーおよび決済シグナルを提供するために設計された、プロフェッショナルなトレンドフォロー型インジケーターです。 このインジケーターには、MQL5 Marketで無料提供されているプロフェッショナルな取引管理ツール Quantum Trade Assistant が含まれています。 Quantum Direction に直接接続し、有効なシグナルが表示されたときに自動的に取引を開始したり、設定された決済条件を満たしたときに取引を自動的に決済したりできます。 無料の Quantum Trade Assistant をこちらからダウンロード このインジケーターの主な特徴: マルチロジック・トレンド検出 — 複数の市場分析条件を組み合わせ、トレンドの始まりや方向転換の可能性を検出します。 セッションフィルター — 選択した取引セッションにシグナルを集中させ、市場の活動性とボラティリティが高い時間帯の取引機会を分析しやすくします。 上位時間足フィルター — 上位時間足を使用して市場の
Gold Beaver Signals は、プロのブレイクアウト・ロボットがゴールド市場のどこでエントリーするかを、実際に起こる前にチャート上に直接表示します。 ライブでの証明 これは約束ではありません。同じ戦略が、いつでも確認できる公開ライブシグナルで実際に稼働しています: https://www.mql5.com/en/signals/2375536 何をするのか、わかりやすく このインジケーターは、当社のトレーディング・ロボットと同じ方法でゴールドを監視します。重要な水準の下で価格の圧力が高まると、チャート上に ブレイクアウト・ライン を描きます: 価格の上の緑のライン — この水準をブレイクすればロボットは買います 価格の下の赤のライン — この水準をブレイクすればロボットは売ります 各ラインには ターゲット(T1、T2、T3) が付き、トレードの狙いが常にわかります 複数の戦略が同じ水準で一致すると、ラインは 太く(x2、x3) なります — より強いシグナルです ラインは決してリペイントも再描画もしません。 一度置かれた水準は、置かれた場所に正確に留まります — ロボット自
Gartley Hunter Multi - An indicator for searching for harmonic patterns simultaneously on dozens of trading instruments and on all possible timeframes. Manual (Be sure to read before purchasing) | Version for MT4 Advantages 1. Patterns: Gartley, Butterfly, Shark, Crab. Bat, Alternate Bat, Deep Crab, Cypher 2. Simultaneous search for patterns on dozens of trading instruments and on all possible timeframes 3. Search for patterns of all possible sizes. From the smallest to the largest 4. All fou
作者のその他のプロダクト
インディケータは、最も可能性の高いトレンドストップ/反転エリア、自信のあるトレンド移動エリアを計算します。 計算では次のことが考慮されます。 価格変動率; チャートの相対偏差角度。 価格変動の平均振幅。 その「コンフォートゾーン」を離れる価格。 ATRインジケーターの値。 インジケーターは、価格がストップ/リバーサルエリアに入るとアラートを生成できます。 設定 全長を描きますか? -チャートの最後まで領域を描画します。 Show StopUP-trend-上昇トレンドのストップ/反転エリアを表示します。 上昇トレンドを表示-自信を持って上昇トレンドの領域を表示します。 下降トレンドを表示-自信を持って下降トレンドの領域を表示します。 Show StopDOWN-trend-下降トレンドのストップ/反転エリアを表示します。 エリア変更のアラート-価格がトレンドストップ/変更エリアに入ったときにアラートを生成します。 次は、各商圏の色設定です。

フラットとトレンドを決定するための指標。 価格が2つのヒストグラムと2つの線(赤と青)のいずれかを下回っている場合、これは売りゾーンです。 このバージョンのインジケーターを購入するときは、1つの実際のアカウントと1つのデモアカウント用のMT4バージョン-ギフトとして(受け取るには、プライベートメッセージを書いてください)! 価格が2つのヒストグラムと2つの線(赤と青)のいずれかを上回っている場合、これは購入ゾーンです。 MT4バージョン: https//www.mql5.com/en/market/product/3793 価格が2つの線の間、またはいずれかのヒストグラムのゾーンにある場合、市場に明確な傾向はありません。簡単に言えば、市場は横ばいです。 インジケーターの動作は、スクリーンショットでより明確に示されています。
SuperTrend
Evgeniy Zhdan
2.5 (2)
The Supertrend Expert Advisor The Supertrend Expert Advisor with averaging elements. It has been developed during three months until I finally got good results. It is not a scalper. The minimum balance to start trading - 100 $. Is automatically adjusted to the 4 and 5-digit prices. Has an efficient risk management system. The lot and limit on the maximum lot is automatically calculated based on the settings specified in the EA. As a result, you have a complete automated trading system. Download
StarDust searches for divergences in the values of several indicators considering them as signs of flat and enters the market if a relatively steady trend is detected. The Expert Advisor trades "basic" symbols with a low spread. The best results are achieved on М15. The EA automatically adjusts to 4 and 5-digit quote flows. Settings Comment_to_orders – comment to a placed order. The field can be left blank if no comment is required. MM – enable money management with automatic setting of a worki
The EA catches the price when it moves against the trend in an effort to open an order in an opposite direction (direction of the main trend). Screenshots illustrate examples of entries and the strategy gist. The EA uses stop losses depending on values of ATR. Settings: Lot_ - if Risk_ = 0, the EA will trade this lot; Risk_ - risk per one trade. Stop loss is taken into account; koeff_ATR - coefficient multiplied by the ATR value to calculate stop loss (the bigger the value, the bigger stop loss
The FastBoom EA finds the most probable points of price pullback/reverse and places an order. It places averaging orders if the price moves further against take profit. Settings of the EA: Lots - initial lot; LotExponent - multiplier for following orders (Martingale). 1 - no multiplier. TakeProfit - take profit in points; Stochastic Settings InpKPeriod - K Period of Stochastic InpDPeriod - D Period of Stochastic InpSlowing - Stochastic Slowing LevHigh - level for sell positions of Stochastic L
The Expert Advisor calculates the double/triple divergence of volumes, and starts trading. It uses a unique formula of lot calculation, which greatly improves stability of trading. Recommended TF - 1h. Currency pair - EURUSD , but the EA can be used on any trading instruments which are not subject to high volatility. Settings mode - trading direction can be set manually; close - order close level (details on the screenshot); Step between orders - step between orders in points; Maximum orders -
The Expert Advisor opens orders from the horizontal line, the a trader can set on any level by dragging using the mouse or by changing the line properties. For example, when a horizontal line is above the current price, the EA will open a Buy order once the horizontal line is reached. And vice versa: If the line is below the current price, the EA will open a sell order once the line is crossed. A buy crossover of the line is: opening of the current candlestick below the horizontal line; the curr
SellerATR
Evgeniy Zhdan
5 (1)
The Expert Advisor only sells. Recommended currency pairs : EURUSD; GBPUSD; USDCHF; USDJPY; USDCAD; AUDUSD; EURGBP; EURAUD; EURCHF; EURJPY; GBPCHF; CADJPY; GBPJPY; AUDNZD; AUDCAD; AUDCHF; AUDJPY; CHFJPY; EURNZD; EURCAD; CADCHF; NZDJPY; NZDUSD. Timeframe: H1. Percent% manages closing both loss-making and profitable deals based on the account overall status. Using the EA on 23 symbols mentioned above allows the robot to cope with the drawdown in case of a long trend. While positions on some pairs
Illusion
Evgeniy Zhdan
3 (2)
The Illusion EA uses the probability theory - after a series of consecutive virtual losses - i.e. right during a flat the EA already starts trading in the trend. In addition, the EA considers the ratio of bullish/bearish candles on the higher timeframes to determine the greatest probability of the price movement direction. Only 1 order can be opened at a time. In case of a loss the following order will be placed with an increased lot (the multiplication coefficient is set in the parameters). The
The indicator plots a trend line and determines the levels for opening trades, in case the price goes "too far" away from the trend level. More detailed information is available in the screenshots. Settings Away from the trend line - distance from the trend line to the trades level; Arrow Signal for deals - enable displaying an arrow when the price reaches the trades level; Size of Arrow - size of the arrow; Alert Signal for deals - enable generating alerts when the price reaches the trades lev
Turbina
Evgeniy Zhdan
5 (4)
The axiom of the Forex market is that any trend will be broken. The Expert Advisor determines trend direction (the pink line), and calculates levels for opening opposite orders depending on the settings. The value of Away from the trend line for Deal will be different for each pair and timeframe, depending on the volatility of the trading instrument. Next orders can be opened with an increased lot (a static lot is used by default). See the screenshots to understand the idea of the Expert Advisor
The Expert Advisor determines the moments of strong movements and opens a position in the direction of the most probable price movement. The strategy always uses stop loss and take profit. Several independent orders can be in the market (the maximum number is set in parameters). The goal of the EA's underlying trading system is the quantitative excess of the number of profitable deals over the number of losing ones. Recommended: EURUSD 5m; GBPUSD 5m; USDJPY 5m. The Expert Advisor is able to work
Vise is a trend indicator. The upper and lower lines follow the price showing the prevailing price direction. Frequent breakthroughs of the upper line indicate a bullish trend, while frequent breakthroughs of the lower line indicate a bearish one. Parameters Points for UpLine - initial number of points for the upper line; Points for DownLine - initial number of points for the lower line. During the breakthrough of the upper level (line), this level shifts upwards by Points for UpLine. If the up
Twinkle is a trend-based scalper using stop loss and take profit invisible to the broker. The EA does not look for trend reversals. The EA catches strong market movements and opens orders in the direction of the trend. Your broker will not see the order closing levels. The EA closes orders independently when reaching the take profit or stop loss levels specified in the settings. Recommended trading symbols: EURUSD M5, GBPUSD M5. ECN accounts with 5 digits quotes are recommended. Expert Advisor
Shine
Evgeniy Zhdan
4.75 (4)
This Expert Advisor implements elements of the Martingale system. Orders are opened at a specified distance from the moving average. The Parabolic SAR indicator and certain technical details are used to ensure the most accurate entries. The EA is highly customizable. It is recommended for simultaneous use on 4 currency pairs: EURUSD M15; GBPUSD M15; USDJPY M15; USDCAD M15. Despite good stability, it is advisable to disable the EA operation during the days rich in news releases. Configurations P
LuckyCase is an Expert Advisor with martingale elements. The EA strategy is based on a significant "deviation" of the price from SAR inadicator and the Bands levels breakthrough point. The money management system is an essential part of the EA. It starts working after a trade is opened. Trades are closed after accumulating specified points of market orders, by deposit % or after an opposite side of the channel is broken through. The default EA settings are meant for: EURUSD M15; USDJPY M15. The
The Elize Expert Advisor has been designed to work with the EURCHF currency pair. It considers the peculiarities of this trading instrument, its behavior and dependence on the behavior of other currencies. In particular, when the currencies of the European countries (EURUSD, GBPUSD, EURNOK, EURCHF) move in the same direction, the EA starts its operation and opens a deal in the trend direction of the European currencies. In the event of price rollbacks, the EA uses a unique method for making the
Brief Description of the All Trend Lines Indicator The indicator analyzes the wave structure of the market. What it displays on the chart: First. Wave pivots (semaphores) • Red markers – wave highs • Yellow markers – wave lows • Yellow-green markers – additional local extremes Second. Trend lines • Purple/blue lines – trends based on highs (resistance/support) • Beige/green lines – trends based on lows • Lines are built automatically by connecting wave pivots of the same type Third. Main trend
The Expert Advisor has been specifically developed for trading gold (Spot Gold). The strategy is based on Fibo levels calculated from the previous (first) candle High/Low and the width of the current and lower timeframes channel. If important Fibo levels of different orders are located in a single price channel (within a spread), the EA defines this channel as the target for price movement and starts operation. Martingale and averaging are not used. Each order is independent and is accompanied b
The algorithm of this Expert Advisor determines the significant price levels, where the trend often turns into a flat or reverses. Stochastic Oscillator serves as an additional filter of overbought/oversold zones. The EA sets stop loss and take profit after opening an order. The underlying trailing strategy applies a trailing stop. The EA is recommended for simultaneously use on three trading instruments: EURUSD M5, GBPUSD M5, EURCHF M5. Settings: Comment to order - comment to orders. MaxRisk -
The Expert Advisor looks for technical analysis patterns formed on the higher (hourly) timeframe to start working on the 5-minute chart. Technical analysis patterns used: double top/double bottom, head/shoulders, flag, expanding/narrowing triangles. The Relative Vigor Index technical indicator is used as the filter for opening deals. It is based on the idea that on the bull market the closing price is, as a rule, higher, than the opening price. It is the other way round on the bear market. This
The Expert Advisor calculates the divergence on the current and higher timeframes. In case the divergences coincide, the EA starts its operation. Deals have strict take profit and stop loss levels. Each deal is managed by trailing stop. The strategy involves the use of a tight stop-loss. Therefore, losing deals and/or series of losing deals are not uncommon. This EA is not suitable for those who have difficulties coping with losing deals. The EA is recommended for simultaneous use on the followi
The Expert Advisor has been developed specifically for the features of the CHFJPY currency pair. The EA's algorithm determines the direction of the current trend and starts operation. In case of a price reversal within the current trend, the EA adds additional orders. If trend changes, the EA starts to work in the direction contrary to the initial grid of orders. If there were no conditions for closing orders and the trend direction changed again, the EA continues to work with the "first" grid o
The Expert Advisor algorithm determines on daily charts those candlestick patterns, which set the intraday trading direction. The trading EA determines how long the price is moving in overbought/oversold zones and starts working in the direction of the expected trend movement. Each position is accompanied with a tight stop loss and take profit. Only one active position can be open in the market. The EA was developed and tested using 99% quality quotes. The Expert Advisor has a built-in news filt
The strategy of this Expert Advisor is based on a hedging system, which implies placing opposite orders. The EA algorithm determines trend beginning and opens a position in the trend direction. In case of a wrong entry, the EA tries to neutralize the drawdown through opposite (hedging) orders at a preset interval (Coefficient of counter orders). Orders are closed when one of the two values ​​is reached - profit in percent or profit in points. The EA does not use lot increase. The EA wast tested
Советник работает по принципу хеджирования с периодическими "перекосами" в сторону трендовых направлений. Направления тренда советник определяет на основании стандартного индикатора Parabolic Stop and Reverse system (SAR). Уникальная стратегия установки балансирующих позиций позволяет избегать больших просадок даже при самых не благоприятных рыночных условиях. Параметры по умолчанию рекомендуется использовать на торговом инструменте: GBPJPY 15m. Разработка и оптимизация параметров производились
Snoot
Evgeniy Zhdan
5 (1)
This Expert Advisor works using a grid in the direction of a trend movement with the step between opened positions defined in the settings. The positions are closed by the total take profit. The Parabolic SAR standard indicator is used to filter order opening, which comes in the MetaTrader 4 package. The EA has been developed and tested using 99,9% quality of quotes. Operation of the EA in real time can be viewed in the signals . The best trading results have been achieved on CHFJPY M15. Settin
The Expert Advisor builds channels based on the data obtained using ATR and MA indicators according to the equations: Upper channel border = MA + ATR * (FIBO); Lower channel border = MA - ATR * (FIBO), where FIBO has the following values: Style of Trade - Aggressive = 1.61852; Style of Trade - Average = 3.26704; Style of Trade - Calm = 4.85556. Trades are opened inside the channel with the intervals defined in the settings. Long and short positions are opened independently. Positions are closed
The trading statistics indicator notifies the trader of the aggregate income of the trading account for different time intervals. The indicator has wide display settings on the graph. There is a choice of one of the two display languages on the chart- English and Russian. Settings Indicator language (ENG, RUS) - Select the language to display on the chart; To control the magic (-1: any magic) - Entering the Magic for control (-1: any Magic); Angle of indicator tie - Selecting the angle of the c
フィルタ:
レビューなし
レビューに返信