KT Asian Breakout Indicator MT5
- Indicators
-
KEENBASE SOFTWARE SOLUTIONS
 Keenbase Trading develops professional MetaTrader 4 and MetaTrader 5 indicators and Expert Advisors designed to help traders make more informed trading decisions.
 - Version: 1.1
- Updated: 28 May 2020
- Activations: 5
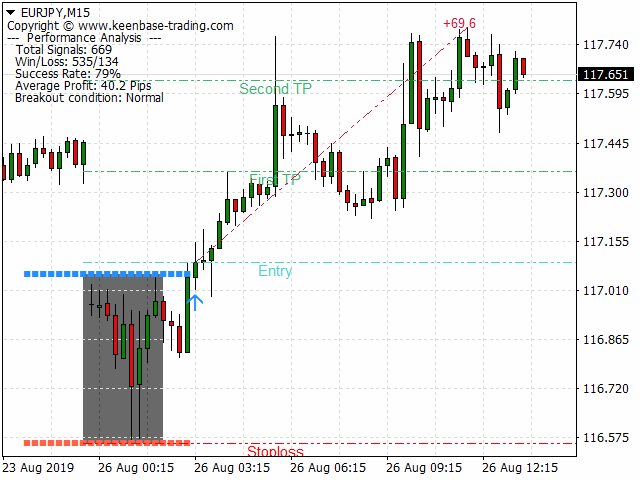
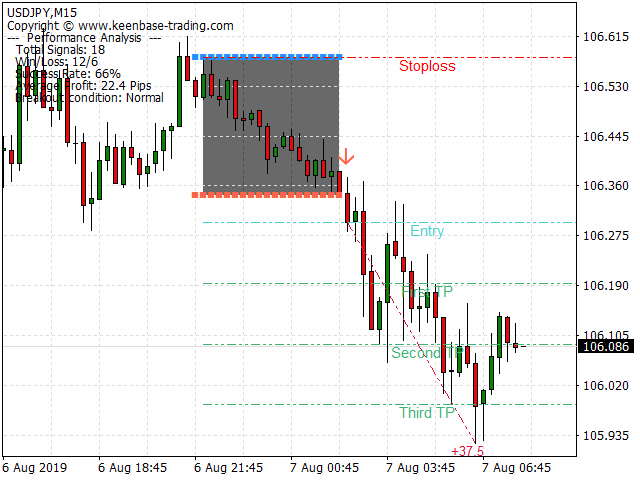
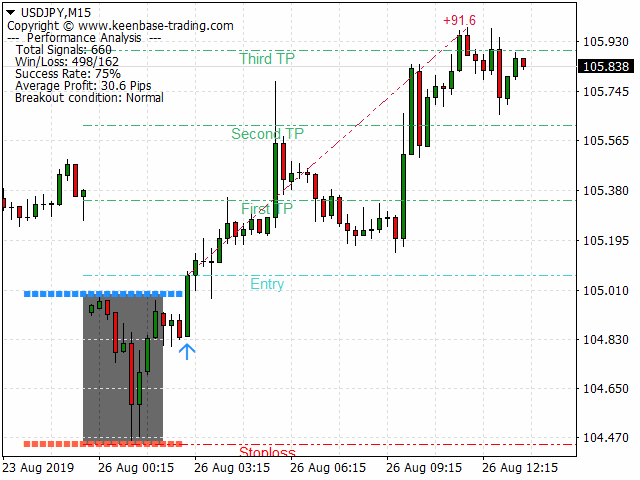
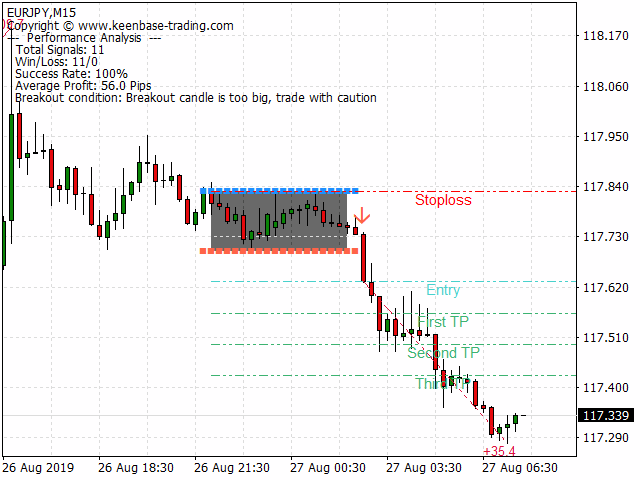
KT Asian Breakout indicator scans and analyzes a critical part of the Asian session to generate bi-directional buy and sell signals with the direction of a price breakout. A buy signal occurs when the price breaks above the session high, and a sell signal occurs when the price breaks below the session low.
Things to remember
- If the session box is vertically too wide, a new trade should be avoided as most of the price action has already completed within the session box.
- If the breakout candle is too big, the price often reverses temporarily before continuing to the signal direction.
Features
- Stoploss and profit targets are included with the buy/sell signals.
- KT Asian Breakout indicator constantly checks for its performance using the first, second, or third profit target as a success criterion.
- Displays three essential performance metrics like win/loss signals, success rate, and average pips per signal.
- If the breakout candle is too big, a warning message is displayed on the chart.
Recommendations
- Time-frame: 15 minutes.
- Pairs: All JPY pairs.
Input Parameters
- Draw Session Box: true/false
- Draw Stoploss and Profit Targets: true/false
- Performance Analysis: true/false
- Show Text Analysis(on the top left corner): true/false
- Success Rate Criterion: first-target | second-target | third-target
- Color and Style settings: self explanatory
- Alerts Settings: self explanatory
Developers
// define arrays
double Buy_Signal[];
double Sell_Signal[];
double Buy_Stoploss[];
double Sell_Stoploss[];

//define indicator handle
int indicator_handle = iCustom(_Symbol,0,"Market/KT Asian Breakout Indicator");

// Copy buffer into arrays
CopyBuffer(indicator_handle,0,1,1,Buy_Signal);
CopyBuffer(indicator_handle,1,1,1,Sell_Signal);
CopyBuffer(indicator_handle,2,1,1,Buy_Stoploss);
CopyBuffer(indicator_handle,3,1,1,Sell_Stoploss );

if(Buy_Signal[0]!=0) // Entry condition for Buy
if(Sell_Signal[0]!=0) // Entry condition for Sell
Buy_SL[0]; // Buy Stoploss
Sell_SL[0]; // Sell Stoploss

// Fetching targets from the chart
double Quick_Profit = NormalizeDouble(ObjectGetDouble(0,"KT_FTP",OBJPROP_PRICE),_Digits);
double First_Target  = NormalizeDouble(ObjectGetDouble(0,"KT_STP",OBJPROP_PRICE),_Digits);
double Final_Target  = NormalizeDouble(ObjectGetDouble(0,"KT_TTP",OBJPROP_PRICE),_Digits);