Axiom Stats MT4
- Indicators
-
Issam Kassas
 I’m Issam Kassas, the developer behind Issam Algo. I build MetaTrader 5 indicators and Expert Advisors for chart analysis and trading automation.
Current OFFER: Buy Smart Trend Trading System MT5 and receive Smart Universal Expert Adviser MT5 as a free bonus.
Smart Trend Trading System MT5: - Version: 1.0
- Activations: 20
Axiom Stats is a professional account statistics and performance-analysis dashboard for MetaTrader 4.
It reads your trading account data and transforms it into a complete visual breakdown of your performance, statistics, trades, risk, consistency, drawdowns, and account health—all inside one clean dashboard.
I built Axiom Stats because I wanted to understand the complete story behind a trading account.
Looking only at the account balance is not enough.
A profitable account can still have dangerous drawdowns.
A high win rate can hide poor risk management.
One large trade can make the entire month look successful.
A strategy can perform well overall while producing most of its losses on one symbol, one weekday, or one trading session.
I wanted one dashboard that could read the account, organize the data, identify strengths and weaknesses, and clearly show what is really happening behind the final profit or loss.
That is the idea behind Axiom Stats.
WHAT AXIOM STATS DOES
Axiom Stats analyzes your MetaTrader 4 account history and currently open positions.
It organizes your account information across seven dedicated pages:
-
Dashboard
-
Performance
-
Statistics
-
Analysis
-
Calendar
-
Trades
-
Risk
Instead of giving you a basic profit number, Axiom Stats helps you understand:
-
How much the account made or lost
-
How stable the performance has been
-
How much risk was taken
-
How deep the drawdowns became
-
How long recovery took
-
Which symbols produced the best and worst results
-
Whether long or short trades performed better
-
When the account performed best
-
Whether results are consistent or dependent on a few exceptional trades
-
What currently requires your attention
The objective is simple: turn complicated account history into useful information that a trader can understand and act on.
DASHBOARD
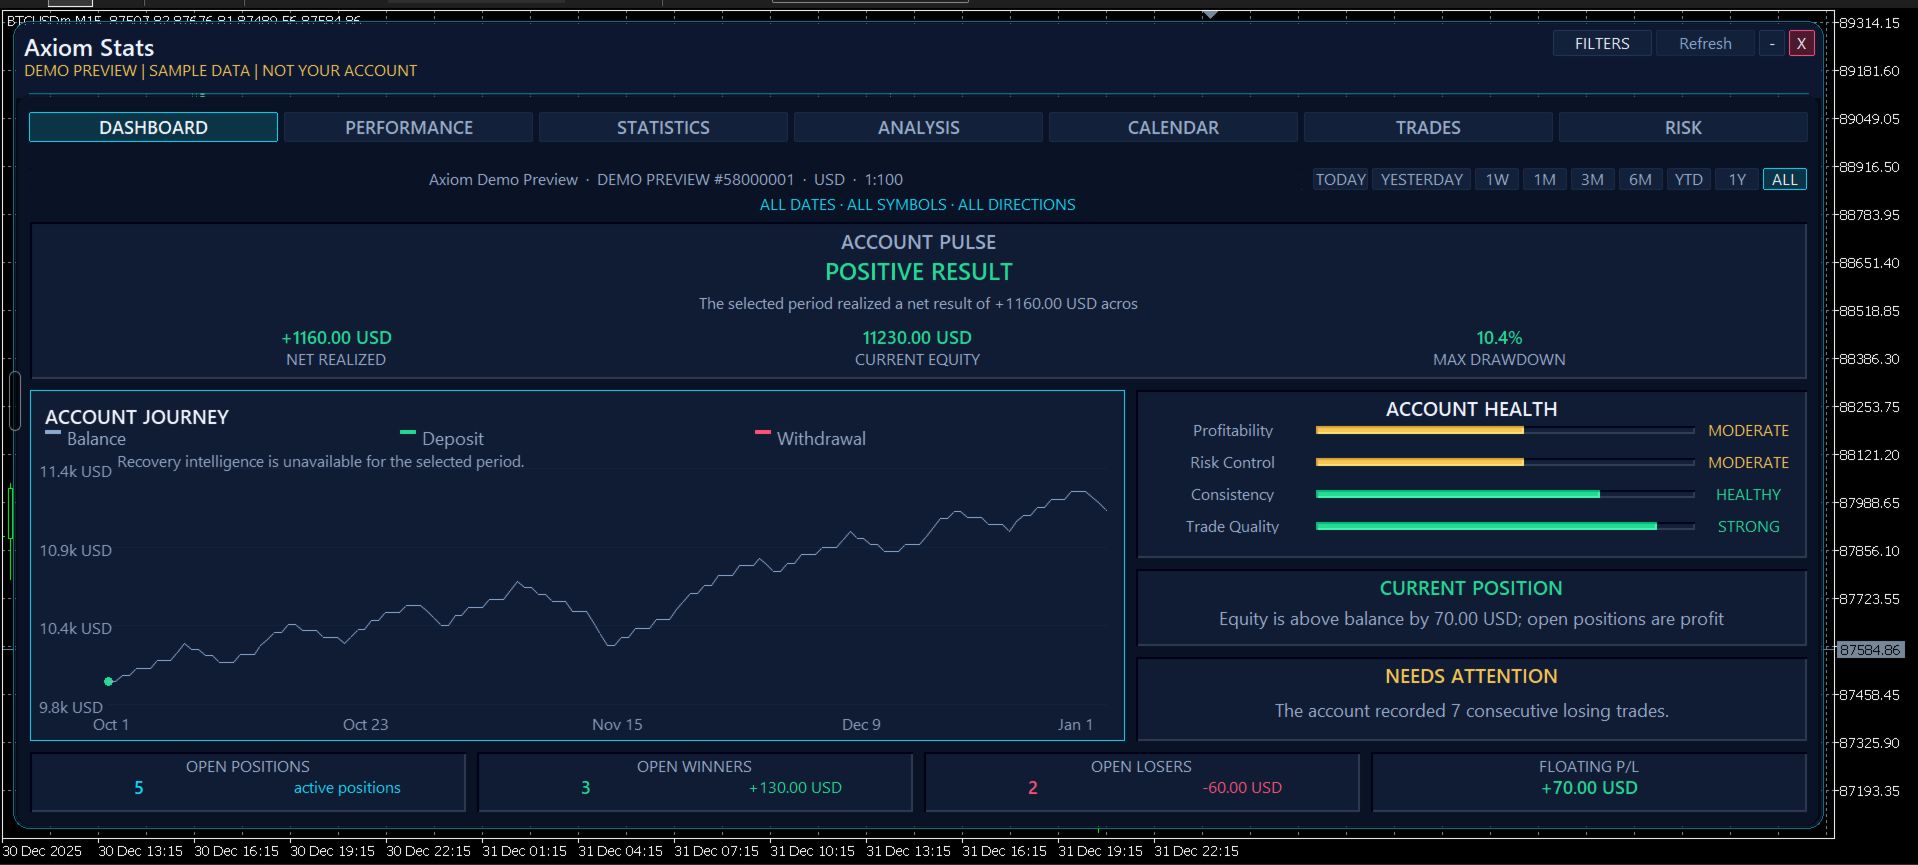
The Dashboard gives you a complete summary of the account from one page.
It brings together the most important information so you can understand the condition of the account without opening multiple reports.
The Dashboard includes:
-
Account Pulse
-
Account Journey
-
Net realized result
-
Current equity
-
Maximum drawdown
-
Account profitability
-
Risk control
-
Trading consistency
-
Trade quality
-
Account Health
-
Current Position
-
Needs Attention
-
Activity summaries
-
Realized and floating results
-
Trade counts and account briefings
The Dashboard is designed to answer one important question:
What is the condition of this account right now?
ACCOUNT PULSE
Account Pulse is the high-level verdict of the dashboard.
It evaluates the broader condition of the account and presents the result in a clear, beginner-friendly way.
Depending on the account data, it can help communicate whether the account is performing well, remaining stable, recovering, or operating under pressure.
It also provides a written explanation of the current result so the trader is not left looking at numbers without context.
Account Pulse is not a prediction and does not guarantee future performance. It is a structured interpretation of the account information currently available.
ACCOUNT JOURNEY
Account Journey visually shows how the account developed over the selected period.
It helps you see the relationship between:
-
Account growth
-
Profits and losses
-
Deposits and withdrawals
-
Drawdowns
-
Recovery
-
Balance development
-
Equity development
Instead of judging an account only by its final value, you can see the path it took to reach that value.
This makes it easier to identify smooth performance, unstable growth, prolonged drawdowns, sudden losses, and recovery periods.
ACCOUNT HEALTH
Account Health organizes several important areas of account performance into one visual assessment.
It examines areas such as:
-
Profitability
-
Risk control
-
Consistency
-
Trade quality
This helps you understand whether the account’s results are supported by healthy trading behavior or whether the final result hides an important weakness.
A profitable account is not automatically a healthy account.
Axiom Stats is designed to show the difference.
PERFORMANCE PAGE
The Performance page focuses on how the account’s financial results developed over time.
It includes performance measurements, charts, and monthly breakdowns that help you evaluate growth and stability.
You can analyze information such as:
-
Net profit or loss
-
Account return
-
Gross profit
-
Gross loss
-
Average trade
-
Profit Factor
-
Expectancy
-
Best and worst periods
-
Monthly results
-
Yearly results
-
Drawdown
-
Recovery
-
Performance quality
This page helps you determine whether the account’s performance was stable, improving, weakening, or heavily dependent on a small number of results.
STATISTICS PAGE
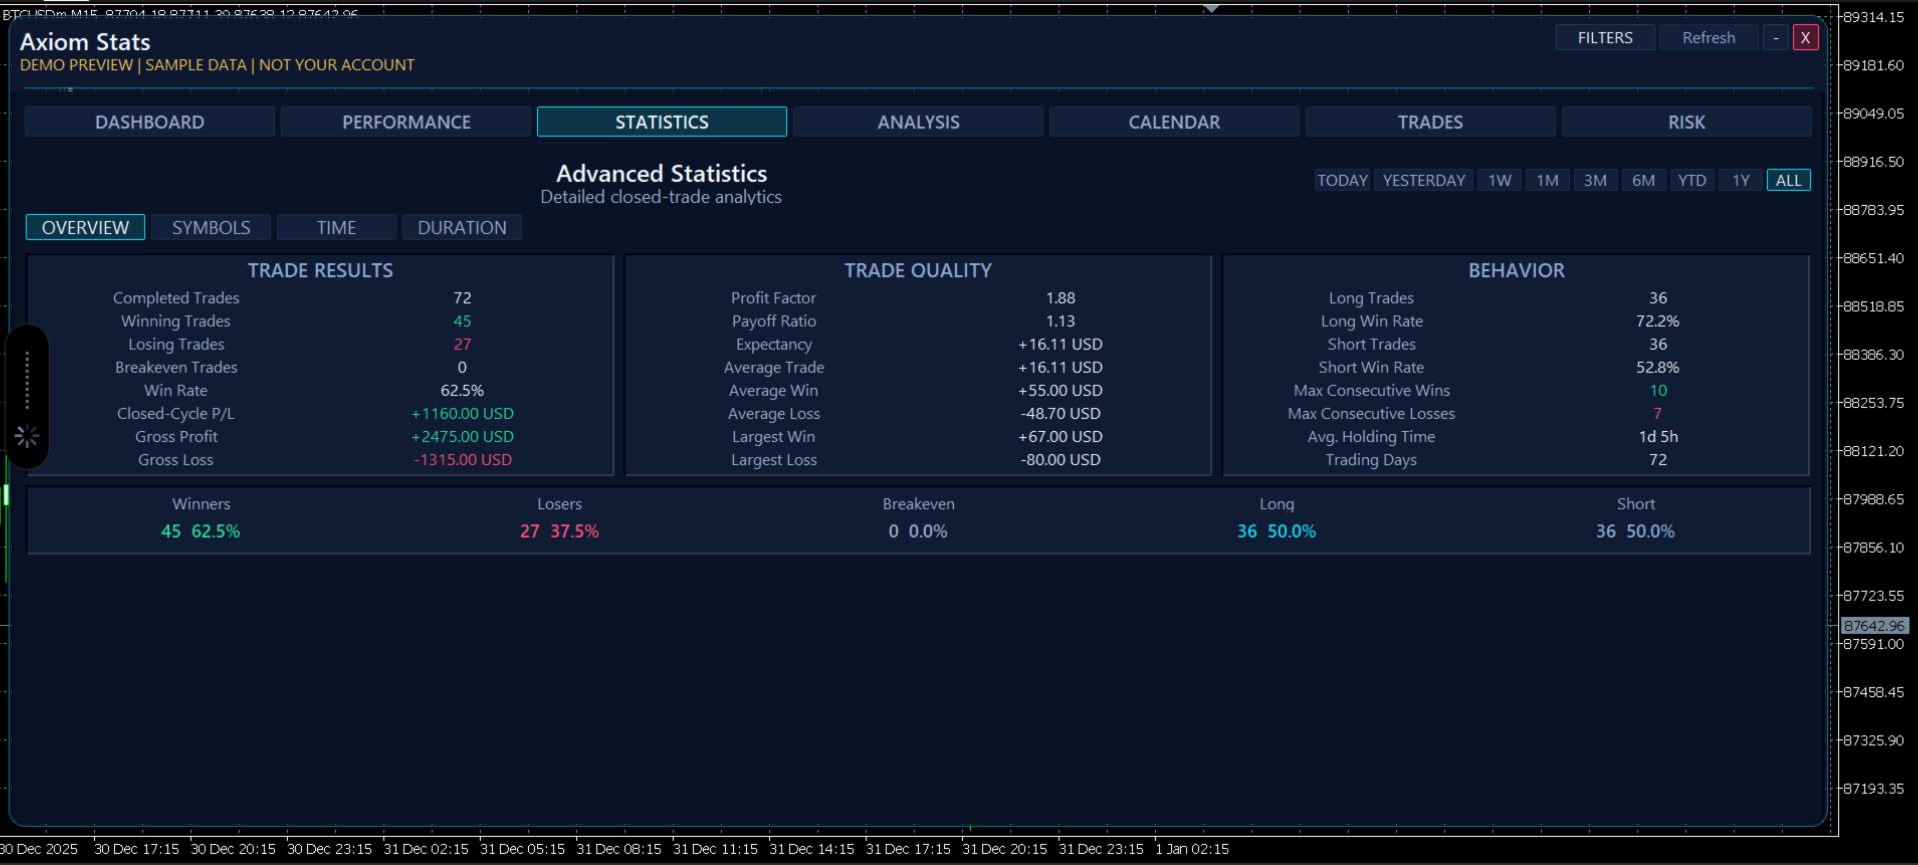
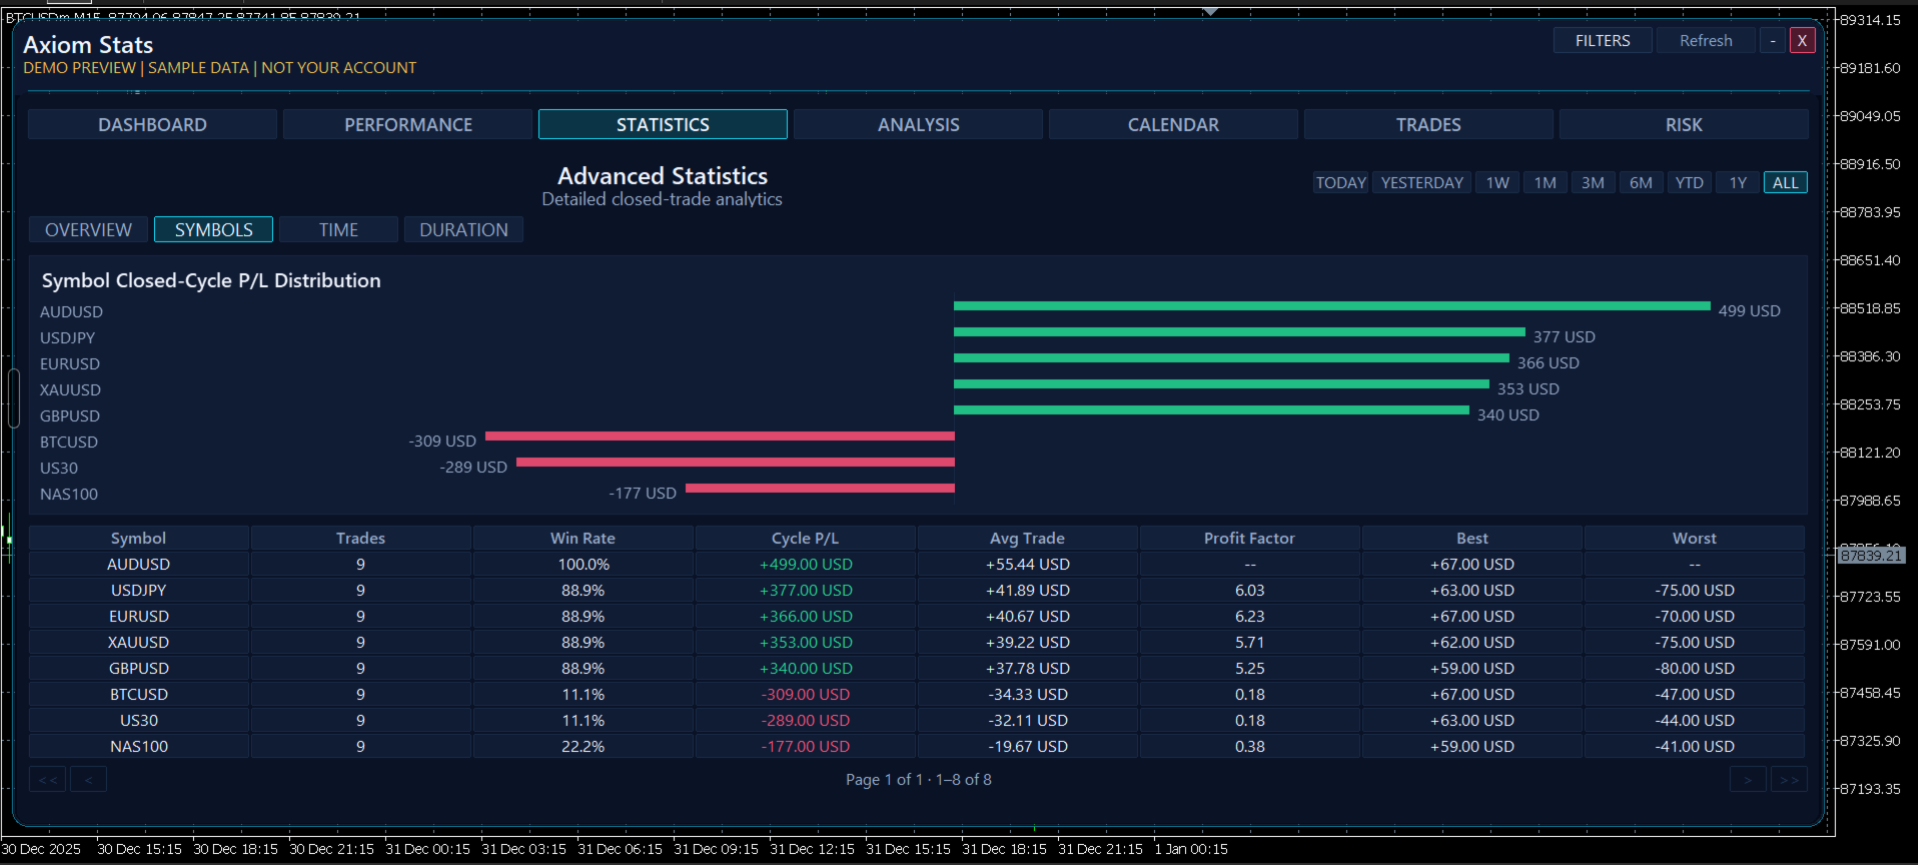
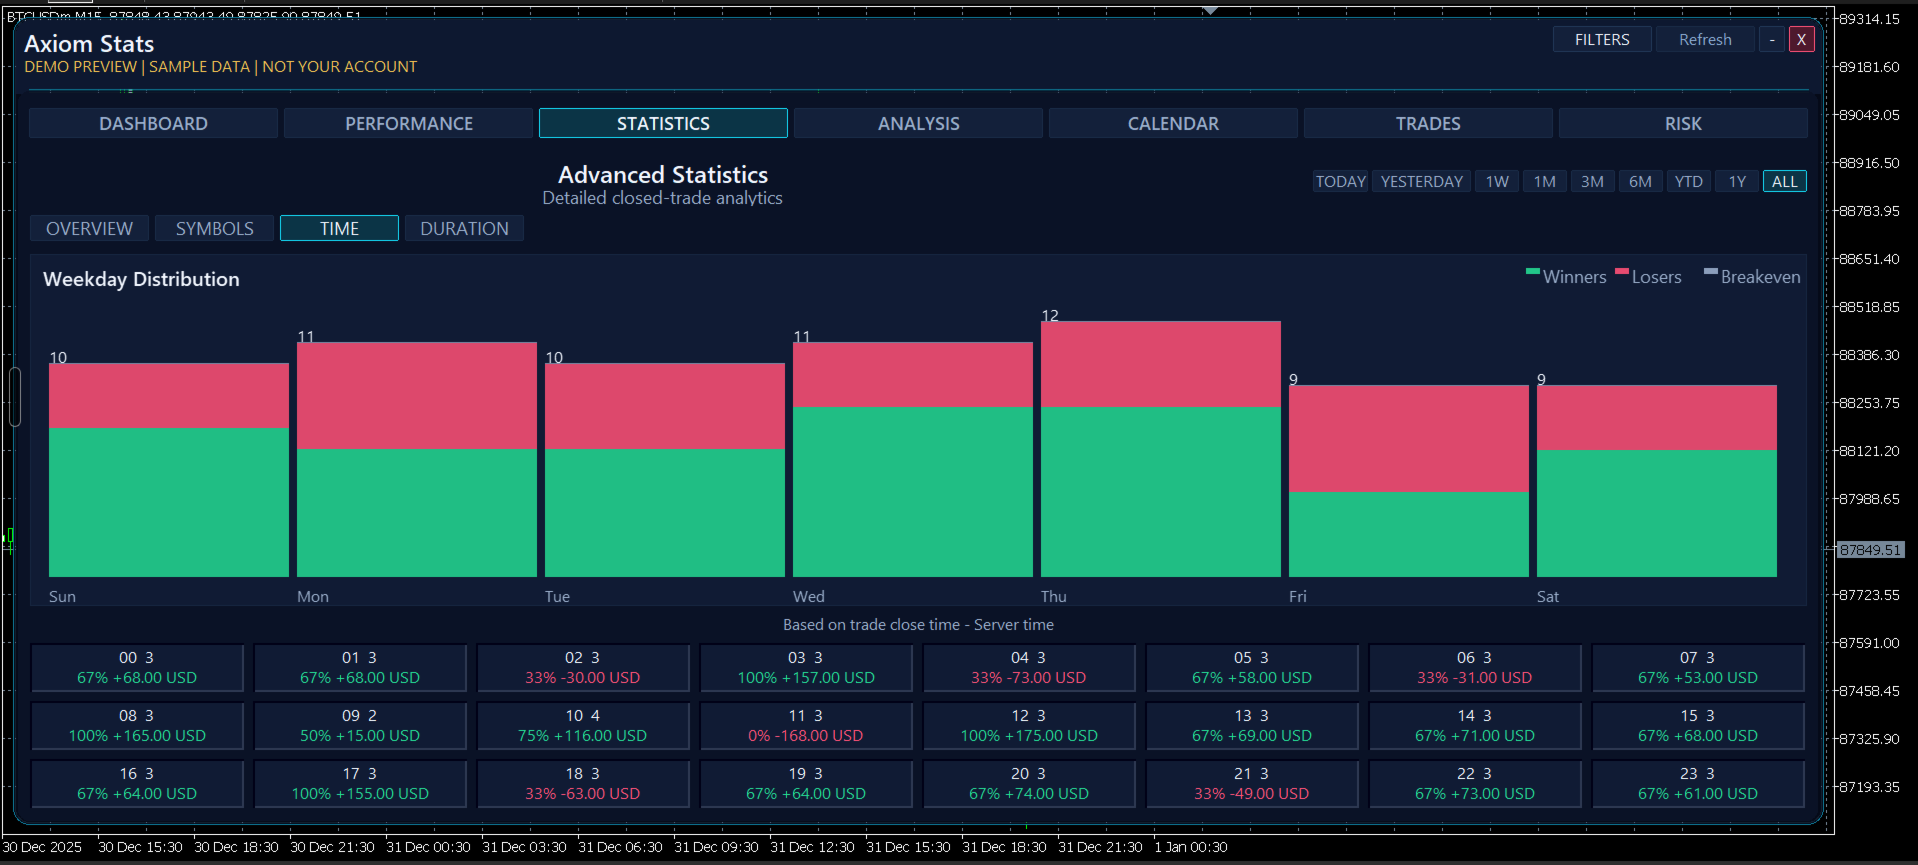
The Statistics page provides a deeper numerical breakdown of completed trading activity.
It helps you study the behavior of the trading history from several perspectives, including:
-
Overall trading statistics
-
Symbol performance
-
Long and short performance
-
Trading duration
-
Winning trades
-
Losing trades
-
Breakeven trades
-
Trade-result distributions
-
Percentiles
-
Average and median results
-
Volume
-
Holding time
Instead of showing only how much the account earned, the Statistics page helps explain how those results were produced.
ANALYSIS PAGE
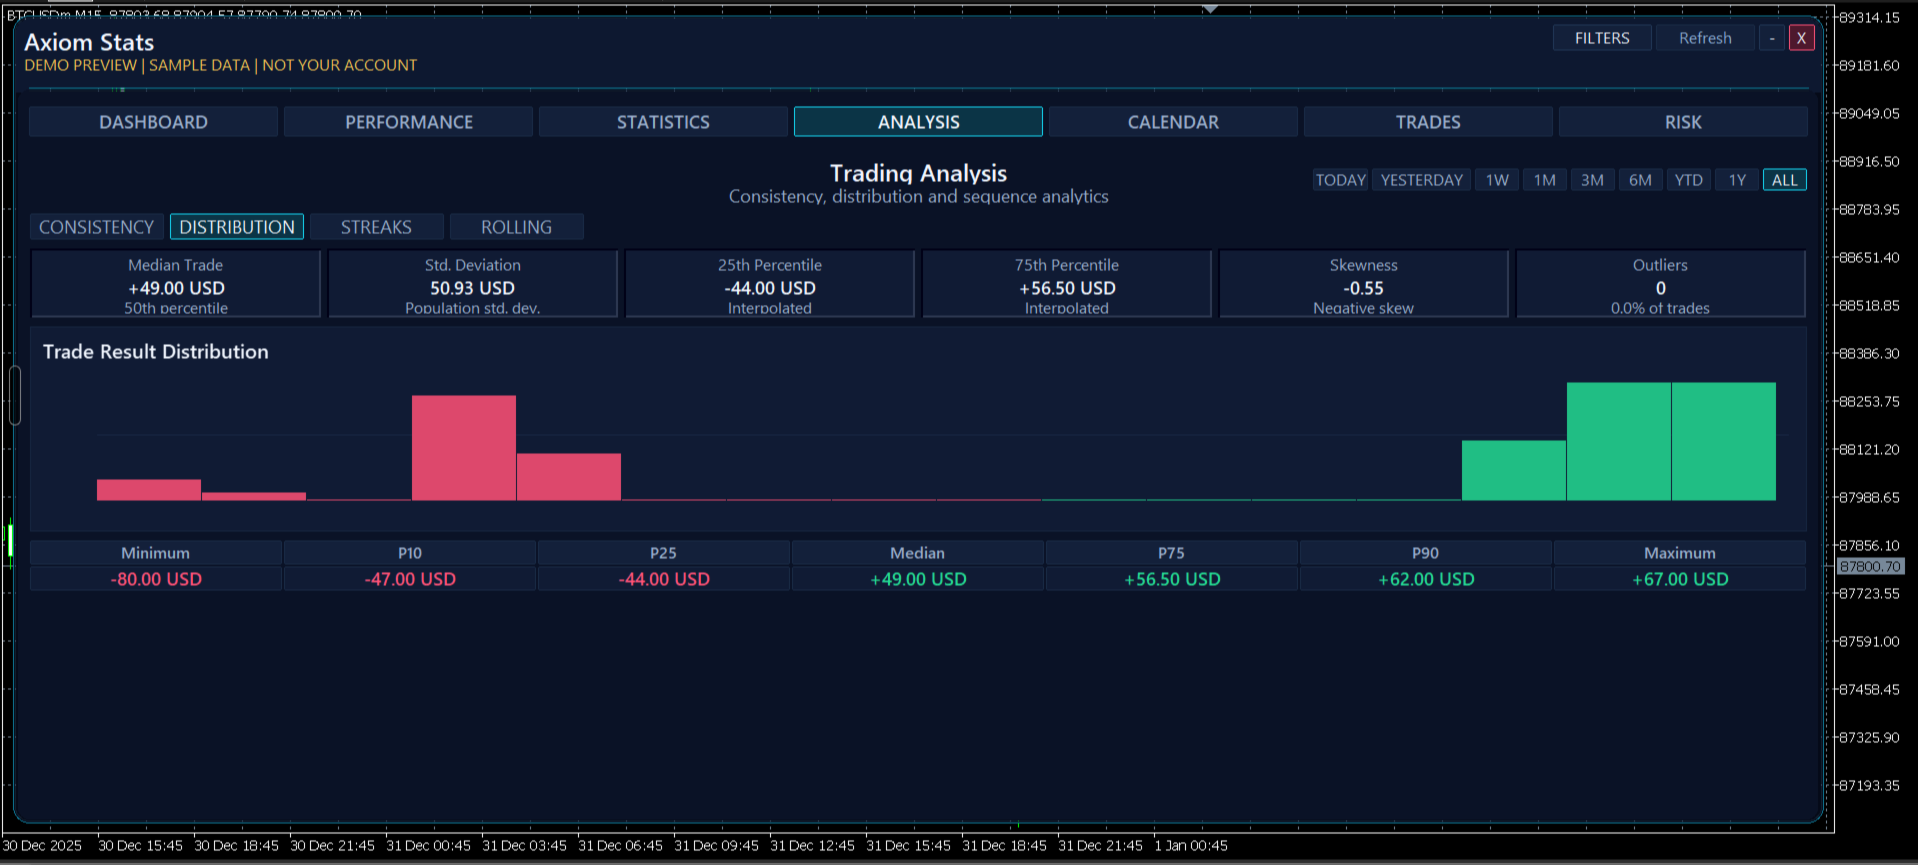
The Analysis page goes deeper into consistency, streaks, recovery, distributions, and rolling performance.
It includes advanced measurements such as:
-
Profitable Days
-
Profitable Weeks
-
Average Daily P/L
-
Daily Volatility
-
Best Day
-
Worst Day
-
Median Trade
-
Standard Deviation
-
25th Percentile
-
75th Percentile
-
Skewness
-
Outliers
-
Current Streak
-
Maximum Win Streak
-
Maximum Loss Streak
-
Average Win Streak
-
Average Loss Streak
-
Longest Recovery
-
Rolling Win Rate
-
Rolling Profit Factor
-
Rolling Expectancy
-
Rolling Cycle P/L
-
Best Window
-
Worst Window
The Analysis page can also help you examine performance by:
-
Symbol
-
Timeframe
-
Hour of day
-
Weekday
-
Trade duration
-
Rolling analysis windows
This page is designed for traders who want to look beyond surface-level statistics and understand the structure and consistency of their performance.
CALENDAR PAGE
The Calendar page organizes trading results by date.
It allows you to study performance using different calendar views, including:
-
Month
-
Year
-
Weekday
You can review:
-
Daily profit and loss
-
Daily return
-
Number of trades
-
Winning days
-
Losing days
-
Breakeven days
-
Active and inactive days
-
Monthly summaries
-
Weekday results
-
Selected-day details
The Calendar makes it easier to recognize patterns that may be difficult to see inside a normal account-history table.
For example, you may discover that the account performs well during certain periods but repeatedly struggles on a particular weekday.
TRADES PAGE
The Trades page gives you a detailed account of the trading activity used in the analysis.
It includes separate views for:
-
Closed trades
-
Deals
-
Cash activity
-
Open positions
Depending on the selected view, you can inspect information such as:
-
Ticket
-
Symbol
-
Direction
-
Trade type
-
Volume
-
Open time
-
Close time
-
Open price
-
Close price
-
Stop Loss
-
Take Profit
-
Commission
-
Swap
-
Fees
-
Other costs
-
Realized profit or loss
-
Floating profit or loss
-
Holding duration
-
Magic Number
The detailed table helps you move from the general account summary to the individual trades behind the result.
OPEN POSITIONS
Axiom Stats also monitors currently open positions.
This allows the dashboard to distinguish between:
-
Completed results
-
Current floating results
-
Closed trading activity
-
Live account exposure
The Current Position section helps you understand what is affecting the account now, not only what happened in the past.
Axiom Stats does not manage or close these positions. It displays and analyzes the available account information.
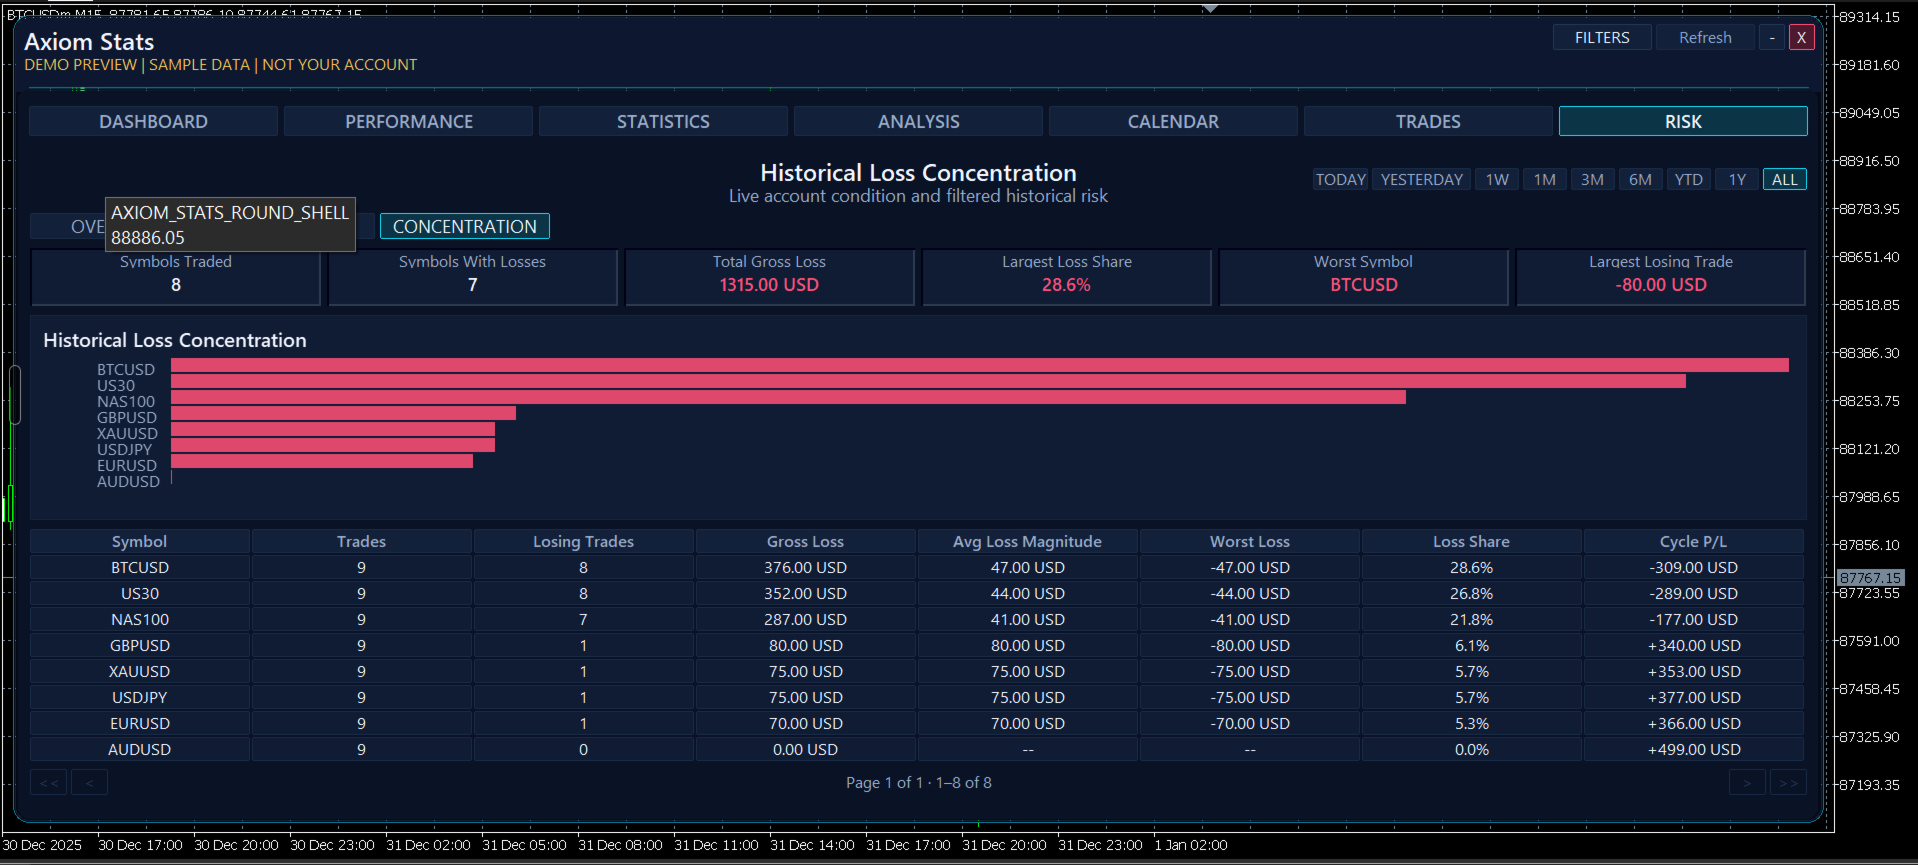
RISK PAGE
The Risk page focuses on the downside of the account.
It is designed to help you understand how losses developed, how concentrated they were, and how long the account remained below a previous peak.
The Risk page includes dedicated views for:
-
Risk Overview
-
Drawdown
-
Concentration
It can display information such as:
-
Current equity drawdown
-
Historical maximum drawdown
-
Drawdown depth
-
Monetary drawdown
-
Drawdown duration
-
Underwater time
-
Recovery time
-
Recovery Factor
-
Losing streaks
-
Margin level
-
Free margin
-
Symbol loss concentration
-
Gross loss
-
Loss share
-
Worst loss
-
Drawdown episodes
-
Recovery status
This helps you evaluate not only how much the account earned, but what the account had to endure to produce that result.
DRAWDOWN ANALYSIS
Axiom Stats does not treat drawdown as one isolated number.
It helps break drawdown events into important stages:
-
Start
-
Trough
-
Recovery
-
Drawdown depth
-
Monetary loss
-
Time underwater
-
Recovery time
-
Current status
This gives you a much clearer understanding of account risk.
Two accounts can have the same maximum drawdown but very different behavior. One may recover quickly, while the other may remain underwater for months.
Axiom Stats helps reveal that difference.
RISK CONCENTRATION
Risk Concentration shows whether too much of the account’s total loss came from one particular market.
You can analyze:
-
Gross loss by symbol
-
Each symbol’s share of total losses
-
Worst individual loss
-
Symbol contribution
-
Concentration ranking
A high concentration can indicate that one symbol or market is responsible for a disproportionate amount of the account’s losses.
This information may help traders identify where their strategy or trading behavior requires closer attention.
SELECTED PERIOD ANALYSIS
Axiom Stats allows you to analyze different periods instead of being forced to evaluate the complete account history every time.
Available period selections include:
-
1 Month
-
3 Months
-
6 Months
-
Year to Date
-
1 Year
-
All History
The selected period controls the date range used to calculate the displayed statistics.
This allows you to compare recent performance with longer-term account behavior.
For example, an account may be profitable overall but performing poorly during the most recent three months. Period analysis helps make that visible.
DEMO PREVIEW
Axiom Stats includes a Demo Preview mode that allows you to explore the dashboard and understand its pages even when the connected account does not contain enough trading history.
This makes it easier to learn the interface and see how the different sections work before analyzing a full account.
Demo Preview is clearly separated from real account analysis and does not alter your actual trading data.
CSV EXPORT
The Trades page includes CSV export functionality.
This allows you to export detailed account information for further review, recordkeeping, or external analysis.
The exported information follows the active data view and available account history.
BUILT-IN EXPLANATIONS
Axiom Stats is designed for both experienced traders and users who are still learning account statistics.
The dashboard includes detailed explanations for its important elements.
When you hover over a meaningful card, statistic, table header, or value, Axiom Stats explains:
-
What the information represents
-
Why it matters
-
How it should normally be interpreted
This makes advanced account statistics more accessible without forcing the user to research every financial term separately.
MAIN FEATURES
-
Professional MetaTrader 4 account statistics dashboard
-
Seven complete analysis pages
-
Account Pulse verdict
-
Account Journey visualization
-
Account Health assessment
-
Current-position monitoring
-
Needs Attention system
-
Balance and equity analysis
-
Realized and floating P/L
-
Return analysis
-
Profitability analysis
-
Drawdown and recovery analysis
-
Profit Factor
-
Expectancy
-
Win-rate analysis
-
Average and median trade results
-
Trade-result distribution
-
Percentile analysis
-
Daily and weekly consistency
-
Win and loss streak analysis
-
Rolling performance analysis
-
Symbol performance
-
Direction performance
-
Timeframe analysis
-
Hour-of-day analysis
-
Weekday analysis
-
Trade-duration analysis
-
Monthly and yearly performance
-
Trading calendar
-
Closed-trade history
-
Deals history
-
Deposits and withdrawals
-
Open-position table
-
Commission, swap, fees, and cost analysis
-
Risk overview
-
Drawdown-event table
-
Symbol loss concentration
-
Margin and free-margin information
-
Multiple period filters
-
CSV export
-
Demo Preview
-
Full and compact layouts
-
Beginner-friendly explanations
-
Adaptive dashboard design
WHO THIS PRODUCT IS FOR
Axiom Stats is designed for traders who want to understand their account beyond the final balance.
It is useful for:
-
Forex traders
-
Gold traders
-
Indices traders
-
Crypto CFD traders
-
Manual traders
-
Algorithmic traders
-
Expert Advisor developers
-
Strategy testers
-
Prop-firm traders
-
Signal providers
-
Account managers
-
Traders evaluating a new system
-
Traders working to improve consistency
-
Traders who want to identify hidden risk
-
Traders who want a professional MetaTrader 4 performance dashboard
WHAT AXIOM STATS IS NOT
Axiom Stats is not an Expert Advisor.
It does not open, modify, or close trades.
It does not copy trades.
It does not provide BUY or SELL signals.
It does not guarantee profitability.
It does not repair an unprofitable trading strategy.
It does not replace risk management or professional financial judgment.
Axiom Stats is a professional account-analysis and decision-support dashboard designed to help you understand trading performance more clearly.
ACCOUNT OVERVIEW
It brings together:
-
Performance
-
Statistics
-
Consistency
-
Calendar behavior
-
Individual trades
-
Current positions
-
Drawdowns
-
Recovery
-
Risk concentration
-
Account health
It does not only tell you what the account made.
It helps you understand how it made it, how much risk it took, where the weaknesses are, and what may require attention.
It is not simply an account statement.
It is an account-analysis cockpit inside MetaTrader 4.
QUICK START
-
Attach Axiom Stats to any MetaTrader 4 chart.
-
Allow it to read the available account history.
-
Select the period you want to analyze.
-
Start with the Dashboard and review Account Pulse.
-
Use Account Journey to understand the development of the account.
-
Open Performance to review financial results over time.
-
Use Statistics and Analysis for deeper performance evaluation.
-
Check Calendar for date-based patterns.
-
Open Trades to inspect individual activity and positions.
-
Use Risk to study drawdowns, recovery, and loss concentration.
-
Hover over important elements whenever you need an explanation.
-
Export trade information to CSV when required.
IMPORTANT NOTICE
Axiom Stats is an account-analysis and decision-support tool.
Past trading performance does not guarantee future results.
Statistics should always be interpreted in context. A high win rate, strong return, or profitable period does not automatically mean that an account or strategy is safe.
Always combine the information with your own judgment, trading plan, and risk-management rules.
For product questions, setup guidance, or technical support, message me directly here on MQL5.