Haven Market Structure PRO
- Indicators
-
Maksim Tarutin
 🔷 MQL5 Developer | Haven
------------------------------------------------------------
I develop trading tools for MetaTrader 5, including indicators, utilities, and Expert Advisors.
My main areas of interest are market structure, liquidity, price action, volatility, and systematic trading. - Version: 2.0
- Updated: 23 September 2026
- Activations: 10
Haven Market Structure PRO 2.0 — Market Structure at a Glance
Haven Market Structure PRO is an indicator for MetaTrader 5 that helps you read price structure, key levels and confirmed changes in market direction. Version 2.0 combines chart analysis with a compact HAVEN dashboard, so you can review market conditions and locate a level or event directly on the chart.
Other products -> HERE.
What’s New in Version 2.0?
-
Three structure ranks: ST, IT and LT. Short-term, intermediate-term and long-term structure are displayed separately, helping you distinguish local price movement from broader structural changes.
-
A five-tab HAVEN dashboard. Overview shows the current structure state; Timeframes compares structure across selected timeframes; Levels lists the nearest relevant levels and zones; Events shows recent confirmed BOS and CHoCH events; Alerts provides basic notification settings.
-
Chart layer controls. Show or hide ST, IT, LT, Liquidity, FVG, iFVG and Displacement independently. Chart Layers remain available below every dashboard tab.
-
Find an item on the chart. Click a level in Levels, an event in Events, or a structure item in Overview to highlight it temporarily in yellow on the chart.
What Does the Indicator Show?
-
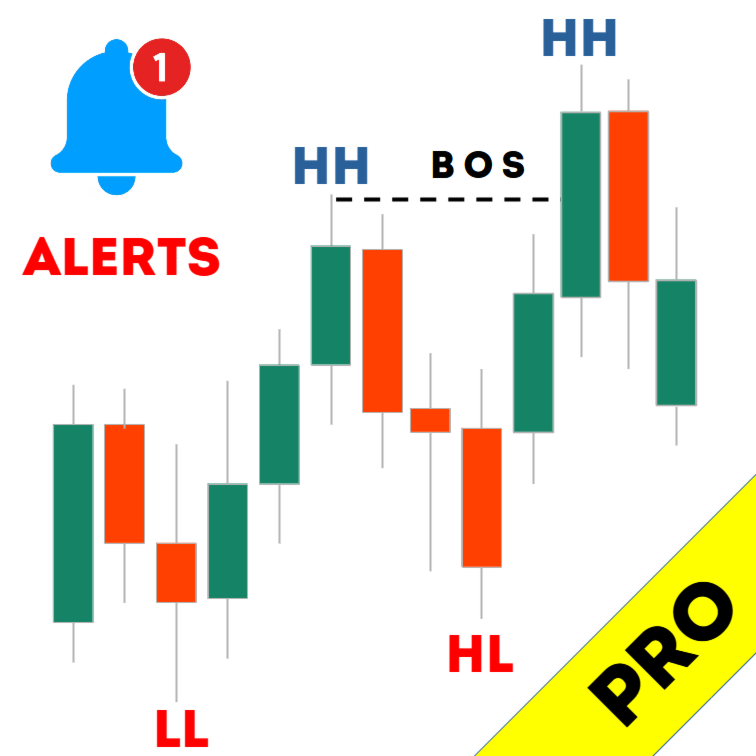
Swing points and market structure: Higher Highs (HH), Higher Lows (HL), Lower Highs (LH) and Lower Lows (LL) for the applicable ST, IT and LT ranks.
-
BOS and CHoCH: confirmed events that indicate continuation of the existing structure or a change in its character. The dashboard shows each event’s rank, direction and time.
-
Strong and Weak levels: current structural levels and protection status for each rank.
-
Liquidity: individual levels and Equal Highs / Equal Lows (EQH / EQL), with the price interaction status.
-
FVG and iFVG: Fair Value Gap zones and their inversions. Choose a display filter and how a zone is considered mitigated.
-
Displacement: highlights candles with a large body according to a configurable threshold. You can require FVG confirmation if needed.
The HAVEN Dashboard
Overview gives you a quick view of the current chart: ST / IT / LT direction, Strong and Weak levels, protection status and the latest structural event.
Timeframes lets you compare structure across selected timeframes. Levels shows the nearest relevant levels above and below the current price, as well as a zone containing the current price, if one is present. Events provides a compact list of recent confirmed BOS / CHoCH events.
You can scale or collapse the dashboard, or hide it entirely in Inputs. Chart analysis continues when the dashboard is hidden.
Focused Alerts
In the Alerts tab, enable terminal popups and mobile push notifications, choose BOS and/or CHoCH, and select the ranks you want to receive: ST, IT and LT. Notifications apply to confirmed events on the current chart timeframe. Hiding a visual chart layer does not disable notifications for that rank.
Getting Started
-
Add the indicator to a chart and open Overview to review the current ST / IT / LT direction.
-
Use Timeframes to compare structure across the timeframes you selected.
-
Open Levels to review nearby levels and zones. Click an item to highlight it on the chart.
-
Use Chart Layers to show only the chart elements you need. Configure notifications in the Alerts tab if desired.
Main Settings
-
Display Mode: choose Structure Map for a cleaner chart or Full Map for more detail.
-
HistoryBars: set how much historical chart markup to display.
-
Structure: configure the visibility of ST / IT / LT levels and events.
-
Timeframes: select the timeframe sources shown in the multi-timeframe tab.
-
Liquidity, FVG / iFVG and Displacement: configure the display and behavior of these analysis elements.
-
Colors and DashboardScale: customize chart colors and dashboard size.
Haven Market Structure PRO 2.0 is an analysis tool and does not open trades automatically. It presents market structure and related information; trading decisions remain yours. If you have questions about setup or product operation, please contact me through MQL5.














































Another great too added to my toolkit🔥