Haven Fibonacci Volume Profiles
- Indicators
-
Maksim Tarutin
 🔷 MQL5 Developer | Haven
------------------------------------------------------------
I develop trading tools for MetaTrader 5, including indicators, utilities, and Expert Advisors.
My main areas of interest are market structure, liquidity, price action, volatility, and systematic trading. - Version: 1.0
- Activations: 10
Haven Fibonacci Volume Profiles — Your Automatic Market Range Analyst
Introducing Haven Fibonacci Volume Profiles — a powerful tool that takes market analysis to the next level. This indicator automatically identifies key price ranges built on significant pivot points and overlays a detailed Volume Profile along with Fibonacci levels on each one. This allows traders to instantly see where liquidity is concentrated and where true support and resistance levels are located.
Other products -> HERE.
Stop guessing which range is relevant. The indicator does all the complex work for you, displaying both historical and the current price range, giving you a complete understanding of the market context.
Key Indicator Features
-
Automatic Range Detection: The indicator independently finds significant highs and lows (pivots) and constructs price ranges between them.
-
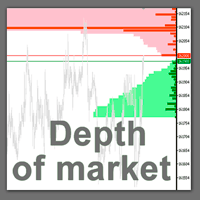
Detailed Volume Profile: For each range, a Volume Profile is calculated and displayed, highlighting zones with the highest and lowest trading activity.
-
Customizable Fibonacci Levels: Fibonacci levels are automatically applied to each range. You can enable, disable, and customize the color for each level (0.0, 0.236, 0.5, 1.0, and others).
-
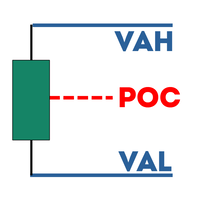
POC (Point of Control) Visualization: The Volume Profile clearly shows the level with the maximum volume, which often acts as strong support or resistance.
-
Historical Analysis: The indicator displays not only the current but also several previous price ranges, allowing you to analyze how the price has reacted to key levels in the past.
How Will It Help Your Trading?
With Haven Fibonacci Volume Profiles, you get a ready-made solution for comprehensive market analysis:
-
Identifying Key Levels: Forget about manual plotting. The indicator shows the most important support and resistance levels based on real trading volumes and classic Fibonacci levels.
-
Understanding Fair Value: High Volume Nodes (HVNs) and the Point of Control (POC) indicate "fair" price areas where the market has spent the most time. The price tends to return to these levels.
-
Finding Entry and Exit Points: Trade bounces or breakouts from Fibonacci levels reinforced by volume. Place stop-losses behind Low Volume Nodes (LVNs), where it is more difficult for the price to move through.
-
Saving Time: All information is plotted on the chart automatically and updated in real-time. You spend less time on analysis and more on making trading decisions.
Main Settings
-
pivlen: The depth for searching for pivots. A higher value means more global and significant ranges.
-
max_ranges: The maximum number of historical ranges to display on the chart.
-
Fibonacci Level Settings: Full control over the display of each Fibonacci level — enable/disable, value, and color.
-
show_volume_profile: Enable or disable the Volume Profile display.
-
profile_resolution: The detail of the Volume Profile. The higher the value, the more precise the distribution.
-
profile_width_ratio: The width of the Volume Profile histogram display.
-
profile_color1 / profile_color2: Customize the gradient color for the volume histogram for better visualization.



















































Cool tool ! I finally now have a VP for both HTF and LTF 🔥