Dynamic Scalper System MT5

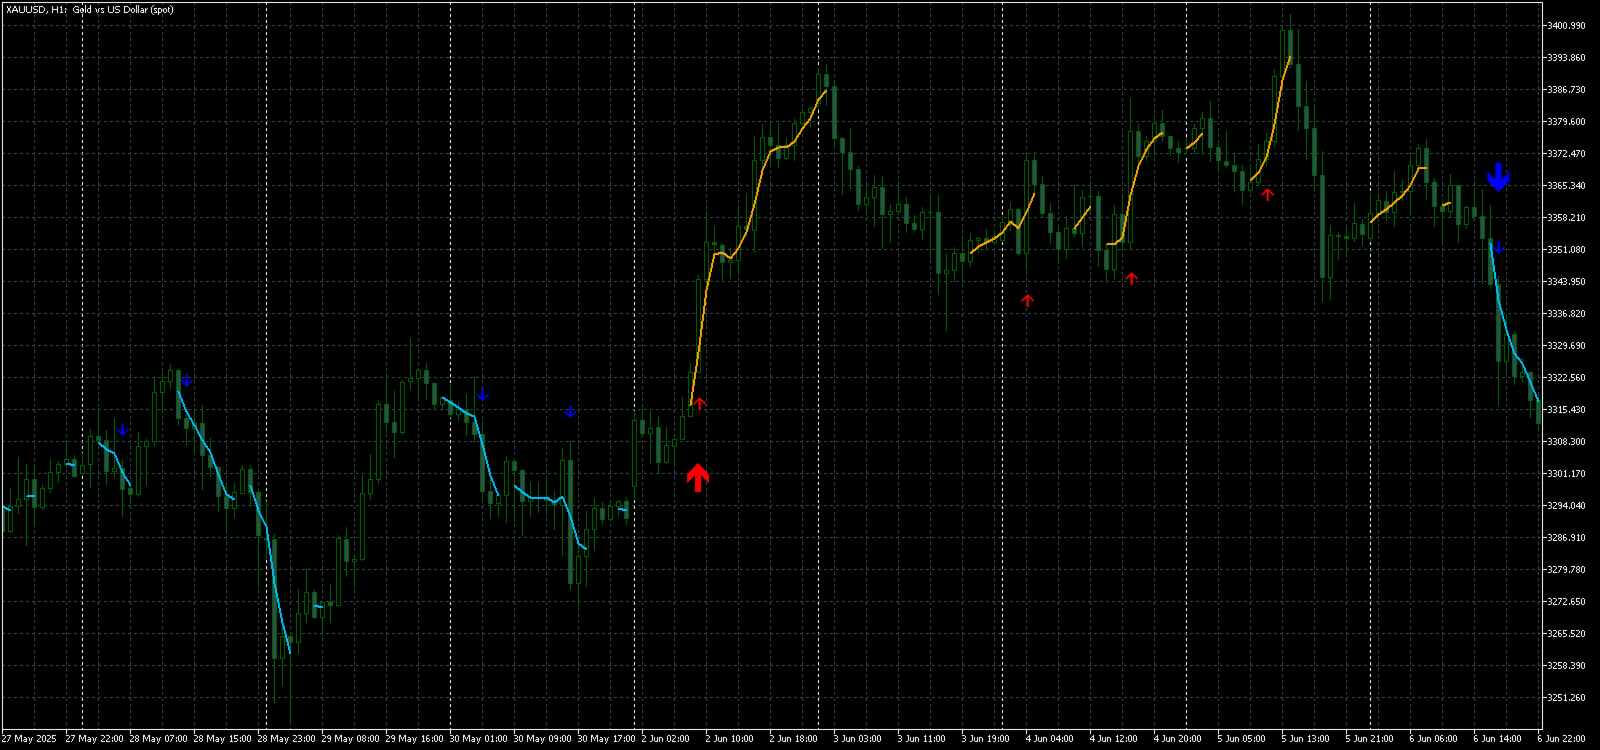
The "Dynamic Scalper System MT5" indicator is designed for the scalping method of trading within trend waves.
Tested on major currency pairs and gold, compatibility with other trading instruments is possible.
Provides signals for short-term opening of positions along the trend with additional price movement support.

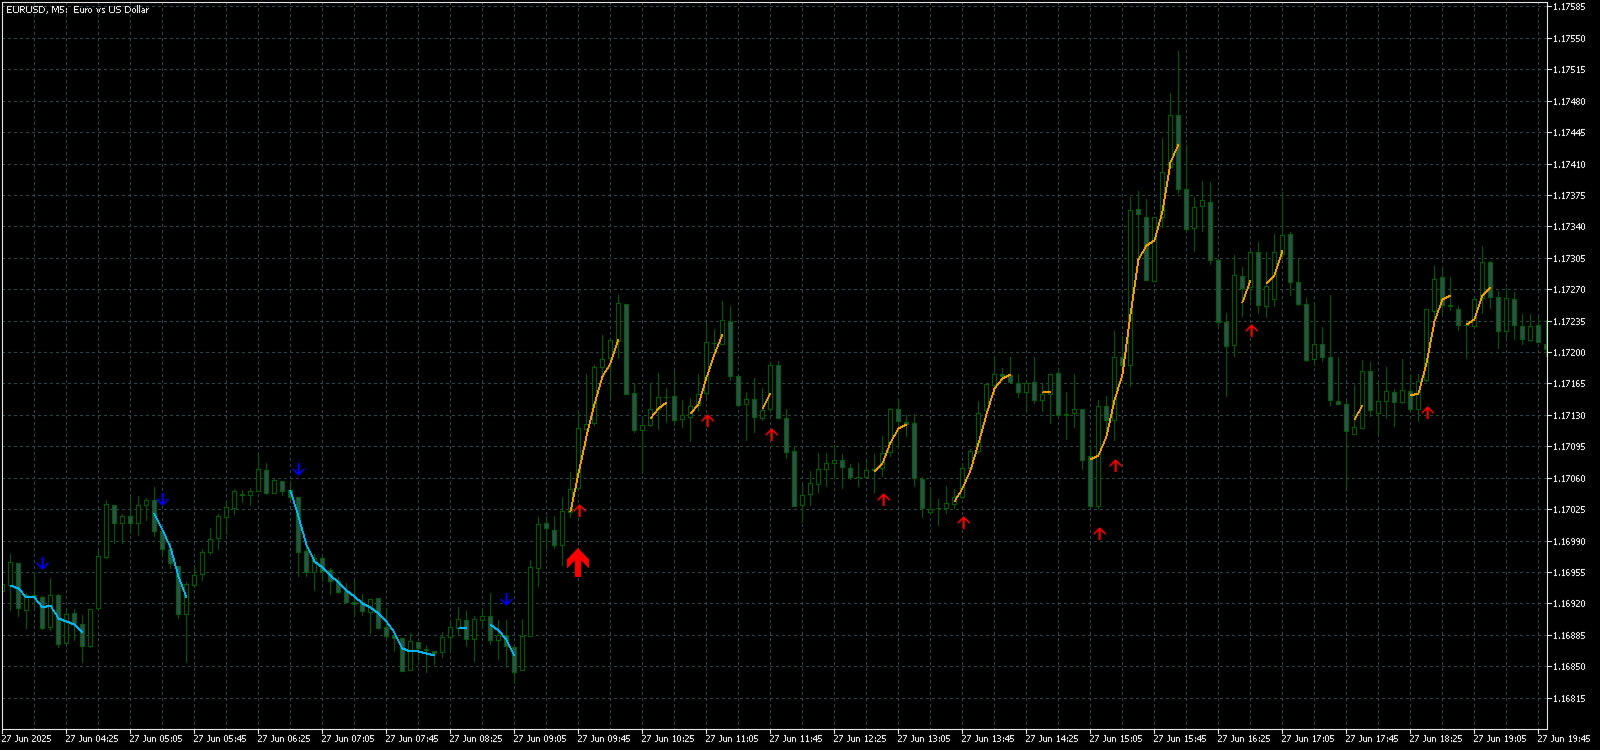
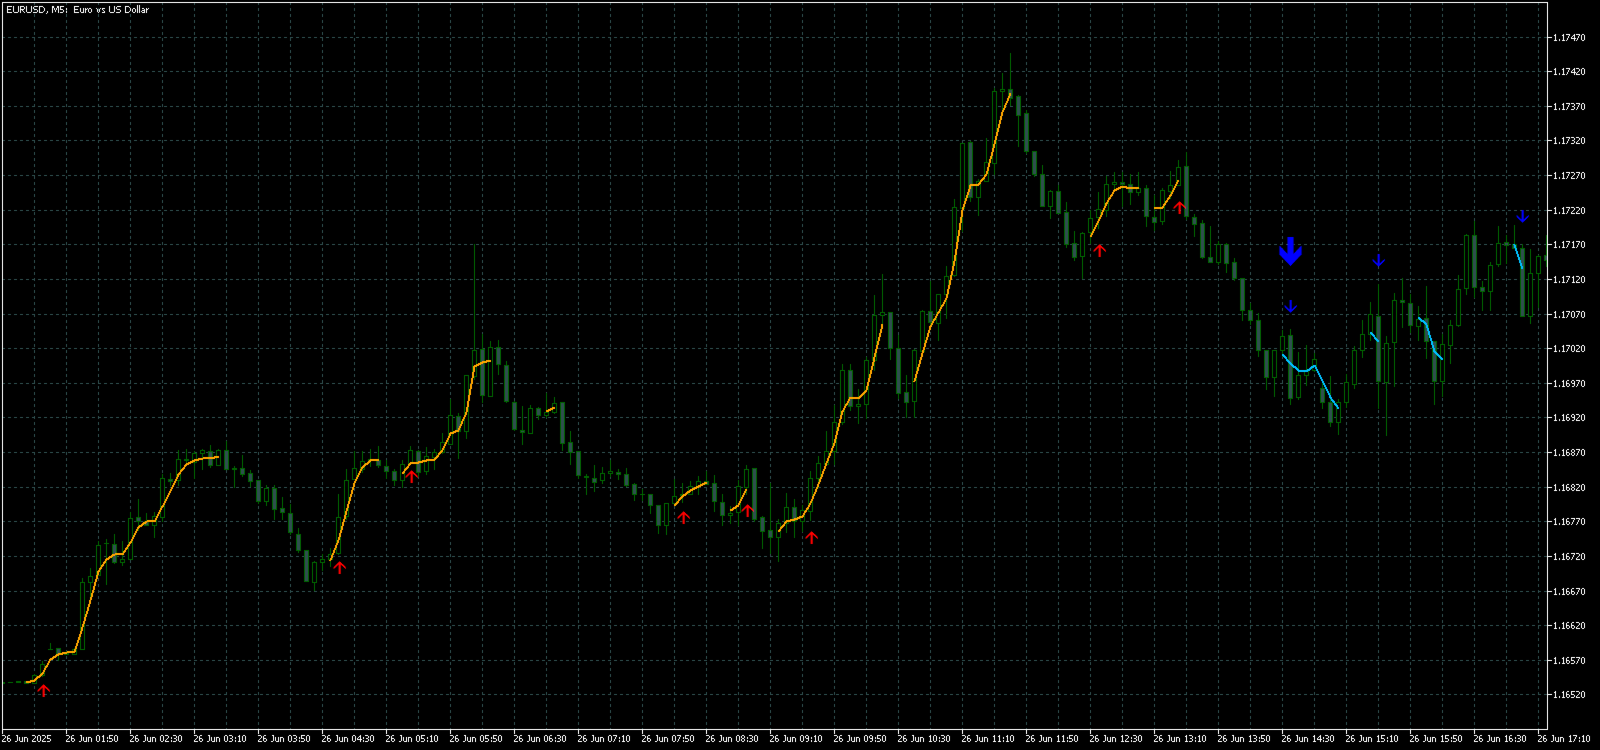
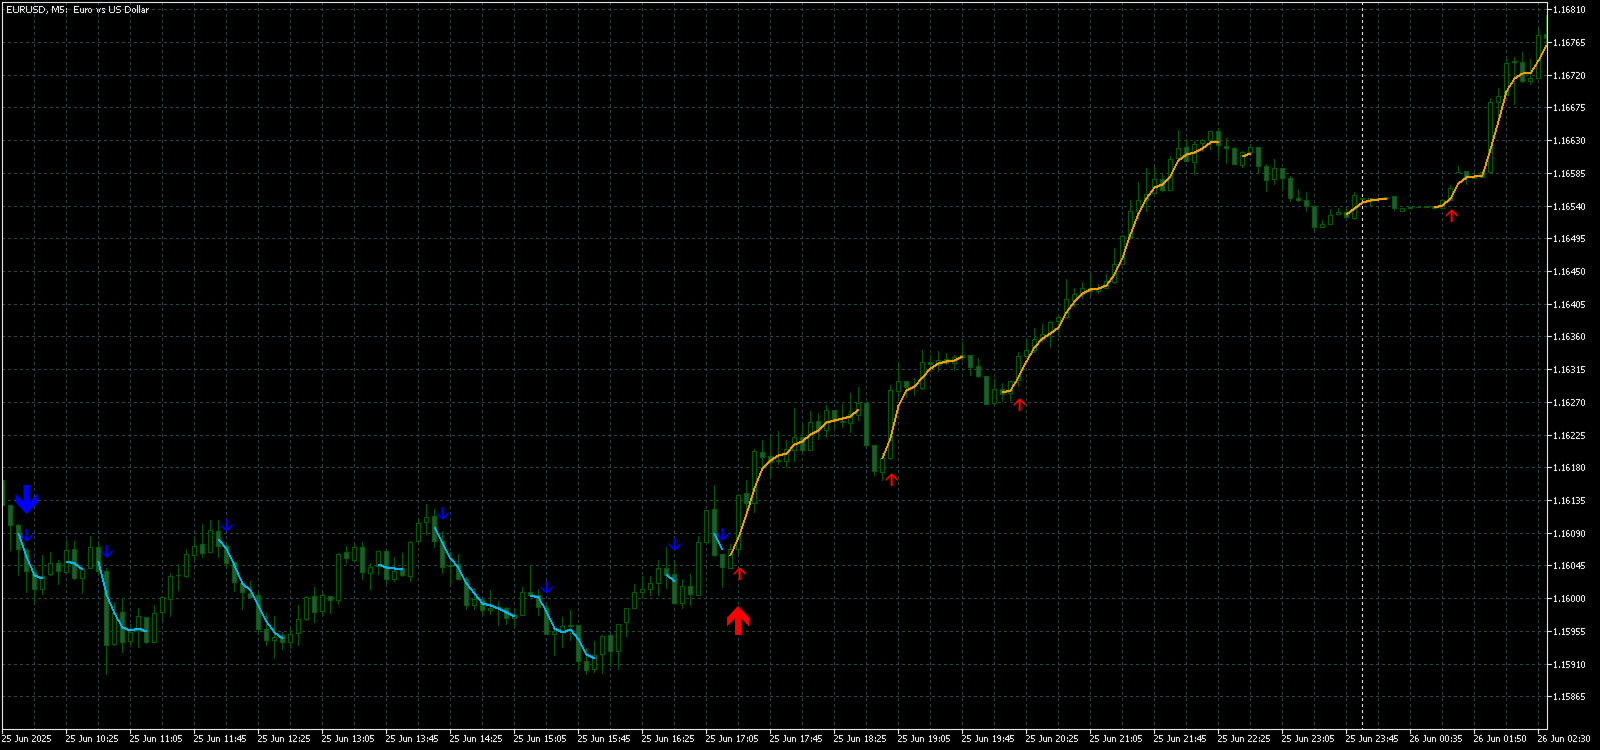
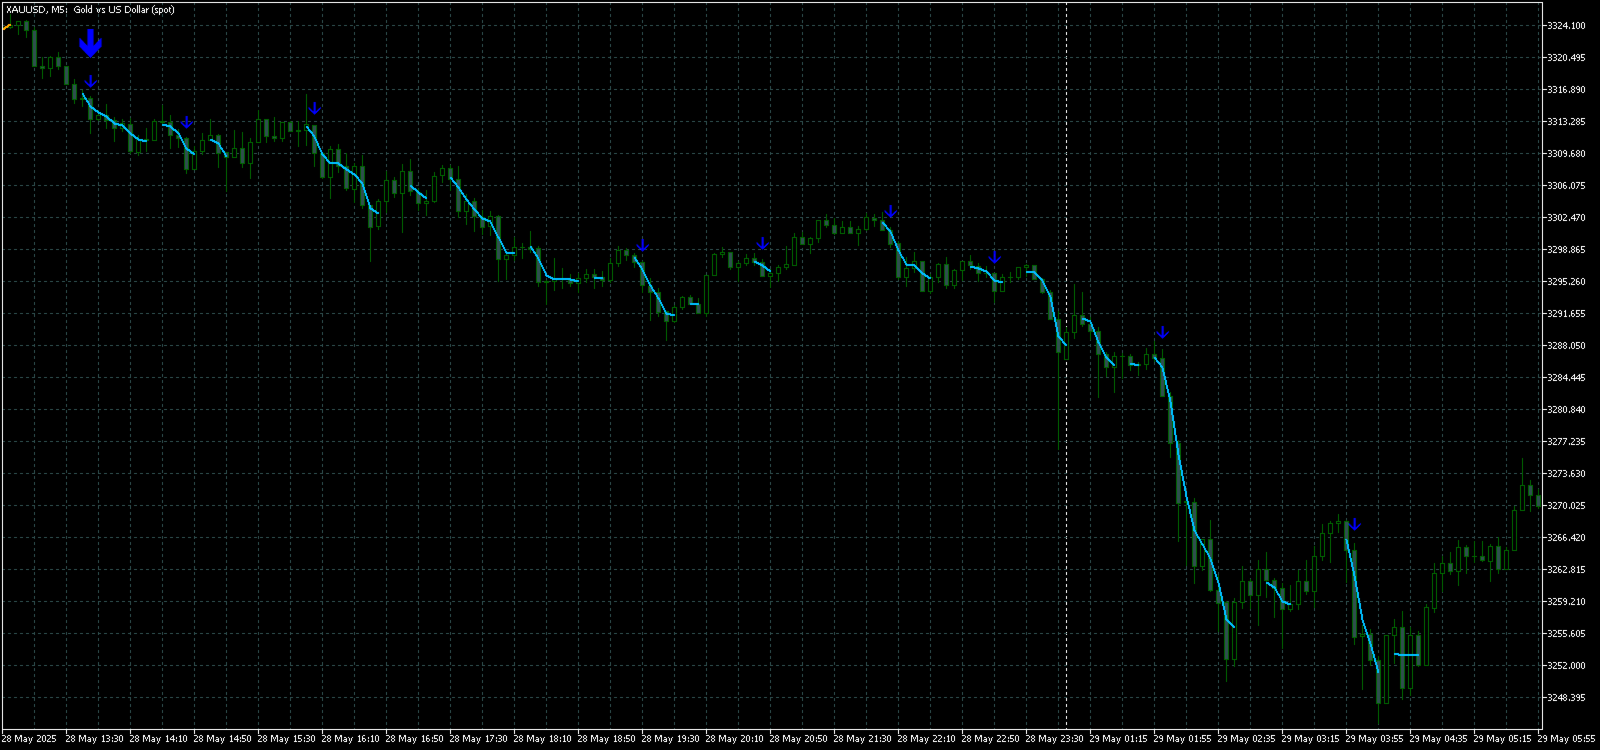
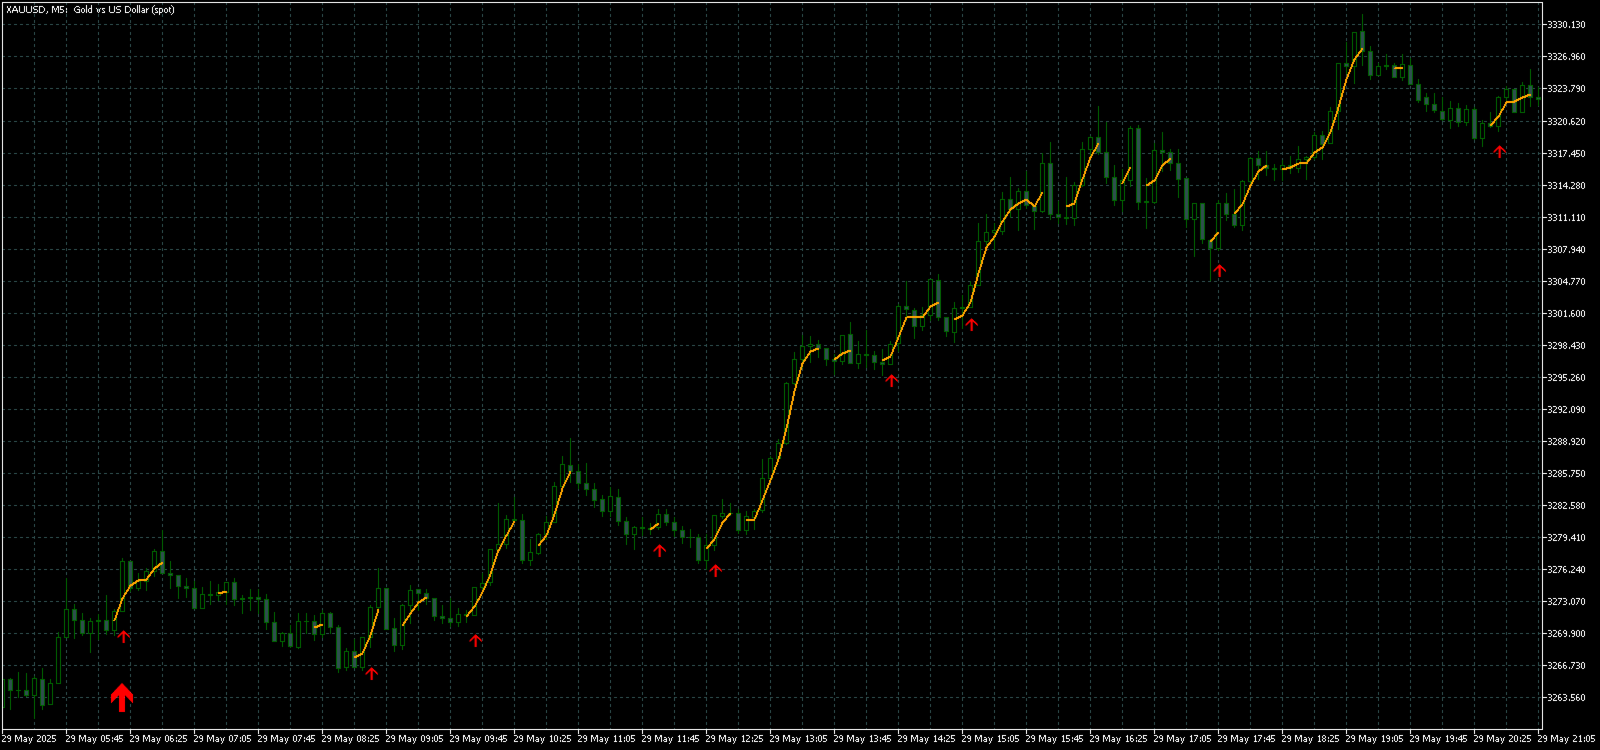
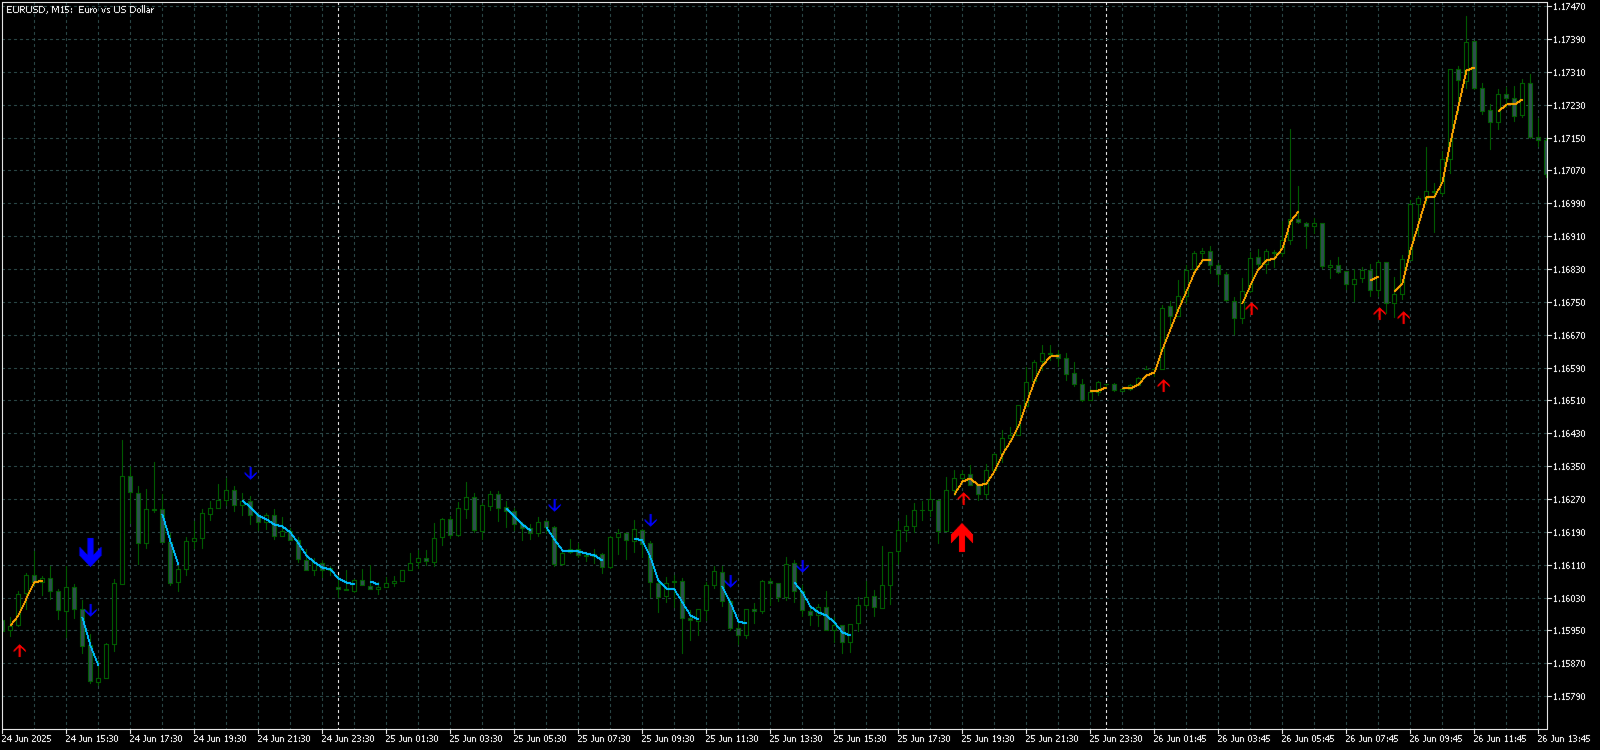
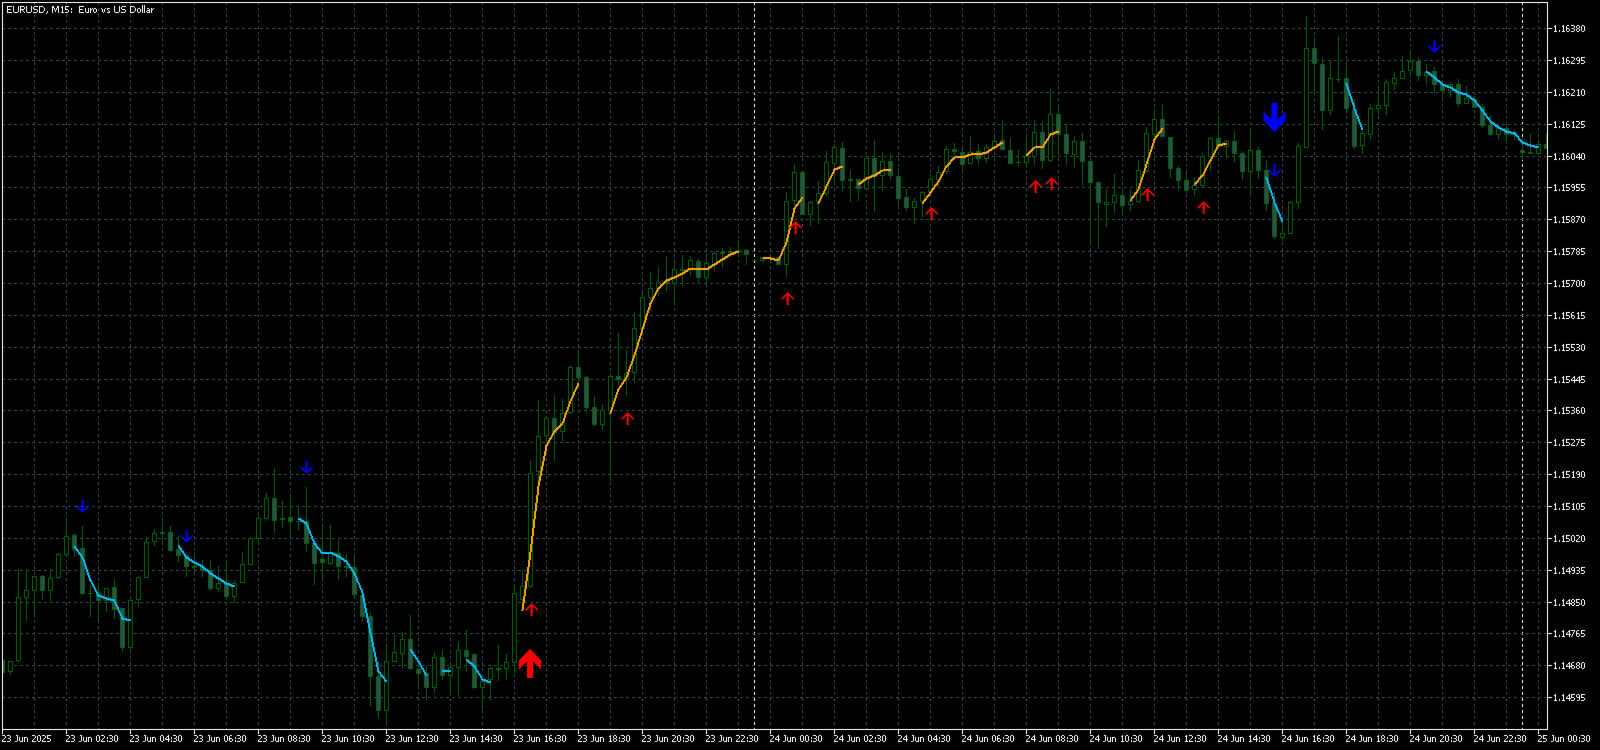
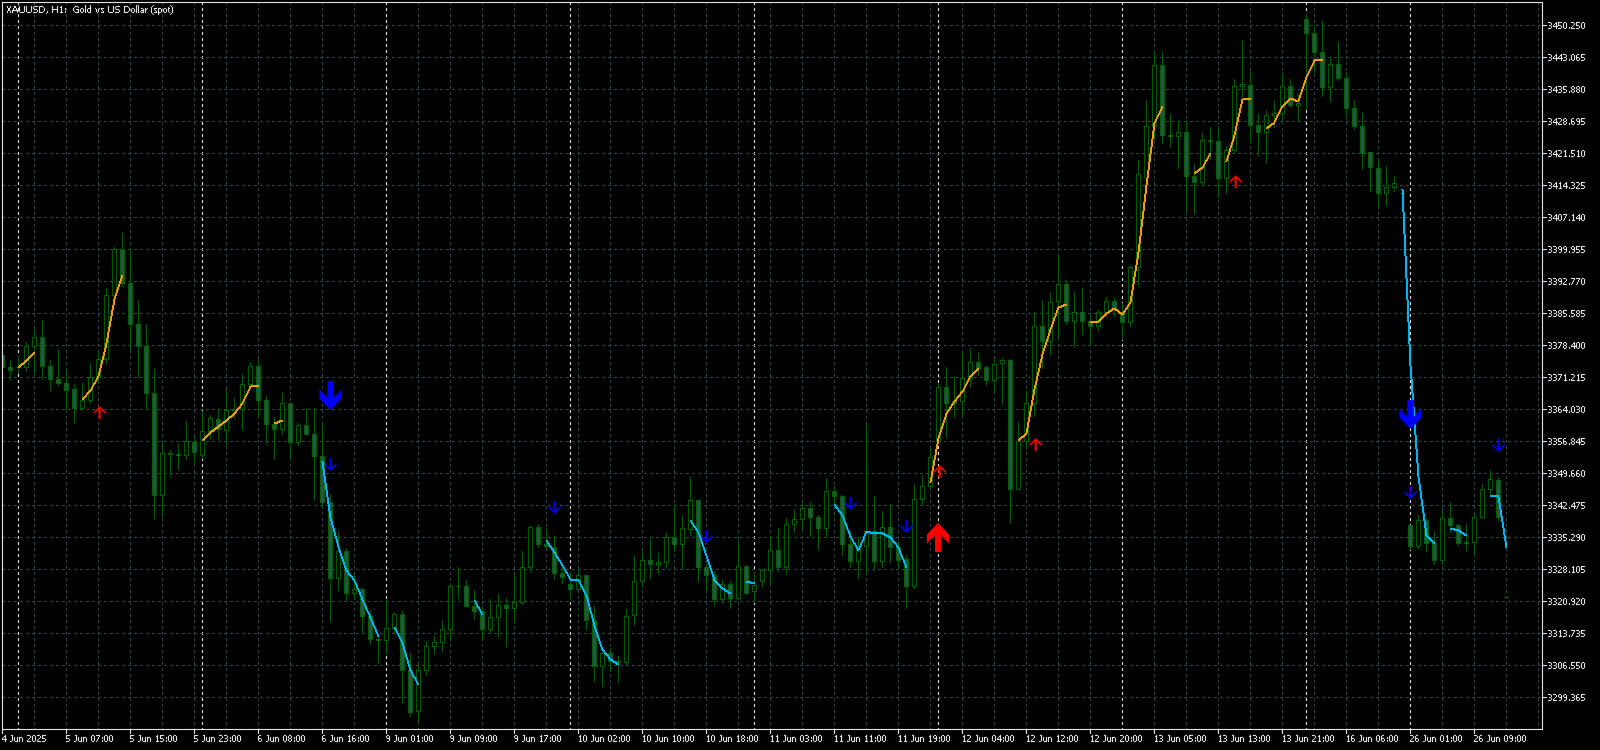
The principle of the indicator.
Large arrows determine the trend direction.
An algorithm for generating signals for scalping in the form of small arrows operates within trend waves.
Red arrows are for the bullish direction, Blue arrows are for the bearish direction.

Sensitive price movement lines are drawn in the direction of the trend, they act together with the signals of small arrows.
The signals operate as follows: when lines appear at appropriate moments, signals for entry will be formed, open positions will be held while there are lines, and when completed, exit the deal.
Recommended time frames for work are M1 - H4.
Arrows are formed on the current candle, if the next candle has opened, the arrow on the previous one is not redrawn.

Input parameters

Trend Wave Period - The period of the trend direction (large arrows), changes the time interval of trend waves. Value 1 is the longest duration of the direction, with an increase in the parameter the duration decreases.

Scalper Arrows Period - The calculation period of signal arrows (small arrows), changes the frequency of generation of signals for entry. Value 3 is the most frequent generation, with an increase in the parameter the frequency of arrows decreases and the accuracy increases.

The parameters can be changed for different time frames and trading instruments. There are alerts for all signals.
Recommended products
Owl Smart Levels MT5
Sergey Ermolov
3.97 (31)
MT4 version  |   FAQ The Owl Smart Levels Indicator is a complete trading system within the one indicator that includes such popular market analysis tools as Bill Williams' advanced fractals , Valable ZigZag which builds the correct wave structure of the market, and Fibonacci levels which mark the exact levels of entry into the market and places to take profits. Detailed description of the strategy Instructions for working with the indicator Advisor-assistant in trading Owl Helper Private User
The Trend Catcher: The Trend Catcher Strategy with Alert Indicator is a versatile technical analysis tool that aids traders in identifying market trends and potential entry and exit points. It features a dynamic Trend Catcher Strategy , adapting to market conditions for a clear visual representation of trend direction. Traders can customize parameters to align with their preferences and risk tolerance. The indicator assists in trend identification, signals potential reversals, serves as a trail
FREE
Orbit Rage Final 2
BILLY ARANDUQUE ABCEDE
Note : i only sell this EA on MQL5, any other sellers is fake. Orbit Rage Final, a cutting-edge trading strategy meticulously designed around the bull/bear candle approach and divergence analysis. This powerful tool is engineered to empower you to shape the life you desire. To embark on this transformative journey, simply download and seamlessly integrate it into your MetaTrader 4 platform by placing it in the experts advisors folder. Orbit Rage Final revolutionizes trading by offering a risk-f
Gold EA: Proven Power for 1-Minute Gold Trading Transform your trading with our Gold EA, meticulously crafted for 1-minute charts and delivering over 2000% growth in 5 years from just $100-$1000 . No Martingale, No AI Gimmicks : Pure, time-tested strategies with robust money management, stop loss, and take profit for reliable performance across multiple charts. Flexible Trading Modes : Choose Fixed Balance for safe profits, Mark IV for bold growth, or %Balance for high rewards—combine Mark IV an
Market Maestro: Your Ideal Partner for Automated Forex Trading If you're looking for a reliable assistant for trading in the currency market, Market Maestro is exactly what you need. This modern Forex bot is built using the latest technologies and algorithms, allowing it to effectively analyze market data and make informed trading decisions in real-time. Key Features of Market Maestro 1. Multicurrency Capability for Broad Opportunities Market Maestro can work with a wide range of currency pairs,
STRICTLY FOR BOOM INDEX ONLY!!!!! Here I bring the Maximum Trend Arrows OT1.0 MT5 indicator. This indicator is made up of a combination of different trend indicators for entries and exits, for entries an orange arrow will paint on the chart below the current market and a red flag for closing of trades and it produces buy arrows only. When the orange arrow appears, it will appear along with it's sound to notify you. The 1H timeframe is recommended, don't use it anywhere else than on the 1H timefr
SolarTrade Suite Financial Robot: LaunchPad Market Expert - designed to open trades! This is a trading robot that uses special innovative and advanced algorithms to calculate its values, Your Assistant in the World of Financial Markets. Use our set of indicators from the SolarTrade Suite series to better choose the moment to launch this robot. Check out our other products from the SolarTrade Suite series at the bottom of the description. Do you want to confidently navigate the world of inves
Magic EA MT5
Kyra Nickaline Watson-gordon
Magic EA is an Expert Advisor based on Scalping, Elliot Waves and with filters such as RSI, Stochastic and 3 other strategies managed and decided with the robot smartly. Large number of inputs and settings are tested and optimized and embedded in the program thus inputs are limited and very simple. Using EA doesn't need any professional information or Forex Trading Knowledge. EA can trade on all symbols and all time frames, using special and unique strategies developed by the author. The EA w
General Description This indicator is an enhanced version of the classic Donchian Channel , upgraded with practical trading functions. In addition to the standard three lines (high, low, and middle), the system detects breakouts and displays them visually with arrows on the chart, showing only the line opposite to the current trend direction for a cleaner view. The indicator includes: Visual signals : colored arrows on breakout Automatic notifications : popup, push, and email RSI filter : to val
FREE
Manus Pro
Itumeleng Mohlouwa Kgotso Tladi
MANUS PRO EA The Trading Revolution You've Been Waiting For Are you TIRED of watching other traders make consistent profits while your account bleeds red?   The financial markets don't wait for anyone – and neither should you. MANUS PRO isn't just another Expert Advisor... it's your   TICKET TO FINANCIAL FREEDOM . Why MANUS PRO is Different (And Why Everyone's Talking About It) FOR BEGINNERS: Your Trading Mentor That Never Sleeps Zero Learning Curve   – Install, activate, and watch it wo
Introducing the revolutionary MT5 indicator, DARWIN Assistant   - your ultimate gateway to the world of successful trading! Designed with precision and expertise, DARWIN Assistant     operates on a special strategy that harnesses the power of advanced technical indicators - RSI, Stochastics, CCI, and Trends - across all time frames. Brace yourself for an extraordinary trading experience as this cutting-edge indicator offers you the most accurate signals for entry, enabling you to navigate the m
Your Trend Friend
Luigi Nunes Labigalini
5 (1)
The trend is your friend! Look at the color of the indicator and trade on that direction. It does not  repaint. After each candle is closed, that's the color of the trend. You can focus on shorter faster trends or major trends, just test what's most suitable for the symbol and timeframe you trade. Simply change the "Length" parameter and the indicator will automatically adapt. You can also change the color, thickness and style of the lines. Download and give it a try! There are big movements w
Santa Scalping MT5
Morten Kruse
3.33 (3)
Santa Scalping is a fully automated Expert Advisor with no use of martingale. Night scalping strategy. The SMA indicator filter are used for entries. This EA can be run from very small accounts. As small as 50 EUR. General Recommendations The minimum deposit is 50 USD,  default settings reccomend for eurusd m5 gmt +2 . Please use max spread 10 if you will not have orders change it to -1. Use a broker with good execution and with a spread of 2-5 points. A very fast VPS is required, preferably wi
Mac-Binary option Signals is unique mathematical concept to trade iqoptions,binary,rocketoptions specter or any other binary options company 1 min 5 expiry run robot 30min everyday and fill profit and loss ratios inside mt2iq/mt2binary and run or 1min to 5min expiry ...go to setting in mt2iq robot allow otc and digital options. and select risk 500and profit 300$ per day it can stop automatically after profit or loss... If it can close after loss restart and Reset profit and loss button run again
WanaScalper
Isaac Wanasolo
1 (1)
A scalping indicator based on mathematical patterns, which on average gives signals with relatively small SL, and also occasionally helps to catch big moves in the markets (more information in the video) This indicator has three main types of notifications: The first type warns of a possible/upcoming signal on the next bar The second type indicates the presence of a ready signal to enter the market/open a position The third type is for SL and TP levels - you will be notified every time price re
Noize Absorption Index - is the manual trading system that measures the difference of pressure between bears forces and bulls forces. Green line - is a noize free index that showing curent situation. Zero value of index shows totally choppy/flat market.Values above zero level shows how powerfull bullish wave is and values below zero measures bearish forces.Up arrow appears on bearish market when it's ready to reverse, dn arrow appears on weak bullish market, as a result of reverse expectation.
FFx Patterns Alerter gives trade suggestions with Entry, Target 1, Target 2 and StopLoss .... for any of the selected patterns (PinBar, Engulfing, InsideBar, OutsideBar) Below are the different options available: Multiple instances can be applied on the same chart to monitor different patterns Entry suggestion - pips to be added over the break for the entry 3 different options to calculate the SL - by pips, by ATR multiplier or at the pattern High/Low 3 different options to calculate the 2 TPs -
Premium level is a unique indicator with more than 80% accuracy of correct predictions! This indicator has been tested for more than two months by the best Trading Specialists! The author's indicator you will not find anywhere else! From the screenshots you can see for yourself the accuracy of this tool! 1 is great for trading binary options with an expiration time of 1 candle. 2 works on all currency pairs, stocks, commodities, cryptocurrencies Instructions: As soon as the red arrow app
Inverted_Chart_EA Utility Expert Advisor Inverted_Chart_EA creates and maintains a mirror-inverted chart of any symbol and timeframe. It automatically generates a custom instrument (e.g. US30_INV ) and keeps its price history updated in real time, with bars mirrored around a chosen pivot. This utility gives traders a new way to analyze the market from a different perspective by flipping the chart upside down. Why use an inverted chart? Highlight hidden patterns – price formations that look ordin
About the Indicator This indicator is based on Monte carlo simulations on the closing prices of a financial instrument. By definition, Monte carlo is a statistical technique used to model the probability of different outcomes in  a process that involves random numbers based on previously observed outcomes. How does it Work? This indicator generates multiple price scenarios for a security by modelling random price changes over time based on historical data. Each simulation trial uses random vari
Statistical Arbitrage Spread Generator for Cointegration [MT5] What is Pair Trading? Pair trading is a market-neutral strategy that looks to exploit the relative price movement between two correlated assets — instead of betting on the direction of the market. The idea? When two assets that usually move together diverge beyond a statistically significant threshold, one is likely mispriced. You sell the expensive one, buy the cheap one , and profit when they converge again. It’s a statistica
FREE
The RSI-Based Automatic Buy Strategy Expert Advisor (EA) is designed to automatically open buy positions when the RSI indicator enters the oversold zone. It smartly spaces new trades by maintaining a minimum distance between open positions to prevent excessive exposure. With adjustable take profit (TP) levels and lot sizes, this EA is specifically tailored for the XAUUSD (Gold) pair on the M5 timeframe. This Expert Advisor offers reliable and disciplined trade management for traders who want to
PZ Mean Reversion MT5
PZ TRADING SLU
3 (2)
Outperform traditional strategies: effective mean reversion for savvy traders Unique indicator that implements a professional and quantitative approach to mean reversion trading. It capitalizes on the fact that the price diverts and returns to the mean in a predictable and measurable fashion, which allows for clear entry and exit rules that vastly outperform non-quantitative trading strategies. [ Installation Guide | Update Guide | Troubleshooting | FAQ | All Products ] Clear trading signals Am
Cumulative Delta Indicator for MetaTrader 5 The Cumulative Delta Indicator is a dedicated volume analysis tool on MetaTrader 5 that monitors market buying and selling pressure. By comparing order flow data, it displays cumulative volume changes to help traders identify divergence signals. This MT5 indicator supports the detection of strong market trends, enhances liquidity analysis, and confirms price action behavior. «Indicator Installation & User Guide» MT5 Indicator Installation  |  Cumulativ
FREE
Gyroscopes mt5
Nadiya Mirosh
5 (2)
Gyroscope        professional forex expert   (for EURUSD, GBPUSD, USDJPY, AUDUSD, USDCHF, EURGBP, EURJPY, NZDUSD, USDCAD, EURCHF, AUDJPY, CADJPY pairs)   alyzing the market using the Elliot Wave Index. Elliott wave theory is the interpretation of processes in financial markets through a system of visual models (waves) on price charts. The author of the theory, Ralph Elliott, identified eight variants of alternating waves (of which five are in the trend and three are against the trend). The mov
Classic Market Surfer EA - A Timeless, Proven Strategy for Gold Trading For years, this powerful trading strategy has been hidden from the public-reserved for a select few. Now, for the first time, the Classic Market Surfer EA is available to traders like you.   Built on pure, time-tested trading principles, this EA doesn't rely on trendy gimmicks like AI or machine learning. Instead, it harnesses a classic, robust strategy that has consistently delivered results over the years. This is not a "g
Free automatic Fibonacci is an indicator that automatically plots a Fibonacci retracement based on the number of bars you select on the BarsToScan setting in the indicator. The Fibonacci is automatically updated in real time as new highest and lowest values appears amongst the selected bars. You can select which level values to be displayed in the indicator settings. You can also select the color of the levels thus enabling the trader to be able to attach the indicator several times with differe
FREE
EXPERTteam
Netanel Kahan Abuluf
Expert XAU is an advanced, precision-focused trading robot designed exclusively for XAUUSD on the 1h  timeframe . This EA uses a proprietary logic to identify high-quality buy opportunities, execute trades with calculated precision, and manage risk dynamically — all while keeping strategy details private to protect its competitive edge. Key Features: – 100% automated – High probability long entries – Built-in risk management – Plug & play: attach to 1h chart and go - in 6.5months will do 11
| Fully-automated Smart Money Concept (ICT) inspired trading solution with multi-strategy capabilities | Built by a grid trader >> for grid traders.  This is MT5 version, click  here  for  Blue CARA MT4  (settings and logics are same in both versions)     Real monitoring signal  -->  Cara Gold Intro Blue CARA EA   ('CARA') - short for  C omprehensive  A lgorithmic   R esponsive   A dvisor is a next-gen  multi-currency    multi-timeframe  EA base on the widely known (and perhaps the most popul
Requiem MT5
Natalyia Nikitina
Attention! Contact me immediately after purchase to receive detailed setup instructions! Requiem MT5 Advisor is your reliable assistant in the Forex market. It uses key market patterns such as price reversal after a sharp movement in any direction. Simply run the advisor on the NZDCAD chart, and let the other currency pairs trade automatically. This is a fully automated trading system that requires no special knowledge or experience from you. Just start the advisor and enjoy your free time – it
Buyers of this product also purchase
ARIPoint
Temirlan Kdyrkhan
ARIPoint is a powerful trading companion designed to generate high-probability entry signals with dynamic TP/SL/DP levels based on volatility. Built-in performance tracking shows win/loss stats, PP1/PP2 hits, and success rates all updated live. Key Features: Buy/Sell signals with adaptive volatility bands Real-time TP/SL/DP levels based on ATR Built-in MA Filter with optional ATR/StdDev volatility Performance stats panel (Success, Profit/Loss, PP1/PP2) Alerts via popup, sound, push, or email Cu
A tool for on-chart strategy backtesting and performance analysis. A utility for developing, debugging, and testing custom trading ideas and indicator functions. An indicator designed to quickly test trading concepts and visualize the effectiveness of different input parameters. An all-in-one sandbox for testing everything from simple crossovers to complex, multi-condition trading systems.
The indicator highlights zones where interests are being declared then shows their accumulation zone. It works like an order book in big scale. This is the indicator for the biggest money. It's performance is exceptional. Whatever interest there is in the market you will see it. ( This is a fully rewritten, automated version—manual analysis is no longer required.)  The Transaction Speed is a new concept indicator that shows where and when large orders accumulates on the market and benefits o
Enigmera MT5
Ivan Stefanov
3.67 (3)
ENIGMERA: The core of the market Introduction This indicator and trading system is a remarkable approach to the   financial markets . ENIGMERA uses the fractal cycles to accurately calculate support and resistance levels.   It shows the authentic accumulation phase and gives direction and targets.    A system that works whether we are in a trend or a correction.   How It Works Most of the indicator’s functionality is controlled through buttons on the left side of the chart, allowing rapid res
VTrende Pro
Andrii Diachenko
5 (1)
VTrende Pro - MTF indicator for trend trading with a display panel for MT5 *** Videos can be translated into any language using subtitles (video language - Russian) Although the signals of the VTrende Pro indicator can be used as signals of a full-fledged trading system, it is recommended to use them in conjunction with the Bill Williams TS. VTrende Pro is an extended version of the VTrende indicator. Difference between Pro version and VTrende: - Time zones - Signal V - signal 1-2 waves -    S
This indicator is based on the mathematics of the great trader W.D. Ganna. With its help, you can easily find strong levels by analyzing swings to find the optimal entry point. The indicator works on all instruments and all timeframes. The indicator is fully manual and has control buttons. All you need to do is press the NEW button, a segment will appear, which you can place on any movement, swing or even 1 candle that you want to analyze. By placing the segment, press the OK button. A grid (th
Get the FREE AUX Indicator, EA Support & Manual Guide please visit - https://www.mql5.com/en/blogs/post/763955 Spot the Trend. Read the Pattern. Time the Entry. 3 Steps in Under 30 Seconds! Trade effortlessly — no analysis required, Your smart assistant is ready to simplify your workflow No more chart overload. Trade with confidence using smart bias detection. Compatible with all currencies, crypto, stocks, metals, indices, and any timeframe. Just click and execute — it’s that simple. Deal for
The indicator is designed to work on any trading platform. The program is based on proprietary algorithms and W.D.Ganna's mathematics, allowing you to calculate target levels of price movement based on three points with the highest degree of certainty. It is a great tool for stock trading. The indicator has three buttons: NEW - call up a triangle for calculation. DEL - delete the selected triangle. DELS - completely remove all constructions. The probability of achieving the goals is more than 80
This indicator identifies and displays zones, as it were areas of strength, where the price will unfold. The indicator can work on any chart, any instrument, at any timeframe. The indicator has two modes. The indicator is equipped with a control panel with buttons for convenience and split into two modes. Manual mode: To work with manual mode, you need to press the NEW button, a segment will appear. This segment is stretched over the movement and the LVL button is pressed. The level is displayed
Jeslyn MT5
Justine Kelechi Ekweh
This is a multi-purpose system that suits both Binary options, and Forex. Manual traders can use this either as a scalping system or a strategy to get into very strong momentum, or it can be automated for forex trading with Universal EAs.   This is a less-risky system if you know what to do with it or just use a universal EA. Use on M5 timeframe There is of course no chance of repainting or recalculation. Once the price closes, the arrows remain there forever! This is because prices don't lie.
The Second-Level Tick Candlestick Generator is a professional-grade MT5 indicator tool specifically designed for high-frequency trading and short-term scalping. It can convert raw tick data into highly customizable second-level candlestick charts in real-time, helping traders accurately capture micro-market fluctuations and optimize entry and exit timing. This tool provides clear chart displays, allowing you to more intuitively identify price action patterns and improve trading decision efficien
Bullhouse Marketprofile
Luiz Vinicius Pereira Rocha -
# Bullhouse MarketProfile Volume Profile, Simplicity, and Precision. Developed by Bullhouse, this indicator brings the power of Market Profile analysis to your MetaTrader 5 in a clean, intuitive, and highly customizable interface. --- ## What is Market Profile? Market Profile is a charting tool that displays the distribution of traded volume over time at each price level. It helps traders understand where the most buying and selling is happening and identify: - Value Areas - Points o
IVISTscalp5
Vadym Zhukovskyi
5 (6)
What's new about iVISTscalp5 forecast indicator (Version 10)? iVISTscalp5 is a unique nonlinear forecasting for a week ahead system for any financial instrument which executes fast scalping using time levels. iVISTscalp5 is a tool for easy study and understanding of financial market. 1) iVISTscalp5 forecast indicator has been completely rewritten into another programming language (C++), which has accelerated data loading and processing. As a result, a different graphical display of forecasts
Reversal ALGO
Muhammad Abdullah Bhatti
Reversal Algo – Technical Indicator for Market Reversal Analysis Overview Reversal Algo is a sophisticated technical indicator meticulously engineered to help traders identify potential turning points in market trends. By thoroughly analyzing historical price data, it detects significant highs and lows that may signal an impending shift in market momentum. This indicator provides clear and distinct visual signals on your charts, allowing you to pinpoint key areas where trends might reverse. Des
Core Concept: Naveen Saroha's Advanced time and price angles are drawn from significant highs or lows at specific geometric ratios that represent the relationship between price movement and time. The Main Gann Angles and Percentage together Most Important: 1x1 Angle : One units of price for one unit of time  1x2 Angle : One unit of price for two units of time  1x3 Angle 1x4 Angle 1x5 Angle 1x6 Angle 1x7 Angle 1x8 Angle: (45) : Eight unit of price for one unit of time - considered the most i
Channel Trend Bands – A Comprehensive Indicator for Market Analysis MetaTrader 4 Version Simple to Use, Effective in Application User-Friendly and Suitable for All Traders This indicator stands out due to its straightforward functionality. Whether you're a beginner exploring the market or an experienced trader refining your strategy, this tool offers valuable insights. Using a   Triangular Moving Average (TMA)   with additional   ATR-based bands , it provides structured market data to support w
Multi-Timeframe Bollinger Bands Indicator Enhance your trading analysis with our Multi-Timeframe Bollinger Bands indicator for MQL5! This powerful tool allows you to visualize Bollinger Bands across five different timeframes simultaneously, all using the same period setting . Gain a clearer understanding of market volatility and potential trend reversals at a glance. Simplify your multi-timeframe analysis and make more informed trading decisions.
The indicator is designed to close positions on the market in time. For example: to take profits ahead of schedule if the price has not reached TakeProfit, and the market is turning around. The indicator analyzes the momentum, not the trend. He does not give any information about the trend. The indicator is well suited for finding divergence. The Ershov 38 Parrots indicator dynamically adjusts to the market and detects price movement impulses of medium and high amplitude. It almost does not rea
Trend Compass MT5
Paul Edunyu Carissimo
Trend Compass: All-in-One Trend Tracking The Trend Compass indicator is a sophisticated yet user-friendly trading tool designed for both novice and experienced traders. By combining multiple technical analysis approaches into one comprehensive package, it eliminates the need for multiple indicators cluttering your charts. Key Features: Multiple analysis modes including VSA for effort/result evaluation Dynamic trailing stops using fractal levels Seven color visualization options for clear market
Smooth price for Monarch
Konstantin Gruzdev
5 (1)
The Smooth Price technical indicator is used for plotting a smoothed line as close to the price of the financial instrument as possible, and serves to eliminate its noise components. The indicator is part of the Monarch trading system, but here it is presented as an independent technical analysis tool. The indicator is based on the cluster digital filter , which, unlike the ClusterSMA , is applied directly to the price time series. Smooth Price does not redraw (except the very last, zero bar) an
The Expert Advisor and the video are attached in the Discussion tab . The robot applies only one order and strictly follows the signals to evaluate the indicator efficiency. Pan PrizMA CD Phase is an option based on the Pan PrizMA indicator. Details (in Russian). Averaging by a quadric-quartic polynomial increases the smoothness of lines, adds momentum and rhythm. Extrapolation by the sinusoid function near a constant allows adjusting the delay or lead of signals. The value of the phase - wave s
Классификатор силы тренда. Показания на истории не меняет. Изменяется классификация только незакрытого бара. По идее подобен полной системе ASCTrend, сигнальный модуль которой, точнее его аппроксимация в несколько "урезанном" виде, есть в свободном доступе, а также в терминале как сигнальный индикатор SilverTrend . Точной копией системы ASCTrend не является. Работает на всех инструментах и всех временных диапазонах. Индикатор использует несколько некоррелируемых между собой алгоритмов для класси
FFx Universal Strength Meter PRO is more than a basic strength meter. Instead of limiting the calculation to price, it can be based on any of the 19 integrated strength modes + 9 timeframes. With the FFx USM, you are able to define any period for any combination of timeframes. For example, you can set the dashboard for the last 10 candles for M15-H1-H4… Full flexibility! Very easy to interpret... It gives a great idea about which currency is weak and which is strong, so you can find the best pai
The FFx Universal MTF alerter shows on a single chart all the timeframes (M1 to Monthly) with their own status for the chosen indicator. 9 indicators mode (MACD-RSI-Stochastic-MA-ADX-Ichimoku-Candles-CCI-PSAR). Each can be applied multiple times on the same chart with different settings. Very easy to interpret. Confirm your BUY entries when most of the timeframes are showing green color. And confirm your SELL entries when most of the timeframes are showing red color. 2 Alert Options : input to s
The FFx Watcher PRO is a dashboard displaying on a single chart the current direction of up to 15 standard indicators and up to 21 timeframes. It has 2 different modes: Watcher mode: Multi Indicators User is able to select up to 15 indicators to be displayed User is able to select up to 21 timeframes to be displayed Watcher mode: Multi Pairs User is able to select any number of pairs/symbols User is able to select up to 21 timeframes to be displayed This mode uses one of the standard indicators
MetaTrader 4 version available here : https://www.mql5.com/en/market/product/24881 FFx Basket Scanner is a global tool scanning all pairs and all timeframes over up to five indicators among the 16 available. You will clearly see which currencies to avoid trading and which ones to focus on. Once a currency goes into an extreme zone (e.g. 20/80%), you can trade the whole basket with great confidence. Another way to use it is to look at two currencies (weak vs strong) to find the best single pairs
MetaTrader 4 version available here: https://www.mql5.com/en/market/product/25793 FFx Pivot SR Suite PRO is a complete suite for support and resistance levels. Support and Resistance are the most used levels in all kinds of trading. Can be used to find reversal trend, to set targets and stop, etc. The indicator is fully flexible directly from the chart 4 periods to choose for the calculation: 4Hours, Daily, Weekly and Monthly 4 formulas to choose for the calculation: Classic, Camarilla, Fibonac
Pendiente de Precio
Cesar Juan Flores Navarro
Indicador en base a la pendiente de la linea de precio, dibuja una línea de color cuando sube a base de los precios que previamente has sido procesados o linealizados, y cuando baja la pendiente la linea linealizada toma otro color. En este caso se a considerado 6 lineas de diferentes procesos desde pendientes largas hacia las cortas, observándose que cuando coincidan las pendientes se produce un máximo o mínimo, lo que a simple vista nos permitirá hacer una COMPRA O VENTA.
Индикатор Coefficient Of Determination (COD) представляет собой значение коэффициента детерминации или квадрат коэффициента корреляции между зависимой переменной — ценой и объясняющей переменной — тиковым объемом. Что это дает нам на практике? COD отлично распознает кульминацию трендовых движений, что позволяет подбирать оптимальные точки и ловить развороты рынка. Как использовать индикатор: Наиболее популярная торговая стратегия строится совместно с трендовым индикатором Moving Average (MA), пе
Fibonacci Multiple 12
Cesar Juan Flores Navarro
Fibonacci Múltiple 12, utiliza la serie fibonacci plasmado en el indicador fibonacci, aumentadolo 12 veces según su secuencia. El indicador fibonacci normalmente muestra una vez, el presente indicador se mostrara 12 veces empezando el numero que le indique siguiendo la secuencia. Se puede utilizar para ver la tendencia en periodos cortos y largos, de minutos a meses, solo aumentado el numero MULTIPLICA.
More from author
Volatility Trend System - a trading system that gives signals for entries. The volatility system gives linear and point signals in the direction of the trend, as well as signals to exit it, without redrawing and delays. The trend indicator monitors the direction of the medium-term trend, shows the direction and its change. The signal indicator is based on changes in volatility and shows market entries. The indicator is equipped with several types of alerts. Can be applied to various trading ins
Trading System Double Trend - an independent trading system consisting of several indicators. Determines the direction of the general trend and gives signals in the direction of price movement. Can be used for scalping, intraday or weekly trading. Features Works on any time frames and trading instruments (forex, cryptocurrencies, metals, stocks, indices.) Simple visual reading of information that does not load the chart The indicator does not repaint and does not complete signals Works only wh
Wave Price Channel - A trading analytical system designed to search for momentum and correction. The indicator allows you to work in the direction of the price channel, which is built on the basis of volatility. When an arrow up or down is drawn on the channel, it becomes possible to go in this direction, the signal in this direction is confirmed by a dot indicator sensitive to price changes. As long as the dots of the same color continue, the signal continues. If there is an arrow, but no dots
Point Directions
Vitalyi Belyh
5 (1)
Point Directions - An indicator showing point levels of support and resistance when the price moves. The arrows show price bounces in the indicated directions. The arrows are not redrawn, they are formed on the current candle. Works on all time frames and trading instruments. There are several types of alerts. Has advanced settings to customize signals for any chart. Can be configured to trade with the trend and corrections. For drawing arrows, there are 2 types of moving averages and an intens
Upper and Lower Reversal - Early forecasting system for reversal points. Allows you to find price reversal points on the boundaries of the upper and lower price movement channels. The indicator will never repaint or change the position of the signal arrows. Red arrows are a buy signal, Blue arrows are a sell signal. Adapts to any time frames and trading instruments The indicator does not repaint, it works only when the candle closes. There are several types of alerts for signals The indicator i
Scalping Entry Points - is a manual trading system that can adjust to price movements and give signals to open trades without redrawing. The indicator determines the direction of the trend by the central level of support and resistance. The dot indicator provides signals for entries and exits.  Suitable for manual intraday trading, scalping and binary options. Works on all time frames and trading instruments. The indicator gives several types of alerts. How to use the product The blue line det
Wave Reversal Indicator - determines the direction of trend waves and price reversals. The indicator shows wave movements and trend directions. It gives recommendations where to follow the trader, helps to follow the trading strategy. It is an addition to an intraday or medium-term strategy. Almost all parameters are selected for each time frame and are changed automatically, the only parameter for manual adjustment is the wavelength. Works on various trading instruments and timeframes, recomme
FREE
Arrow Micro Scalper - an indicator designed for scalping and short-term trading, integrated into any chart and financial instrument (currency, crypto, stocks, metals). In its work, it uses wave analysis and a trend direction filter. It is recommended to use on time frames from M1 to H4. How to work with the indicator. The indicator contains 2 external parameters for changing the settings, the rest are already configured by default. Large arrows indicate a change in trend direction, blue - the
Trend indicators are one of the areas of technical analysis for use in trading on financial markets. The Angular Trend Lines indicator comprehensively determines the trend direction and generates entry signals. In addition to smoothing the average direction of candles, it also uses the slope of the trend lines. The principle of constructing Gann angles was taken as the basis for the slope angle. The technical analysis indicator combines candlestick smoothing and chart geometry. There are two ty
Technical indicator that structures charts and identifies cyclical price movements. Can work on any charts. Several types of alerts. There are additional arrows on the chart itself. Without redrawing on history, works on closing a candle. Recommended TF from M5 and higher. Easy to use and configure parameters. When using 2 indicators with different parameters, you can use without other indicators. Has 2 input parameters Cyclicality and Signal duration These 2 parameters work with the processin
Indicator Waiting Volatility - an indicator for determining volatility zones and flat conditions. Over time, the price on the chart is in different trends, goes down, goes up, or stays the same. The indicator helps the trader determine which trend the price is in. In its work, it uses several tools for technical analysis; first, the direction of the trend is determined, then, in this direction, the indicator monitors changes in volatility. If the price fluctuates within the noise, it is in track
Upper and Lower Reversal - Early forecasting system for reversal points. Allows you to find price reversal points on the boundaries of the upper and lower price movement channels. The indicator will never repaint or change the position of the signal arrows. Red arrows are a buy signal, Blue arrows are a sell signal. Adapts to any time frames and trading instruments The indicator does not repaint, it works only when the candle closes. There are several types of alerts for signals The indicator i
A technical indicator that calculates its readings on trading volumes. In the form of a histogram, it shows the accumulation of the strength of the movement of the trading instrument. It has independent calculation systems for bullish and bearish directions. Works on any trading instruments and time frames. Can complement any trading system. The indicator does not redraw its values, the signals appear on the current candle. It is easy to use and does not load the chart, does not require addition
Wave Synchronizer is a visual indicator of wave analysis. Combines candlestick movement sequences and builds directional waves, producing synchronous movements together with the market. The beginning of each wave begins with a signal arrow, there are also alerts. The indicator will never redraw or move the arrows on the previous history. Signal arrows appear at the close of the candle. Adapts to work with any trading instruments and time frames. Easy to use and configure, contains only 2 input
A trend indicator showing the strength of bulls and bears in a trading range. Consists of two lines: The green line is a balanced overbought/oversold condition. The red line is the direction of trading activity. Does not redraw calculations. Can be used on all Symbols/Instruments/Time Frames. Easy to use and set up. How to use the indicator and what it determines. The basic rule is to follow the direction of the red line: if it crosses the green line from the bottom up, the market is dominat
FREE
The indicator " ZigZag on Trend " is an assistant in determining the direction of price movement, as well as a calculator of bars and points. It consists of a trend indicator, which follows the price direction by the trend line presented in the form of a zigzag and a counter calculating the number of bars traversed in the direction of the trend and the number of points on the vertical scale. (calculations are carried out by the opening of the bar) The indicator does not redraw. For convenience,
Arrow indicator with trend filter. Generates trend input without delays or delays - on the emerging candle. Suitable for use on any trading tools and timeframes. Easy to use, contains the direction of the trend in the form of a histogram lines and signal generator. Input parameters Period Trend Line - Period of the Histogram Line Signal Generator Period - If the period is longer, then the arrows are less Play sound Display pop-up message Send push notification Send email Sound file signal - Fi
A trend indicator that determines short-term price movements. Arrows indicate an increase in price movements in the specified directions. Arrows are not redrawn formed on the current candle, shown on the previous candle for convenience.      It has one setting - the formation intensity: If the parameter is smaller, most of the signals are formed in a wide trend. If the parameter is larger, signals are formed in a narrower trend. Input parameters Formation Intensity - Arrow Formation Intensity
Channel Cluster
Vitalyi Belyh
5 (1)
Cluster indicator working in the price channel. For operation, the indicator builds a channel line - (dashed line). Inside the channel, cluster sections are determined that determine the direction of the price movement - (histograms in two directions), start with large arrows. Small arrows are plotted above / below each histogram - indicator increase volatility. The indicator does not redraw the values. Works on any tools and timeframes. Entrances are made when large arrows appear, inside small
Zig-Zag indicator with additional signals for inputs. Visually easy to use: The red zig-zag line is an uptrend. The blue zig-zag line is a downward trend. Arrows in the form of additional signals. Works on any trading pairs. On any timeframe. Not redrawn. Input parameters Zig-Zag Period - Zig-zag period (from 5) Signal Period - period of signal arrows (from 3) Alerts for signals Play sound - Sound alert Display pop-up message - Notification by message on the screen Send push notification
A technical indicator that calculates its readings based on trading volumes. It has an oscillatory line that follows the change in volumes. Large arrows on the line indicate reversal values. A channel is built around the line with small arrows showing the strengthening of price movement in the direction of increasing volumes. The indicator does not redraw values. Works on any instrument and timeframe. It can complement any trading strategy by finding a trend or make entries in the direction of a
Cyclical indicator for trading and predicting the direction of the market. Shows the cyclical behavior of the price in the form of an oscillator. Gives signals for opening deals when rebounding from the upper and lower boundaries of the oscillator. In the form of a histogram, it shows the smoothed strength of the trend. Will complement any trading strategy, from scalping to intraday. The indicator does not redraw. Suitable for use on all symbols/instruments. Suitable time frames for short-term t
Max Min Reversal Arrows - an arrow reversal indicator for predicting price movement. The indicator is built on the support and resistance levels at the local lows and highs of the price. Product features Arrows appear on the current candle. The indicator does not redraw. Can be used on all time frames and trading instruments. Recommended timeframes to use M30, H1, H4. The dotted lines are the support and resistance levels within the signal. Price movement from these levels means a reversal. Pr
Candle Binary Scalper - is a technical analysis product for forex and binary options. Includes several technical indicators combined into a trading system. Suitable for manual trading within a trend, for scalping and binary options. Works on all time frames and trading instruments. Recommended Timeframes for trading M15, M30, H1 and H4, M5 and M1 should be used in case of high volatility. There are several types of alerts. How to use the product The optimal settings have already been selected
Binary Lines is a technical analysis indicator for currencies, commodities, cryptocurrencies, stocks, indices and any financial instruments. Can be used for binary options or Forex scalping. Shows entry and exit points at fixed intervals and provides traders the necessary information about the results of possible transactions. Entry points are formed at the very beginning of the candle, in the direction of the MA line, duration trades in bars can be adjusted manually and adjusted to any financia
Line Breakouts - System for trend trading. Contains a trend identifier that can be adapted to any chart and trading instrument using the period and smoothing function. And a determinant of support and resistance levels. When the price is below the resistance line, open Sell trades, and when the price is above support lines - open Buy transactions. Stop loss should be placed a few points from the lines, Take Profit should be fixed after several candles (3-10-15), based on the time frame. The indi
Point Trend Indicator - An indicator of the upper and lower level of the trend, which can determine the trend direction and indicate its strengthening. The trend direction is determined by round dots; if the points are above the zero line, the trend is bullish; if below, the trend is bearish. The increase in directional movement is indicated by arrows. It has the only parameter for manual adjustment - Duration of the trend direction.   Possibilities Works on all time frames Adapts to any financ
Scalping and Binary Signal Detector - Scalping indicator that gives directional signals for opening positions along the trend. The indicator is a complete trading system that can be used for Forex and binary options. The system of algorithms allows you to recognize intense price movements in several consecutive bars. The indicator provides several types of alerts for arrows. Works on any trading instruments and time frames (M5 or Higher recommended). How to use for trading The appearance of a
Level Breakout Indicator is a technical analysis product that works from upper and lower boundaries, which can determine the direction of the trend. Works on candle 0 without redrawing or delays. In its work, it uses a system of different indicators, the parameters of which have already been configured and combined into a single parameter - “ Scale ”, which performs gradation of periods. The indicator is easy to use, does not require any calculations, using a single parameter you need to select
An automatic trend indicator that uses an algorithm to determine impulse signals for scalping and intraday trading. The trend-following indicator automatically calculates potential entry and exit points for trades. The indicator contains a trend line and a target channel for following signals, changing color depending on the direction. Main characteristics Signal colored candles and arrows: blue - downward direction, red - upward direction. Yellow dots for exiting trades are located along the
Filter:
No reviews
Reply to review