Dynamic Scalper System MT5

Dynamic Scalper System MT5」インジケーターは、トレンド波の中でスキャルピング取引を行う手法のために設計されています。
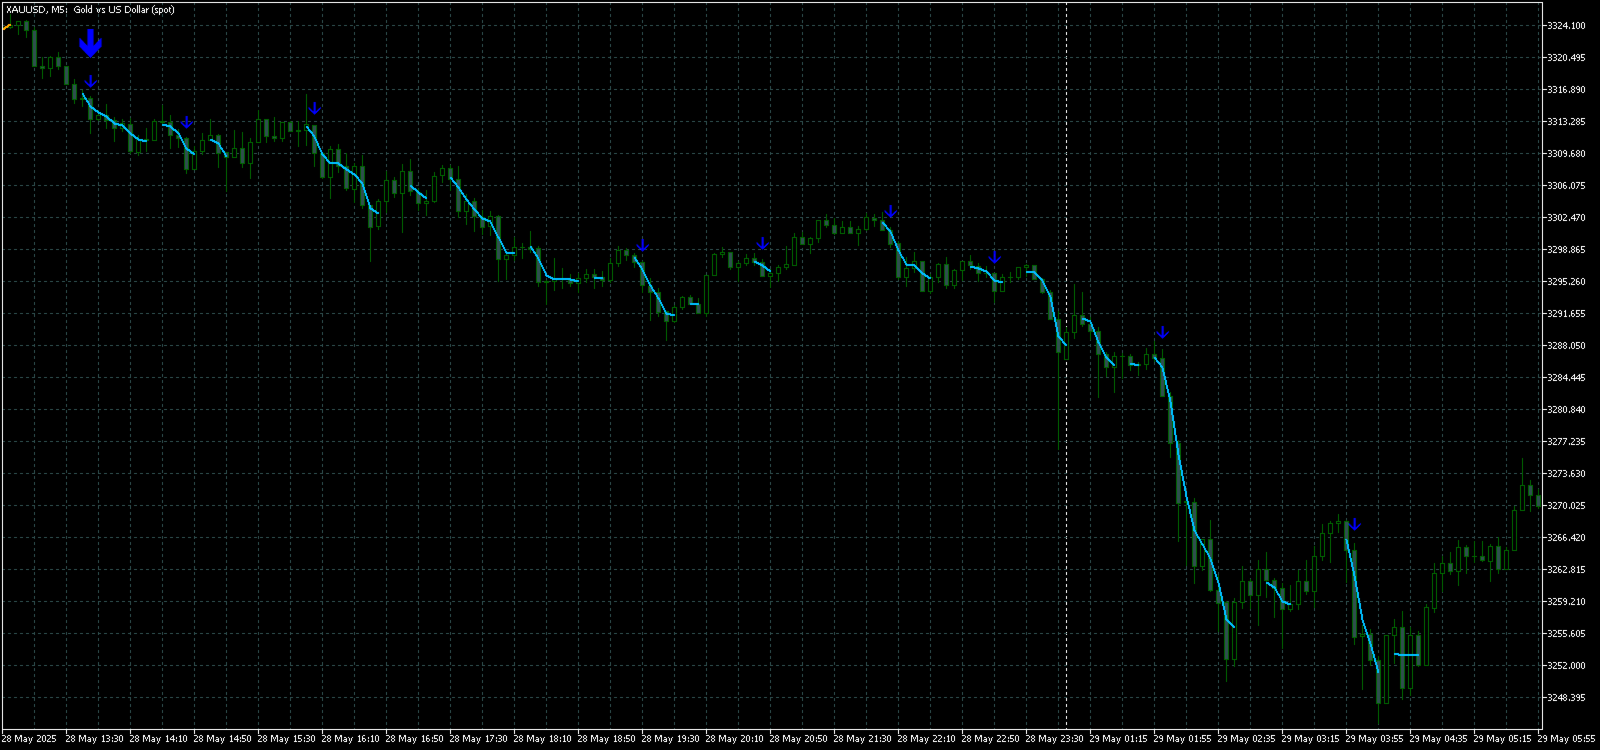
主要通貨ペアと金でテスト済みで、他の取引商品との互換性があります。
トレンドに沿った短期的なポジションオープンのシグナルを提供し、追加の価格変動サポートも提供します。

インジケーターの原理
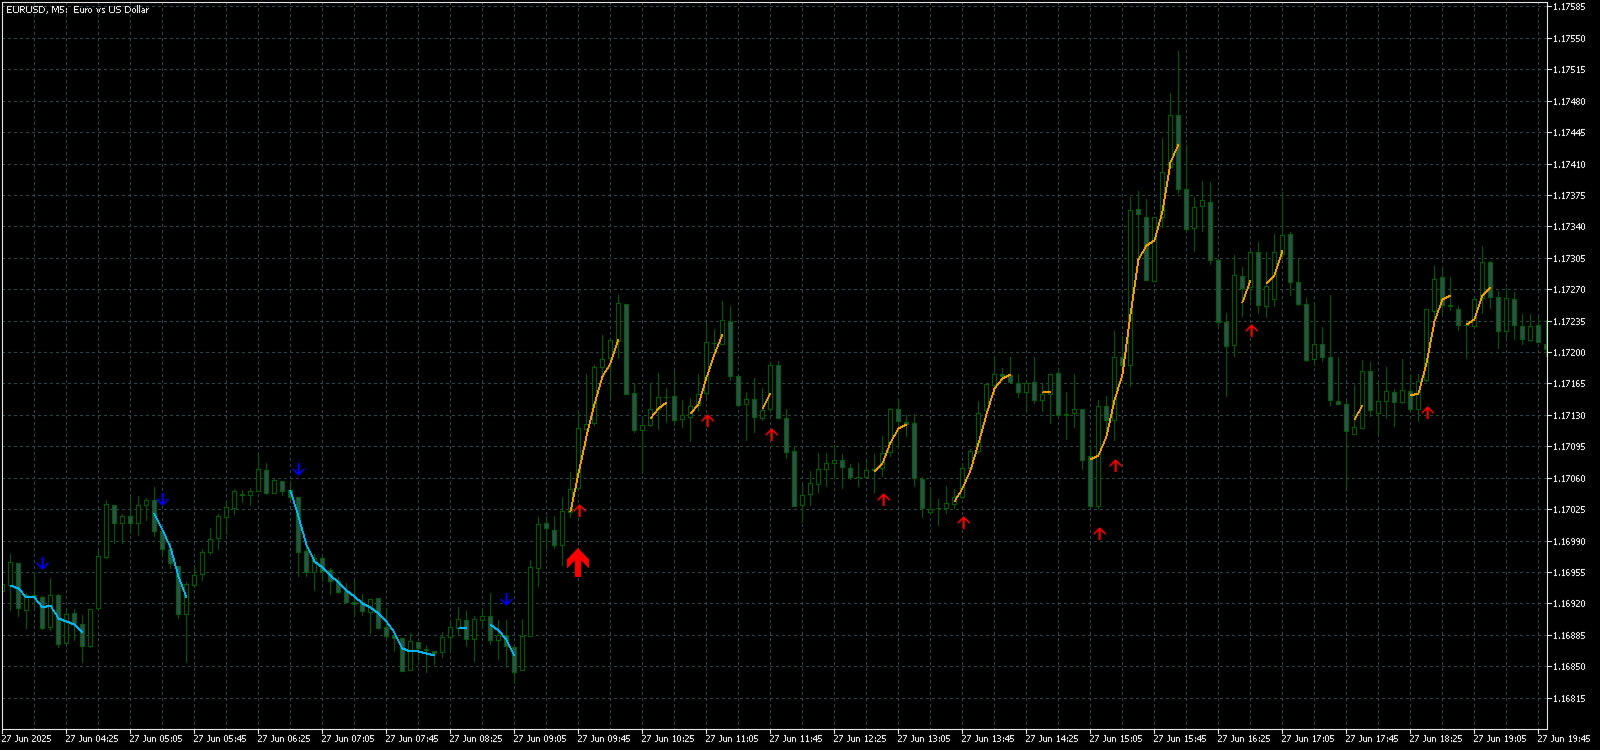
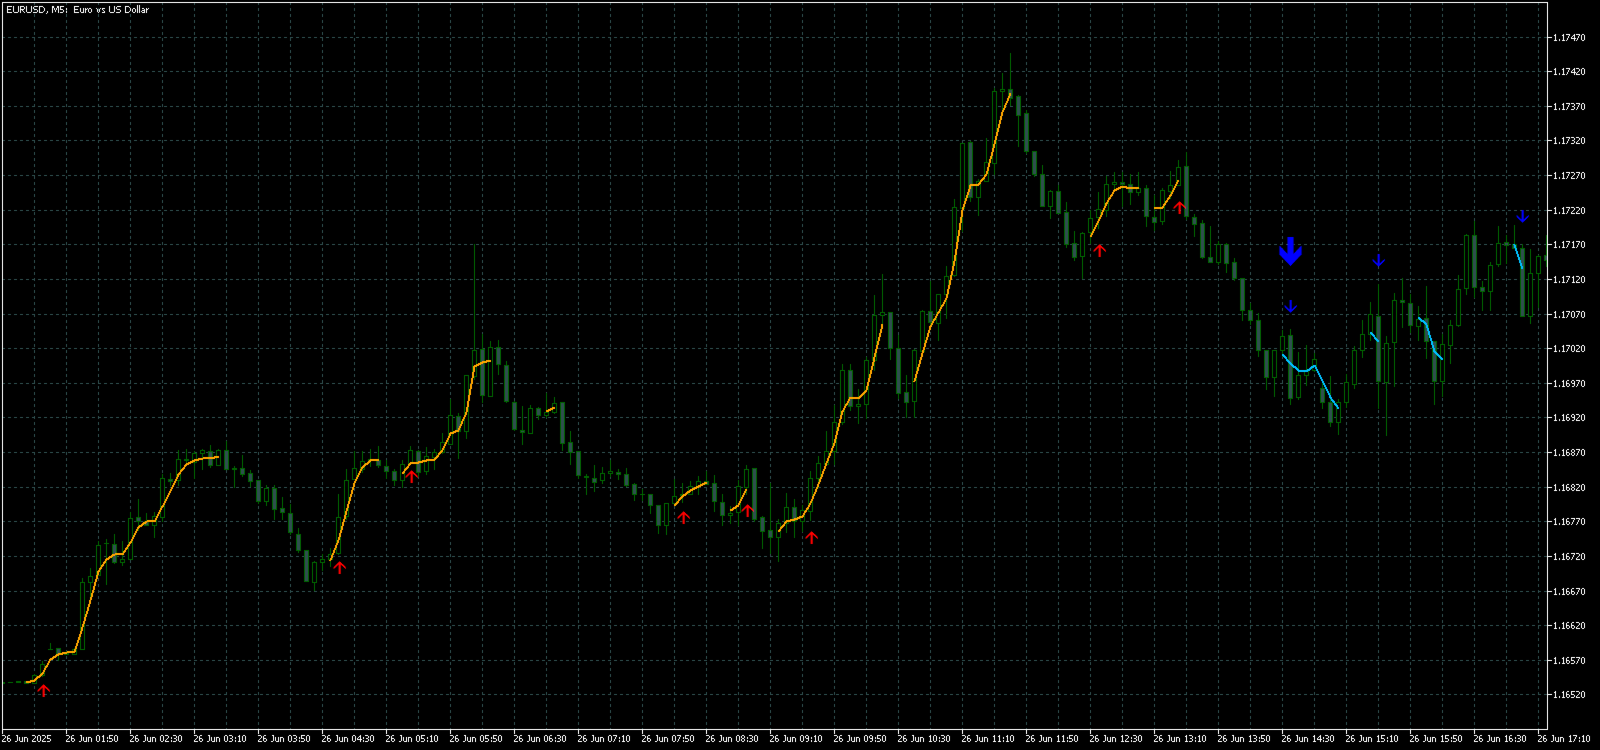
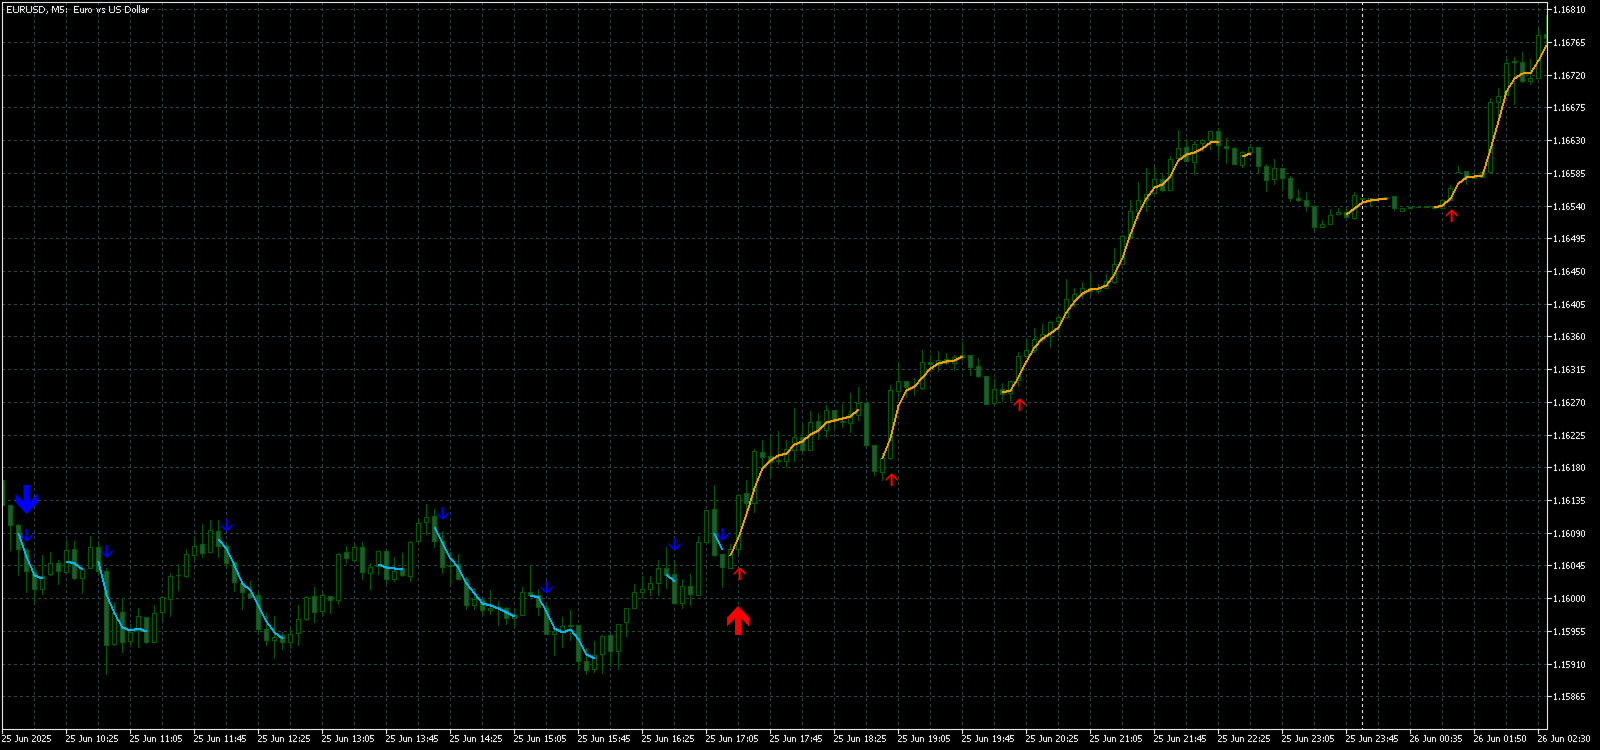
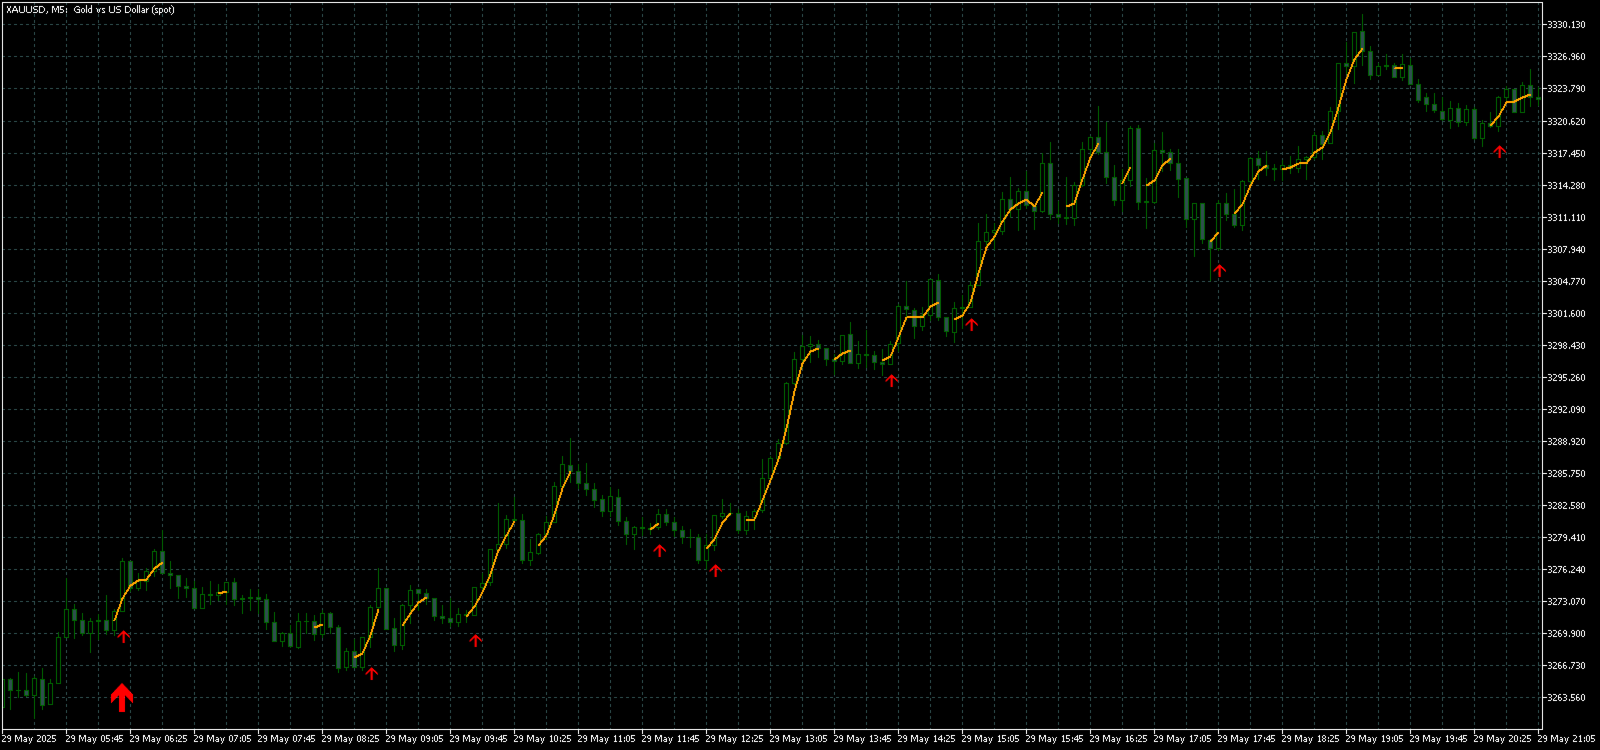
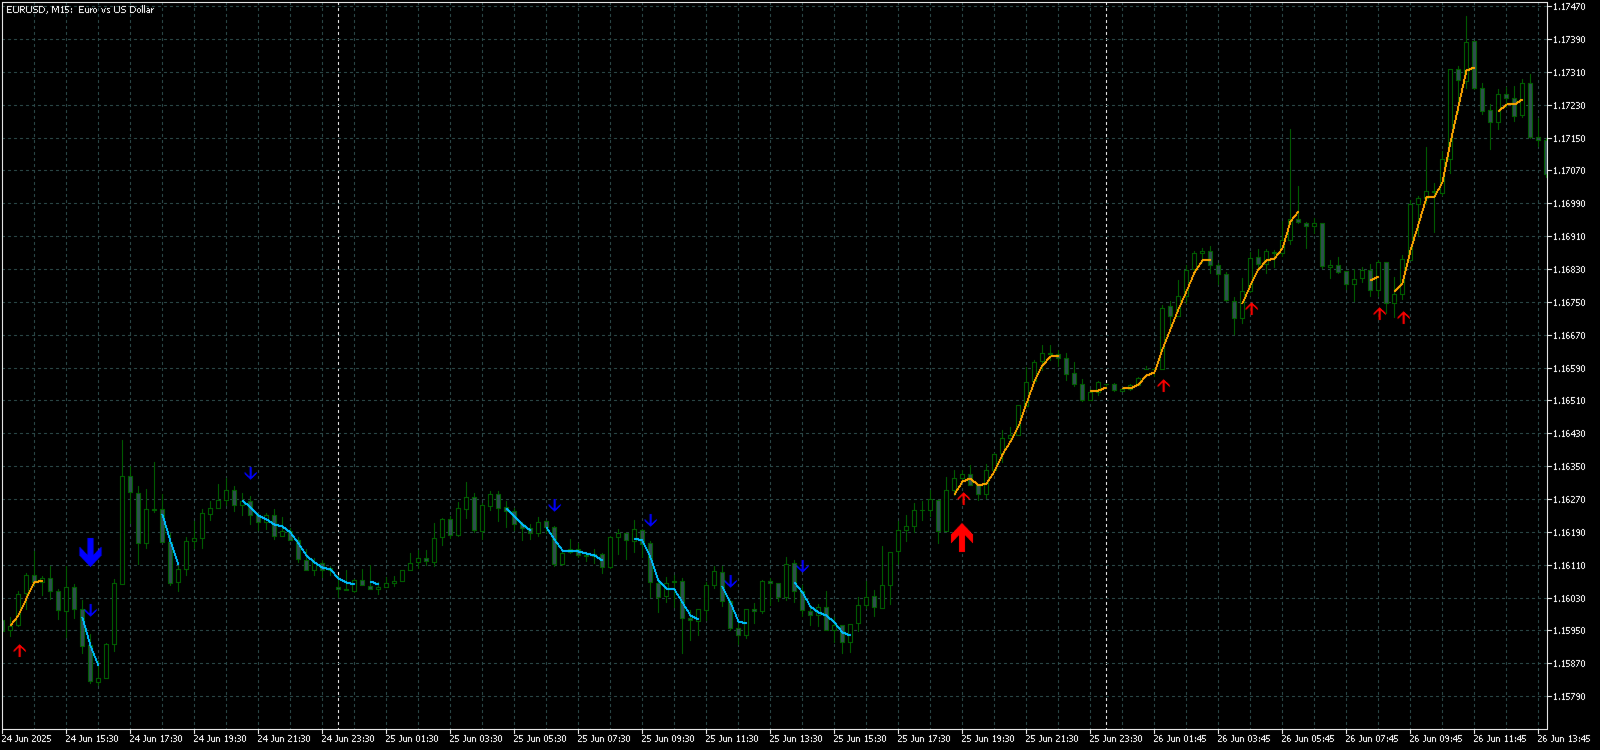
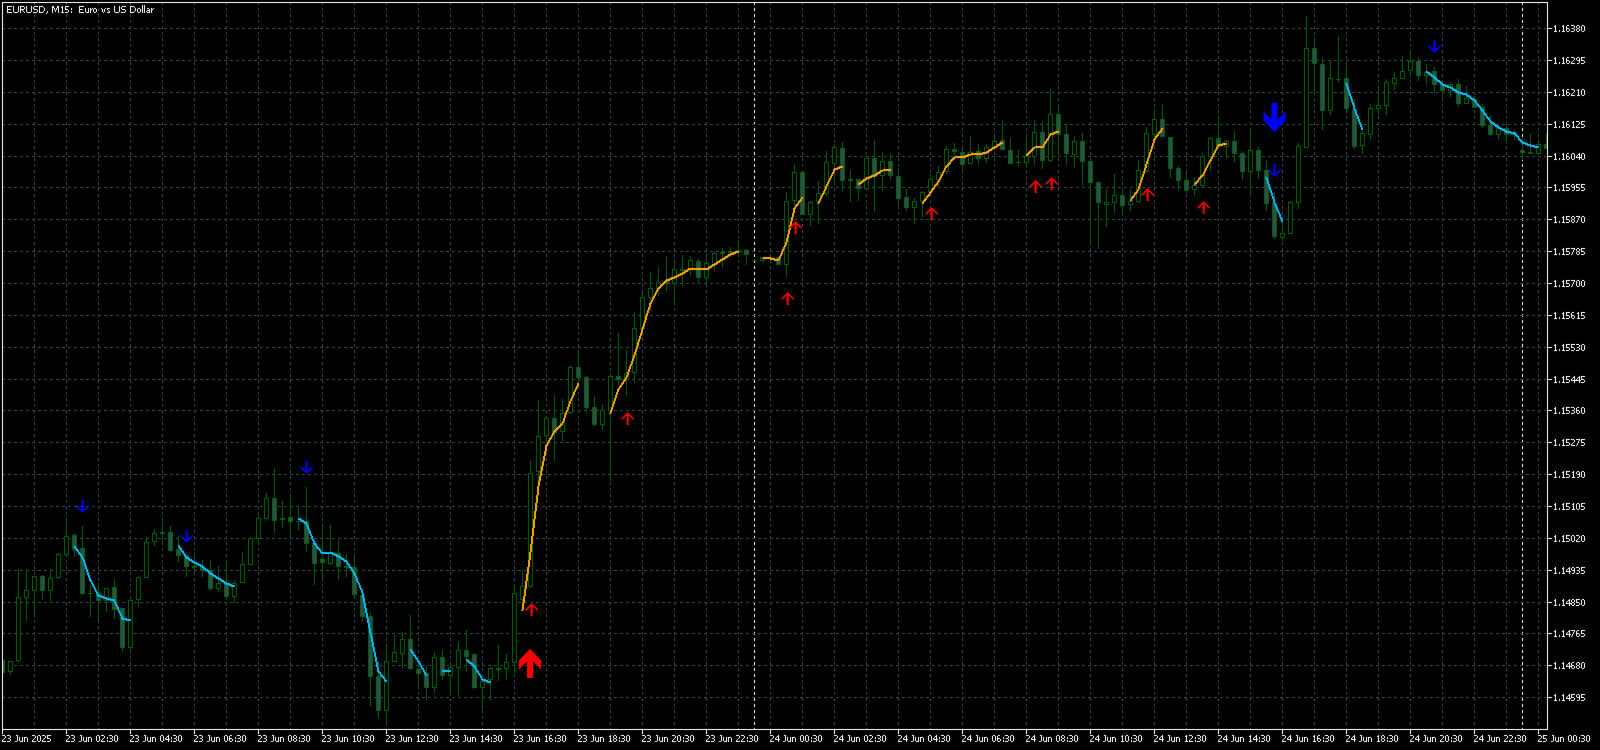
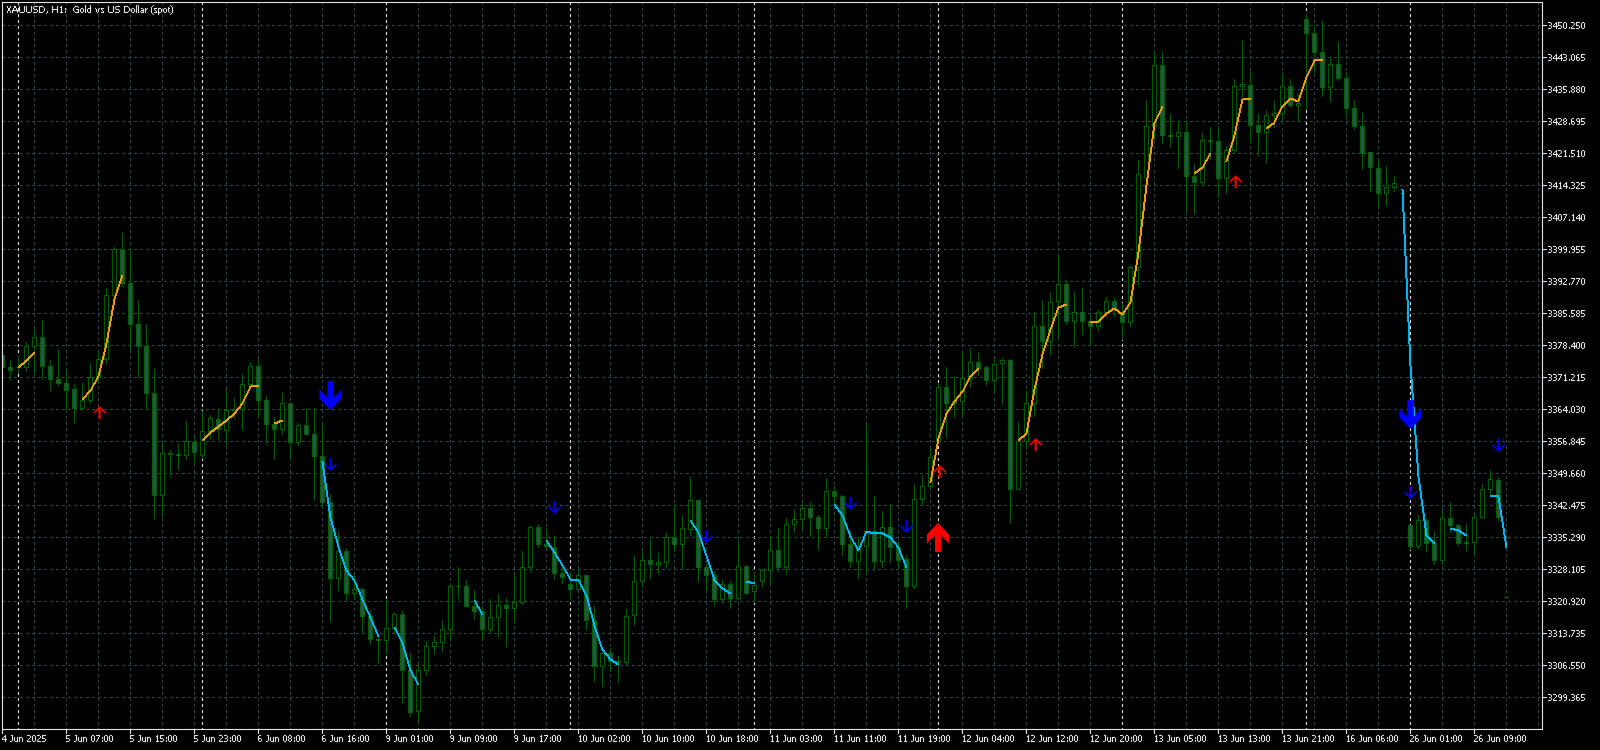
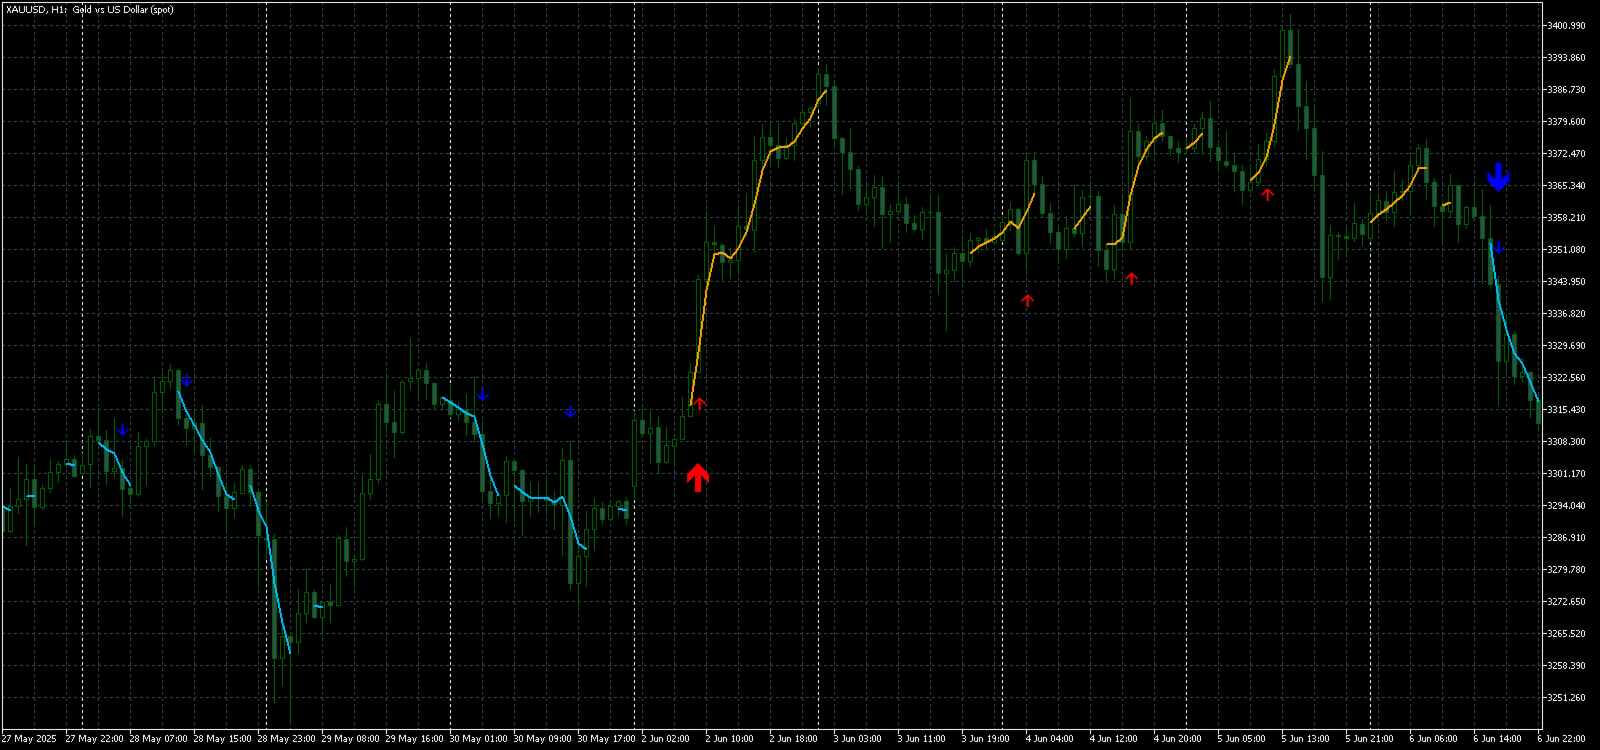
大きな矢印はトレンドの方向を決定します。
トレンド波の中では、小さな矢印の形でスキャルピングシグナルを生成するアルゴリズムが機能します。
赤い矢印は強気方向、青い矢印は弱気方向です。

トレンドの方向には敏感な価格変動ラインが描かれ、小さな矢印のシグナルと連動します。
シグナルは次のように機能します。適切なタイミングでラインが現れるとエントリーシグナルが形成され、ラインが開いている間はポジションが保持され、完了すると取引が終了します。
推奨される動作時間枠はM1~H4です。
矢印は現在のローソク足に形成され、次のローソク足が開いている場合は、前のローソク足の矢印は再描画されません。

入力パラメータ

Trend Wave Period - トレンド方向(大きな矢印)の周期は、トレンド波の時間間隔を変更します。値1は方向の継続期間が最も長く、パラメータが増加するにつれて継続期間が短くなります。

Scalper Arrows Period - シグナル矢印(小さな矢印)の計算期間は、エントリーシグナルの生成頻度を変更します。値3は最も頻繁に生成され、パラメータが増加するにつれて矢印の頻度は減少し、精度が向上します。

パラメータは、異なる時間枠と取引商品に合わせて変更できます。すべてのシグナルにアラートがあります。
おすすめのプロダクト
MT4版  |  FAQ Owl Smart Levels Indicator は、 Bill Williams の高度なフラクタル、市場の正しい波構造を構築する Valable ZigZag、エントリの正確なレベルをマークする Fibonacci レベルなどの一般的な市場分析ツールを含む 1 つのインジケーター内の完全な取引システムです。 利益を得るために市場と場所に。 戦略の詳細な説明 インジケータを操作するための指示 顧問-取引助手 プライベートユーザーチャット ->購入後に私に書いて、私はプライベートチャットにあなたを追加し、あなたはそこにすべてのボーナスをダウンロードすることができます 力はシンプルさにあります! Owl Smart Levels 取引システムは非常に使いやすいので、専門家にも、市場を勉強し始めて自分で取引戦略を選択し始めたばかりの人にも適しています。 戦略と指標に秘密の数式や計算方法が隠されているわけではなく、すべての戦略指標は公開されています。 Owl Smart Levels を使用すると、取引を開始するためのシグナルをすばやく確認し、注文を出すための
トレンドキャッチャー: アラートインジケーター付きのトレンドキャッチャーストラテジーは、市場トレンドやポテンシャルなエントリーポイントやエグジットポイントを特定するのに役立つ多目的な技術分析ツールです。動的なトレンドキャッチャーストラテジーを備えており、市場状況に適応してトレンドの方向を明確に視覚化します。トレーダーは、自身の好みやリスク許容度に合わせてパラメーターをカスタマイズできます。このインジケーターはトレンドの識別を支援し、ポテンシャルなリバーサルをシグナルし、トレイリングストップのメカニズムとして機能し、市場への迅速な対応のためのリアルタイムアラートを提供します。 特徴: - トレンドの識別:上昇トレンドと下降トレンドをシグナルします。 - トレンドのリバーサル:ローソク足の色が上昇から下降に変わった場合やその逆の場合に、ポテンシャルなリバーサルを警告します。 - リアルタイムアラート:新しいトレンドの識別に対するアラートを生成します。 推奨事項: - 通貨ペア:EURUSD、AUDUSD、XAUUSDなど... - タイムフレーム:H1。 - アカウントタイプ:
FREE
Note : i only sell this EA on MQL5, any other sellers is fake. Orbit Rage Final, a cutting-edge trading strategy meticulously designed around the bull/bear candle approach and divergence analysis. This powerful tool is engineered to empower you to shape the life you desire. To embark on this transformative journey, simply download and seamlessly integrate it into your MetaTrader 4 platform by placing it in the experts advisors folder. Orbit Rage Final revolutionizes trading by offering a risk-f
Gold EA: Proven Power for 1-Minute Gold Trading Transform your trading with our Gold EA, meticulously crafted for 1-minute charts and delivering over 2000% growth in 5 years from just $100-$1000 . No Martingale, No AI Gimmicks : Pure, time-tested strategies with robust money management, stop loss, and take profit for reliable performance across multiple charts. Flexible Trading Modes : Choose Fixed Balance for safe profits, Mark IV for bold growth, or %Balance for high rewards—combine Mark IV an
Market Maestro: Your Ideal Partner for Automated Forex Trading If you're looking for a reliable assistant for trading in the currency market, Market Maestro is exactly what you need. This modern Forex bot is built using the latest technologies and algorithms, allowing it to effectively analyze market data and make informed trading decisions in real-time. Key Features of Market Maestro 1. Multicurrency Capability for Broad Opportunities Market Maestro can work with a wide range of currency pairs,
STRICTLY FOR BOOM INDEX ONLY!!!!! Here I bring the Maximum Trend Arrows OT1.0 MT5 indicator. This indicator is made up of a combination of different trend indicators for entries and exits, for entries an orange arrow will paint on the chart below the current market and a red flag for closing of trades and it produces buy arrows only. When the orange arrow appears, it will appear along with it's sound to notify you. The 1H timeframe is recommended, don't use it anywhere else than on the 1H timefr
SolarTrade Suite 金融ロボット: LaunchPad Market Expert - 取引を開始するために設計されています! これは、革新的で高度なアルゴリズムを使用して値を計算する取引ロボットであり、金融​​市場の世界でのアシスタントです。 SolarTrade Suite シリーズのインジケーター セットを使用して、このロボットを起動するタイミングをより適切に選択してください。 説明の下部にある SolarTrade Suite シリーズの他の製品をご覧ください。 投資と金融市場の世界を自信を持ってナビゲートしたいですか? SolarTrade Suite 金融ロボット: LaunchPad Market Expert は、情報に基づいた投資決定を行い、利益を増やすのに役立つ革新的なソフトウェアです。 SolarTrade Suite 金融ロボット: LaunchPad Market Expert の利点: - 正確な計算: 当社のロボットは、高度なアルゴリズムと分析方法を使用して、市場の動きを正確に予測します。 資産を売買するのに最適なタイミングを
Magic EA MT5
Kyra Nickaline Watson-gordon
Magic EA is an Expert Advisor based on Scalping, Elliot Waves and with filters such as RSI, Stochastic and 3 other strategies managed and decided with the robot smartly. Large number of inputs and settings are tested and optimized and embedded in the program thus inputs are limited and very simple. Using EA doesn't need any professional information or Forex Trading Knowledge. EA can trade on all symbols and all time frames, using special and unique strategies developed by the author. The EA w
概要 このインジケーターは、クラシックな ドンチャンチャネル を強化したバージョンで、実践的なトレード機能を追加しています。 標準の3本線(上限、下限、中央線)に加え、 ブレイクアウト を検出し、チャート上に矢印で視覚的に表示します。また、チャートを見やすくするために、 現在のトレンド方向と逆側のラインのみを表示 します。 インジケーターの機能: 視覚的シグナル :ブレイクアウト時にカラフルな矢印を表示 自動通知 :ポップアップ、プッシュ通知、Eメール RSIフィルター :市場の相対的な強弱に基づいてシグナルを検証 カスタマイズ可能 :色、ラインの太さ、矢印コード、RSI閾値など 動作原理 ドンチャンチャネルは次のように計算します: 上限線 :直近N本のクローズ済みローソク足の最高値 下限線 :直近N本のクローズ済みローソク足の最安値 中央線 :最高値と最安値の平均値 上方ブレイクアウト は終値が上限線を超えたときに発生し、 下方ブレイクアウト は終値が下限線を下回ったときに発生します。 インジケーターは以下を行います: 3本のドンチャンラインを描画 方向転換後の最初のブレイクアウト
FREE
Manus Pro
Itumeleng Mohlouwa Kgotso Tladi
MANUS PRO EA The Trading Revolution You've Been Waiting For Are you TIRED of watching other traders make consistent profits while your account bleeds red?   The financial markets don't wait for anyone – and neither should you. MANUS PRO isn't just another Expert Advisor... it's your   TICKET TO FINANCIAL FREEDOM . Why MANUS PRO is Different (And Why Everyone's Talking About It) FOR BEGINNERS: Your Trading Mentor That Never Sleeps Zero Learning Curve   – Install, activate, and watch it wo
革新的な MT5 インジケーター、DARWIN Assistant   をご紹介します。これは、トレーディングを成功させる世界への究極のゲートウェイです。精度と専門知識に基づいて設計された DARWIN Assistant   は、RSI、ストキャスティクス、CCI、トレンドなどの高度なテクニカル指標をすべての時間枠にわたって活用する特別な戦略に基づいて動作します。この最先端のインジケーターはエントリーのための最も正確なシグナルを提供し、比類のない自信を持って市場をナビゲートできるようにするため、並外れた取引体験に備えてください。 DARWIN Assistant   を使用すると、最も収益性の高い取引機会を検出するために細心の注意を払って調整された、重要な指標の包括的な分析にアクセスできるようになります。不確実性に別れを告げ、情報に基づいた意思決定の新時代を迎えましょう。 RSI、ストキャスティクス、CCI、トレンドを DARWIN Assistant   内でシームレスに統合することでその力を解き放ち、これまでにないほど市場のダイナミクスを鮮明に描きます。 DARWIN As
Your Trend Friend
Luigi Nunes Labigalini
5 (1)
The trend is your friend! Look at the color of the indicator and trade on that direction. It does not  repaint. After each candle is closed, that's the color of the trend. You can focus on shorter faster trends or major trends, just test what's most suitable for the symbol and timeframe you trade. Simply change the "Length" parameter and the indicator will automatically adapt. You can also change the color, thickness and style of the lines. Download and give it a try! There are big movements w
Santa Scalping is a fully automated Expert Advisor with no use of martingale. Night scalping strategy. The SMA indicator filter are used for entries. This EA can be run from very small accounts. As small as 50 EUR. General Recommendations The minimum deposit is 50 USD,  default settings reccomend for eurusd m5 gmt +2 . Please use max spread 10 if you will not have orders change it to -1. Use a broker with good execution and with a spread of 2-5 points. A very fast VPS is required, preferably wi
Mac-Binary option Signals is unique mathematical concept to trade iqoptions,binary,rocketoptions specter or any other binary options company 1 min 5 expiry run robot 30min everyday and fill profit and loss ratios inside mt2iq/mt2binary and run or 1min to 5min expiry ...go to setting in mt2iq robot allow otc and digital options. and select risk 500and profit 300$ per day it can stop automatically after profit or loss... If it can close after loss restart and Reset profit and loss button run again
A scalping indicator based on mathematical patterns, which on average gives signals with relatively small SL, and also occasionally helps to catch big moves in the markets (more information in the video) This indicator has three main types of notifications: The first type warns of a possible/upcoming signal on the next bar The second type indicates the presence of a ready signal to enter the market/open a position The third type is for SL and TP levels - you will be notified every time price re
Noize Absorption Index - is the manual trading system that measures the difference of pressure between bears forces and bulls forces. Green line - is a noize free index that showing curent situation. Zero value of index shows totally choppy/flat market.Values above zero level shows how powerfull bullish wave is and values below zero measures bearish forces.Up arrow appears on bearish market when it's ready to reverse, dn arrow appears on weak bullish market, as a result of reverse expectation.
FFx Patterns Alerter gives trade suggestions with Entry, Target 1, Target 2 and StopLoss .... for any of the selected patterns (PinBar, Engulfing, InsideBar, OutsideBar) Below are the different options available: Multiple instances can be applied on the same chart to monitor different patterns Entry suggestion - pips to be added over the break for the entry 3 different options to calculate the SL - by pips, by ATR multiplier or at the pattern High/Low 3 different options to calculate the 2 TPs -
プレミアムレベルは、正しい予測の精度が80%を超える独自の指標です。 この指標は、最高のトレーディングスペシャリストによって2か月以上テストされています。 あなたが他のどこにも見つけられない作者の指標! スクリーンショットから、このツールの正確さを自分で確認できます。 1は、1キャンドルの有効期限を持つバイナリーオプションの取引に最適です。 2はすべての通貨ペア、株式、商品、暗号通貨で機能します 手順: 赤い矢印が表示されたらすぐにダウントレードを開き、青い矢印が表示されたら閉じます。青い矢印の後に開くこともできます。 試してテストしてください!推奨設定はデフォルトです! 日足チャートで最高の精度を示します! インディケータは、2600 Pipsの収益性に対して、約10Pipsという非常に小さなマージンを使用します。
Inverted_Chart_EA Utility Expert Advisor Inverted_Chart_EA creates and maintains a mirror-inverted chart of any symbol and timeframe. It automatically generates a custom instrument (e.g. US30_INV ) and keeps its price history updated in real time, with bars mirrored around a chosen pivot. This utility gives traders a new way to analyze the market from a different perspective by flipping the chart upside down. Why use an inverted chart? Highlight hidden patterns – price formations that look ordin
インジケーターについて このインジケーターは、金融商品の終値に対するモンテカルロシミュレーションに基づいています。モンテカルロ法とは、以前の観測結果に基づくランダムな数値を使用して、さまざまな結果の確率をモデル化するための統計的手法です。 どのように機能しますか? このインジケーターは、歴史的データに基づき、時間の経過とともにランダムに価格が変動する複数の価格シナリオを生成します。各シミュレーション試行は、 終値 の変動を考慮するためのランダム変数を使用し、与えられた期間における将来の市場変動を効果的に模倣します。 モンテカルロシミュレーションの利点 - モンテカルロシミュレーションは、複数の将来のシナリオに対して戦略をテストすることで、さまざまなトレード戦略のリスクを分析するのに役立ちます。 - 稀な極端なイベント(テールリスク)を含むさまざまな市場状況で戦略のパフォーマンスを把握することができます。 - 単一の予測に依存するのではなく、モンテカルロ法は関連する確率を伴う潜在的な結果の範囲を提供します。これにより、利益や損失の可能性を理解するのに役立ちます。 モンテカルロ法は、
BTC Scalper X   - Your best assistant in trading with Bitcoin. A fully automatic advisor that does not require additional settings, designed for trading on the Bitcoin currency pair. (BTCUSD) M5 Does not use dangerous trading methods, no grid, martingale, etc.The strategy is based on breaking through important levels. (fast scalping). Monitoring -  Soon Bonus: when you buy you get M1 Goldx X as a gift, write in a private message. Recommendations: Trading pair:   Bitcoin (BTCUSD) Timeframe:   M5
Statistical Arbitrage Spread Generator for Cointegration [MT5] What is Pair Trading? Pair trading is a market-neutral strategy that looks to exploit the relative price movement between two correlated assets — instead of betting on the direction of the market. The idea? When two assets that usually move together diverge beyond a statistically significant threshold, one is likely mispriced. You sell the expensive one, buy the cheap one , and profit when they converge again. It’s a statistica
FREE
This system was created for the NASDAQ-100 (NQ) in intraday trading (H1). Its logic is based on detecting breakouts after phases of relative calm and riding the momentum with risk management defined from the very start.The design was validated over 10 years of historical data, using in-sample/out-of-sample analysis, Walk Forward, and various robustness tests.It’s a slow, low-frequency bot that tends to trigger about ~9 times per month on average. It is aimed at experienced algorithmic traders wh
The RSI-Based Automatic Buy Strategy Expert Advisor (EA) is designed to automatically open buy positions when the RSI indicator enters the oversold zone. It smartly spaces new trades by maintaining a minimum distance between open positions to prevent excessive exposure. With adjustable take profit (TP) levels and lot sizes, this EA is specifically tailored for the XAUUSD (Gold) pair on the M5 timeframe. This Expert Advisor offers reliable and disciplined trade management for traders who want to
回帰取引を意味する専門的かつ定量的なアプローチを実装する独自の指標。これは、価格が予測可能かつ測定可能な方法で迂回して平均に戻るという事実を利用しており、非定量的な取引戦略を大幅に上回る明確な出入りルールを可能にします。 [ Installation Guide | Update Guide | Troubleshooting | FAQ | All Products ] 明確な取引シグナル 驚くほど簡単に取引できます カスタマイズ可能な色とサイズ パフォーマンス統計を実装します ほとんどの取引戦略を上回ります 適切なSLおよびTPレベルを表示します 電子メール/音声/視覚アラートを実装します 使い方 インディケータは、より高い時間枠からの完全にカスタマイズ可能な移動平均の周りの標準偏差を測定し、トレンドフォローアプローチを使用して正確に取引を見つけます。取引は、現在のチャートの価格アクションに飛び込むことによって見つけられ、価格が選択したより高い時間枠から計算された平均価格帯に戻ったときに閉じられます。それがコード化される方法のために、指標は高ボラティリティと強いトレンドの市場か
Classic Market Surfer EA - A Timeless, Proven Strategy for Gold Trading For years, this powerful trading strategy has been hidden from the public-reserved for a select few. Now, for the first time, the Classic Market Surfer EA is available to traders like you.   Built on pure, time-tested trading principles, this EA doesn't rely on trendy gimmicks like AI or machine learning. Instead, it harnesses a classic, robust strategy that has consistently delivered results over the years. This is not a "g
Cumulative Delta Indicator for MetaTrader 5 The Cumulative Delta Indicator is a dedicated volume analysis tool on MetaTrader 5 that monitors market buying and selling pressure. By comparing order flow data, it displays cumulative volume changes to help traders identify divergence signals. This MT5 indicator supports the detection of strong market trends, enhances liquidity analysis, and confirms price action behavior. «Indicator Installation & User Guide» MT5 Indicator Installation  |  Cumulativ
FREE
Gyroscope        professional forex expert   (for EURUSD, GBPUSD, USDJPY, AUDUSD, USDCHF, EURGBP, EURJPY, NZDUSD, USDCAD, EURCHF, AUDJPY, CADJPY pairs)   alyzing the market using the Elliot Wave Index. Elliott wave theory is the interpretation of processes in financial markets through a system of visual models (waves) on price charts. The author of the theory, Ralph Elliott, identified eight variants of alternating waves (of which five are in the trend and three are against the trend). The mov
Free automatic Fibonacci is an indicator that automatically plots a Fibonacci retracement based on the number of bars you select on the BarsToScan setting in the indicator. The Fibonacci is automatically updated in real time as new highest and lowest values appears amongst the selected bars. You can select which level values to be displayed in the indicator settings. You can also select the color of the levels thus enabling the trader to be able to attach the indicator several times with differe
FREE
EXPERTteam
Netanel Kahan Abuluf
Expert XAU is an advanced, precision-focused trading robot designed exclusively for XAUUSD on the 1h  timeframe . This EA uses a proprietary logic to identify high-quality buy opportunities, execute trades with calculated precision, and manage risk dynamically — all while keeping strategy details private to protect its competitive edge. Key Features: – 100% automated – High probability long entries – Built-in risk management – Plug & play: attach to 1h chart and go - in 6.5months will do 11
このプロダクトを購入した人は以下も購入しています
AriX
Temirlan Kdyrkhan
1 (2)
AriX Indicator for MT5 A powerful trend-following and signal-evaluation tool AriX is a custom MT5 indicator that combines Moving Averages and ATR-based risk/reward logic to generate clear buy/sell signals. It visualizes dynamic SL/TP levels, evaluates past trade outcomes, and displays win/loss statistics in a clean on-chart panel. Key features include: Buy/Sell signals based on MA crossovers ATR-based SL/TP1/TP2/TP3 levels with visual lines and labels Signal outcome tracking with real-time stat
ARIPoint is a powerful trading companion designed to generate high-probability entry signals with dynamic TP/SL/DP levels based on volatility. Built-in performance tracking shows win/loss stats, PP1/PP2 hits, and success rates all updated live. Key Features: Buy/Sell signals with adaptive volatility bands Real-time TP/SL/DP levels based on ATR Built-in MA Filter with optional ATR/StdDev volatility Performance stats panel (Success, Profit/Loss, PP1/PP2) Alerts via popup, sound, push, or email Cu
ARICoin is a powerful trading companion designed to generate high-probability entry signals with dynamic TP/SL/DP levels based on volatility. Built-in performance tracking shows win/loss stats, PP1/PP2 hits, and success rates all updated live. Key Features: Buy/Sell signals with adaptive volatility bands Real-time TP/SL/DP levels based on ATR Built-in MA Filter with optional ATR/StdDev volatility Performance stats panel (Success, Profit/Loss, PP1/PP2) Alerts via popup, sound, push, or email Cust
ARIScalp is a powerful trading companion designed to generate high-probability entry signals with dynamic TP/SL/DP levels based on volatility. Built-in performance tracking shows win/loss stats, PP1/PP2 hits, and success rates all updated live. Key Features: Buy/Sell signals with adaptive volatility bands Real-time TP/SL/DP levels based on ATR Built-in MA Filter with optional ATR/StdDev volatility Performance stats panel (Success, Profit/Loss, PP1/PP2) Alerts via popup, sound, push, or email Cus
Big Player Range
Thalles Nascimento De Carvalho
5 (3)
BigPlayerRange — MT5向け最強インジケーター BigPlayerRange は、MetaTrader 5 で日経ミニやドル先物などの取引において、 最も効果的なインジケーター と評価されています。大口投資家(機関投資家)の行動を可視化し、高精度なテクニカル分析を可能にします。 どのように機能するのか? BigPlayerRangeは、買い圧力ゾーン(緑ライン)と売り圧力ゾーン(赤ライン)を描画し、価格がその範囲を超えるとトレンド方向への動きを示唆します。 緑のライン上で終値: 買いの勢いが強く、上昇トレンドの可能性。 赤のライン下で終値: 売り圧力が優勢で、下落が予想される。 範囲内での価格: レンジ相場でブレイクを待つ段階。 主なメリット: 機関投資家ゾーンの検出: 大口のエントリーポイントを視覚化。 自動ターゲット計算: 利確ポイントを戦略的に設定。 プルバックの可能性分析: リスク管理に役立つ情報提供。 推奨の使い方: Imbalance DOM Pro と併用してゾーンブレイクを確認。 SwingVolum
A tool for on-chart strategy backtesting and performance analysis. A utility for developing, debugging, and testing custom trading ideas and indicator functions. An indicator designed to quickly test trading concepts and visualize the effectiveness of different input parameters. An all-in-one sandbox for testing everything from simple crossovers to complex, multi-condition trading systems.
無料のAUXインジケーター、EAサポート、完全ガイドをご利用ください – https://www.mql5.com/en/blogs/post/763955 トレンドを見極める。パターンを読む。エントリーのタイミングを掴む。 30秒以内の3ステップ!分析不要で簡単トレード — あなたのスマートアシスタントがワークフローを簡素化します チャートの過剰な情報にもう悩まされない。 スマートバイアス検出で自信を持ってトレード。 すべての通貨、暗号資産、株式、金属、指数、あらゆる時間足に対応。 クリックして実行するだけ — それだけで十分。 スピードと明快さを求める忙しいトレーダーに最適。 TPTSyncXは、 トレンド、パターン、 ローソク足のトリガー 分析を、洗練されたインテリジェントなビジュアルシステムとしてシームレスに統合する、強力なオールインワンMetaTrader 5インジケーターです。明確さ、正確さ、スピードを求めるトレーダー向けに設計されており、プライスアクション、構造的パターン、市場タイミングツールを組み合わせて、高確率のトレードセットアップを特定するのに役立ちます。 主な
The indicator is designed to work on any trading platform. The program is based on proprietary algorithms and W.D.Ganna's mathematics, allowing you to calculate target levels of price movement based on three points with the highest degree of certainty. It is a great tool for stock trading. The indicator has three buttons: NEW - call up a triangle for calculation. DEL - delete the selected triangle. DELS - completely remove all constructions. The probability of achieving the goals is more than 80
This indicator identifies and displays zones, as it were areas of strength, where the price will unfold. The indicator can work on any chart, any instrument, at any timeframe. The indicator has two modes. The indicator is equipped with a control panel with buttons for convenience and split into two modes. Manual mode: To work with manual mode, you need to press the NEW button, a segment will appear. This segment is stretched over the movement and the LVL button is pressed. The level is displayed
このインジケーターは、市場で 関心が示されたゾーン をハイライトし、その後に 注文の蓄積ゾーン を表示します。 これは、大規模な**板情報(オーダーブック)**のように機能します。 これは、 巨大な資金 のためのインジケーターです。その性能は卓越しています。 市場にどんな関心が存在していても、 必ず目に見えるようになります 。 (これは 完全に再設計され、自動化されたバージョン です。もはや手動分析は必要ありません。) トランザクションスピード(取引速度) は新しい概念のインジケーターで、市場で大口注文が どこに・いつ 集中しているかを示し、それに基づいたチャンスを提供します。 トレンドの変化を 非常に早い段階 で察知することができます。 FXでは「出来高」と呼ばれているものは誤解されています。実際には、これは 時間あたりの価格変動量 です。したがって、正しい名称は トランザクションスピード です。 考え方・行動・分析の仕方すべてが問われます。 分析パラダイムの転換は非常に重要です。 このインジケーターは、FXにおける出来高の考え方を 根本から再定義 し、論理的な形で正確に活用する、
VTrende Pro
Andrii Diachenko
5 (1)
VTrende Pro - MTF indicator for trend trading with a display panel for MT5 *** Videos can be translated into any language using subtitles (video language - Russian) Although the signals of the VTrende Pro indicator can be used as signals of a full-fledged trading system, it is recommended to use them in conjunction with the Bill Williams TS. VTrende Pro is an extended version of the VTrende indicator. Difference between Pro version and VTrende: - Time zones - Signal V - signal 1-2 waves -    S
Jeslyn MT5
Justine Kelechi Ekweh
これは、スキャルパー システムまたは非常に強い勢いに乗るして、FXによって使用される両方に適した多目的システムです。 Jeslyn 。シンプルな矢印インジケーターのように見えるかもしれませんが、洗練された論理的なアルゴリズムが組み込まれています。他の指標から計算を引き出すのではなく、価格変動のみに基づいて計算します。トレンド、勢いとの違い、ダイバージェンスと出来高スプレッド分析の関係を解釈する方法を見つけました。勢いよくポジションが埋まるミニ供給ゾーンと需要ゾーンがあり、これらは開始時に私たちが希望する場所です。また、メタトレーダーでは実際の出来高を取得できないとも言われていますが、私はそれを取得し、価格の勢いで操作する方法を見つけました。ボリューム、勢い、広がりがこの調理済みの食事の秘密のJeslynてています。シンプルな矢印インジケーターのように見えるかもしれませんが、洗練された論理的なアルゴリズムが組み込まれています。他の指標から計算を引き出すのではなく、価格変動のみに基づいて計算します。トレンド、勢いとの違い、ダイバージェンスと出来高スプレッド分析の関係を解釈する方法を見
MATADOR Signal Suite — Quant Pro v3.57 (Indicator) Signal-only   •   Chart Overlay + Alerts   (Popup/Push/JSON) •   SMC+   (OB/FVG/BOS) +   PA   +   HTF EMA   •   M1 - M5 XAUUSD, EURUSD ...   focused, multi-symbol ready MATADOR_v3_57_User_Manual_Multilingual & Strategy Tester  https://drive.google.com/drive/folders/1fnR-uAx6GnoDai5YnYMwF5WIvsHlE39j?usp=sharing What is it? MATADOR is a   multi-layer signal indicator   with institutional-grade filtering. It does   not   open trades; instead it dr
Reversal ALGO
Muhammad Abdullah Bhatti
Reversal Algo は、市場のトレンド転換点を特定するために設計された高度なテクニカル指標です。過去の価格データを詳細に分析し、トレンドの変化を示唆する重要な高値と安値を検出します。チャート上に明確な視覚シグナルを提供し、トレーダーが転換点となる可能性のある重要なエリアを特定できるようにします。 主な特徴 重要な価格レベルの検出: Reversal Algo は過去の価格データをスキャンし、市場ノイズを排除しながら、統計的に重要な高値・安値を特定します。 高度なノイズフィルター: ボラティリティに基づいたフィルターを使用し、小さな価格変動による誤ったシグナルを最小限に抑えます。 カスタマイズ可能なパラメータ: 感度や閾値を調整できるため、トレードスタイルや市場環境に応じて最適化が可能です。 強力なデータ分析: 過去の価格データを幅広く分析し、市場の動向を把握するための有益な情報を提供します。 仕組み 極値レベルの分析: 市場の高値・安値を詳細に評価し、ボラティリティ閾値を適用することで、重要な価格変動のみを抽出します。 シグナルの確認: 他のテクニカル指標(オシレー
Core Concept: Naveen Saroha's Advanced time and price angles are drawn from significant highs or lows at specific geometric ratios that represent the relationship between price movement and time. The Main Gann Angles and Percentage together Most Important: 1x1 Angle : One units of price for one unit of time  1x2 Angle : One unit of price for two units of time  1x3 Angle 1x4 Angle 1x5 Angle 1x6 Angle 1x7 Angle 1x8 Angle: (45) : Eight unit of price for one unit of time - considered the most i
The indicator is designed to close positions on the market in time. For example: to take profits ahead of schedule if the price has not reached TakeProfit, and the market is turning around. The indicator analyzes the momentum, not the trend. He does not give any information about the trend. The indicator is well suited for finding divergence. The Ershov 38 Parrots indicator dynamically adjusts to the market and detects price movement impulses of medium and high amplitude. It almost does not rea
The Second-Level Tick Candlestick Generator is a professional-grade MT5 indicator tool specifically designed for high-frequency trading and short-term scalping. It can convert raw tick data into highly customizable second-level candlestick charts in real-time, helping traders accurately capture micro-market fluctuations and optimize entry and exit timing. This tool provides clear chart displays, allowing you to more intuitively identify price action patterns and improve trading decision efficien
Trend Compass: All-in-One Trend Tracking The Trend Compass indicator is a sophisticated yet user-friendly trading tool designed for both novice and experienced traders. By combining multiple technical analysis approaches into one comprehensive package, it eliminates the need for multiple indicators cluttering your charts. Key Features: Multiple analysis modes including VSA for effort/result evaluation Dynamic trailing stops using fractal levels Seven color visualization options for clear market
The Smooth Price technical indicator is used for plotting a smoothed line as close to the price of the financial instrument as possible, and serves to eliminate its noise components. The indicator is part of the Monarch trading system, but here it is presented as an independent technical analysis tool. The indicator is based on the cluster digital filter , which, unlike the ClusterSMA , is applied directly to the price time series. Smooth Price does not redraw (except the very last, zero bar) an
The Expert Advisor and the video are attached in the Discussion tab . The robot applies only one order and strictly follows the signals to evaluate the indicator efficiency. Pan PrizMA CD Phase is an option based on the Pan PrizMA indicator. Details (in Russian). Averaging by a quadric-quartic polynomial increases the smoothness of lines, adds momentum and rhythm. Extrapolation by the sinusoid function near a constant allows adjusting the delay or lead of signals. The value of the phase - wave s
Классификатор силы тренда. Показания на истории не меняет. Изменяется классификация только незакрытого бара. По идее подобен полной системе ASCTrend, сигнальный модуль которой, точнее его аппроксимация в несколько "урезанном" виде, есть в свободном доступе, а также в терминале как сигнальный индикатор SilverTrend . Точной копией системы ASCTrend не является. Работает на всех инструментах и всех временных диапазонах. Индикатор использует несколько некоррелируемых между собой алгоритмов для класси
FFx Universal Strength Meter PRO is more than a basic strength meter. Instead of limiting the calculation to price, it can be based on any of the 19 integrated strength modes + 9 timeframes. With the FFx USM, you are able to define any period for any combination of timeframes. For example, you can set the dashboard for the last 10 candles for M15-H1-H4… Full flexibility! Very easy to interpret... It gives a great idea about which currency is weak and which is strong, so you can find the best pai
The FFx Universal MTF alerter shows on a single chart all the timeframes (M1 to Monthly) with their own status for the chosen indicator. 9 indicators mode (MACD-RSI-Stochastic-MA-ADX-Ichimoku-Candles-CCI-PSAR). Each can be applied multiple times on the same chart with different settings. Very easy to interpret. Confirm your BUY entries when most of the timeframes are showing green color. And confirm your SELL entries when most of the timeframes are showing red color. 2 Alert Options : input to s
The FFx Watcher PRO is a dashboard displaying on a single chart the current direction of up to 15 standard indicators and up to 21 timeframes. It has 2 different modes: Watcher mode: Multi Indicators User is able to select up to 15 indicators to be displayed User is able to select up to 21 timeframes to be displayed Watcher mode: Multi Pairs User is able to select any number of pairs/symbols User is able to select up to 21 timeframes to be displayed This mode uses one of the standard indicators
MetaTrader 4 version available here : https://www.mql5.com/en/market/product/24881 FFx Basket Scanner is a global tool scanning all pairs and all timeframes over up to five indicators among the 16 available. You will clearly see which currencies to avoid trading and which ones to focus on. Once a currency goes into an extreme zone (e.g. 20/80%), you can trade the whole basket with great confidence. Another way to use it is to look at two currencies (weak vs strong) to find the best single pairs
MetaTrader 4 version available here: https://www.mql5.com/en/market/product/25793 FFx Pivot SR Suite PRO is a complete suite for support and resistance levels. Support and Resistance are the most used levels in all kinds of trading. Can be used to find reversal trend, to set targets and stop, etc. The indicator is fully flexible directly from the chart 4 periods to choose for the calculation: 4Hours, Daily, Weekly and Monthly 4 formulas to choose for the calculation: Classic, Camarilla, Fibonac
Indicador en base a la pendiente de la linea de precio, dibuja una línea de color cuando sube a base de los precios que previamente has sido procesados o linealizados, y cuando baja la pendiente la linea linealizada toma otro color. En este caso se a considerado 6 lineas de diferentes procesos desde pendientes largas hacia las cortas, observándose que cuando coincidan las pendientes se produce un máximo o mínimo, lo que a simple vista nos permitirá hacer una COMPRA O VENTA.
Индикатор Coefficient Of Determination (COD) представляет собой значение коэффициента детерминации или квадрат коэффициента корреляции между зависимой переменной — ценой и объясняющей переменной — тиковым объемом. Что это дает нам на практике? COD отлично распознает кульминацию трендовых движений, что позволяет подбирать оптимальные точки и ловить развороты рынка. Как использовать индикатор: Наиболее популярная торговая стратегия строится совместно с трендовым индикатором Moving Average (MA), пе
Fibonacci Múltiple 12, utiliza la serie fibonacci plasmado en el indicador fibonacci, aumentadolo 12 veces según su secuencia. El indicador fibonacci normalmente muestra una vez, el presente indicador se mostrara 12 veces empezando el numero que le indique siguiendo la secuencia. Se puede utilizar para ver la tendencia en periodos cortos y largos, de minutos a meses, solo aumentado el numero MULTIPLICA.
作者のその他のプロダクト
Volatility Trend System - a trading system that gives signals for entries. The volatility system gives linear and point signals in the direction of the trend, as well as signals to exit it, without redrawing and delays. The trend indicator monitors the direction of the medium-term trend, shows the direction and its change. The signal indicator is based on changes in volatility and shows market entries. The indicator is equipped with several types of alerts. Can be applied to various trading ins
Trading System Double Trend - 複数のインジケーターで構成された独立したトレーディングシステムです。全体的なトレンドの方向を判断し、価格変動の方向を示すシグナルを発します。 スキャルピング、日中取引、週次取引に使用できます。 機能 あらゆる時間枠と取引商品(FX、仮想通貨、貴金属、株式、指数)で動作します。 チャートをロードすることなく、情報を視覚的に簡単に確認できます。 インジケーターは再描画されず、シグナルも完了しません。 ローソク足が閉じた時のみ機能します。 シグナルには複数の種類のアラートがあります。 視覚的に理解しやすく、チャートに貼り付けて、シグナルのシンプルな推奨事項に従うだけです。 入力パラメータは、システム内のトレンドごとに設定されています。 General trend - 全体的なトレンドを判断します。 Signal trend - エントリーとエグジットのシグナルを発します。 Play sound / Display pop-up message / Send push notification / Send email -
Upper and Lower Reversal - 反転の瞬間を早期に予測するシステム。上限と下限の価格変動チャネルの境界にある価格の転換点を見つけることができます。 インジケーターの色が変わったり、信号矢印の位置が変更されることはありません。 赤い矢印は買いシグナル、青い矢印は売りシグナルです。 あらゆる時間枠と取引商品に調整します インジケーターは再描画されず、ローソク足が閉じるときにのみ機能します。 信号のアラートにはいくつかの種類があります このインジケーターは使いやすく、構成可能な外部パラメーターは 2 つだけです。 Channel Length - シグナルが構築される価格チャネルの長さを調整します。 Signal Normalization - シグナル矢印の品質レベルを変更します。パラメーターが高くなるほど、誤ったシグナルが減少します (BTC、ゴールド、および揮発性の高い商品では数桁変化します)。 Alerts play sound / Alerts display message / Alerts send notification / Send emai
Wave Price Channel - 衝動と修正を検索するように設計された取引分析システム。 このインジケーターを使用すると、ボラティリティに基づいて構築された価格チャネルの方向に作業することができます。 チャネル上に上向きまたは下向きの矢印が描かれると、この方向に進むことが可能になります。この方向のシグナルは、価格の変化に敏感なドットインジケーターによって確認されます。 同じ色のドットが続く限り信号は継続します。矢印はあるが、同じ色のドットがない場合、その信号は偽であり、ドットが表示されたらそれに従う必要があります。 このインジケーターには、異なる時間枠に対して変更できる唯一の変更可能なパラメーター「価格チャネルの長さ」があります。 タイムフレーム M15 以降での使用を推奨します。 あらゆる取引商品に使用できます。 矢印にはいくつかの種類のアラートがあります。 操作中にシグナルアローを1本のキャンドルに変更することが可能です。 赤い上向き矢印が表示されたら、購入の合図です。赤い点は矢印の軌跡の続きです。 黄色の下矢印が表示された場合は販売の合図であり、黄色の点は矢印の軌跡の
Point Directions - 価格変動時のポイント・サポートレベルとレジスタンスレベルを表示するインジケーターです。矢印は、指定された方向への価格反発を示します。 矢印は再描画されず、現在のローソク足上に形成されます。すべての時間枠と取引商品で機能します。複数の種類のアラートが用意されています。 あらゆるチャートに合わせてシグナルをカスタマイズするための高度な設定を備えています。トレンド取引と調整取引の両方に対応しています。 矢印をプロットするには、2種類の移動平均線と矢印の強度レベルがあります。詳細な設定は入力パラメータに記載されています。 使用方法に関するご質問は、プライベートメッセージをお送りください。 入力パラメータ Method MA - 矢印を生成するために移動平均線を使用するかどうかを選択します(標準または加速)。 Accelerated MA period/Standard MA period - 移動平均線期間を変更します(5~500)。 Ma Metod - 移動平均線方式を変更します。 Ma Price - 移動平均線価格を変更します。 Arrow
Indicator for manual trading and technical analysis for Forex. It consists of a trend indicator with the opening level of the trading day and a arrow indicator for determining entry points. The indicator does not recolor; it works when the candle closes. Contains several types of alerts for signal arrows. Can be configured to work on any chart, trading instrument or time frame. The work strategy is based on searching for price movements along the trend.  To make " Buy " transactions: The tre
Scalping Entry Points - is a manual trading system that can adjust to price movements and give signals to open trades without redrawing. The indicator determines the direction of the trend by the central level of support and resistance. The dot indicator provides signals for entries and exits.  Suitable for manual intraday trading, scalping and binary options. Works on all time frames and trading instruments. The indicator gives several types of alerts. How to use the product The blue line det
Wave Reversal Indicator - determines the direction of trend waves and price reversals. The indicator shows wave movements and trend directions. It gives recommendations where to follow the trader, helps to follow the trading strategy. It is an addition to an intraday or medium-term strategy. Almost all parameters are selected for each time frame and are changed automatically, the only parameter for manual adjustment is the wavelength. Works on various trading instruments and timeframes, recomme
FREE
トレンド指標は、金融市場での取引に使用されるテクニカル分析の領域の 1 つです。 Angular Trend Lines ー - トレンドの方向を総合的に判断し、エントリー シグナルを生成します。ろうそくの平均方向を平滑化するだけでなく トレンドラインの傾斜角度も使用します。傾斜角の基礎として、ガン角を構築する原理が採用されました。 テクニカル分析インジケーターは、ローソク足の平滑化とチャートの形状を組み合わせたものです。 トレンド ラインと矢印には 2 つの種類があります。赤い線と矢印は強気方向、紫の線と矢印は弱気方向です。 インジケーターの機能 このインジケーターは使いやすく、パラメータの設定も簡単で、トレンド分析や注文開始のシグナルの受信に使用できます。 インジケーターは再描画されず、ローソク足の終値に矢印が表示されます。 信号が発生したときに複数の種類のアラートを提供します。 あらゆる金融商品(外国為替、暗号通貨、貴金属、株式、指数)に使用できます。 このインジケーターは、どの時間枠やチャートでも機能します。 このインジケーターはプロセッサに負荷をかけない軽量アルゴリズム
チャートを構成し、周期的な価格変動を識別するテクニカル指標。 どのチャートでも動作します。 いくつかの種類の通知。 グラフ自体に追加の矢印があります。 履歴を再描画せずに、キャンドルのクローズに取り組みます。 M5以上のTFを推奨します。 パラメータの使用と設定が簡単です。 異なるパラメータを持つ 2 つのインジケーターを使用する場合、他のインジケーターなしで使用できます。 入力パラメータは2つあります 周期性と信号持続時間 これら 2 つのパラメータは、チャート構造の処理を扱います。 Cyclicity - 反転サイクルが変化する頻度を調整し、サイクルを滑らかにします。 Signal duration - 最小数では価格変動の衝動を検出し、最大数では長期的なトレンドの動きを検出します。
Arrow Micro Scalper は、スキャルピングと短期取引用に設計されたインジケーターで、あらゆるチャートや金融商品 (通貨、仮想通貨、株式、金属) に統合されています。 彼女は仕事で波動分析とトレンド方向フィルターを使用しています。 M1 から H4 までのタイムフレームでの使用が推奨されます。 インジケーターの操作方法。 インジケーターには設定を変更するための 2 つの外部パラメーターが含まれており、残りはデフォルトですでに構成されています。 大きな矢印はトレンド方向の変化を示し、青い矢印は下降トレンドの始まりを、ピンクの矢印は上昇トレンドの始まりを示します。 「 Only trending direction 」パラメータは、内部トレンドを使用するモードを有効または無効にし、独自のトレンドを使用するか、トレンドを使用せずに作業する機会を提供します。また、トレンド矢印とシグナルのみのトレンド矢印の表示を有効または無効にします。 小さなシグナル矢印、インジケーターの最も重要なオブジェクト、ピンクは「買い」トランザクション、青は「売り」トランザクション。 「 Smooth
Indicator Waiting Volatility - an indicator for determining volatility zones and flat conditions. Over time, the price on the chart is in different trends, goes down, goes up, or stays the same. The indicator helps the trader determine which trend the price is in. In its work, it uses several tools for technical analysis; first, the direction of the trend is determined, then, in this direction, the indicator monitors changes in volatility. If the price fluctuates within the noise, it is in track
Upper and Lower Reversal - 反転の瞬間を早期に予測するシステム。上限と下限の価格変動チャネルの境界にある価格の転換点を見つけることができます。 インジケーターの色が変わったり、信号矢印の位置が変更されることはありません。 赤い矢印は買いシグナル、青い矢印は売りシグナルです。 あらゆる時間枠と取引商品に調整します インジケーターは再描画されず、ローソク足が閉じるときにのみ機能します。 信号のアラートにはいくつかの種類があります このインジケーターは使いやすく、構成可能な外部パラメーターは 2 つだけです。 Channel Length - シグナルが構築される価格チャネルの長さを調整します。 Signal Normalization - シグナル矢印の品質レベルを変更します。パラメーターが高くなるほど、誤ったシグナルが減少します (BTC、ゴールド、および揮発性の高い商品では数桁変化します)。 Alerts play sound / Alerts display message / Alerts send notification / Send emai
A technical indicator that calculates its readings on trading volumes. In the form of a histogram, it shows the accumulation of the strength of the movement of the trading instrument. It has independent calculation systems for bullish and bearish directions. Works on any trading instruments and time frames. Can complement any trading system. The indicator does not redraw its values, the signals appear on the current candle. It is easy to use and does not load the chart, does not require addition
A trend indicator showing the strength of bulls and bears in a trading range. Consists of two lines: The green line is a balanced overbought/oversold condition. The red line is the direction of trading activity. Does not redraw calculations. Can be used on all Symbols/Instruments/Time Frames. Easy to use and set up. How to use the indicator and what it determines. The basic rule is to follow the direction of the red line: if it crosses the green line from the bottom up, the market is dominat
FREE
The indicator " ZigZag on Trend " is an assistant in determining the direction of price movement, as well as a calculator of bars and points. It consists of a trend indicator, which follows the price direction by the trend line presented in the form of a zigzag and a counter calculating the number of bars traversed in the direction of the trend and the number of points on the vertical scale. (calculations are carried out by the opening of the bar) The indicator does not redraw. For convenience,
Arrow indicator with trend filter. Generates trend input without delays or delays - on the emerging candle. Suitable for use on any trading tools and timeframes. Easy to use, contains the direction of the trend in the form of a histogram lines and signal generator. Input parameters Period Trend Line - Period of the Histogram Line Signal Generator Period - If the period is longer, then the arrows are less Play sound Display pop-up message Send push notification Send email Sound file signal - Fi
A trend indicator that determines short-term price movements. Arrows indicate an increase in price movements in the specified directions. Arrows are not redrawn formed on the current candle, shown on the previous candle for convenience.      It has one setting - the formation intensity: If the parameter is smaller, most of the signals are formed in a wide trend. If the parameter is larger, signals are formed in a narrower trend. Input parameters Formation Intensity - Arrow Formation Intensity
Cluster indicator working in the price channel. For operation, the indicator builds a channel line - (dashed line). Inside the channel, cluster sections are determined that determine the direction of the price movement - (histograms in two directions), start with large arrows. Small arrows are plotted above / below each histogram - indicator increase volatility. The indicator does not redraw the values. Works on any tools and timeframes. Entrances are made when large arrows appear, inside small
A technical indicator that calculates its readings based on trading volumes. It has an oscillatory line that follows the change in volumes. Large arrows on the line indicate reversal values. A channel is built around the line with small arrows showing the strengthening of price movement in the direction of increasing volumes. The indicator does not redraw values. Works on any instrument and timeframe. It can complement any trading strategy by finding a trend or make entries in the direction of a
Cyclical indicator for trading and predicting the direction of the market. Shows the cyclical behavior of the price in the form of an oscillator. Gives signals for opening deals when rebounding from the upper and lower boundaries of the oscillator. In the form of a histogram, it shows the smoothed strength of the trend. Will complement any trading strategy, from scalping to intraday. The indicator does not redraw. Suitable for use on all symbols/instruments. Suitable time frames for short-term t
Max Min Reversal Arrows - an arrow reversal indicator for predicting price movement. The indicator is built on the support and resistance levels at the local lows and highs of the price. Product features Arrows appear on the current candle. The indicator does not redraw. Can be used on all time frames and trading instruments. Recommended timeframes to use M30, H1, H4. The dotted lines are the support and resistance levels within the signal. Price movement from these levels means a reversal. Pr
Candle Binary Scalper - is a technical analysis product for forex and binary options. Includes several technical indicators combined into a trading system. Suitable for manual trading within a trend, for scalping and binary options. Works on all time frames and trading instruments. Recommended Timeframes for trading M15, M30, H1 and H4, M5 and M1 should be used in case of high volatility. There are several types of alerts. How to use the product The optimal settings have already been selected
Binary Lines is a technical analysis indicator for currencies, commodities, cryptocurrencies, stocks, indices and any financial instruments. Can be used for binary options or Forex scalping. Shows entry and exit points at fixed intervals and provides traders the necessary information about the results of possible transactions. Entry points are formed at the very beginning of the candle, in the direction of the MA line, duration trades in bars can be adjusted manually and adjusted to any financia
Line Breakouts - System for trend trading. Contains a trend identifier that can be adapted to any chart and trading instrument using the period and smoothing function. And a determinant of support and resistance levels. When the price is below the resistance line, open Sell trades, and when the price is above support lines - open Buy transactions. Stop loss should be placed a few points from the lines, Take Profit should be fixed after several candles (3-10-15), based on the time frame. The indi
Point Trend Indicator - An indicator of the upper and lower level of the trend, which can determine the trend direction and indicate its strengthening. The trend direction is determined by round dots; if the points are above the zero line, the trend is bullish; if below, the trend is bearish. The increase in directional movement is indicated by arrows. It has the only parameter for manual adjustment - Duration of the trend direction.   Possibilities Works on all time frames Adapts to any financ
Scalping and Binary Signal Detector - Scalping indicator that gives directional signals for opening positions along the trend. The indicator is a complete trading system that can be used for Forex and binary options. The system of algorithms allows you to recognize intense price movements in several consecutive bars. The indicator provides several types of alerts for arrows. Works on any trading instruments and time frames (M5 or Higher recommended). How to use for trading The appearance of a
Level Breakout Indicator is a technical analysis product that works from upper and lower boundaries, which can determine the direction of the trend. Works on candle 0 without redrawing or delays. In its work, it uses a system of different indicators, the parameters of which have already been configured and combined into a single parameter - “ Scale ”, which performs gradation of periods. The indicator is easy to use, does not require any calculations, using a single parameter you need to select
An automatic trend indicator that uses an algorithm to determine impulse signals for scalping and intraday trading. The trend-following indicator automatically calculates potential entry and exit points for trades. The indicator contains a trend line and a target channel for following signals, changing color depending on the direction. Main characteristics Signal colored candles and arrows: blue - downward direction, red - upward direction. Yellow dots for exiting trades are located along the
The BB Reversal Arrows technical trading system has been developed to predict reverse points for making retail decisions. The current market situation is analyzed by the indicator and structured for several criteria: the expectation of reversal moments, potential turning points, purchase and sale signals. The indicator does not contain excess information, has a visual understandable interface, allowing traders to make reasonable decisions. All arrows appear to close the candle, without redrawin
フィルタ:
レビューなし
レビューに返信