AutoColor PRO MT4
- Indicators
-
Ivan Butko
 Greetings, friends!
I write in mql4 and mql5. In my market you will find a variety of products, every day I develop something new, I research something. New indicators and advisors will appear in the near future. - Version: 1.0
- Activations: 20
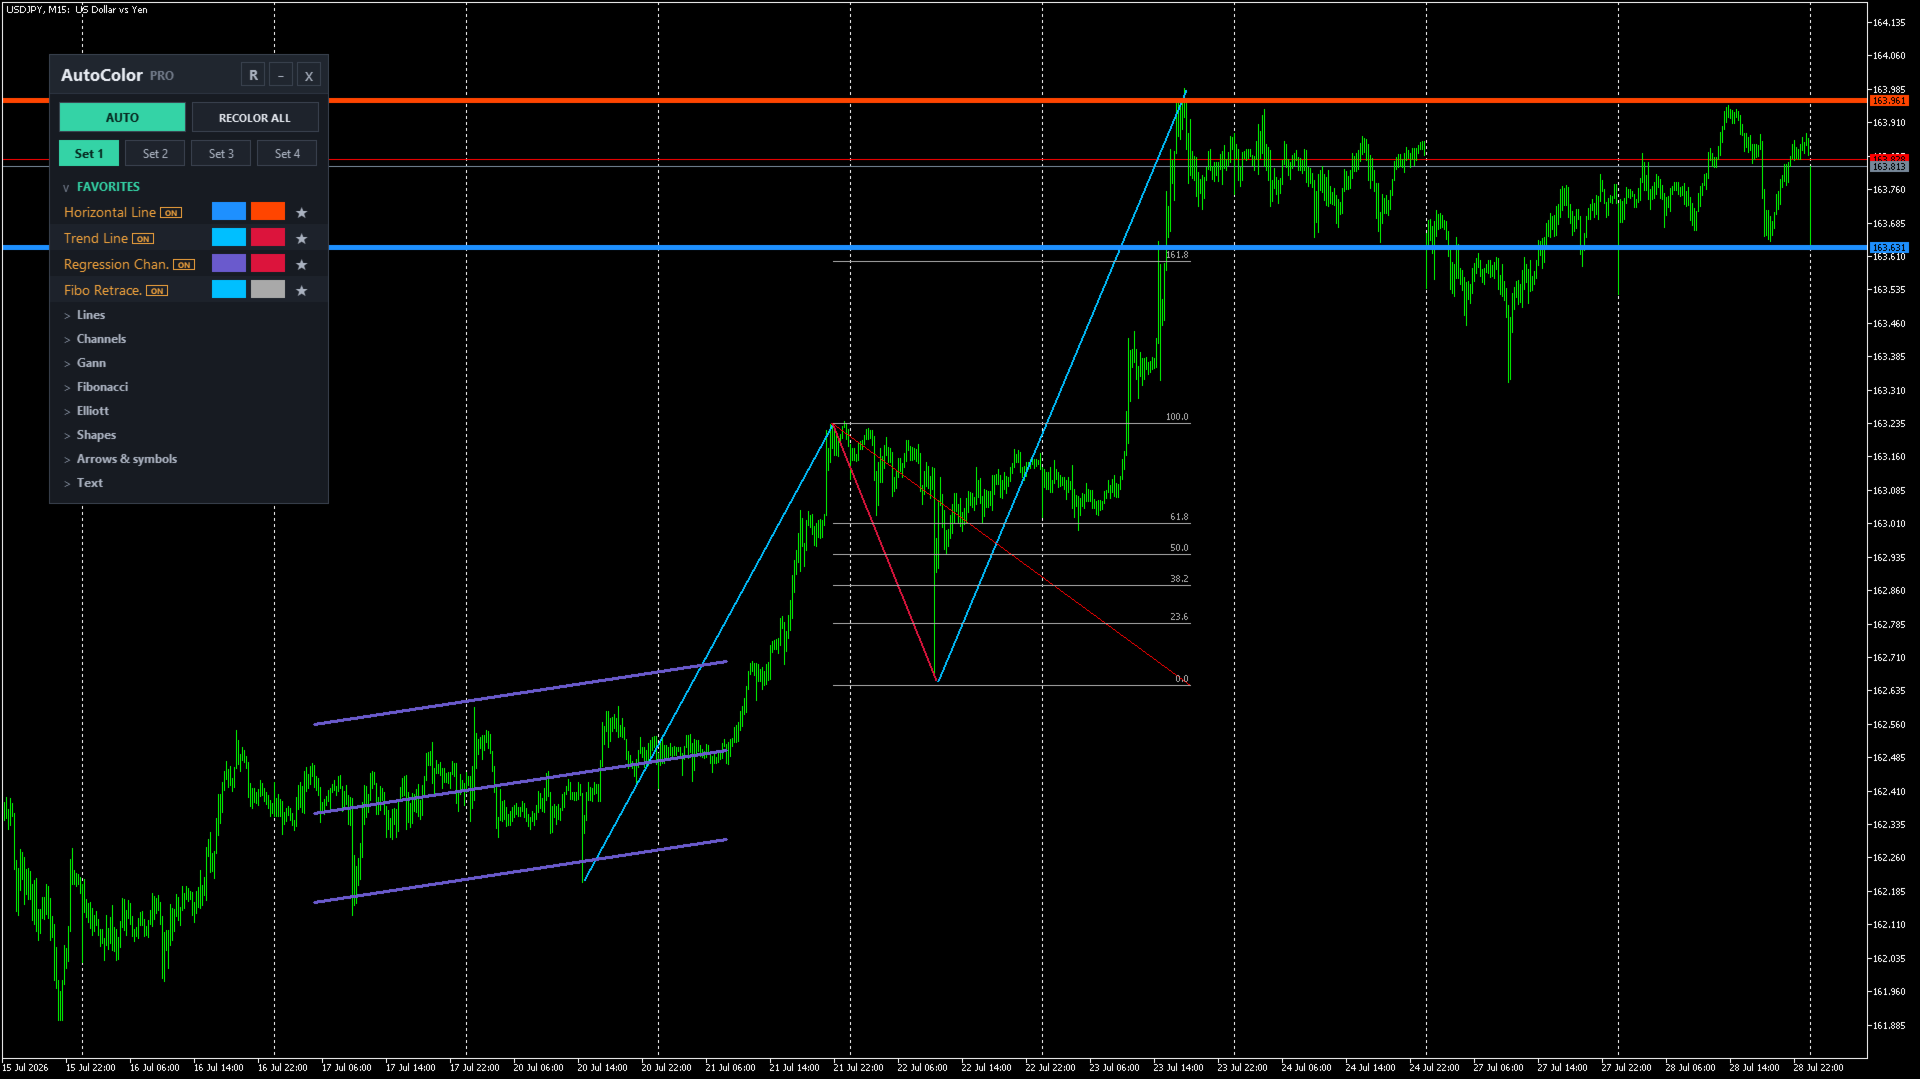
AutoColor PRO MT4 is a utility indicator for automatically managing the colors of graphical objects in MetaTrader 4.
It recognizes the object type and geometry, determines its direction or its position relative to the current price, and applies the appropriate color. For composite analytical tools, AutoColor PRO MT4 colors the visually meaningful parts: lines, channels, levels, rays, and arcs.
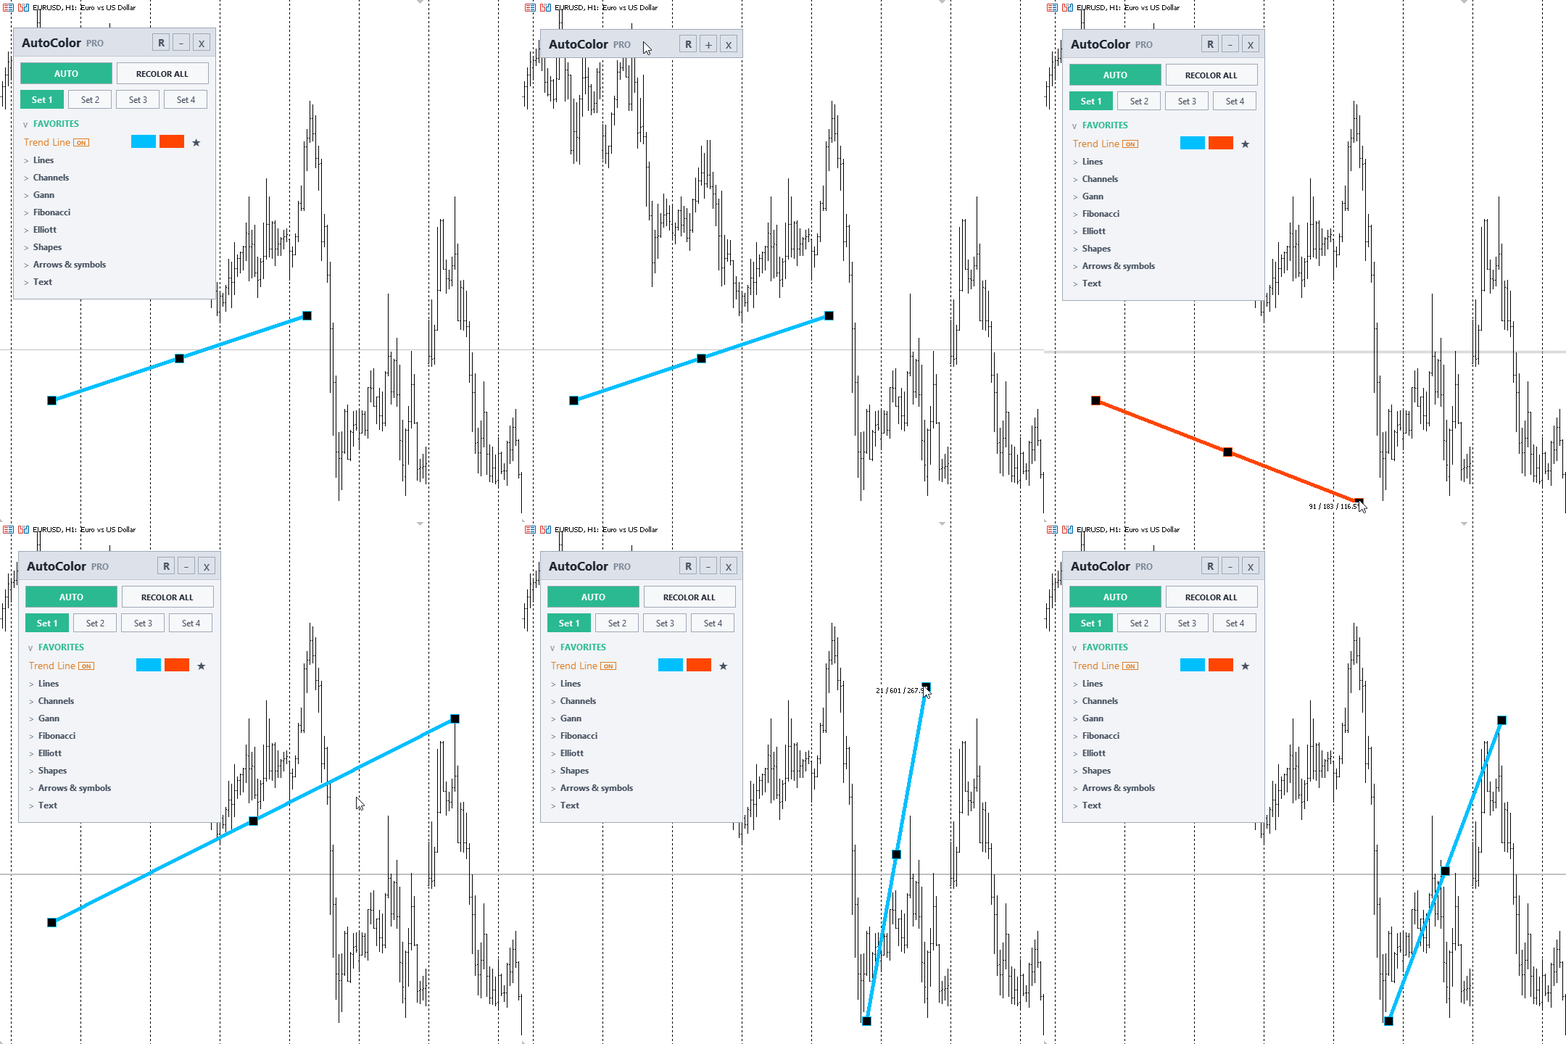
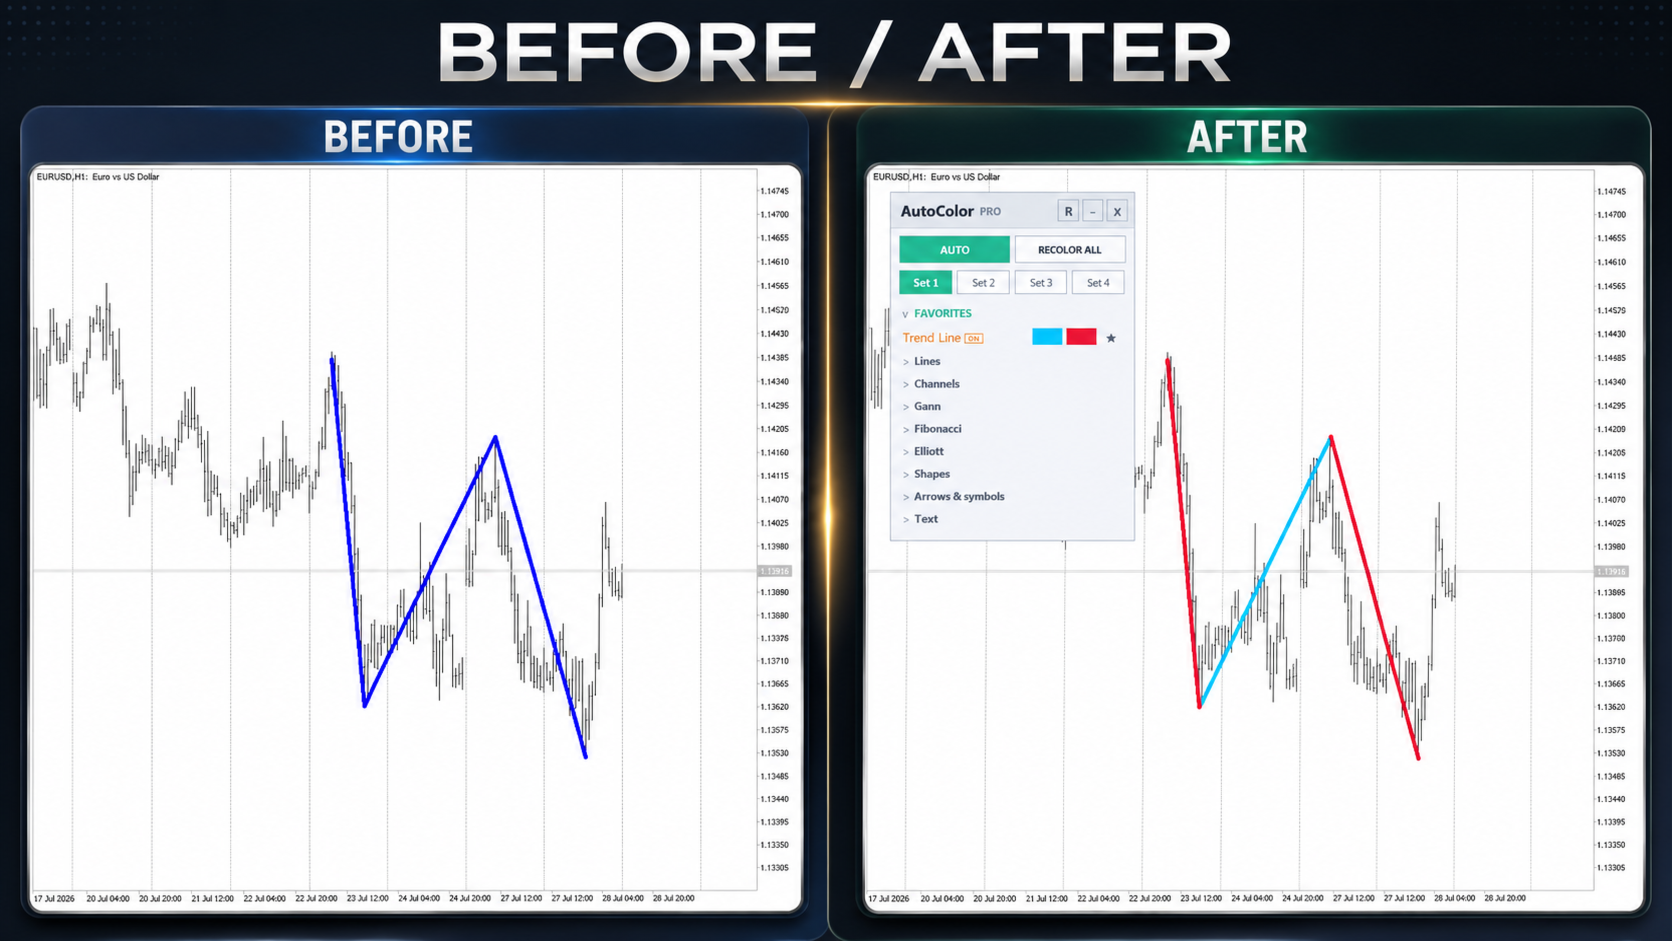
For example, an ascending trend line can automatically receive a bullish color, a descending line a bearish color, and a horizontal line a support or resistance color depending on its position relative to the current price.
AutoColor PRO MT4 is not a trading system, does not open trades, and does not generate BUY or SELL signals. The indicator changes only the visual properties of supported graphical objects.
Key Features
- Automatic coloring of newly created graphical objects.
- Different colors for ascending, descending, and neutral structures.
- Separate support, resistance, and neutral-zone logic for horizontal lines.
- Strict geometric validation of Elliott Motive and Elliott Correction objects.
- Coloring of meaningful Fibonacci levels and other multi-level analytical tools.
- Protection of colors assigned manually by the user.
- Intentional full-chart recoloring with the RECOLOR ALL command.
- Four independent color sets.
- An interactive on-chart Dashboard.
- Saving of color profiles, panel state, and settings for individual object types.
- Optional restoration of the original appearance when the indicator is removed.
- Support for 35 MetaTrader 4 graphical object types.
Which objects AutoColor PRO MT4 manages
- Objects that were already on the chart before the indicator was attached remain unchanged.
- New supported objects created while AUTO mode is active are colored automatically and placed under further management.
- Objects created in PAUSED mode keep their user-assigned colors and are not recolored after returning to AUTO.
- To explicitly take control of old, manually excluded, or PAUSED-created objects, use RECOLOR ALL.
AUTO Mode
- AutoColor PRO MT4 monitors newly created supported objects and applies the selected coloring rules.
- When the direction or geometry of a managed object changes, its color is recalculated.
- For supported directional objects, geometry changes made programmatically by other MQL5 programs are also checked periodically.
- When the color set is switched or a color is changed in the Dashboard, managed objects are updated while manual exclusions remain protected.
- For horizontal lines, the color can update as the market price changes.
PAUSED Mode
- In PAUSED mode, the indicator temporarily stops taking new objects under automatic management.
- Objects created during the pause retain their original or manually assigned colors.
- Returning to AUTO does not recolor those objects by itself.
- When required, they can be transferred under AutoColor PRO MT4 management with RECOLOR ALL.
Manual Color Protection
- AutoColor PRO MT4 detects a manual change to the main object color or to the color of one of its levels.
- When protection is enabled, the entire object is excluded from further automatic recoloring.
- The manual color is preserved when geometry, market price, color set, or Dashboard state changes.
- Manual exclusions can persist through normal timeframe changes and terminal restarts.
- Manual color protection can be disabled in the input parameters.
- RECOLOR ALL removes manual exclusions and returns the objects to AutoColor PRO MT4 management.
RECOLOR ALL
- The command requires a separate confirmation to prevent accidental mass recoloring.
- It checks all supported objects on the current chart.
- It recolors supported object types once, regardless of their current ON or OFF state in the Dashboard.
- It processes objects created before AutoColor PRO MT4 was attached.
- It processes objects created in PAUSED mode.
- It removes manual, old-object, and automatic exclusions.
- It applies the current colors of the selected color set.
- After execution, further automatic management of each type is again determined by its ON or OFF state.
Important: RECOLOR ALL is an intentional command for taking full control of supported objects. It can replace colors previously assigned manually.
Supported Object Groups
- Vertical and horizontal lines.
- Trend lines and trend-by-angle lines.
- Cycle lines and lines with arrow endings.
- Equidistant, regression, and standard deviation channels.
- Andrews' Pitchfork.
- Gann lines, fans, and grids.
- Fibonacci retracements, time zones, fans, arcs, channels, and expansions.
- Elliott motive and correction waves.
- Rectangles, triangles, and ellipses.
- Arrows, trading symbols, and price labels.
- Text objects and screen labels.
Directional Coloring Logic
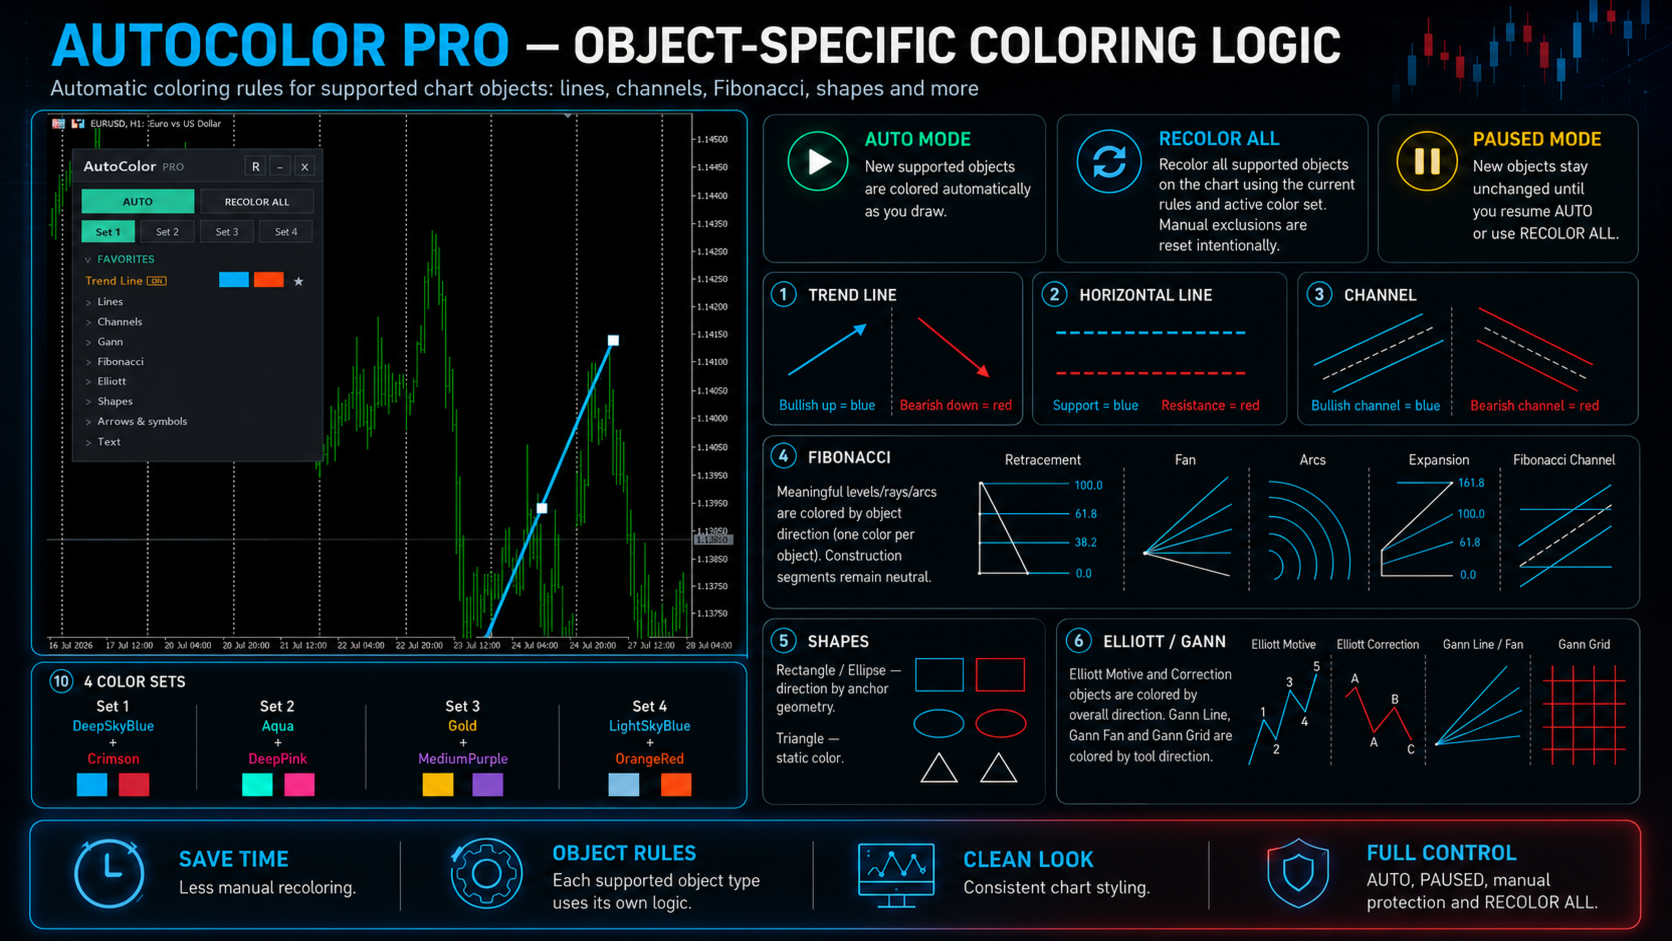
- Ascending objects receive the bullish color.
- Descending objects receive the bearish color.
- Objects without an unambiguous direction receive the neutral color.
- For Regression Channel and Standard Deviation Channel, AutoColor PRO MT4 uses the direction of the actually calculated center line.
- For Gann Line, Gann Fan, and Gann Grid, the direction of the Gann tool itself is used.
- For Rectangle and Ellipse, direction is determined by the arrangement of the anchor points.
- Triangle is treated as a static object and uses one configurable color.
- Arrows, symbols, text, and screen labels use the static color selected for the corresponding object type.
Elliott Motive and Elliott Correction
- For Motive Wave, the complete sequence of five anchor points is analyzed.
- For Correction Wave, the complete sequence of three anchor points is analyzed.
- The left-to-right order of points and the geometry of alternating waves are checked.
- A valid ascending or descending structure receives the corresponding directional color.
- An ambiguous, equal, or geometrically invalid structure receives the neutral color.
- Coloring is applied only after all required object points have been completed.
The Elliott check evaluates the geometry of the created object only for color selection. It does not validate the user's trading analysis and is not a complete Elliott Wave expert assessment.
Fibonacci and Multi-Level Tools
- AutoColor PRO MT4 works with the colors of individual levels, not only with the main object color.
- For Fibonacci Retracement, the level lines are colored.
- For Fibonacci Time Zones, the time lines are colored.
- For Fibonacci Fan, the fan rays are colored.
- For Fibonacci Arcs, the arcs are colored.
- For Fibonacci Expansion, the projection levels are colored.
- For Fibonacci Channel and Pitchfork, both the main lines and additional levels can be colored.
- The auxiliary construction segment is not recolored when it is not a meaningful part of the analytical tool.
- All meaningful levels of one directional object receive one color corresponding to its current direction.
- A manual color change to one level is recognized as a manual change to the entire object.
- When restoring the original appearance, the main color and each level are checked separately, so later manual user changes are preserved.
Horizontal Levels
- A line below the current price can be displayed as support.
- A line above the current price can be displayed as resistance.
- A neutral zone around the current price can be configured in points.
- Support, resistance, and neutral-state colors are configured separately.
- Dynamic updating as the market price moves can be enabled or disabled.
- Moving the horizontal line itself also triggers a new state check.
Interactive Dashboard
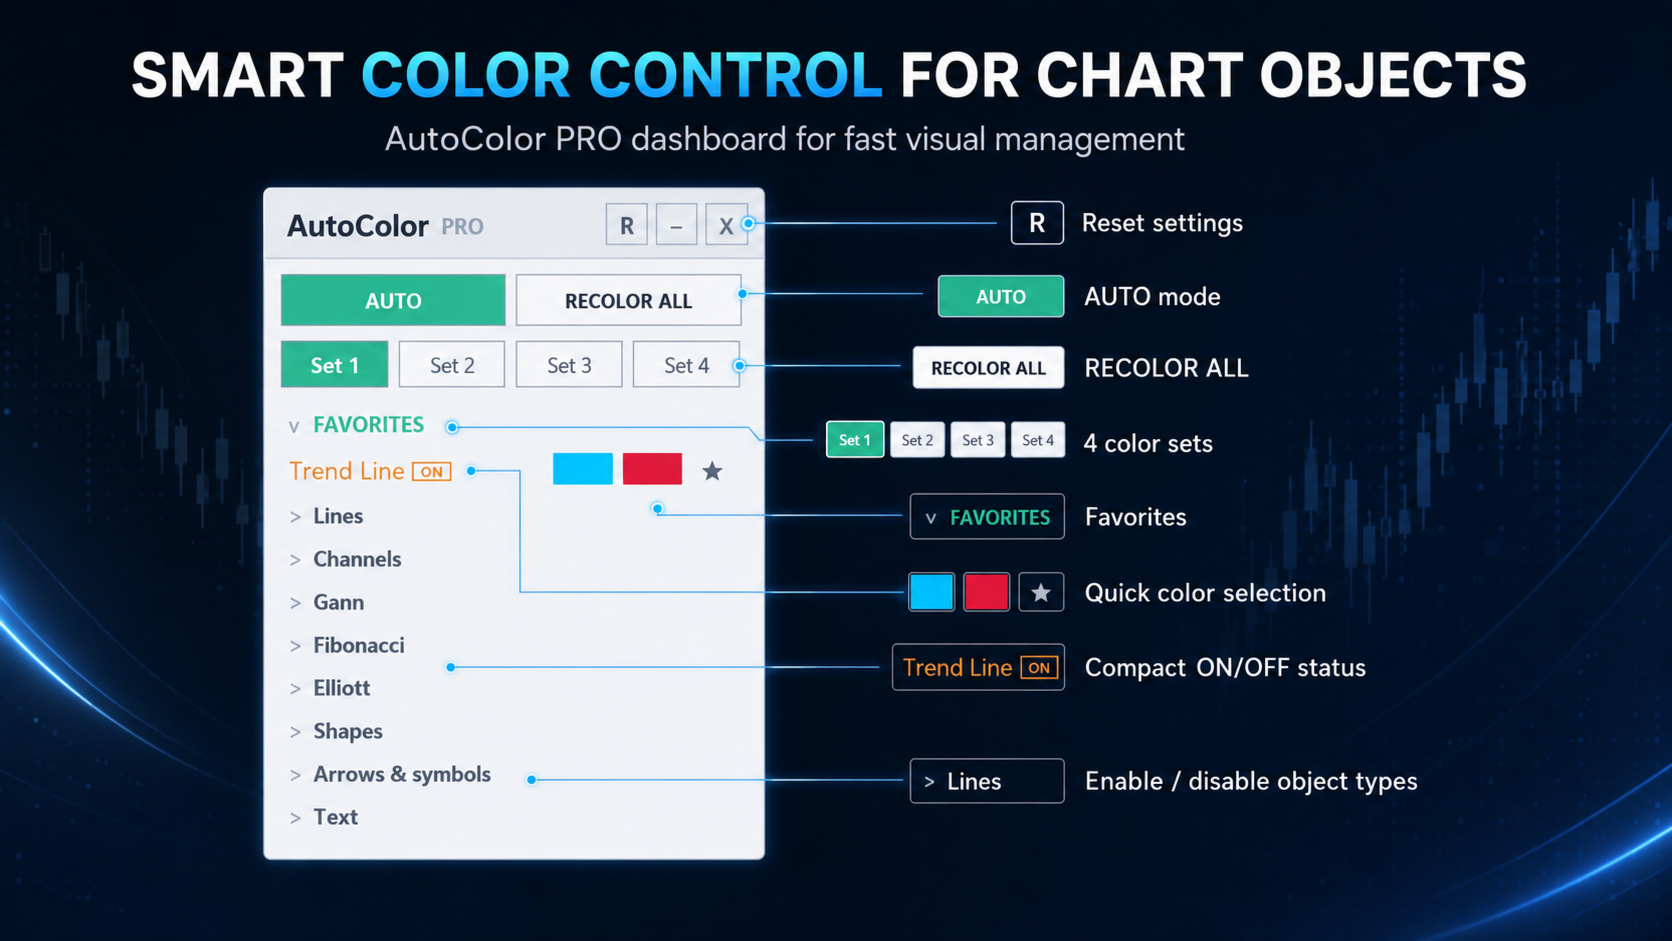
- Switching between AUTO and PAUSED modes.
- A RECOLOR ALL button with a separate confirmation window.
- Fast switching between four color sets.
- Enabling or disabling individual object types by clicking their names.
- Compact ON and OFF status indicators.
- Selection of bullish, bearish, and static colors, as well as support and resistance colors.
- An expandable 32-color palette.
- Color selection by a normal click or in one motion: press a swatch, move the cursor to the required cell, and release.
- Adding object types to Favorites.
- Collapsing individual groups.
- Vertical scrolling of the panel content.
- Changing the panel height.
- Moving the panel around the chart.
- Collapsing the entire panel into a compact header.
- Removing the indicator from the chart with the close button.
- Dark and light themes.
- Outline highlighting of every clickable element on mouse hover.
Favorites
- Favorites contains object types, not individual line instances from the chart.
- Favorite types are displayed at the top of the Dashboard.
- This keeps frequently used tools within immediate reach.
- Trend Line is included in Favorites by default.
- Only Trend Line is enabled by default unless the input parameters have been changed.
- All other groups are collapsed on first launch to keep the interface uncluttered.
Color Sets
- Four independent color sets.
- Fast switching directly on the chart.
- Individual colors for every supported object type.
- Separate colors for bullish and bearish directions.
- Separate support and resistance colors.
- One common neutral color is configured in the input parameters.
- The factory color sets can be completely customized to match your chart style.
- Manual object exclusions remain protected when switching color sets.
Resetting Dashboard Settings
- The R button opens a separate confirmation window.
- All four color sets are reset.
- The first set becomes active again.
- ON and OFF states return to the values specified in the input parameters.
- Favorites, group expansion, panel position, height, and scroll position are reset.
- The AUTO or PAUSED state returns to the value of the main input parameter.
- Manual object exclusions and stored original colors are not deleted.
- Use RECOLOR ALL to remove manual exclusions.
Restoring the Original Appearance
- When the indicator is removed, it can automatically restore the original appearance of the objects.
- Only properties that were actually changed by AutoColor PRO MT4 are restored.
- If the user later changed a color manually, that value is preserved.
- The main color and individual level colors are checked independently.
- When directional width or style is used, the original line width and style can also be restored.
- Automatic restoration can be enabled or disabled in the input parameters.
Additional Settings
- Enable or disable automatic coloring.
- Enable or disable manual color protection.
- Preserve manual exclusions through normal restarts and timeframe changes.
- Filter objects by a name prefix.
- Configure bullish, bearish, and neutral colors.
- Configure support and resistance colors.
- Configure the neutral zone for horizontal lines.
- Optionally apply different line widths by direction.
- Optionally apply different line styles by direction.
- Configure update sensitivity when objects are moved.
- Configure Dashboard position, width, and height.
- Select a dark or light theme.
- Enable diagnostic mode for technical verification.
Optimization and Performance
- The indicator performs no trading calculations and uses no signal buffers.
- During regular operation, only registered supported objects are processed.
- Checks for programmatic geometry changes are performed in batches.
- The internal update frequency depends on current panel and object activity.
- Temporary processing failures trigger a limited retry.
- When new graphical objects are created, the Dashboard automatically returns to the foreground.
- Unsupported objects are not modified.
Practical Use
- Create clean and consistent chart markup.
- Quickly distinguish ascending and descending structures visually.
- Differentiate support and resistance without manually editing every line.
- Work more conveniently with large numbers of lines, channels, and analytical levels.
- Prepare clear screenshots, trading plans, and analytical materials.
- Reduce repetitive actions during manual technical analysis.
AutoColor PRO MT4 changes only the visual properties of supported graphical objects. The indicator does not evaluate the quality of the user's chart analysis, does not confirm trading decisions, and does not guarantee financial results.
MetaTrader 5 version: AutoColor PRO MT5
Explore my other products in the Market: https://www.mql5.com/en/users/capitalplus/seller
Explore my other products in the Market: https://www.mql5.com/en/users/capitalplus/seller
If you have questions, suggestions, or feature requests for AutoColor PRO MT4, send me a private message or leave a comment in the product discussion tab.
✅ If AutoColor PRO MT4 is useful in your work, please rate the product and leave a review. This helps support further development.
Work efficiently and keep your charts clean!