Clone
- Indicators
-
Ivan Butko
 Greetings, friends!
I write in mql4 and mql5. In my market you will find a variety of products, every day I develop something new, I research something. New indicators and advisors will appear in the near future. - Version: 1.0
- Activations: 20
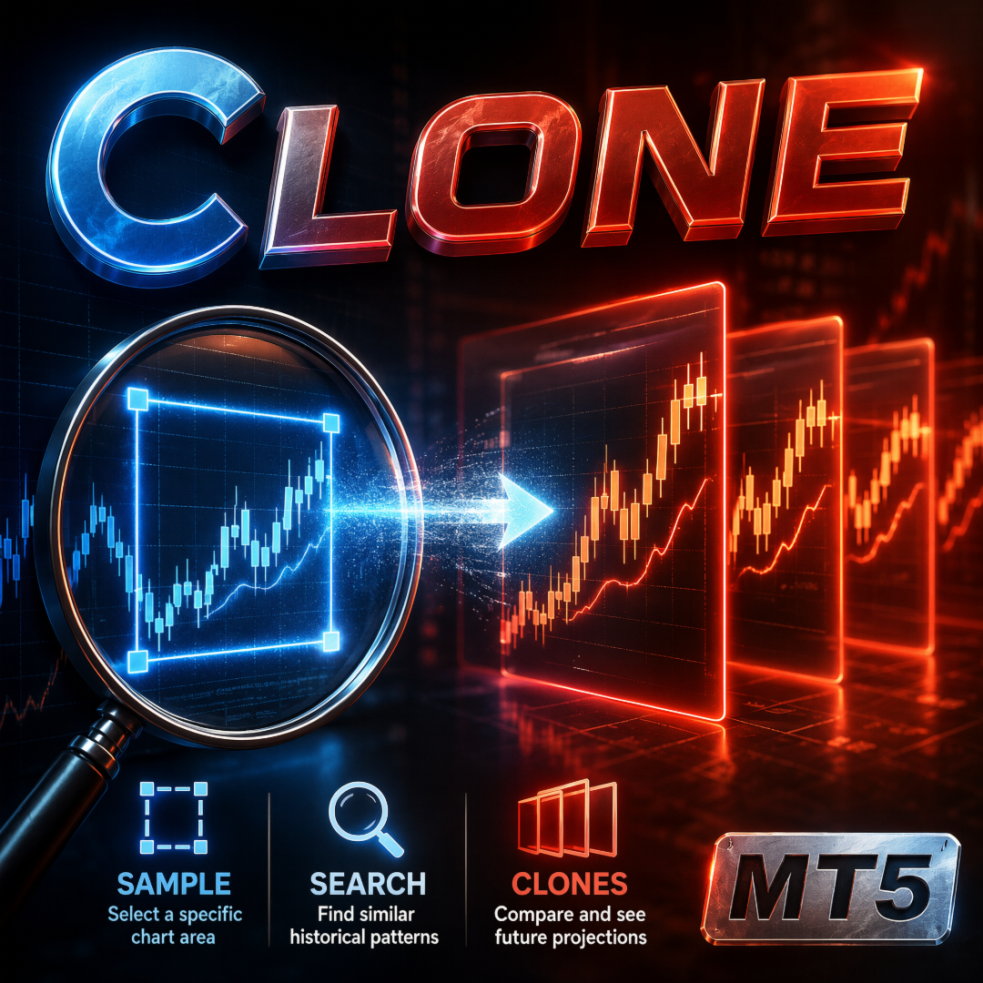
Clone MT5 is an interactive tool for finding similar situations in chart history. You select any price section with a frame, and Clone finds the most similar historical sections of the same instrument, marks them on the chart and lets you compare them with the current sample.
This is not a signal indicator and not an Expert Advisor. It is a market research tool designed to help answer a simple question: “Where has something similar happened before, and what happened next?”
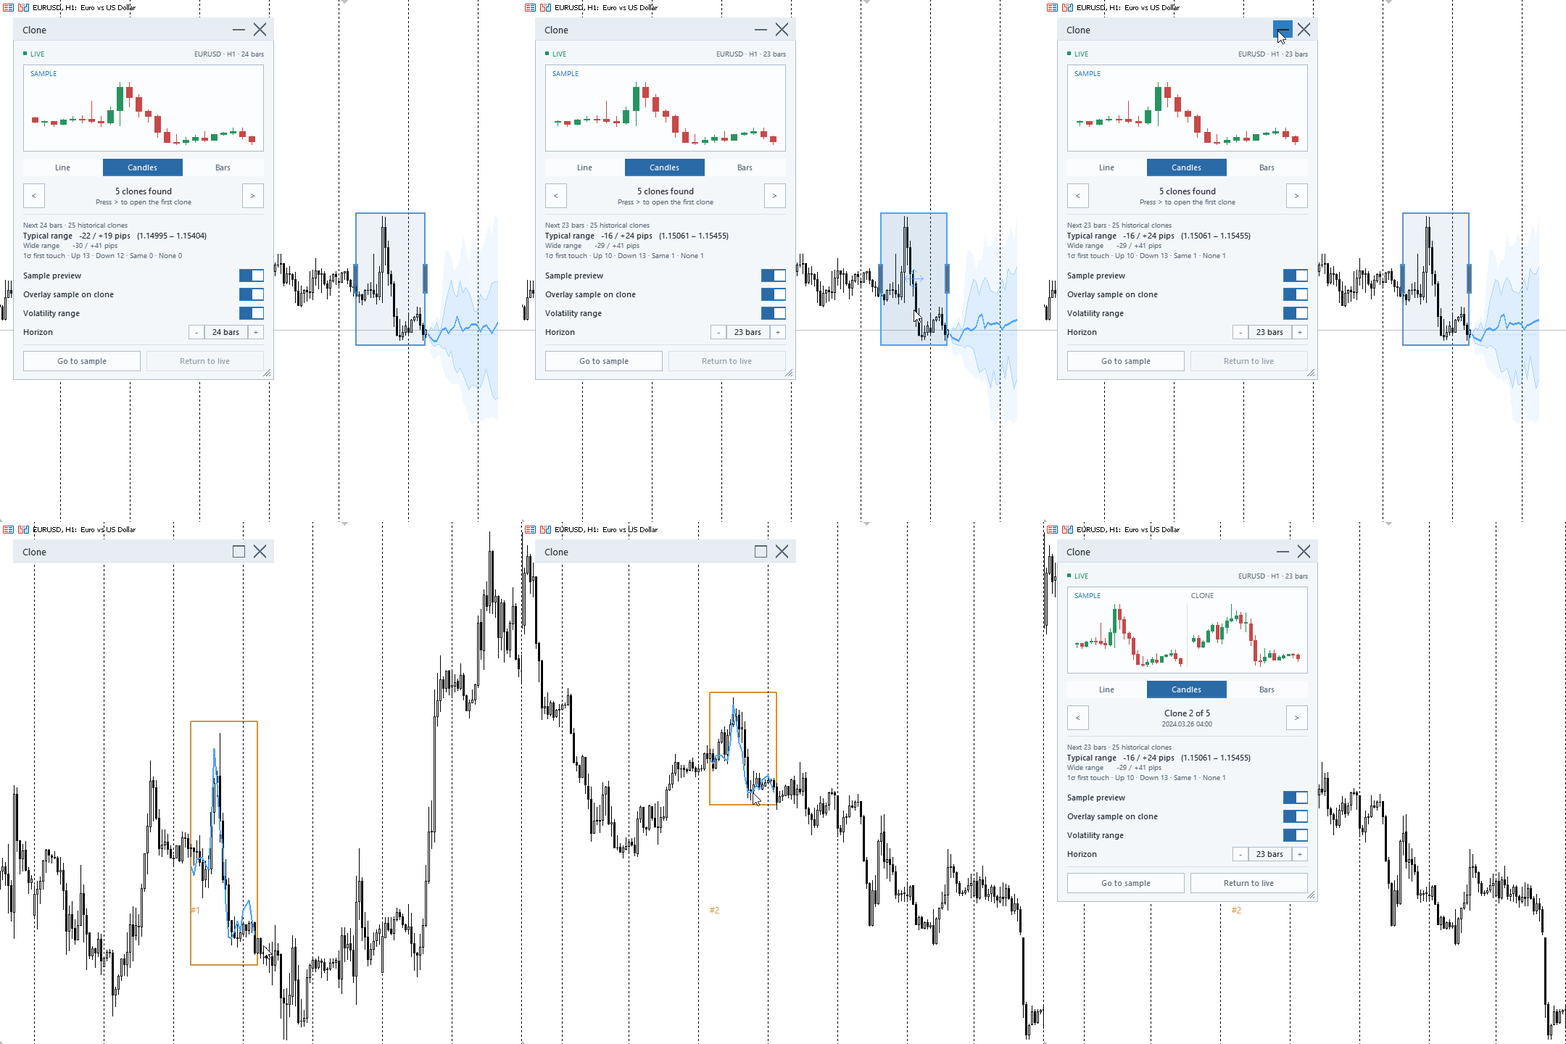
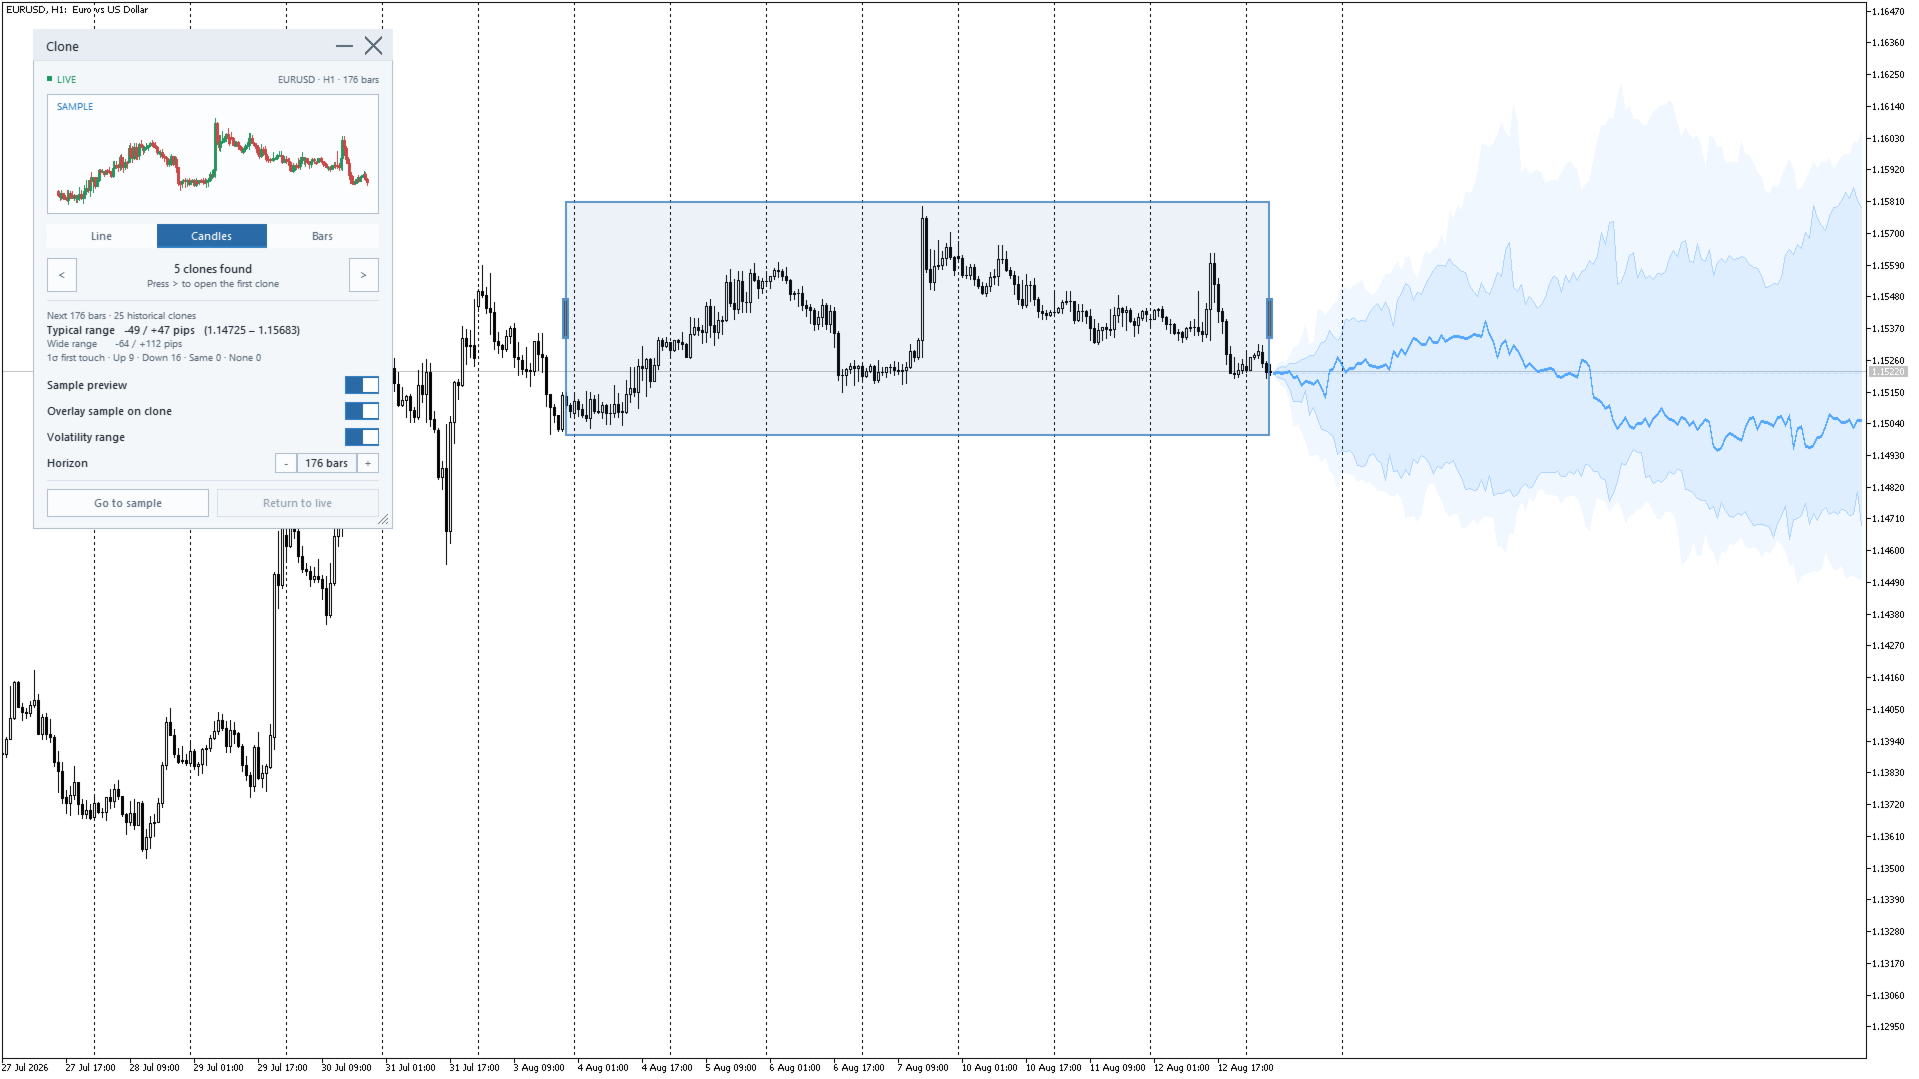
- Sample — the chart section highlighted by the blue frame. You can change its length and position directly on the chart with the mouse.
- Clone — a historical section of the same length that is most similar to the sample according to the selected comparison mode.
- Volatility range — an estimate of the possible magnitude of the next move, built from the continuations of an extended set of historical clones.
How it works:
- The indicator places a frame over the latest bars and automatically starts searching for clones.
- Drag the side handles of the frame to change the sample length. Drag the whole frame to move the selected section.
- When you release the mouse button, the search restarts using the available history.
- Found clones are marked on the chart, and you can navigate between them using the panel buttons.
Key features:
- By default, up to 50,000 historical windows before the sample are analyzed; the search depth is configurable.
- Sample length from 8 to 200 bars, adjustable directly with the mouse on the chart.
- Up to 10 non-overlapping clones in the results, 5 by default.
- Three comparison modes: trajectory shape, trajectory with candle geometry, and trajectory with relative market regime.
- Overlay the sample on the selected clone for direct shape comparison.
- Quick navigation to the sample, selected clone and back to the current market.
- Calculations are split into short processing chunks to keep the interface responsive during the search.
Control panel:
- Side-by-side preview of the sample and selected clone in one panel.
- Three preview styles: line, candles and bars.
- Navigation through found clones with the date of each section.
- Switches for overlay, preview and volatility range.
- The panel can be dragged by any free area and resized from the corner.
- Light and dark themes.
- The panel can be collapsed to its header; the close button removes the indicator from the chart.
Volatility range:
For the live sample, Clone analyzes what happened after an extended set of the most similar historical sections. The resulting range is displayed as a fan to the right of the sample and as additional information in the panel:
- Typical and wide historical movement ranges.
- The upper and lower boundaries are calculated separately, so possible movement asymmetry remains visible.
- Three selectable horizons: half the sample length, one sample length or two sample lengths.
- The first-touch counter shows how many clones reached the upper side first, the lower side first, both sides within the same bar, or neither side.
What the tool does — and what it does not:
Clone does not try to turn historical similarity into a ready-made trading signal. Historical clones are used to compare the current market structure and to assess how different the subsequent movements were after similar situations.
- Clone does not predict market direction. In an internal walk-forward test on EURUSD H1 across 3,438 test points, the sign of the median clone continuation matched the actual direction in 49.4% of cases. This is why the direction of the fan is deliberately not colored as a BUY or SELL signal.
- The volatility range is not a guarantee and does not represent the probability of a trade. It shows the historical spread of continuations following the most similar situations. Its width depends on the selected sample, available history, instrument, timeframe and composition of the historical set.
Settings:
- Default, minimum and maximum sample length.
- Search history depth and number of displayed clones.
- Comparison mode and context for evaluating the relative market state.
- Range horizon, size of the historical continuation set and range-width adjustment.
- Panel theme, font, preview dimensions and element colors.
- Calculation budget per cycle — allows you to control the computational load on the terminal.
Working with the chart:
- Each indicator instance uses its own namespace for the graphical objects it creates.
- Navigation to a clone places the found section in a convenient area of the chart for viewing.
- The indicator monitors the graphical objects it requires and restores them if they are accidentally deleted.
- When Clone is normally removed, it cleans up the graphical objects created by that instance.
Versatility:
- The algorithm works with the current chart instrument and timeframe and is not tied to a predefined symbol.
- The more quality history is available for the instrument, the broader the historical set available for clone searching.
- Search results always relate to the specific sample, selected settings and history available in the terminal.
Check out my other products in the Market https://www.mql5.com/en/users/capitalplus/seller
✅ If you find the indicator useful, please rate the product and leave a review. It helps the project continue to develop.
Successful market analysis!