Guarda i video tutorial del Market su YouTube
Come acquistare un Robot di Trading o un indicatore
Esegui il tuo EA
hosting virtuale
hosting virtuale
Prova un indicatore/robot di trading prima di acquistarlo
Vuoi guadagnare nel Market?
Come presentare un prodotto per venderlo con successo
Indicatori tecnici per MetaTrader 5 - 3

MTF Trend Detector can detect the trend directions on any timeframe with real time sound and Pop-up alert when the trend changes its direction.
It needs a lot of historical data. When it's attached to a chart at the first time, you may need to way 2-3 minutes and refresh the chart to get all the trend directions on the table. It can be used in isolation or as a reliable filter of any trading system.
Input Parameters
Timeframe settings
Enable H1: Select true or false
Enable H2: Select true
FREE

La maggior parte dei trader vede candele engulfing. Pochi sanno come negoziarle con profitto. Engulfing Pro Trader ti offre segnali semplici e statistiche reali — operazioni, vittorie, profitti — per negoziare inversioni con sicurezza. Niente speranze, solo i numeri reali di cui hai bisogno. In Real Trades ti mostriamo la verità, non i sogni. Ti è piaciuto vedere la realtà della strategia engulfing? Lasciaci una recensione a 5 stelle e scrivimi in privato per ricevere un prodotto esclusivo grat
FREE
Pipfinite creates unique, high quality and affordable trading tools. Our tools may or may not work for you, so we strongly suggest to try the Demo Version for MT4 first. Please test the indicator prior to purchasing to determine if it works for you. We want your good reviews, so hurry up and test it for free...we hope you will find it useful.
Attention This trading tool is specifically designed to help grid, martingale, averaging, recovery and hedging strategies. If you are not familiar with th
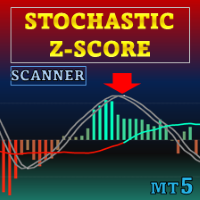
Offerta speciale : ALL TOOLS , solo $35 ciascuno! Nuovi strumenti a $30 per la prima settimana o per i primi 3 acquisti ! Canale Trading Tools su MQL5 : unisciti al mio canale MQL5 per ricevere gli ultimi aggiornamenti Stochastic Z-Score è un oscillatore di momentum che normalizza il prezzo con un punteggio Z, lo limita tramite logica stocastica e lo rende più fluido con HMA; ALMA fornisce un contesto di lungo periodo. Offre un segnale chiaro e reattivo, oltre a istogramma opzional

Forex Strategist is a powerful trading sustem for EURPLN H4 Timeframe only. We'll add more logic to trade more currency pairs gradually. Input Parameters:
Line setting:
Line Style: Default is Solid
Buy Color: Default is White
Sell Color: Default is White
Stop Loss Color: Default is White
Target Color: Default is Gold Panel Setting:
Corner: Default is Let upper chart corner
X Panel: Default is 10
Y Panel: Default is 20
BackGround1: Default is DarkBlue
BackGround 2: Default is 47,47,47
Text C
FREE

Crystal Buy Sell Liquidity — Indicatore di Liquidità per MT5 Descrizione
Crystal Buy Sell Liquidity è un indicatore professionale per MetaTrader 5 che identifica opportunità di acquisto e vendita basate su modelli di sweep di liquidità. Analizza la struttura intraday del mercato per rilevare l’attività istituzionale e fornisce segnali chiari quando la liquidità retail viene assorbita e il prezzo si inverte. Caratteristiche principali Rilevamento automatico sweep di liquidità su massimi/minimi S
FREE
The AX Forex Indicator MT5 is a sophisticated trading tool designed to provide traders with a comprehensive analysis of multiple currency pairs. This powerful indicator simplifies the complex nature of the forex market, making it accessible for both novice and experienced traders. AX Forex Indicator uses advanced algorithms to detect trends, patterns and is an essential tool for traders aiming to enhance their forex trading performance. With its robust features, ease of use, and reliabl
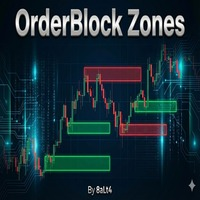
Panoramica OrderBlock Zone è un indicatore MetaTrader 4 avanzato che rileva e visualizza automaticamente le aree di negoziazione istituzionali (Order Blocks) presenti sul mercato. Seguendo le tracce lasciate dai grandi operatori (banche, hedge fund), determina i potenziali livelli di supporto e resistenza.
Caratteristiche principali Rilevamento automatico degli OrderBlock Analisi basata sui frattali: identifica i punti di inversione di tendenza più significativi con un'analisi frattale su 36 p
FREE

Questo cruscotto mostra gli ultimi pattern armonici disponibili per i simboli selezionati, in modo da risparmiare tempo ed essere più efficienti / versione MT4 .
Indicatore gratuito: Basic Harmonic Pattern
Colonne dell'indicatore Symbol : vengono visualizzati i simboli selezionati Trend: rialzista o ribassista Pattern: tipo di pattern (gartley, butterfly, bat, crab, shark, cypher o ABCD) Entry: prezzo di ingresso SL: prezzo di stop loss TP1: 1 prezzo di take profit TP2:
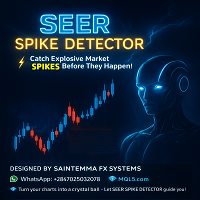
N/B: All our product purchase comes with our free ‘’DAILY SCALPER EA’’ - bit.ly/4qlFLNh Whatsapp Developer for yours after successful purchase SEER SPIKE DETECTOR
The Ultimate Market-Reversal & Spike Forecasting Tool for Crash & Boom Indices, Forex & Synthetic Markets
Best on M1 and M5 Stoploss: 10 Candles Maximum.
What is SEER SPIKE DETECTOR?
The SEER SPIKE DETECTOR is a next-generation market prediction indicator designed to detect and confirm spikes, reversals, and momentum sh

Questa VWAP è una VWAP semplice, ma abbiamo inserito degli avvisi per farti sapere quando il prezzo tocca la VWAP semplice o quando il prezzo incrocia la VWAP. Questo indicatore è un indicatore VWAP tradizionale per MetaTrader 5 (MT5). I parametri predefiniti sono quelli della VWAP normale, ma hai la possibilità di utilizzare nuovi calcoli e il meglio: Quando il prezzo tocca o incrocia la VWAP, verrai avvisato attraverso avvisi, notifiche sul cellulare, e-mail o segnali sonori. indicatore gratui
FREE

Questo è un indicatore di trend basato su MACD, che fornisce segnali di acquisto quando sopra la media mobile a 200 periodi (200 MA) e segnali di vendita quando sotto. Il segnale viene generato quando il MACD attraversa la linea zero. L'indicatore visualizza anche un livello di supporto e resistenza che può essere utilizzato come stop loss. I parametri regolabili includono il periodo della media mobile (MA), il MACD fast EMA, il MACD slow EMA e l'intervallo di supporto-resistenza. Viene tracciat
FREE

Classic MACD
It has MACD line, Signal line, and Histogram . The Histogram has 4 colors , showing its movement direction as simple as possible. The smoothing factor in the input helps to eliminate noisy signals. Besides different price types (hlc, hlcc, ohlc, ...), there is an option to use volume data as the source for MACD calculations (which is better to be used by real volume not unreliable tick volume). While the original MACD indicator uses Exponential Moving Average, this indicator provide
FREE

Descrizione:
L'indicatore "Struttura del mercato HH HL LH LL" è uno strumento potente e allo stesso tempo semplice per analizzare la dinamica dei prezzi nei mercati finanziari. Questo indicatore aiuta i trader e gli investitori a identificare i cambiamenti nelle tendenze e a identificare i punti importanti nelle serie temporali dei prezzi.
Componenti chiave dell’indicatore:
HH (Higher High): il massimo al quale il prezzo chiude sopra il massimo precedente. HH indica un rafforzamento del tren

Price Range MT5 è un sistema che identifica intervalli e livelli di prezzo, riconoscendo quando un intervallo termina e inizia un trend. Indica la direzione del nuovo trend con un alto grado di probabilità e invia notifiche push, consentendoti di prendere una decisione in tempo. Funzioni dell'indicatore Price Range L'indicatore fornisce notifiche push su tutti gli intervalli di prezzo, i livelli e i trend che identifica in tempo reale. Funziona per qualsiasi simbolo e qualsiasi intervallo tempo

50-Indicator Command Center: The Ultimate Algorithmic EdgeProduct Overview The 50-Indicator Command Center is a professional-grade trading dashboard designed for traders who demand a comprehensive view of the market without the clutter of 50 different charts. This "All-in-One" engine processes 50 high-probability technical indicators in real-time, delivering a unified Voting Score that tells you exactly who is in control: the Bulls or the Bears. Gone are the days of manual analysis. Whether you
Multi-Currency Strength Dashboard PRO MT5 (v2.6) – Misuratore di forza delle valute con dashboard visiva Multi-Currency Strength Dashboard PRO è un indicatore per MetaTrader 5 che misura in tempo reale la forza relativa di 8 valute principali (USD, EUR, GBP, JPY, CHF, CAD, AUD, NZD) analizzando fino a 28 coppie Forex (in base ai simboli disponibili presso il tuo broker). L’obiettivo è fornire una visione rapida e strutturata della forza/debolezza delle valute, aiutando a selezionare le coppie da
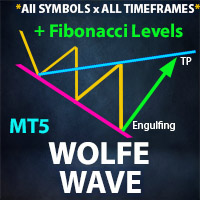
** All Symbols x All Timeframes scan just by pressing scanner button ** *** Contact me to send you instruction and add you in "Wolfe Wave Scanner group" for sharing or seeing experiences with other users.
Introduction: A Wolfe Wave is created with five-wave patterns in price. It shows supply and demand and a fight towards a balance price. T hese waves of price actions can help traders identify the boundaries of the trend . Also It helps forecast how the price will move in the near futur

Simboli: USDCHF, USDJPY, XAUUSD, GBPUSD, EURUSD, AUDUSD, GBPJPY (A mo USDCHF_H1 )
Timeframe: M15, H1, H4, D1
Caratteristiche principali: Nessun repaint, nessun ritardo, segnale direzionale, conferme multiple
Sicurezza: I segnali includono stop loss, take profit e rispettano la regola rischio/rendimento
Include: Scanner multi-timeframe gratuito (Dopo aver acquistato questo prodotto, inviami semplicemente uno screenshot tramite messaggio privato e ti invierò personalmente il file dello scanner

UR Trend Esaurimento
UR TrendExhaustion è la soluzione migliore per i trader che non vogliono avere a che fare con i valori dei parametri né con altre configurazioni: è facile e visivamente comprensibile per tutti.
Vantaggi dell'utilizzo di UR TrendExhaustion:
Nessun parametro Hai 3 linee che descrivono al meglio cosa sta succedendo sul grafico: Trend Exhaustion Line, Whale Money Line e Retail Money Line. L'interfaccia mostra l'esaurimento di entrambe le linee su entrambi gli estremi (aree

Indicatore zone di supporto e resistenza MT5 questo indicatore sa come identificare automaticamente massimi e minimi. Questo indicatore di supporto e resistenza crea linee di supporto e linee di resistenza basate su massimi e minimi. come creare linee di supporto e resistenza. questo è un indicatore per creare linee automatiche di supporto e resistenza. come trovare il livello di supporto con l'indicatore. questo indicatore trova i massimi e i minimi automaticamente. L'indicatore crea automatica
FREE
Volumatic Trend is a powerful, trend-following indicator that merges directional analysis with real-time volume behavior. By combining adaptive trend logic and volume overlays, it gives traders a detailed snapshot of market conviction and potential turning points. From instant trend shift detection to volume-weighted candle visuals, this tool brings deeper context to price movement. MT4 Version - https://www.mql5.com/en/market/product/136210/ Join To Learn Market Depth - https://www.mql5.co
FREE

Preoccupato per il tuo prossimo trade? Stanco di non sapere se la tua strategia funziona davvero? Con CRT Liquidity Pro, fai trading con statistiche reali, non con emozioni. Conosci le tue probabilità, monitora le tue prestazioni e fai trading con sicurezza — basato sul Potere di 3, rilevamento intelligente della liquidità e conferme CRT. Vuoi vedere la realtà della strategia CRT Liquidity? Dopo l’acquisto, contattaci e ti forniremo gratuitamente uno dei nostri altri prodotti.
Scopri i nostri
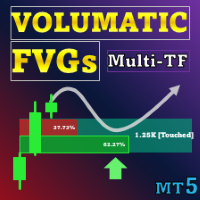
Offerta speciale : ALL TOOLS , solo $35 ciascuno! I nuovi strumenti saranno a $30 per la prima settimana o per i primi 3 acquisti ! Trading Tools Channel on MQL5 : Unisciti al mio canale MQL5 per ricevere le ultime novità Volumatic Fair Value Gaps (FVG) identifica e mantiene zone significative di squilibrio di prezzo e scompone il volume direzionale all’interno di ciascun gap. Il volume è campionato da un timeframe inferiore (M1 predefinito, selezionabile), suddiviso tra acquisti e

Introduction to X3 Chart Pattern Scanner X3 Cherart Pattern Scanner is the non-repainting and non-lagging indicator detecting X3 chart patterns including Harmonic pattern, Elliott Wave pattern, X3 patterns, and Japanese Candlestick patterns. Historical patterns match with signal patterns. Hence, you can readily develop the solid trading strategy in your chart. More importantly, this superb pattern scanner can detect the optimal pattern of its kind. In addition, you can switch on and off individu

L'indicatore Basic Renko è uno strumento potente per i trader che cercano una prospettiva di mercato chiara e concisa. Il nostro indicatore non solo semplifica la visualizzazione del trend, ma offre anche avvisi precisi per le inversioni, fornendo un vantaggio strategico nel vostro trading / Versione MT4 gratuita
Caratteristiche Completamente personalizzabile: Adattate l'indicatore alle vostre preferenze commerciali grazie alle opzioni di personalizzazione avanzate. Dai colori alle impost
FREE

Introducing Indicator for PainX and GainX Indices Traders on Weltrade Get ready to experience the power of trading with our indicator, specifically designed for Weltrade broker's PainX and GainX Indices. Advanced Strategies for Unbeatable Insights Our indicator employs sophisticated strategies to analyze market trends, pinpointing optimal entry and exit points. Optimized for Maximum Performance To ensure optimal results, our indicator is carefully calibrated for 5-minute timeframe charts on

This MT5 indicator is a conversion of the UT Bot Alerts indicator by @QuantNomad from TradingView.
It utilizes ATR to generate custom candles on the chart while providing strong entry signals based on these candles.
All buffers, including those for the custom candles and entry signals, are available, making it easy to integrate into any EA.
Additionally, various strategies based on this indicator can be found online, or you can contact me for a custom strategy development.
FREE

Multi-currency and multitimeframe Heikin Ashi indicator. Shows the current state of the market. On the scanner panel you can see the direction, strength and number of bars of the current trend. The Consolidation/Reversal candles are also shown using color. You can specify any desired currencies and periods in the parameters. Also, the indicator can send notifications when the trend changes or when reversal and consolidation candles (dojis) appear. By clicking on a cell, this symbol and period wi

L'indicatore Pips Chaser è stato sviluppato per integrare il trading manuale. Questo indicatore può essere utilizzato sia per lo scalping breve che per lo swing trading lungo // Versione MT4
Caratteristiche Indicatore no repaint Questo indicatore non cambia i suoi valori quando arrivano nuovi dati Coppie di trading Qualsiasi coppia di valute Time frame
H1 è preferibile, ma è possibile adattarlo a qualsiasi timeframe Orario di trading 24 ore su 24 Buffers Buy Buffer: 0 / Sell Buffer: 1
FREE

Position Size Calculator Lite MT5 – Indicatore gratuito di gestione del rischio Importante Se hai bisogno di zone Stop Loss e Take Profit interattive (trascinabili con il mouse sul grafico), di un pannello avanzato con margine, break-even e metriche di rischio dettagliate, cerca nel Market: Position Size Calculator PRO MT5 . Questa versione Lite è un'edizione gratuita e semplificata focalizzata sul calcolo della dimensione della posizione. Presentazione Position Size Calculator Lite MT5 è un ind
FREE

The Trend Forecaster indicator utilizes a unique proprietary algorithm to determine entry points for a breakout trading strategy. The indicator identifies price clusters, analyzes price movement near levels, and provides a signal when the price breaks through a level. The Trend Forecaster indicator is suitable for all financial assets, including currencies (Forex), metals, stocks, indices, and cryptocurrencies. You can also adjust the indicator to work on any time frames, although it is recommen

Super Signal Market Slayer
No repaint | Alta precisione | Indicatore di trend intelligente multi-mercato Nel trading, la vera difficoltà non è aprire un’operazione,
ma riconoscere chiaramente quando un trend sta realmente iniziando. Market Slayer nasce proprio per questo. È un indicatore intelligente senza repaint, progettato specificamente per il trading intraday.
Grazie a conferme multilivello e filtri di trend, fornisce segnali Buy / Sell chiari e affidabili solo nei momenti chiave. Vantaggi

The indicator draws the time scale on the chart. You can specify the time offset, adjust the size and font to display on the chart ( it is displaying your local time on your chart instead of MT time ). You can also select the desired format for displaying the date and time. You may be interested in my other product , which contains a more advanced version of the Time Scale .
You can also find my other products here . Parameters Hours (time shift) — time shift (hours); Minutes (time shift) — tim
FREE

As it name implies, this is an exaustion oscillator. However, you may wonder: what differs you from others oscillators like RSI, Stochastic, CCI etc? The difference is that ours is more powerful and accurate ! Your oscillator filters the nois e made by other oscillators, and shows you only the exact moment to enter the trade. Of course, using it alone, like any other indicator, has its risks. Ideally, reconcile it with technical analysis and/or others indicators. If you have any doubt or suggest

Versione MT4 | Indicatore Trend Monitor VZ | Indicatore Owl Smart Levels | Strategia Owl Smart Levels | FAQ La teoria delle onde di Elliott è un'interpretazione dei processi nei mercati finanziari che si basa su un modello visivo delle onde nei grafici dei Prezzi. L'indicatore ZigZag Valable mostra la struttura delle onde del mercato su cui puoi fare affidamento per prendere decisioni di trading. L'indicatore ZigZag Valable è più stabile e spesso non cambia direzione come il classico i
FREE

The Best SMC for All indicator is designed for MetaTrader 5 (MT5) to implement Smart Money Concepts (SMC) for analyzing market structure and identifying key trading zones based on price action. It visualizes supply and demand zones, Break of Structure (BOS) levels, Points of Interest (POI), and optional ZigZag patterns to assist traders in making informed decisions. Below is a detailed description of its features:
---
Features
1. Swing High/Low Detection:
- Functionality: Automatically iden
FREE

Integrated Dashboard Scanner – Version 4.00 The Ultimate Market Command Center just got smarter. Now with Programmable Logic Presets. The Integrated Dashboard Scanner (IDS) monitors multiple symbols and timeframes from a single, DPI-aware panel. Version 4.00 introduces a revolutionary Preset Editor , allowing you to combine signals from different modules into complex, custom strategies without writing a single line of code. NEW IN VERSION 4.00: Filter Presets & Logic Editor Stop scanning for
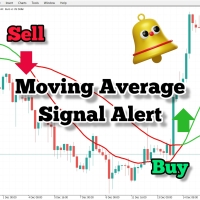
Se utilizzi le medie mobili nella tua strategia di trading, allora questo indicatore può esserti molto utile. Fornisce segnali all'incrocio di due medie mobili, invia avvisi sonori, visualizza notifiche sulla piattaforma di trading e invia anche una email sull'evento. Viene fornito con impostazioni facilmente personalizzabili per adattarsi al tuo stile e strategia di trading.
Parametri regolabili: Media Mobile Veloce (Fast MA) Media Mobile Lenta (Slow MA) Invio Email (Send_Email) Avvisi Sonori
FREE

Auto Fibonacci Retracement Indicator — Flexible and Reliable This isn’t just another Auto Fibonacci Retracement indicator. It’s one of the most flexible and dependable tools available . If you find it useful, please consider leaving a review or comment — your feedback means a lot! Check out my other helpful tools below: Smart Alert Manager - Set up advanced alerts and send them to Mobile, Telegram, Discord, Webhook...
Timeframes Trend Scanner - Scan the trend of assets in difference timefr
FREE
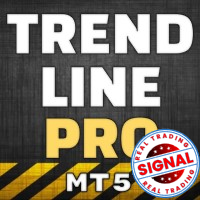
The Trend Line PRO indicator is an independent trading strategy. It shows the trend change, the entry point to the transaction, as well as automatically calculates three levels of Take Profit and Stop Loss protection.
Trend Line PRO is perfect for all Meta Trader symbols: currencies, metals, cryptocurrencies, stocks and indices. The indicator is used in trading on real accounts, which confirms the reliability of the strategy. Robots using Trend Line PRO and real Signals can be found here:
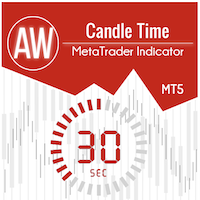
Indicatore del tempo fino alla fine della candela. Mostra il tempo fino alla fine della candela, così come l'ora del server. Il testo può visualizzare la tendenza o la direzione della candela, le notifiche sonore sono integrate Peculiarità:
Visualizza il tempo fino alla fine della candela corrente e altri intervalli di tempo che possono essere regolati o disabilitati se necessario AW Candle Time può selezionare la direzione della candela o del trend corrente con l'indicatore AW Super Trend La st
FREE
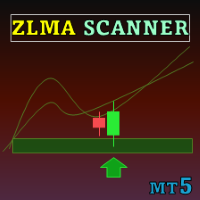
Special offer : ALL TOOLS , just $35 each! New tools will be $30 for the first week or the first 3 purchases ! Trading Tools Channel on MQL5 : Join my MQL5 channel to update the latest news from me L'indicatore Zero Lag MA Trend Levels MT5 con Scanner combina la media mobile senza ritardo (ZLMA) con una media mobile esponenziale (EMA) standard, offrendo ai trader una visione completa del momentum di mercato e dei livelli di prezzo chiave. Inoltre, le funzionalità di scanner e aller

Support Resistance Pro line — Insight into Institutional Footprints, Capturing Reversals, Making Every Line Data-Driven.(This indicator has the same function as the Orderflow Smart Flip indicator, with only the name differing) Product Introduction Say Goodbye to Guesswork. Embrace the Data Truth. Support Resistance Pro line is not just another drawing tool; it is an institutional behavior analysis system built on Tick-level microscopic data . Acting like an X-ray for the market, it penetrate

Identificare i range e le prossime mosse probabili | Ottenere i primi segnali e la forza delle tendenze | Ottenere uscite chiare prima dell'inversione | Individuare i livelli di Fibo che il prezzo testerà | Indicatore non tracciante e non ritardato - ideale per il trading manuale e automatizzato - adatto a tutti gli asset e a tutte le unità temporali Dopo l'acquisto, per favore contattami per ottenere il tuo TrendDECODER_Scanner GRATUITO . Versione MT4 : clicca qui Otte
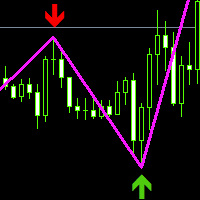
This index is based on the secondary development of zigzag, adding high and low point arrow indication, thickening the line and changing the color. Can be a good display of the current admission trading signals, current long or short. It can be combined with other indicators to determine the trading point, which has great reference value. Compared with the general trend index or oscillation batch standard, the accurate determination is higher from the perspective of historical data research and
FREE
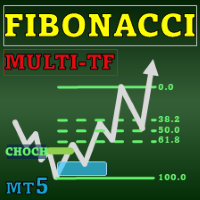
Special offer : ALL TOOLS , just $35 each! New tools will be $30 for the first week or the first 3 purchases ! Trading Tools Channel on MQL5 : Join my MQL5 channel to update the latest news from me Il Fibonacci Confluence Toolkit Multi-Timeframe è uno strumento avanzato di analisi tecnica progettato per trader professionisti, che aiuta a identificare potenziali zone di inversione del prezzo combinando segnali e modelli chiave del mercato. Con capacità di visualizzazione multi-timef
Haven Trend Tracker PRO - Il tuo navigatore nel mondo dei trend Presentiamo Haven Trend Tracker PRO – un potente indicatore multi-timeframe creato per i trader che vogliono operare in armonia con il mercato. Il suo compito principale è eliminare i tuoi dubbi, mostrando la direzione del trend contemporaneamente sul tuo timeframe di lavoro (LTF) e su quello superiore (HTF). I miei altri prodotti -> QUI . Fare trading seguendo il trend è la strategia più affidabile. L'indicatore aiuta a deter

Versione MT4 disponibile qui: https://www.mql5.com/en/market/product/43555
Canale e gruppo Telegram: https://t.me/bluedigitsfx
Accesso al gruppo VIP: Invia la prova di pagamento nella nostra inbox
Broker consigliato: https://bit.ly/BlueDigitsFxStarTrader BlueDigitsFx Easy 123 System — Potente rilevatore di inversioni e breakout per MT5 Sistema all-in-one non repaint per individuare inversioni di mercato e breakout – Ideale per trader principianti ed esperti BlueDigitsFx Easy 123 System è un i

Basta indovinare. Basta calcolare. Inizia a fare trading. Risk Reward Tool porta l'esperienza visiva e intuitiva di TradingView direttamente sul tuo grafico MetaTrader. Il trading professionale richiede una gestione precisa del rischio, ma calcolare la dimensione dei lotti manualmente con fogli Excel è lento e pericoloso. La Soluzione: Trascina semplicemente le linee visive sui tuoi livelli di Entrata, Stop Loss e Take Profit. Lo strumento calcola istantaneamente esattamente quanti Lotti devi

Was: $299 Now: $99 Supply Demand uses previous price action to identify potential imbalances between buyers and sellers. The key is to identify the better odds zones, not just the untouched ones. Blahtech Supply Demand indicator delivers functionality previously unavailable on any trading platform. This 4-in-1 indicator not only highlights the higher probability zones using a multi-criteria strength engine, but also combines it with multi-timeframe trend analysis, previously confirmed swings a

Golden Spikes Indicator Technical indicator for synthetic indices trading on M1 timeframe. Compatible with Boom/Crash indices on Deriv platform and Gain/Pain indices on Weltrade platform. send me A private message to receive trade ASISTANT EA.. booklet guide: https://drive.google.com/file/d/1knQJqGHZSP5eQN24ndRz2ayZVCst6XhN/view?usp=sharing
Also check my premium spikes bot: https://www.mql5.com/en/market/product/142350 Features Uses Parabolic SAR, RSI, and Bollinger Bands analysis Three risk
Panoramica Questo indicatore monitora tre tipi di supporti e resistenze basati sui periodi precedenti: Daily (massimo e minimo di ieri), Weekly e Monthly . Fornisce una mappa visiva dei livelli chiave dove il prezzo tende a reagire, utile sia per individuare potenziali inversioni sia per catturare breakout significativi. Cosa fa Disegna automaticamente i livelli di: Massimo/Minimo di ieri (Daily) Massimo/Minimo della settimana precedente (Weekly) Massimo/Minimo del mese precedente (Monthly) Ogni
FREE
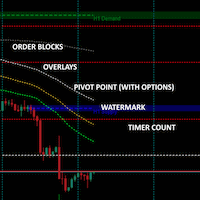
Multiple indicators in one: Order Blocks with optional higher timeframe overlay Watermark Count down timer Pivot points No fancy algorithms but tends to be quite accurate for some symbols to predict bounce, return-to and break-through channels. It is a retrospective indicator (as they all are) and there to help you with better guesses as to where a movement is going towards. The last two order blocks are shaded and extends past the current time. Prior order blocks (within your selected timeframe
FREE

The indicator shows when there are overpricing and divergences over a normalized MACD Plus, it displays signals with configurable alerts, self-regulating dynamic overprice levels, and a simple setup and interface. The indicator that automatically calculates overprices ranges! MACDmaxmin is an indicator based on the MACD oscillator that effectively identifies trend changes in price, as it is a momentum indicator that captures the trend and shows the relationship between two moving averages of th

Limited Time Offer! Just $59 — valid until the end of this month! Trinity-X : The Next Generation of Trend Intelligence Imagine having a professional market analyst sitting beside you 24/7 — one who never gets tired, never misses a signal, and speaks your language.
That’s exactly what Trinity-X delivers. This AI-optimized, rule-based trend intelligence system is built on years of trading expertise, powered by a proprietary Rule-Based AI Optimization Engine .
It doesn’t just react to price movem

UR Massimi e minimi
UR Highs&Lows esegue un'analisi approfondita del movimento del prezzo e della sua volatilità e crea un canale all'interno del quale il prezzo si muove. Quel canale ora si muove come un oscillatore ed è ricoperto dalla deviazione del prezzo per segnalare potenziali esaurimenti e possibili inversioni.
Vantaggi dell'utilizzo di UR Highs&Lows:
Nessun parametro Hai 3 linee che descrivono il movimento del prezzo: la linea bianca che è una media del prezzo e le linee blu che s

The indicator draws supply and demand zones. The zone timeframe can be set independently of the chart timeframe. For instance, it is possible to set M5 zones on an H4 chart. The importance of zones can be adjusted using the zone strength parameter. Demand zones are displayed if at least one candle in the range of the zone is entirely above the zone. Similarly, supply zones are displayed if at least one candle within the zone is entirely below the zone.
Advanced UT BOT ALERTS for MT5 Sistema professionale di rilevamento del trend con filtri multipli | Motore UT BOT potenziato Forniamo solo indicatori di alta qualità. Advanced UT BOT è progettato per uso professionale, con una logica di segnale stabile e un processo di calcolo sicuro che evita ritardi o aggiornamenti errati.
Non ridisegna, rimuove o modifica i segnali passati.
Tutti i segnali BUY e SELL vengono generati solo dopo la chiusura della candela e restano fissi.
Nel trading in tempo re

G -Labs Advanced Market Maker Dashboard MT 5 | BTMM Cycle Engine + Multi-Pair Scanner Professional BTMM (Banks Track Market Maker) multi-symbol cycle analysis dashboard for MetaTrader 5. Tracks Market Maker intent, cycle progression, peak formations, stop hunts, order blocks, and structural behavior across 28+ pairs from a single chart. This is not a simple scanner. It is a full cycle-aware BTMM engine combining higher-timeframe directional bias , intraday structure, ADR range exp

VWAP Ultimate Pro MT5 – Anchored VWAP | Session VWAP | Dynamic Bands & Smart Alerts Elevate Your Trading Edge with the Ultimate Institutional-Grade VWAP Indicator
WHY PROFESSIONAL TRADERS CHOOSE VWAP ULTIMATE PRO?
VWAP (Volume-Weighted Average Price) is widely used by institutions and professional traders to estimate fair market value and intraday bias. VWAP Ultimate Pro MT5 brings this power to retail traders with an all-in-one indicator, combining multi-mode VWAP, interactive anchored VWAP,
FlipToxin is a high-precision Buy/Sell flip signal indicator designed for FlipX Markets (Weltrade) and synthetic volatility indices (Deriv) . It focuses on identifying potential short-term market reversals (“flips”) and is optimized for traders who prefer fast, structured entries with disciplined risk management. Recommended Markets & Timeframes Primary timeframe: M5 (5-minute chart) Alternative timeframes (with confirmation): M15 or higher Supported markets: FlipX Markets (Weltrade) Boom & Cras

La strategia di trading di Moving Average Convergence Divergence (MACD) è uno strumento popolare di analisi tecnica che viene utilizzato per identificare i cambiamenti nella direzione della momentum e del trend. Il MACD viene calcolato sottraendo la media mobile esponenziale (EMA) di 26 periodi dalla EMA di 12 periodi. Viene quindi tracciata una EMA di 9 periodi, chiamata "linea di segnale", sopra il MACD per agire come trigger per i segnali di acquisto e vendita. Il MACD è considerato in territ
FREE

Effortless trading: non-repainting indicator for accurate price reversals This indicator detects price reversals in a zig-zag fashion, using only price action analysis and a donchian channel. It has been specifically designed for short-term trading, without repainting or backpainting at all. It is a fantastic tool for shrewd traders aiming to increase the timing of their operations. [ Installation Guide | Update Guide | Troubleshooting | FAQ | All Products ]
Amazingly easy to trade It provides

Delta Single Volume is a very powerful indicator that reads the supply on the Market.
It calculates the Delta from movement of the price and the difference of BUY and SELL volumes. Its special structure allows you to get all timeframe values available on the MT5 platform. It works on Tick Volumes and Real Volumes (if avalaibles on your Broker). A good observation of this instrument can suggest great entry points and possible reversal. We are confident that this tool will help you to improve you

Recommended TimeFrame >= H1. 100% Non Repainted at any moment. Use it carefully, only with Trend Direction.
Trading Usage: 2 Variants: as Range System or as BreakOut System (Both Only With Trend Direction)::: (Always use StopLoss for minimise Risk);
[1] as Range System: (Recommended) in UP TREND: - BUY in Blue Line , then if price goes down by 50 points (on H1) open Second BUY. Close in any Profit you wish: TrailingStop(45 points) or Close when Price touches upper Gold Line.
in DOWN TREND
Ti presentiamo un indicatore rivoluzionario che cambia le regole del gioco nel mondo del trading di tendenza. L'indicatore è progettato per ripensare le prestazioni e portare la tua esperienza di trading a livelli senza precedenti. Il nostro indicatore vanta una combinazione unica di funzionalità all'avanguardia che lo distinguono dalla concorrenza. La tecnologia avanzata "Real Pricing Factors" offre una sostenibilità senza pari anche nelle condizioni di mercato più difficili e volatili. Dì addi
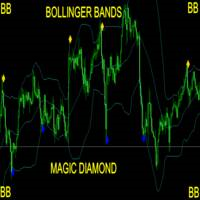
Take Your Trading Experience To the Next Level ! and get the Magic Bollinger Bands Diamond Indicator MagicBB Diamond Indicator is MT5 Indicator which can suggest signals for you while on MT5. The indicator is created with Non Lag Bollinger Bands strategy for the best entries. This is a system to target 10 to 20 pips per trade. The indicator will give alerts on the pair where signal was originated including timeframe. If signal sent, you then enter your trade and set the recommended pips targ

# 33% off - limited time only # ChartSync Pro MT5 is an indicator, designed for the MetaTrader 5 trading terminals. It enables the trader to perform better multi-timeframe technical analysis, by synchronizing symbols and objects into virtually unlimited charts. Built by traders for traders! Telegram Premium Support - Dd you purchase the Chart Sync indicator and need a bit of help? Send us a screenshot with your purchase and your Telegram ID so we can add you to our premium support Telegram g

Gold Levels MTF - this is a fine stock technical indicator. The indicator algorithm analyzes the movement of the asset price, displays price levels of support and resistance from all time frames (TF) using the Murray method based on the Gann theory. The indicator indicates overbought and oversold fields, giving an idea of possible reversal points and at the same time giving some idea of the strength of the current trend.
Description of levels: (Extreme Overshoot) - these levels are the ultimate
FREE
Il MetaTrader Market è l'unico negozio online dove è possibile scaricare la versione demo gratuita di un robot di trading che consente di effettuare test e ottimizzazioni utilizzando dati statistici.
Leggi la descrizione dell'applicazione e le recensioni di altri clienti, scaricala direttamente sul tuo terminale e prova un robot di trading prima di acquistarlo. Solo sul MetaTrader Market è possibile testare un'applicazione in modo assolutamente gratuito.
Ti stai perdendo delle opportunità di trading:
- App di trading gratuite
- Oltre 8.000 segnali per il copy trading
- Notizie economiche per esplorare i mercati finanziari
Registrazione
Accedi
Se non hai un account, registrati
Consenti l'uso dei cookie per accedere al sito MQL5.com.
Abilita le impostazioni necessarie nel browser, altrimenti non sarà possibile accedere.