YouTube'dan Mağaza ile ilgili eğitici videoları izleyin
Bir alım-satım robotu veya gösterge nasıl satın alınır?
Uzman Danışmanınızı
sanal sunucuda çalıştırın
sanal sunucuda çalıştırın
Satın almadan önce göstergeyi/alım-satım robotunu test edin
Mağazada kazanç sağlamak ister misiniz?
Satış için bir ürün nasıl sunulur?
MetaTrader 5 için teknik göstergeler - 3

The Supply and Demand Zone Indicator is a powerful and easy-to-use tool designed to help traders identify critical supply and demand zones on the chart. These zones can provide valuable insight into potential market reversals, breakouts, and important price levels where buyers or sellers are likely to take control. The best FREE Trade Manager . If you want to create your own Hedging or Grid strategies without any coding make sure to check out the ManHedger Key Features: Automatic Zone Detect
FREE

Çoğu trader görür yutan mumları. Bunlarla kârlı bir şekilde nasıl işlem yapılacağını bilen azdır. Engulfing Pro Trader size basit sinyaller ve gerçek istatistikler — işlemler, kazançlar, kârlar — sunar, böylece tersine dönüşleri güvenle işlem yapabilirsiniz. Umut yok, sadece ihtiyacınız olan gerçek rakamlar. Real Trades’te size hayalleri değil, gerçeği gösteriyoruz. Yutan strateji gerçeğini görmek hoşunuza gitti mi? Bize 5 yıldızlı bir inceleme bırakın ve bana özelden mesaj atın , teşekkür olar
FREE
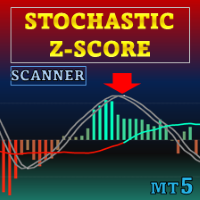
Özel teklif : ALL TOOLS , her biri sadece $35 ! Yeni araçlar ilk hafta boyunca veya ilk 3 satın alma için $30 olacaktır! MQL5’te Trading Tools Kanalı : en son haberler için kanalıma katılın Stochastic Z-Score, fiyatı Z skoru ile normalize eden, sinyali stokastik mantıkla sınırlandıran ve HMA ile yumuşatan bir momentum osilatörüdür; ALMA uzun vadeli bağlam sağlar. Net ve duyarlı bir sinyal sunar; ayrıca isteğe bağlı histogram, dinamik bantlar ve dönüş etiketleriyle momentum değişimlerin

"Haven Candle Timer Countdown" göstergesi, farklı zaman dilimlerinin zaman çerçevelerini kontrol etmenize yardımcı olacak basit ve kullanışlı bir araçtır. Mevcut sunucu saatini ve seçilen üç zaman dilimindeki mumların bitişine kadar olan geri sayımı aynı anda gösterir. Bu araç, birden fazla zaman diliminde mevcut mumun bitişine ne kadar süre kaldığını tam olarak bilmesi gereken trader'lar için özellikle faydalıdır ve böylece zamanında karar vermelerini sağlar. Bu göstergenin kullanımı, analiz sü
FREE

Rental/Lifetime Package Options and Privileges
Rent Monthly Six Months Yearly/Lifetime Weis Wave with Speed with Alert+Speed Index x x x Manual x x x Quick Set up Video x x x Blog x x x Lifetime Updates x x x Setup and Training Material
x x Discord Access Channel "The SI traders" x Rectangle Break Alert Tool x
How to trade with it: http://www.tradethevolumewaves.com ** If you purchase please contact me to setup your : Training Room and complete manual access.
Wei
TÜM ÜCRETSİZ ÜRÜNLERİMİ GÖRMEK İÇİN BURAYA TIKLAYIN
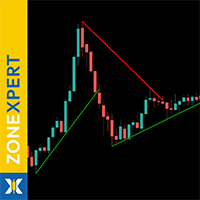
ZoneXpert , MetaTrader 5 için görsel piyasa analiz aracındır - Destek ve Direnç bölgelerini otomatik olarak tespit etmek , renklerle vurgulamak ve gerçek zamanlı olarak güncellemek için geliştirilmiştir. Gösterge, fiyat yapıları, en yüksekler, en düşükler ve hacim bölgelerini analiz ederek piyasanın gerçekten nerede tepki verdiğini - ve seviyeleri nerede kırdığını - sana net bir şekilde gösterir. ZoneXpert sayesinde piyasa gücünün nerede top
FREE

BUY INDICATOR AND GET NEW EXCLUSIVE EA FOR FREE AS A BONUS! ITALO ARROWS INDICATOR is the best reversal indicator ever created, and why is that? Using extreme reversal zones on the market to show the arrows and Fibonacci numbers for the Take Profit, also with a panel showing all the information about the signals on the chart, the Indicator works on all time-frames and assets, indicator built after 8 years of experience on forex and many other markets. You know many reversal indicators around t

Bu, MACD tabanlı bir trend takip göstergesidir ve 200 MA'nın üzerindeyken alım sinyalleri, altındayken satış sinyalleri sağlar.
Sinyal, MACD'nin sıfır çizgisini geçtiğinde üretilir. Gösterge aynı zamanda stop loss olarak kullanılabilecek bir destek ve direnç seviyesini de görüntüler. Ayarlanabilir parametreler arasında MA dönemi, MACD hızlı EMA, yavaş EMA ve destek-direnç aralığı bulunur. Son mumların en düşük ve en yüksek noktalarına çizilir.
Varsayılan ayarlar:
SR aralığı: 10 MA dönemi: 20
FREE

Special offer : ALL TOOLS , just $35 each! New tools will be $30 for the first week or the first 3 purchases ! Trading Tools Channel on MQL5 : Join my MQL5 channel to update the latest news from me Volumatic VIDYA (Variable Index Dynamic Average) , trendleri izlemek ve her trend aşamasında alım-satım baskısını analiz etmek için tasarlanmış gelişmiş bir göstergedir. Dinamik Ortalama Değişken Endeksi (Variable Index Dynamic Average) temel bir dinamik düzleştirme tekniği olarak kullan

RelicusRoad Pro: Kantitatif Piyasa İşletim Sistemi ÖMÜR BOYU ERİŞİMDE %70 İNDİRİM (SINIRLI SÜRE) - 2.000+ TRADER'A KATILIN Neden çoğu trader "mükemmel" indikatörlere rağmen başarısız olur? Çünkü tekil kavramları boşlukta trade ederler. Bağlamı olmayan bir sinyal kumardır. Sürekli kazanmak için KONFLÜANS (UYUM) gerekir. RelicusRoad Pro basit bir ok indikatörü değildir. Tam bir Kantitatif Piyasa Ekosistemi dir. Tescilli volatilite modellemesini kullanarak fiyatın ilerlediği "Adil Değer Yolu"nu har

Tahmin etmeyi bırakın. İstatistiksel avantajla işlem yapmaya başlayın. Hisse senedi endeksleri forex gibi işlem görmez. Tanımlanmış seansları vardır, gecelik boşluklar oluştururlar ve öngörülebilir istatistiksel kalıpları takip ederler. Bu gösterge, DAX, S&P 500 ve Dow Jones gibi endeksleri güvenle işlem yapmanız için ihtiyaç duyduğunuz olasılık verilerini sağlar. Onu farklı kılan nedir Çoğu gösterge size ne olduğunu gösterir. Bu, muhtemelen bir sonra ne olacağını gösterir. Her işlem gününde, gö

Classic MACD
It has MACD line, Signal line, and Histogram . The Histogram has 4 colors , showing its movement direction as simple as possible. The smoothing factor in the input helps to eliminate noisy signals. Besides different price types (hlc, hlcc, ohlc, ...), there is an option to use volume data as the source for MACD calculations (which is better to be used by real volume not unreliable tick volume). While the original MACD indicator uses Exponential Moving Average, this indicator provide
FREE

Tanım:
"Piyasa Yapısı HH HL LH LL" göstergesi, finansal piyasalardaki fiyat dinamiklerini analiz etmek için güçlü ve aynı zamanda basit bir araçtır. Bu gösterge, yatırımcıların ve yatırımcıların trendlerdeki değişiklikleri tespit etmelerine ve fiyat zaman serilerindeki önemli noktaları tespit etmelerine yardımcı olur.
Göstergenin temel bileşenleri:
HH (Yüksek Yüksek): Fiyatın bir önceki yüksek tepenin üzerinde kapandığı tepe. HH güçlenen bir yükseliş trendine işaret ediyor. HL (Yüksek Düşük)
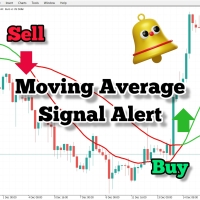
İşlem stratejinizde hareketli ortalamaları kullanıyorsanız, bu gösterge sizin için çok faydalı olabilir. İki hareketli ortalamanın kesişiminde sinyal sağlar, işitsel uyarılar gönderir, işlem platformunuzda bildirimler görüntüler ve olayla ilgili bir e-posta da gönderir. Kendi işlem tarzınıza ve stratejinize uyum sağlamak için kolayca özelleştirilebilir ayarlarla birlikte gelir. Ayarlanabilir parametreler: Hızlı MA (Fast MA) Yavaş MA (Slow MA) E-posta Gönder (Send_Email) İşitsel Uyarılar (Audibl
FREE

Easy Buy Sell is a market indicator for opening and closing positions. It becomes easy to track market entries with alerts.
It indicates trend reversal points when a price reaches extreme values and the most favorable time to enter the market. it is as effective as a Fibonacci to find a level but it uses different tools such as an algorithm based on ATR indicators and Stochastic Oscillator. You can modify these two parameters as you wish to adapt the settings to the desired period. It cannot

Bu VWAP, basit bir VWAP'tir, ancak fiyatın basit VWAP'a dokunduğunda veya fiyatın VWAP'ı geçtiğinde bildirimler almanız için bu VWAP'a uyarılar ekledik. Bu gösterge, MetaTrader 5 (MT5) için geleneksel bir VWAP göstergesidir. Varsayılan parametreler normal VWAP'inki gibidir, ancak yeni hesaplamaları ve daha iyisini kullanma yeteneğiniz vardır: Fiyat VWAP'a dokunduğunda veya VWAP'ı geçtiğinde, bildirimler, cep telefonu bildirimleri, e-posta veya ses olayları aracılığıyla bilgilendirileceksiniz. Me
FREE

40% off. Original price: $50 (Ends on February 15)
Advanced Bollinger Bands Scanner is a multi symbol multi timeframe Bollinger bands dashboard that monitors and analyzes the Bollinger Bands indicator from one chart. This panel scans the Bollinger bands indicator in up to 28 configurable instruments and 9 timeframes for price overbought/oversold, price consolidation (Bollinger bands squeeze), and consolidation breakout (squeeze break) with a deep scan feature to scan all market watch symbols

GoldStructure Pro – XAUUSD Structure & Volatility Analysis Gold requires a unique approach compared to other currency pairs.
Most losses on XAUUSD occur from trading during low-volatility ranges or entering during false breakouts. GoldStructure Pro is a decision-support system built for Gold traders who want to avoid low-probability entries and focus on alignment between volatility and market structure. The Challenge with Gold Trading Traders often experience accumulated small losses during com
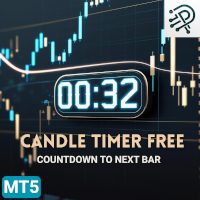
Candle Timer Countdown to Next Bar is a MetaTrader 5 indicator that displays the remaining time until the current candle closes directly on the chart. The indicator shows a real-time countdown for the active bar. During the final 10 seconds before the candle closes, the timer changes color and blinks to indicate an upcoming bar close. Functionality
Displays remaining time until the current bar closes Updates automatically in real time Visual blinking alert during the last 10 seconds of the candl
FREE
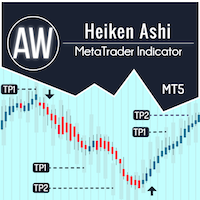
AW Heiken Ashi — Trend ve TP seviyelerinin akıllı göstergesi. Klasik Heiken Ashi'ye dayalı, tüccarlar için uyarlanmış, daha fazla esneklik ve netliğe sahip gelişmiş gösterge. Standart göstergenin aksine, AW Heiken Ashi trendi analiz etmeye, kar hedeflerini belirlemeye ve yanlış sinyalleri filtrelemeye yardımcı olarak daha güvenli ticaret kararları sağlar. Kurulum Kılavuzu ve Talimatlar - Burada / MT4 Sürümü - Burada AW Heiken Ashi'nin Avantajları: Herhangi bir varlık ve zaman diliminde çalışır,

Super Signal Market Slayer
No repaint | Alta precisione | Indicatore di trend intelligente multi-mercato Nel trading, la vera difficoltà non è aprire un’operazione,
ma riconoscere chiaramente quando un trend sta realmente iniziando. Market Slayer nasce proprio per questo. È un indicatore intelligente senza repaint, progettato specificamente per il trading intraday.
Grazie a conferme multilivello e filtri di trend, fornisce segnali Buy / Sell chiari e affidabili solo nei momenti chiave. Vantaggi

CDV Candle Engine Pro is a MetaTrader 5 indicator designed to visualize Cumulative Delta Volume (CDV) directly on the price chart. It helps traders read market pressure more clearly by showing the balance between buying and selling activity in a clean, customizable layout. If you trade on MetaTrader 4, the MT4 edition is available here: CDV Candle Engine Pro MT4 Public channel: CLICK HERE
Main Features CDV candle visualization on the main chart for easy reading in real time. Optional subwind

Selamlar arkadaşlar, bu MT5 terminali için güncellenmiş versiyondur. Bu, ilk indikatörüme dayanan yeni ürünüm; gereksiz ayarlar olmadan Altın için optimize edilmiş geliştirilmiş bir versiyondur. İndikatör, bildirim göndermeyi desteklemektedir. Kullanım Önerileri: Enstrüman - XAUUSD (ana enstrüman, bunun için optimize edilmiştir) Enstrüman - XAUEUR (ikincil enstrüman; bunun için optimize edilmedi, ancak sonuçlarından memnunum) Zaman Aralığı - H4. İndikatörü grafiğe ekleyin ve olduğu gibi bı

Crystal Buy Sell Liquidity — MT5 için Likidite Sweep İndikatörü Genel Bakış
Crystal Buy Sell Liquidity, MetaTrader 5 için geliştirilmiş profesyonel bir göstergedir. Bu araç, likidite sweep (likidite avı) modellerine dayalı olarak yüksek olasılıklı alım ve satım fırsatlarını tespit eder. Gün içi piyasa yapısını analiz ederek kurumsal likidite avcılığını belirler ve perakende yatırımcıların likiditesi süpürüldüğünde ve fiyat tersine döndüğünde net sinyaller sunar. Temel Özellikler Likidite Sweep
FREE

Temel Renko göstergesi, net ve özlü bir piyasa perspektifi arayan yatırımcılar için güçlü bir araçtır. Göstergemiz yalnızca trend görselleştirmeyi basitleştirmekle kalmaz, aynı zamanda tersine dönüşler için doğru uyarılar sunarak ticaretinizde stratejik bir avantaj sağlar / Ücretsiz MT4 Sürümü
Özellikler Tamamen Özelleştirilebilir: Gelişmiş özelleştirme seçenekleriyle göstergeyi iş tercihlerinize göre uyarlayın. Renklerden kutu boyutu ayarlarına kadar, bilgilerin grafiğinizde nasıl görünt
FREE
Special offer : ALL TOOLS , just $35 each! New tools will be $30 for the first week or the first 3 purchases ! Trading Tools Channel on MQL5 : Join my MQL5 channel to update the latest news from me SMC , traderların likidite bölgelerini, kurumsal emir yerleşimlerini ve piyasanın önemli dönüş noktalarını belirlemelerine yardımcı olan bir ticaret yaklaşımıdır. SMC prensiplerini kullanarak, traderlar piyasayı daha etkili bir şekilde yönlendirebilir ve optimal giriş-çıkış noktalarını b
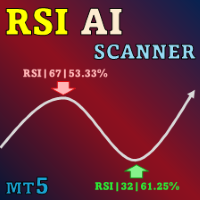
Special offer : ALL TOOLS , just $35 each! New tools will be $30 for the first week or the first 3 purchases ! Trading Tools Channel on MQL5 : Join my MQL5 channel to update the latest news from me MT5 için devrim niteliğindeki RSI Kernel Optimized with Scanner’ı sunuyoruz. Bu gelişmiş araç, güçlü Çekirdek Yoğunluk Tahmin (KDE) algoritmasını entegre ederek geleneksel RSI analizini yeniden tanımlıyor. Bu gelişmiş gösterge, sadece piyasadaki trendlerle ilgili gerçek zamanlı bilgiler
Volumatic Trend is a powerful, trend-following indicator that merges directional analysis with real-time volume behavior. By combining adaptive trend logic and volume overlays, it gives traders a detailed snapshot of market conviction and potential turning points. From instant trend shift detection to volume-weighted candle visuals, this tool brings deeper context to price movement. MT4 Version - https://www.mql5.com/en/market/product/136210/ Join To Learn Market Depth - https://www.mql5.co
FREE

Göreceli Güç Endeksi (RSI) göstergesinin çoklu para birimi ve çoklu zaman çerçeveli modifikasyonu. Parametrelerde istediğiniz para birimini ve zaman dilimlerini belirtebilirsiniz. Ayrıca panel aşırı alım ve aşırı satım seviyelerini geçerken bildirim gönderebilir. Noktalı bir hücreye tıkladığınızda bu sembol ve nokta açılacaktır. Bu MTF Tarayıcıdır.
Kontrol panelini grafikten gizlemenin anahtarı varsayılan olarak "D"dir.
Para Birimi Gücü Ölçer'e benzer şekilde, Kontrol Paneli belirli bir para
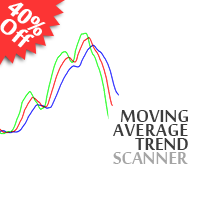
40% off. Original price: $50 (Ends on February 15) Moving Average Trend Scanner is a multi symbol multi timeframe triple MA crossover dashboard that helps traders to monitor, and identify potential market trends from one chart. This panel scans 3 moving averages in up to 28 configurable instruments and 9 timeframes for triple moving average alignment and moving average crossover with a deep scan feature to scan all market watch symbols (up to 1000 instruments!).
Download Demo here (Scans

Bu gösterge, farklı zaman ölçeklerinde birçok grafiğin gözden geçirilmesini daha hızlı ve daha kolay hale getirmek için tasarlanmıştır. Birden fazla grafikte Zaman ve Fiyatı İzleyin Bir grafikteki Sembolü Değiştirin ve aynı sembolün diğer tüm çizelgeleri de değişecektir. Kullanımı kolay, ustalaşması hızlı Gösterge, aynı Sembolde açık olan diğer tüm grafiklerde fare işaretçisinin geçerli grafikte bulunduğu fiyatı ve zamanı belirlemenize olanak tanır. Bu, birden fazla grafikteki bilgileri hızlı bi

Destek ve Direnç bölgeleri Göstergesi MT5 bu gösterge, tepeleri ve dipleri otomatik olarak nasıl belirleyeceğini bilir. Bu destek ve direnç göstergesi, üst ve alt noktalara göre destek çizgileri ve direnç çizgileri oluşturur. destek ve direnç çizgileri nasıl yapılır? Bu, otomatik destek ve direnç çizgileri oluşturmanın bir göstergesidir. gösterge ile destek seviyesi nasıl bulunur? bu gösterge, tepeleri ve dipleri otomatik olarak bulur. Gösterge, "ZigZag" otomatik olarak bir dip oluşturduğunda ve
FREE
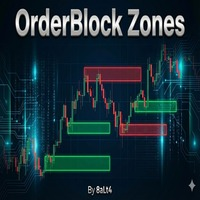
OrderBlock Zone - Profesyonel Alım-Satım Bölgesi İndikatörü Genel Bakış OrderBlock Zone, piyasadaki kurumsal işlem bölgelerini (Order Blocks) otomatik olarak tespit eden ve görselleştiren gelişmiş bir MetaTrader 4 indikatörüdür. Büyük oyuncuların (bankalar, hedge fonlar) bıraktığı izleri takip ederek, potansiyel destek ve direnç seviyelerini belirler. Temel Özellikler Otomatik OrderBlock Tespiti Fractal Tabanlı Analiz: 36 periyotluk (özelleştirilebilir) fractal analizi ile güçlü dönüş noktalar
FREE

The indicator identifies divergence by analyzing the slopes of lines connecting price and MACD histogram peaks or troughs. Bullish Divergence (Convergence): Occurs when the lines connecting MACD troughs and corresponding price troughs have opposite slopes and are converging. Bearish Divergence: Occurs when the lines connecting MACD peaks and corresponding price peaks have opposite slopes and are diverging. When a divergence signal is detected, the indicator marks the chart with dots at the pric
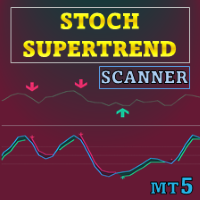
Özel fırsat : ALL TOOLS , her biri sadece $35 ! Yeni araçlar ilk hafta boyunca veya ilk 3 satın alma için $30 olacaktır! Trading Tools Channel on MQL5 : En son haberleri almak için MQL5 kanalıma katılın Bu araç, momentum değişimlerine dayalı yön sinyalleri üretmek için Stochastic RSI’ı SuperTrend mantığıyla birleştirir. Stochastic RSI üzerine SuperTrend tarzı bir zarf yerleştirir ve momentum aşırı alım/aşırı satım eşiklerini geçtiğinde dönüş noktalarını vurgular. Daha fazla MT5 sürüm

DRX PRIME FLOW – Otomatik Uyarlanabilir Piyasa Sistemi Netlik ile işlem yapın. Akışı (Flow) yakalayın. Guid ---> link
DRX Prime Flow, yeni nesil bir görsel işlem (trading) sistemidir. Yatırımcıları piyasa analizinin zahmetli işinden kurtarmak için geliştirilmiştir. Sizi karmaşık hesaplamalar veya manuel ayarlarla yormak yerine, bu araç en önemli şeyi bir bakışta sunar: Piyasanın gerçek yapısı. Sistem, arka planda herhangi bir varlığa (Altın, Kripto veya Döviz) otomatik olarak uyum sağlayan

This MT5 indicator is a conversion of the UT Bot Alerts indicator by @QuantNomad from TradingView.
It utilizes ATR to generate custom candles on the chart while providing strong entry signals based on these candles.
All buffers, including those for the custom candles and entry signals, are available, making it easy to integrate into any EA.
Additionally, various strategies based on this indicator can be found online, or you can contact me for a custom strategy development.
FREE
Genel Bakış Bu gösterge, önceki dönemlerden türetilmiş üç tür destek ve direnç seviyesini izler: Daily (dünün en yüksek/düşük), Weekly (geçen hafta) ve Monthly (geçen ay). Fiyatın tepki verme ihtimalinin yüksek olduğu kilit seviyeleri görsel olarak haritalandırır; bu da hem olası dönüşler i hem de anlamlı breakout (kopuş) hareketlerini tespit etmek için değerlidir. Özellikler Otomatik olarak çizer: Dünün yüksek/düşük seviyeleri (Daily) Önceki haftanın yüksek/düşük seviyeleri (Weekly) Önceki ayın
FREE

MT4 versiyonu | Trend Monitor VZ göstergesi | Owl Smart Levels göstergesi | Owl Smart Levels stratejisi | FAQ Elliott'un dalga teorisi , finansal piyasalardaki süreçlerin, fiyat çizelgelerindeki dalgaların görsel modeline dayanan bir yorumudur. Valable ZigZag göstergesi , ticaret kararları için güvenebileceğiniz pazarın dalga yapısını görüntüler. Valable ZigZag göstergesi daha kararlıdır ve tüccarları yanıltarak klasik ZigZag göstergesi gibi yönünü sık sık değiştirmez. Bu, gösterge da
FREE

The Best SMC for All indicator is designed for MetaTrader 5 (MT5) to implement Smart Money Concepts (SMC) for analyzing market structure and identifying key trading zones based on price action. It visualizes supply and demand zones, Break of Structure (BOS) levels, Points of Interest (POI), and optional ZigZag patterns to assist traders in making informed decisions. Below is a detailed description of its features:
---
Features
1. Swing High/Low Detection:
- Functionality: Automatically iden
FREE

Gold Levels MTF - this is a fine stock technical indicator. The indicator algorithm analyzes the movement of the asset price, displays price levels of support and resistance from all time frames (TF) using the Murray method based on the Gann theory. The indicator indicates overbought and oversold fields, giving an idea of possible reversal points and at the same time giving some idea of the strength of the current trend.
Description of levels: (Extreme Overshoot) - these levels are the ultimate
FREE
- Real price is 80$ - 40% Discount (It is 49$ now) Contact me for instruction, any questions! - Non-repaint - I just sell my products in Elif Kaya Profile, any other websites are stolen old versions, So no any new updates or support. - Lifetime update free Related product: Bitcoin Expert Introduction The Breakout and Retest strategy is traded support and resistance levels. it involves price breaking through a previous level. The break and retest strategy is designed to help traders do two main

Elliott Wave Trend was designed for the scientific wave counting. This tool focuses to get rid of the vagueness of the classic Elliott Wave Counting using the guideline from the template and pattern approach. In doing so, firstly Elliott Wave Trend offers the template for your wave counting. Secondly, it offers Wave Structural Score to assist to identify accurate wave formation. It offers both impulse wave Structural Score and corrective wave Structure Score. Structural Score is the rating to sh

The indicator draws the time scale on the chart. You can specify the time offset, adjust the size and font to display on the chart ( it is displaying your local time on your chart instead of MT time ). You can also select the desired format for displaying the date and time. You may be interested in my other product , which contains a more advanced version of the Time Scale .
You can also find my other products here Parameters Hours (time shift) — time shift (hours); Minutes (time shift) — time
FREE

Trend Battle Indicator
Overview The Trend Battle Indicator is a professional technical analysis tool that reveals the battle between buyers (Bulls) and sellers (Bears) in the market through a comprehensive dashboard. Using an intuitive visual interface, the indicator offers a unique perspective on market power dynamics by analyzing the last twenty bars to provide precise insights into momentum and directional strength. Additionally, the panel provides automatic real-time updates for bars in for

WARNING: This indicator is distributed EXCLUSIVELY on MQL5.com MT4 version: https://www.mql5.com/it/market/product/160363 MT5 version: https://www.mql5.com/it/market/product/160410 ============================================================================================= MAX RIBBON ver 1.00 The indicator that shows you the TREND clearly and unambiguously! ============================================================================================= DESCRIPTION MAX RIBBON is an advanced tre

Was: $249 Now: $99 Market Profile defines a number of day types that can help the trader to determine market behaviour. A key feature is the Value Area, representing the range of price action where 70% of trading took place. Understanding the Value Area can give traders valuable insight into market direction and establish the higher odds trade. It is an excellent addition to any system you may be using. Inspired by Jim Dalton’s book “Mind Over Markets”, this indicator is designed to suit the
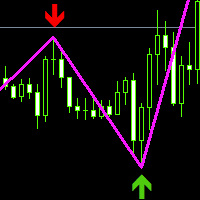
This index is based on the secondary development of zigzag, adding high and low point arrow indication, thickening the line and changing the color. Can be a good display of the current admission trading signals, current long or short. It can be combined with other indicators to determine the trading point, which has great reference value. Compared with the general trend index or oscillation batch standard, the accurate determination is higher from the perspective of historical data research and
FREE

IOF Footprint - Institutional Order Flow Indicator Professional footprint chart indicator that reveals institutional order flow directly on MetaTrader 5. See what smart money is doing with real-time bid/ask volume analysis at every price level. Core Features: Bid/Ask Volume Display - See exact volumes traded at bid vs ask at each price level Delta Analysis - Real-time and cumulative delta calculation per bar Point of Control (POC) - Automatic detection of highest volume price levels Value Area (

"MACD Ribbon Dynamic PRO: Volatiliteyi Trende Dönüştürün" Kısa Açıklama : "Tek bir çizgiye güvenmeyin. Piyasanın derinliğini görün. Bitcoin, Altın ve Forex için optimize edilmiş, spread hatalarından arındırılmış yeni nesil trend takipçisi." Ürün Detay Açıklaması : Neden MACD Ribbon Dynamic?
Standart indikatörler Bitcoin veya Altın gibi yüksek volatiliteli varlıklarda yanlış sinyaller üretir.
MACD Ribbon Dynamic , piyasa gürültüsünü filtrelemek için çok katmanlı bir algoritma kullanır. Öne
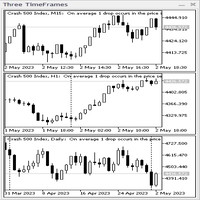
Üç Zaman Çerçevesi gösterge paneli. Gösterge, CAppDialog sınıfına dayalı bir panel şeklinde yapılır. Panel, fare kullanılarak simge durumuna küçültülebilir veya geçerli grafikte hareket ettirilebilir. Gösterge, paneldeki mevcut sembolün üç zaman dilimini gösterir. Mevcut sürümde, göstergenin minimum sayıda ayarı vardır - bunlar üç zaman diliminin parametreleridir: "Daha genç zaman dilimi", " Orta zaman dilimi " ve " Daha eski zaman dilimi ". Başlatıldığında, gösterge paneli mevcut ta

Fractal Model Indicator for Metatrader , meticulously crafted around the renowned Fractal Model by TTrades. This powerful tool empowers traders to navigate price action with precision, leveraging multi-timeframe analysis to anticipate momentum shifts, swing formations, and trend continuations. Designed for MetaTrader , the Fractal Model Indicator combines advanced algorithmic insights with customizable features, making it an essential addition for traders seeking to capitalize on expansive mar

Bu gösterge, pratik ticaret için mükemmel olan otomatik dalga analizine yönelik bir göstergedir! Dava...
Not: Dalga sınıflandırması için Batılı isimleri kullanmaya alışkın değilim. Tang Lun'un (Tang Zhong Shuo Zen) adlandırma kuralının etkisiyle, temel dalgayı kalem , ikincil dalga bandını ise segment olarak adlandırdım. aynı zamanda segmentin trend yönü vardır. Adlandırma esas olarak trend segmentidir (bu adlandırma yöntemi gelecekteki notlarda kullanılacaktır, öncelikle söyleyey

Institutional-grade CRT Ghost Candle & HTF Fractal framework that projects higher-timeframe structure, liquidity sweeps, and directional bias directly onto lower timeframes — built for serious discretionary traders.
Product Overview CRT Ghost Candle HTF Fractal is an advanced market structure and liquidity visualization indicator designed to compress higher timeframe logic directly onto your working chart—without switching timeframes. This indicator fuses Candle Range Theory (CRT), Higher Timef
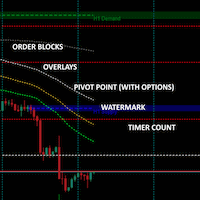
Multiple indicators in one: Order Blocks with optional higher timeframe overlay Watermark Count down timer Pivot points No fancy algorithms but tends to be quite accurate for some symbols to predict bounce, return-to and break-through channels. It is a retrospective indicator (as they all are) and there to help you with better guesses as to where a movement is going towards. The last two order blocks are shaded and extends past the current time. Prior order blocks (within your selected timeframe
FREE

Trendline Targets Dashboard MT5 Trendline Targets Dashboard MT5 , tam bir görsel işlem planı sunan bir MetaTrader 5 göstergesidir: Sinyal , Giriş (Entry) , Zarar Durdur (Stop Loss) ve Kâr Al (Take Profit) seviyelerini R (risk) katlarına göre otomatik olarak hesaplar. Bu gösterge otomatik işlem açmaz. Bir işlem robotu değil, görsel bir analiz ve yönetim aracıdır. Lansman Teklifi: Her satın alma işlemi için MQL5 profilimden seçeceğiniz 1 adet gösterge hediye edilecektir. İstisna: Bu bonus, Market

AtBot: Come funziona e come usarlo ### Come funziona L'indicatore "AtBot" per la piattaforma MT5 genera segnali di acquisto e vendita utilizzando una combinazione di strumenti di analisi tecnica. Integra la Media Mobile Semplice (SMA), la Media Mobile Esponenziale (EMA) e l'indice di Gamma Vero Medio (ATR) per identificare opportunità di trading. Inoltre, può utilizzare le candele Heikin Ashi per migliorare la precisione dei segnali. Lascia una recensione dopo l'acquisto e ricevi un regalo bonu
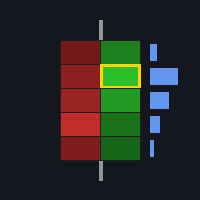
FOOTPRINTORDERFLOW: The Authoritative Guide ( This indicator is also compatible with economic providers that do not offer DOM data and BID/ASK data, It also supports various foreign exchange transactions, DEMO version,modleling must choose " Every tick based on real ticks" ) Important notice: Before placing an order, please contact me first, and I will provide you with professional answers and services
1. Overview FOOTPRINTORDERFLOW is an advanced Order Flow analysis tool designed for MetaTra
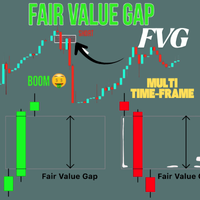
Crystal FVG Touch Detector – Gelişmiş Smart Money Konsept Göstergesi Crystal FVG Touch Detector, Smart Money Concepts (SMC) ve ICT metodunu kullanan profesyonel yatırımcılar için geliştirilmiştir.
Herhangi bir enstrümanda veya zaman diliminde Fair Value Gap (FVG) bölgelerini otomatik tespit eder ve temas anlarını grafik üzerinde gösterir.
Yeniden çizim yapmayan algoritması sayesinde kurumsal dengesizlik alanlarını gerçek zamanlı olarak belirler. Öne çıkan özellikler Boğa ve ayı FVG tespiti. Fiya
FREE
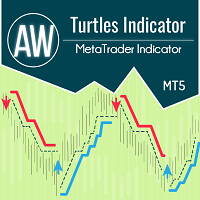
Gösterge Kaplumbağa sistemine göre çalışır ve klasik olarak 20 ila 55 mumluk bir zaman aralığını varsayar. Belirli bir zaman aralığında bir trend izlenir. Giriş, destek veya direnç seviyesinin kırıldığı anda yapılır. Çıkış sinyali, aynı zaman aralığındaki trendin tersi yönde bir fiyat kırılmasıdır. Avantajları:
Araçlar: Döviz çiftleri, hisse senetleri, emtialar, endeksler, kripto para birimleri Zaman Çerçevesi: Klasik olarak D1, ayrıca herhangi bir zaman diliminde çalışmaya uygundur İşlem saatl
FREE

Auto Fibonacci Retracement Indicator — Flexible and Reliable This isn’t just another Auto Fibonacci Retracement indicator. It’s one of the most flexible and dependable tools available . If you find it useful, please consider leaving a review or comment — your feedback means a lot! Check out my other helpful tools below: Smart Alert Manager - Set up advanced alerts and send them to Mobile, Telegram, Discord, Webhook...
Timeframes Trend Scanner - Scan the trend of assets in difference timefr
FREE

The "Power of Three" (PO3) is a concept developed by the Inner Circle Trader (ICT) to illustrate a three-stage approach used by smart money in the markets: Accumulation, Manipulation, and Distribution . ICT traders view this as a foundational pattern that can explain the formation of any candle on a price chart. In simple terms, this concept is effective for any time frame, as long as there's a defined start, highest point, lowest point, and end. MT4 - https://www.mql5.com/en/market/product/1
FREE

This indicator draws regular bullish and bearish divergences in real-time onto the charts. The algorithm to detect those divergences is based on my 10+ years experience of detecting divergences visually. The divergences are drawn as green and red rectangles on the charts. You can even do forward testing in the visual mode of the strategy tester.
Parameters Fast EMA Period: The period of the fast EMA of the MACD. Default value is 12.
Slow EMA Period: The period of the slow EMA of the MACD. Defau

[ My Channel ] , [ My Products ]
Bu indikatör, genel trend yukarı ya da aşağı hareket ederken, anlık bir baskı sonucu barın trendinin değiştiği noktaları gösterir. İndikatörün gösterdiği ok, bir önceki barın belirli kriterleri karşılaması durumunda çizilir. Stratejinizi oluştururken, arka arkaya gelen 3-4 oku potansiyel bir kırılma sinyali olarak yorumlayabilirsiniz. Örneğin, 4. okun geldiğini gördüğünüzde işlem açmayı düşünebilirsiniz. Bu, piyasadaki önemli hareketleri öngörmek ve ticaret kar
FREE

Pips Chaser göstergesi, manuel ticaretinizi tamamlamak için geliştirilmiştir. Bu gösterge hem kısa scalping hem de uzun swing ticareti için kullanılabilir // MT4 Sürümü
Özellikler Yeniden boyama göstergesi yok Bu gösterge, yeni veriler geldiğinde değerlerini değiştirmez Ticaret çiftleri Herhangi bir döviz çifti Zaman çerçevesi H1 tercih edilir, ancak bunu herhangi bir zaman dilimine uyarlayabilirsiniz İşlem süresi Günün her saati Buffers Buy Buffer: 0 / Sell Buffer: 1
Gereksinimler
Bazı p
FREE

SHOGUN TRADE PRO v3.82 ~ Cut Through the Noise. Master the "Commander's Eye." The Ultimate Dow Theory Market Structure Suite. ~ Click here for the MT4 version https://www.mql5.com/en/market/product/158467
1. Introduction: Why Do Most Traders Get Lost in the "Forest"? Are you constantly swayed by the noise of the 1-minute chart, losing money on emotional entries? A soldier running around the battlefield without a map cannot survive. The only one who survives and wins is the "Commander," who o
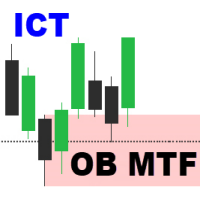
Order Block Multi Timeframe The Order Block Multi Timeframe is a powerful tool for Smart Money Concept (SMC) traders, combining high-accuracy Order Block detection with real-time Break of Structure (BOS) and Change of Character (CHoCH) analysis across multiple timeframes. Smart Money Insight, Multi-Timeframe Precision This indicator automatically identifies institutional Order Blocks —key price zones where large players have entered the market—and plots them directly on your chart. It also track

Volume Weighted Average Price (VWAP) The volume weighted average price (VWAP) is a trading benchmark used by traders that gives the average price a security has traded at throughout the day, based on both volume and price. It is important because it provides traders with insight into both the trend and value of a security. This indicator VWAP V2 is free and is the manual version of the extended Easy VWAP indicator (30 Euro), where the date and time properties are automatically entered. With
FREE

The Moving Average Convergence Divergence (MACD) işlem stratejisi, momentum ve trend yönündeki değişiklikleri belirlemek için kullanılan popüler bir teknik analiz aracıdır. MACD, 26 periyotlu üssel hareketli ortalamanın (EMA) 12 periyotlu EMA'dan çıkarılmasıyla hesaplanır. Ardından, "sinyal çizgisi" olarak adlandırılan 9 periyotlu EMA MACD'nin üzerine çizilir ve alım satım sinyalleri için bir tetikleyici olarak görev yapar. MACD, MACD hattı sinyal çizgisinin üzerindeyken boğa bölgesinde ve altın
FREE
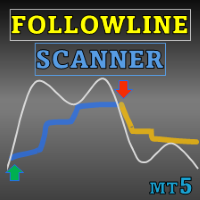
Special offer : ALL TOOLS , just $35 each! New tools will be $30 for the first week or the first 3 purchases ! Trading Tools Channel on MQL5 : Join my MQL5 channel to update the latest news from me Volatiliteye dayalı gelişmiş bir gösterge olan Follow Line MT5 ve Tarayıcı ile ticaret avantajınızı en üst düzeye çıkarın. Bu araç, özelleştirilebilir ayarlarla Bollinger Bantlarının gücünü birleştirir ve fiyat hareketlerine ilişkin hassas bilgiler sunar. See more MT4 version at: Follo
FREE
MetaTrader mağazası, geliştiricilerin alım-satım uygulamalarını satabilecekleri basit ve kullanışlı bir sitedir.
Ürününüzü yayınlamanıza yardımcı olacağız ve size Mağaza için ürününüzün açıklamasını nasıl hazırlayacağınızı anlatacağız. Mağazadaki tüm uygulamalar şifreleme korumalıdır ve yalnızca alıcının bilgisayarında çalıştırılabilir. İllegal kopyalama yapılamaz.
Alım-satım fırsatlarını kaçırıyorsunuz:
- Ücretsiz alım-satım uygulamaları
- İşlem kopyalama için 8.000'den fazla sinyal
- Finansal piyasaları keşfetmek için ekonomik haberler
Kayıt
Giriş yap
Gizlilik ve Veri Koruma Politikasını ve MQL5.com Kullanım Şartlarını kabul edersiniz
Hesabınız yoksa, lütfen kaydolun
MQL5.com web sitesine giriş yapmak için çerezlerin kullanımına izin vermelisiniz.
Lütfen tarayıcınızda gerekli ayarı etkinleştirin, aksi takdirde giriş yapamazsınız.