Conheça o Mercado MQL5 no YouTube, assista aos vídeos tutoriais
Como comprar um robô de negociação ou indicador?
Execute seu EA na
hospedagem virtual
hospedagem virtual
Teste indicadores/robôs de negociação antes de comprá-los
Quer ganhar dinheiro no Mercado?
Como apresentar um produto para o consumidor final?
Indicadores Técnicos para MetaTrader 5 - 3

The Supply and Demand Zone Indicator is a powerful and easy-to-use tool designed to help traders identify critical supply and demand zones on the chart. These zones can provide valuable insight into potential market reversals, breakouts, and important price levels where buyers or sellers are likely to take control. The best FREE Trade Manager . If you want to create your own Hedging or Grid strategies without any coding make sure to check out the ManHedger Key Features: Automatic Zone Detect
FREE

O indicador Magic Histogram MT5 é uma ferramenta universal, adequada para escalpelamento e negociação de médio prazo. Este indicador usa uma fórmula inovadora e permite determinar a direção e a força da tendência. Magic Histogram MT5 não é redesenhado, então você pode avaliar sua eficiência usando dados de histórico. É mais adequado para M15, M30, H1 e H4.
Benefícios do Indicador Excelentes sinais indicadores! Adequado para iniciantes e comerciantes experientes. Usando as configurações flexív
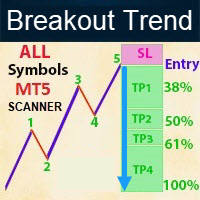
Contact me for instruction, any questions! - Lifetime update free - Non-repaint - I just sell my products in Elif Kaya Profile, any other websites are stolen old versions, So no any new updates or support. Introduction Breakout Trend Scanner indicator works based on the Elliott Wave in technical analysis describes price movements in the financial market that are related to changes in trader sentiment and psychology and finds end of movement and breakout trend. The Elliott Wave pattern that is f
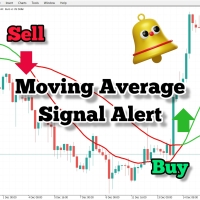
Se você usa médias móveis em sua estratégia de negociação, então este indicador pode ser muito útil para você. Ele fornece alertas quando há um cruzamento de duas médias móveis, envia alertas sonoros, exibe notificações em sua plataforma de negociação e também envia um e-mail sobre o evento. Ele vem com configurações facilmente personalizáveis para se adaptar ao seu próprio estilo e estratégia de negociação. Parâmetros ajustáveis: MA rápida MA lenta Enviar e-mail Alertas sonoros Notificações pu
FREE

Special offer : ALL TOOLS , just $35 each! New tools will be $30 for the first week or the first 3 purchases ! Trading Tools Channel on MQL5 : Join my MQL5 channel to update the latest news from me Volumatic VIDYA (Variable Index Dynamic Average) é um indicador avançado projetado para rastrear tendências e analisar a pressão de compra e venda em cada fase de uma tendência. Utilizando o Promédio Dinâmico de Índice Variável (Variable Index Dynamic Average) como técnica central de sua

Classic MACD
It has MACD line, Signal line, and Histogram . The Histogram has 4 colors , showing its movement direction as simple as possible. The smoothing factor in the input helps to eliminate noisy signals. Besides different price types (hlc, hlcc, ohlc, ...), there is an option to use volume data as the source for MACD calculations (which is better to be used by real volume not unreliable tick volume). While the original MACD indicator uses Exponential Moving Average, this indicator provide
FREE

Se você está procurando um indicador confiável para negociar o conceito ICT, a Estrutura de Mercado ICT fornece um manual do usuário para traders que usam estratégias mais avançadas. Este indicador tudo-em-um se concentra em Conceitos ICT (Conceitos de Dinheiro Inteligente). A Estrutura de Mercado ICT tenta entender como as instituições negociam, ajudando a prever seus movimentos. Ao entender e utilizar esta estratégia, os traders podem obter informações valiosas sobre os movimentos do mercado e

Próxima geração de zonas automatizadas de oferta e demanda. Algoritmo novo e inovador que funciona em qualquer gráfico. Todas as zonas estão sendo criadas dinamicamente de acordo com a ação do preço do mercado.
DOIS TIPOS DE ALERTAS --> 1) QUANDO O PREÇO ATINGE UMA ZONA 2) QUANDO UMA NOVA ZONA É FORMADA
Você não recebe mais um indicador inútil. Você obtém uma estratégia de negociação completa com resultados comprovados.
Novas características:
Alertas quando o preço atinge a zona d
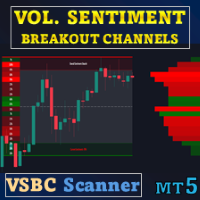
Oferta especial : ALL TOOLS , apenas $35 cada. Novas ferramentas custarão $30 na primeira semana ou para as primeiras 3 compras ! Trading Tools Channel on MQL5 : Junte-se ao meu canal na MQL5 para receber as novidades mais recentes Volume Sentiment Breakout Channels é um indicador que visualiza zonas de rompimento com base no sentimento do volume dentro de canais de preço dinâmicos. Em vez de enxergar o rompimento apenas como um evento técnico de preço, ele foca em como o volume

Crystal Buy Sell Liquidity — Indicador de Liquidez para MT5 Visão Geral
Crystal Buy Sell Liquidity é um indicador profissional para MetaTrader 5 que identifica oportunidades de compra e venda com base em padrões de sweep de liquidez. Ele analisa a estrutura do mercado intradiário, detecta caçadas institucionais de liquidez e fornece sinais claros quando a liquidez de varejo é varrida e o preço reverte. Principais Recursos Detecção automática de sweeps de liquidez em máximas/mínimas Sinais de co
FREE

O indicador ACB Breakout Arrows fornece um sinal de entrada crucial no mercado ao detectar um padrão especial de rompimento. O indicador escaneia constantemente o gráfico em busca de um momento de consolidação em uma direção e fornece o sinal preciso logo antes do movimento principal.
Obtenha o scanner de múltiplos ativos e múltiplos períodos aqui - Scanner para ACB Breakout Arrows MT5
Principais recursos Níveis de Stop Loss e Take Profit são fornecidos pelo indicador. Acompanha um painel Scan

Este é um indicador de seguimento de tendências com base no MACD, fornecendo sinais de compra quando acima dos 200 MA e sinais de venda quando abaixo. O sinal é gerado quando o MACD cruza a linha zero. O indicador também exibe um nível de suporte e resistência que pode ser usado como stop loss. Parâmetros ajustáveis incluem período da MA, EMA rápido do MACD, EMA lento e intervalo de suporte-resistência. Ele plota nos pontos mais baixos e mais altos das velas recentes. Configurações padrão: Inter
FREE

O indicador permite determinar a direção do preço atual e a volatilidade do mercado. Esta versão do Traders Dynamic Index tem o redesenho dos dados históricos eliminados, a velocidade de cálculo do algoritmo otimizada, parâmetros mais externos para ajustes mais precisos e suas funcionalidades ampliadas: somadas a seleção do oscilador inicial e os métodos de suavização das médias . Parâmetros: Mode Osc - seleção de oscilador de estimativa Period Osc - o período de cálculo do oscilador usado Price

Níveis de Suportes e resistências Conheça e teste nosso indicador com a função Multi Time frame onde você pode usar todos os timeframes dentro do gráfico atual
como identificar suportes e resistências automaticamente Este indicador de suporte e resistências cria linhas de suporte e linhas de resistência usando o indicador "Fractals" com base Como criar linhas de suporte O Indicador cria linhas de suporte automaticamente toda vez que o “Fractals” cria um fundo automaticamente ou faz um novo fundo
FREE
This indicator shows the remaining time until the current candle closes on an MT5 chart. It works on selected intraday timeframes and provides a clear, stable display. Features Countdown timer for candle closing on M1, M15, and H1 charts Fixed position, font, and colors for easy readability Informative header and description labels Automatic removal of chart objects when detached Lightweight modular structure for reliable performance How to Use Attach the indicator to an M1, M15 or H1 chart. The
FREE

O indicador "Haven Candle Timer Countdown" é uma ferramenta simples e conveniente para traders que ajuda a controlar os intervalos de tempo de diferentes períodos. Ele exibe a hora do servidor atual e a contagem regressiva até o final das velas em três intervalos de tempo selecionados simultaneamente. Esta ferramenta é especialmente útil para traders que precisam saber exatamente quanto tempo resta até o final da vela atual em vários intervalos de tempo ao mesmo tempo, permitindo que tomem decis
FREE

Olá a todos,
Vou tentar explicar como utilizar gratuitamente a funcionalidade «All in One Screen», que permite visualizar vários pontos de dados simultaneamente num único indicador e em três ecrãs de indicadores diferentes.
Primeiro, para que serve este indicador? ; Níveis de Fibonacci Níveis FVG e OrderBlock Indicador Ichimoku Envelopes, Bandas de Bollinger Canais de Donchian Áreas de Reteste Áreas de Suporte e Resistência Estocástico e, por último, Indicadores ATR.
1. O que há no ecrã
FREE

The Golden PainX and GainX Spike Indicator is a cutting-edge, AI-powered trading tool engineered exclusively for the synthetic indices market. It masterfully combines proprietary spike detection algorithms and real-time price action analysis to generate high-probability, non-repainting trade signals with exceptional accuracy. Important( Use only on PainX 400and GainX 400 (M1 one minute timeframe) Identifies high-probability spikes with non-repainting buy/sell arrows. Automatically sets profit t

Introduction to Double Harmonic Volatility Indicator Use of the Fibonacci analysis for financial trading can nearly go back to 85 years from today since the birth of Elliott Wave Theory by R. N. Elliott. Until now, traders use the Fibonacci analysis to identify the patterns in the price series. Yet, we could not find any one attempted to use Fibonacci analysis for the Volatility. Harmonic Volatility Indicator was the first technical analysis applying the Fibonacci analysis to the financial Volat

Dark Absolute Trend is an Indicator for intraday trading. This Indicator is based on Trend Following strategy but use also candlestick patterns and Volatility. We can enter in good price with this Indicator, in order to follow the main trend on the current instrument. It is advised to use low spread ECN brokers. This Indicator does Not repaint and N ot lag . Recommended timeframes are M5, M15 and H1. Recommended working pairs: All. I nstallation and Update Guide - Troubleshooting

TREND FLOW PRO TREND FLOW PRO é um indicador sem repintura que mostra a direção do mercado. Ele identifica reversões de tendência, bem como entradas iniciais e repetidas dos principais participantes do mercado. As marcações BOS no gráfico representam mudanças reais de tendência e níveis-chave de timeframes superiores. Os dados não repintam e permanecem no gráfico após o fechamento de cada candle. Solicite e receba um guia em PDF detalhado com exemplos de estratégias por meio de mensagens privada
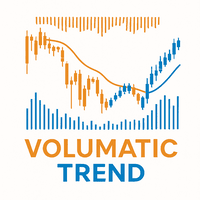
Volumatic Trend is a powerful, trend-following indicator that merges directional analysis with real-time volume behavior. By combining adaptive trend logic and volume overlays, it gives traders a detailed snapshot of market conviction and potential turning points. From instant trend shift detection to volume-weighted candle visuals, this tool brings deeper context to price movement. MT4 Version - https://www.mql5.com/en/market/product/136210/ Join To Learn Market Depth - https://www.mql5.co
FREE

** All Symbols x All Timeframes scan just by pressing scanner button ** *** Contact me to send you instruction and add you in "M W Scanner group" for sharing or seeing experiences with other users. Introduction: Double Top(M) and Double Bottom(W) is a very repetitive common type of price reversal patterns. Double Top resembles M pattern and indicates bearish reversal whereas Double Bottom resembles W pattern and indicates a bullish reversal that they have high win rate. The M W Scanne

The Multi Pairs Forex Indicator is an advanced trading too l that allows traders to track and analyze the performance of multiple currency pairs in real-time on a single chart. It consolidates data from various Forex pairs, providing an at-a-glance overview of market conditions across different currencies and helps you save time. Useful for various trading styles, including scalping, day trading, and swing trading. Whether you're monitoring major pairs like EUR/USD, GBP/USD, or more exoti

Visão Geral Este indicador monitora três tipos de níveis de suporte e resistência derivados de períodos anteriores: Daily (máximo/mínimo de ontem), Weekly (semana anterior) e Monthly (mês anterior). Ele mapeia visualmente níveis de preço-chave onde é mais provável haver reação, sendo útil tanto para identificar possíveis reversões quanto breakouts significativos. Funcionalidades Desenha automaticamente: Máximo/Minimo de ontem (Daily) Máximo/Mínimo da semana anterior (Weekly) Máximo/Mínimo do mês
FREE

Esta VWAP é uma VWAP simples, porém colocamos alertas nela para você saber quando o preço tocar na VWAP simplesou quando o preço cruzar a VWAP. Este indicador é um indicador de VWAP tradicional para o MetaTrader 5 (MT5). Os parâmetros padrão são os da VWAP normal, mas você tem a capacidade de usar novos cálculos e o melhor: Quando o preço tocar ou cruzar a VWAP, e você ficará sabendo por meio de alertas, notificações de celular, e-mail ou eventos sonoros. indicador gratuito de VWAPs ancoradas pa
FREE

O indicador básico Renko é uma ferramenta poderosa para os comerciantes que procuram uma perspetiva de mercado clara e concisa. O nosso indicador não só simplifica a visualização de tendências, como também oferece alertas precisos para inversões, proporcionando uma vantagem estratégica na sua negociação / Versão MT4 gratuita
Características Totalmente personalizável: Adapte o indicador às suas preferências comerciais com opções avançadas de personalização. Desde as cores às definições do
FREE

Indicador Crypto_Forex "Histograma de tendência suavizado" para MT5, sem repintura.
- O indicador de Histograma de Tendência Suavizada é muito mais eficiente do que qualquer cruzamento de Médias Móveis padrão. - Está especialmente focado na deteção de grandes tendências. - O indicador tem 2 cores: Vermelho para tendência de baixa e Verde para tendência de alta (as cores podem ser alteradas nas definições). - Com alertas para telemóvel e PC. - É uma ótima ideia combinar este indicador com quais

Versão MT4 | Indicador Trend Monitor VZ | Indicador Owl Smart Levels | Estratégia Owl Smart Levels | FAQ A teoria das ondas de Elliott é uma interpretação dos processos nos mercados financeiros que se baseia em um modelo visual de ondas em gráficos de preços. O indicador Valable ZigZag exibe a estrutura de onda do mercado, na qual você pode confiar para tomar decisões comerciais. O indicador Valable ZigZag é mais estável e muitas vezes não muda sua direção como o indicador ZigZag clá
FREE

Gold Levels MTF - this is a fine stock technical indicator. The indicator algorithm analyzes the movement of the asset price, displays price levels of support and resistance from all time frames (TF) using the Murray method based on the Gann theory. The indicator indicates overbought and oversold fields, giving an idea of possible reversal points and at the same time giving some idea of the strength of the current trend.
Description of levels: (Extreme Overshoot) - these levels are the ultimate
FREE

Este indicador para MT5 é uma conversão do indicador UT Bot Alerts de @QuantNomad no TradingView.
Ele utiliza o ATR para gerar velas personalizadas no gráfico e fornece sinais de entrada precisos com base nessas velas.
Todos os buffers, incluindo os das velas personalizadas e dos sinais de entrada, estão disponíveis, facilitando a integração em qualquer EA.
Além disso, existem várias estratégias baseadas neste indicador disponíveis na internet, ou você pode me contatar para desenvolver uma e
FREE
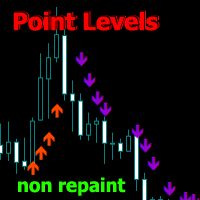
Point Directions MT5 - Um indicador que mostra níveis de ponto de suporte e resistência quando o preço se move. As setas mostram saltos de preço nas direções indicadas.
As setas não são redesenhadas, elas são formadas na vela atual. Funciona em todos os prazos e instrumentos de negociação. Existem vários tipos de alertas.
Possui configurações avançadas para personalizar sinais para qualquer gráfico. Pode ser configurado para negociar com a tendência e correções.
Para desenhar setas, existem 2 t

Descrição:
O indicador "Estrutura de Mercado HH HL LH LL" é uma ferramenta poderosa e ao mesmo tempo simples para analisar a dinâmica de preços nos mercados financeiros. Este indicador ajuda traders e investidores a identificar mudanças nas tendências e identificar pontos importantes nas séries temporais de preços.
Principais componentes do indicador:
HH (Higher High): O topo no qual o preço fecha acima do máximo anterior. HH indica um fortalecimento da tendência de alta. HL (Mínimo Superior

WARNING: This indicator is distributed EXCLUSIVELY on MQL5.com MT4 version: https://www.mql5.com/it/market/product/160363 MT5 version: https://www.mql5.com/it/market/product/160410 ============================================================================================= MAX RIBBON ver 1.00 The indicator that shows you the TREND clearly and unambiguously! ============================================================================================= DESCRIPTION MAX RIBBON is an advanced tre

The indicator draws the time scale on the chart. You can specify the time offset, adjust the size and font to display on the chart ( it is displaying your local time on your chart instead of MT time ). You can also select the desired format for displaying the date and time. You may be interested in my other product , which contains a more advanced version of the Time Scale .
You can also find my other products here Parameters Hours (time shift) — time shift (hours); Minutes (time shift) — time
FREE

Matreshka self-testing and self-optimizing indicator: 1. Is an interpretation of the Elliott Wave Analysis Theory. 2. Based on the principle of the indicator type ZigZag, and the waves are based on the principle of interpretation of the theory of DeMark. 3. Filters waves in length and height. 4. Draws up to six levels of ZigZag at the same time, tracking waves of different orders. 5. Marks Pulsed and Recoil Waves. 6. Draws arrows to open positions 7. Draws three channels. 8. Notes support and re
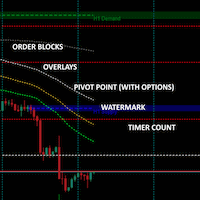
Multiple indicators in one: Order Blocks with optional higher timeframe overlay Watermark Count down timer Pivot points No fancy algorithms but tends to be quite accurate for some symbols to predict bounce, return-to and break-through channels. It is a retrospective indicator (as they all are) and there to help you with better guesses as to where a movement is going towards. The last two order blocks are shaded and extends past the current time. Prior order blocks (within your selected timeframe
FREE

Integrated Dashboard Scanner – Version 4.00 The Ultimate Market Command Center just got smarter. Now with Programmable Logic Presets. The Integrated Dashboard Scanner (IDS) monitors multiple symbols and timeframes from a single, DPI-aware panel. Version 4.00 introduces a revolutionary Preset Editor , allowing you to combine signals from different modules into complex, custom strategies without writing a single line of code. NEW IN VERSION 4.00: Filter Presets & Logic Editor Stop scanning for

This indicator automatically identifies market structure and plots Fibonacci retracement levels in real time.
It detects key swing highs and lows to mark structural points such as higher highs, higher lows, lower highs, and lower lows, helping traders quickly understand trend direction and structural shifts.
Based on the detected structure, the indicator dynamically draws Fibonacci levels, allowing traders to easily spot potential retracement, pullback, and entry zones without manual drawing.
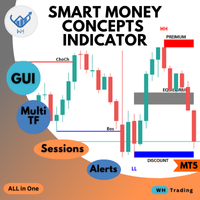
Welcome to the ultimate Smart Money Concepts indicator ,, this indicator is All-in-One package the only thing you need to empower
all the Smart Money Concepts in one place with interactive advanced gui panel with all the features and customization you need. MT4 Version : WH SMC Indicator MT4 *This Price For Limited Number of Copies.
Features: Main Section: User-Friendly Panel (GUI): Designed for traders of all experience levels, the indicator integrates seamlessly into your MT5 platform

Spike Phantom is a specialized indicator for PainX and GainX synthetic indices that generates trading signals with automatic alert notifications.
Features The indicator analyzes market conditions using proprietary algorithms and displays buy/sell arrows directly on the chart. It works specifically with PainX and GainX indices on M5 timeframe. Signal generation combines multiple technical analysis methods to identify potential trading opportunities. The system provides two TP levels and SL cal
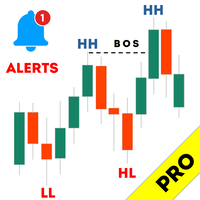
Haven Market Structure PRO - Seu Analista de Mercado Profissional Apresentando Haven Market Structure PRO – este não é apenas um indicador, mas um sistema completo para automatizar a análise do movimento de preços, baseado nos conceitos-chave de Price Action e Smart Money. Esta versão PRO foi criada para traders que desejam ter o máximo controle sobre o gráfico и ver uma imagem completa do mercado. Outros produtos -> AQUI Entender a estrutura do mercado é a base para um trading lucrativo. O

RSI divergence indicator finds divergences between price chart and RSI indicator and informs you with alerts (popup, mobile notification or email). Its main use is to find trend reversals in the chart. Always use the divergence indicators with other technical assets like support resistance zones, candlestick patterns and price action to have a higher possibility to find trend reversals. Three confirmation type for RSI divergences: RSI line cross 50 level Price returns to previous H/L C
FREE
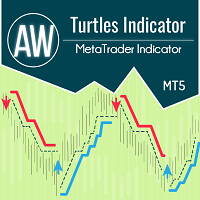
O indicador funciona de acordo com o sistema Turtle e classicamente assume um intervalo de tempo de 20 e 55 velas. Uma tendência é monitorada durante um determinado intervalo de tempo. A entrada é feita no momento da quebra do nível de suporte ou resistência. O sinal de saída é um rompimento de preço na direção oposta da tendência do mesmo intervalo de tempo. Vantagens:
Instrumentos: pares de moedas, ações, commodities, índices, criptomoedas Prazo: Classicamente D1, também adequado para trabal
FREE
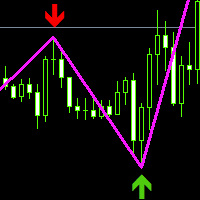
Este índice é Baseado no Desenvolvimento secundário de ziguezague, adicionando indicação de seta de Ponta Alta e baixa, espessando a Linha e mudando a Cor.Pode ser UMA boa exibição DOS sinais de admissão atuais, Longo ou curto.Pode ser combinado com outros indicadores para determinar o Ponto de negociação, que TEM um Grande valor de referência.Comparado com o índice geral de tendência ou padrão do lote de oscilação, a determinação Precisa é Mais elevada Da Perspectiva Da pesquisa e julgamento d
FREE

O indicador Pips Chaser foi desenvolvido para complementar o seu comércio manual. Este indicador pode ser utilizado tanto para o comércio de escalpes curtos como para o comércio de baloiços longos // Versão MT4
Características Sem indicador de repintura Este indicador não altera os seus valores quando chegam novos dados Pares comerciais Qualquer par de moedas Período de tempo H1 é preferível, mas pode adaptá-lo a qualquer período de tempo Tempo de negociação 24 horas por dia Buffers Buy B
FREE

Indicador Market Structure ICT 1. Estrutura de Mercado Automatizada A maior vantagem é reduzir erros de interpretação subjetiva. Identificação Precisa de Tendência: Identifica automaticamente BOS (Quebra de Estrutura) para continuação e CHoCH (Mudança de Caráter) para reversão. Classificação de Swing: O usuário pode escolher o tipo de estrutura (Curto, Médio ou Longo prazo), ideal para Scalpers e Swing Traders. 2. Painel Profissional (Dashboard) Não é necessário trocar de tela para verificar out

Description (For MQL5 Website/Market)
Title: Subho SMC Concept & Trend Signals
Subtitle: All-in-one Smart Money Concepts (SMC) Dashboard with High Accuracy SUBHO Signals.
Description: The Subho SMC Concept & Trend Signals is a comprehensive professional trading system designed for MetaTrader 5. It automates advanced Smart Money Concepts (SMC) and combines them with the proprietary "SUBHO Signal System" to find high-probability trade setups. This indicator helps you identify the true market d
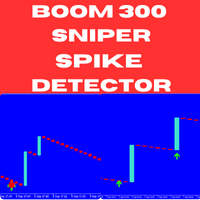
Introducing the Boom 300 Sniper Spike Detector – a powerful, non-repainting indicator specifically engineered to help you master spike trading in the Boom 300 market. Whether you're a seasoned trader or new to the game, this tool offers precise and timely signals, allowing you to catch spikes with confidence and improve your overall trading performance. Key Features: Non-Repainting Signals : Ensures consistent and accurate signals that do not repaint, providing you with reliable data to make con

RABBY: The "Momentum Dislocation" Scanner for XAUUSD (Also suitable for Forex and Indices)
Stop Getting Trapped by M1/M5 Noise. Start Trading the Dislocation.
The first indicator that visualizes "Price Detachment" for high-precision entries.
You don't need another arrow. You need to see the Structure of the move.
If you trade Gold (XAUUSD) on the 1-minute or 5-minute timeframe, you know the feeling: An indicator prints a "Buy" signal. You enter. Two minutes later, the candle wicks down

Dominion Levels: The "Market Structure" Architect
Perfect for XAUUSD (Gold)
The definitive tool for identifying "Hard" Support and Resistance levels that actually hold. Most traders draw support and resistance lines based on feelings or vague zones. The result? Messy charts, subjective decisions, and getting stopped out by "noise." Dominion Levels solves this by removing the subjectivity. It is not just another line drawer; it is a Stepped Structure Engine. It identifies significant pric

FXLAND Smart Reversal Indicator (MT5)
FXLAND Smart Reversal Indicator is a professional technical analysis tool designed to help traders identify potential price reversal zones and key market turning points with clarity and precision.
The best reversal indicator and price return by choosing only one ceiling or floor in each time frame
A masterpiece of combining mathematics and Gann, fractal matrix, Fibonacci, movement angle and time. Completely intelligent
Key Features
Detects potenti

Are you ready to dominate the volatile world of synthetic indices trading? The Golden Boom and Crash Spike Indicator is the revolutionary MT5 indicator designed exclusively for high-stakes traders targeting explosive spikes in Boom 300 and Crash 300 . Optimized for the M1 (one-minute) timeframe , this advanced tool leverages proprietary AI-driven spike detection and precise price action analysis to generate non-repainting buy/sell arrows with unparalleled accuracy. Whether you're s

The Best SMC for All indicator is designed for MetaTrader 5 (MT5) to implement Smart Money Concepts (SMC) for analyzing market structure and identifying key trading zones based on price action. It visualizes supply and demand zones, Break of Structure (BOS) levels, Points of Interest (POI), and optional ZigZag patterns to assist traders in making informed decisions. Below is a detailed description of its features:
---
Features
1. Swing High/Low Detection:
- Functionality: Automatically iden
FREE

The indicator very accurately determines the levels of the possible end of the trend and profit fixing. The method of determining levels is based on the ideas of W.D.Gann, using an algorithm developed by his follower Kirill Borovsky. Extremely high reliability of reaching levels (according to K. Borovsky - 80-90%) Indispensable for any trading strategy – every trader needs to determine the exit point from the market! Precisely determines targets on any timeframes and any instruments (forex, met

[ Meu canal ] , [ Meus produtos ]
Este indicador mostra os pontos onde a tendência da vela muda devido a uma pressão instantânea, enquanto a tendência geral se move para cima ou para baixo. A seta exibida pelo indicador é desenhada se a vela anterior atender a determinados critérios. Ao criar sua estratégia, você pode interpretar 3-4 setas consecutivas como um sinal potencial de rompimento. Por exemplo, ao ver a quarta seta, você pode considerar abrir uma operação. Isso fornece uma ferramenta
FREE
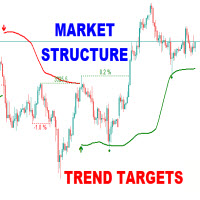
The Market Structure Trend Targets is a powerful trading indicator designed to give traders a clear, structured, and data-driven view of market momentum, breakouts, and key price reaction zones. Built on the principles of smart market structure analysis , it helps identify not only trend direction, but also precise breakout levels , trend exhaustion , and potential reversal zones — all with visual clarity and trader-friendly metrics. Key Features Breakout Points with Numbered Markers Track signi

Short Description:
An advanced reversal trading system that detects market turning points using Liquidity Momentum combined with Price Action confirmation. Overview:
The Accurate Liquidity Pivot Signals indicator is designed to identify high-probability Buy and Sell setups. Instead of relying on lagging moving averages, this tool analyzes the internal Liquidity Flow of the market to find hidden support (Demand) and resistance (Supply) zones. It uses a unique Pivot detection algorit

Auto Fibonacci Retracement Indicator — Flexible and Reliable This isn’t just another Auto Fibonacci Retracement indicator. It’s one of the most flexible and dependable tools available . If you find it useful, please consider leaving a review or comment — your feedback means a lot! Check out my other helpful tools below: Smart Alert Manager - Set up advanced alerts and send them to Mobile, Telegram, Discord, Webhook...
Timeframes Trend Scanner - Scan the trend of assets in difference timefr
FREE

Volume Weighted Average Price (VWAP) The volume weighted average price (VWAP) is a trading benchmark used by traders that gives the average price a security has traded at throughout the day, based on both volume and price. It is important because it provides traders with insight into both the trend and value of a security. This indicator VWAP V2 is free and is the manual version of the extended Easy VWAP indicator (30 Euro), where the date and time properties are automatically entered. With
FREE

The "Power of Three" (PO3) is a concept developed by the Inner Circle Trader (ICT) to illustrate a three-stage approach used by smart money in the markets: Accumulation, Manipulation, and Distribution . ICT traders view this as a foundational pattern that can explain the formation of any candle on a price chart. In simple terms, this concept is effective for any time frame, as long as there's a defined start, highest point, lowest point, and end. MT4 - https://www.mql5.com/en/market/product/1
FREE

Versão Expert Advisor (EA)
Se você prefere negociação automatizada em vez de sinais manuais, pode encontrar a versão deste indicador como Expert Advisor aqui:
https://www.mql5.com/en/market/product/148222
Este indicador calcula os momentos de reentrada do preço depois que uma vela ultrapassa externamente as Bandas de Bollinger , combinando esse sinal com uma confirmação via RSI para reduzir falsos positivos.
Um sinal de Buy ReEntry é detectado quando o preço havia saído abaixo da banda inferi
FREE

A estratégia de negociação Moving Average Convergence Divergence (MACD) é uma ferramenta popular de análise técnica usada para identificar mudanças no impulso e direção da tendência. O MACD é calculado subtraindo a média móvel exponencial (EMA) de 26 períodos da EMA de 12 períodos. Uma EMA de 9 períodos, chamada "linha de sinal", é então plotada em cima do MACD para atuar como um gatilho para sinais de compra e venda. O MACD é considerado em território de alta quando a linha MACD está acima da l
FREE

Candle Range Theory - CRT
Mark Candle Range Theory - CRT bars on the chart.
Options:
choose between 2 bar CRT or CRT that include inside bars Show higher time frame CRT on lower time frame chart show current time frame CRT on chart with higher time frame CRT Alert when new CRT has formed Show / Hide Labels
Button Menu to select Options
for more information on using Candle Range Theory - CRT look on X for @Romeotpt
@SpeculatorFL
Manual
Apresentamos-lhe um indicador revolucionário que muda as regras do jogo no mundo da negociação de tendências. O indicador foi projetado para repensar o desempenho e elevar sua experiência de negociação a uma altura sem precedentes. Nosso indicador possui uma combinação única de recursos avançados que o diferenciam da concorrência. A tecnologia de ponta "Real Pricing Factors" oferece estabilidade incomparável, mesmo nas condições de mercado mais desafiadoras e voláteis. Diga adeus a padrões instá
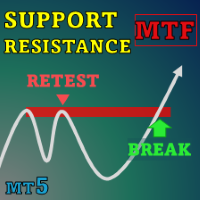
Special offer : ALL TOOLS , just $35 each! New tools will be $30 for the first week or the first 3 purchases ! Trading Tools Channel on MQL5 : Join my MQL5 channel to update the latest news from me No cenário em constante mudança do comércio financeiro, identificar e analisar com precisão os níveis de suporte e resistência é essencial para tomar decisões de investimento informadas. SnR Retest and Break Multi-Timeframe é um indicador de suporte e resistência projetado para aprimorar
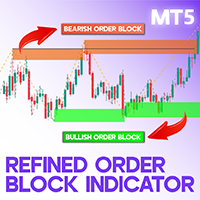
Refined Order Block Indicator for MT5 Designed around ICT and Smart Money strategies, the Refined Order Block (OBR) indicator is an essential tool for traders on the MetaTrader 5 (MT5) platform. It identifies and highlights key price levels by marking bullish order blocks in green and bearish order blocks in brown. These levels represent potential price reversal zones , often influenced by large institutional and bank orders. When the price reaches these critical areas, it may experience signifi
Indicador de tempo até o final da vela. Mostra o tempo até o final da vela, bem como o tempo do servidor. O texto pode exibir a tendência ou direção da vela, as notificações sonoras são incorporadas Peculiaridades:
Exibe o tempo até o final da vela atual, bem como outros prazos que podem ser ajustados ou desativados, se necessário AW Candle Time pode selecionar a direção da vela atual ou tendência com o indicador AW Super Trend A estratégia de tendência é destacada na cor selecionada Notificação
FREE

O indicador "Haven Key Levels PDH PDL" ajuda os traders a visualizar os níveis-chave no gráfico. Ele marca automaticamente os seguintes níveis: DO (Daily Open) — o nível de abertura diária. NYM (New York Midnight) — o nível da meia-noite de Nova Iorque. PDH (Previous Day High) — o máximo do dia anterior. PDL (Previous Day Low) — o mínimo do dia anterior. WO (Weekly Open) — o nível de abertura semanal. MO (Monthly Open) — o nível de abertura mensal. PWH (Previous Week High) — o
FREE
** All Symbols x All Time frames scan just by pressing scanner button ** Discount: The price is $50$, But now it is just $35, Limited time offer is active.
*** Contact me to send you instruction and add you in "Swing scanner group" for sharing or seeing experiences with other users. Swing EA: https://www.mql5.com/en/market/product/124747 Introduction: Swing Scanner is the indicator designed to detect swings in the direction of the trend and possible reversal swings. The indicator st
Você sabe por que o mercado MetaTrader é o melhor lugar para vender as estratégias de negociação e indicadores técnicos? Não há necessidade de propaganda ou software de proteção, muito menos problemas de pagamentos. Tudo é providenciado no mercado MetaTrader.
Você está perdendo oportunidades de negociação:
- Aplicativos de negociação gratuitos
- 8 000+ sinais para cópia
- Notícias econômicas para análise dos mercados financeiros
Registro
Login
Se você não tem uma conta, por favor registre-se
Para login e uso do site MQL5.com, você deve ativar o uso de cookies.
Ative esta opção no seu navegador, caso contrário você não poderá fazer login.