Technische Indikatoren für den MetaTrader 5 - 3

Markt-Volumenprofil-Indikator + smarter Oszillator. Funktioniert auf fast allen Instrumenten — Währungspaare, Aktien, Futures, Kryptowährungen, sowohl mit realem Volumen als auch mit Tick-Volumen. Es ist möglich, die automatische Definition des Bereichs für die Profilerstellung festzulegen (z. B. für eine Woche oder einen Monat usw.) oder den Bereich manuell durch Verschieben der Grenzen (zwei vertikale Linien: rot und blau) einzustellen. Die Anzeige erfolgt in Form eines Histogramms. Die Breite

Auto Order Block mit Strukturbruch basierend auf ICT und Smart Money Concepts (SMC )
Futures Strukturbruch ( BoS )
Auftragsblock ( OB )
Höherer Zeitrahmen Orderblock / Point of Interest ( POI ) auf dem aktuellen Chart angezeigt
Marktwertlücke ( FVG ) / Ungleichgewicht - MTF ( Multi Time Frame )
HH/LL/HL/LH - MTF ( Multi Time Frame )
Choch MTF ( Mehrzeitrahmen )
Volumen Ungleichgewicht , MTF vIMB
Gap's Potenz von 3
Gleiche Hochs/Tiefs , MTF EQH/EQL
Liquiditä t
Höchst-/Tiefstkurs des akt

Automatisierte Angebots- und Nachfragezonen der nächsten Generation. Neuer und innovativer Algorithmus, der bei jedem Diagramm funktioniert. Alle Zonen werden dynamisch entsprechend der Preisbewegung des Marktes erstellt.
ZWEI ARTEN VON WARNUNGEN --> 1) WENN DER PREIS EINE ZONE ERREICHT 2) WENN EINE NEUE ZONE BILDET WIRD
Sie erhalten keinen weiteren nutzlosen Indikator. Sie erhalten eine vollständige Handelsstrategie mit nachgewiesenen Ergebnissen.
Neue Eigenschaften:
Warnungen, w
Hallo zusammen,
Ich werde versuchen, Ihnen zu erklären, wie Sie die Funktion „All in One Screen” kostenlos nutzen können, mit der Sie mehrere Datenpunkte gleichzeitig auf einem einzigen Indikator und drei verschiedenen Indikatorbildschirmen anzeigen können.
Zunächst einmal: Wofür wird dieser Indikator verwendet? ; Fibonacci-Niveaus FVG- und OrderBlock-Niveaus Ichimoku-Indikator Umhüllungen, Bollinger-Bänder Donchian-Kanäle Retest-Bereiche Unterstützungs- und Widerstandsbereiche Stochastik un
FREE
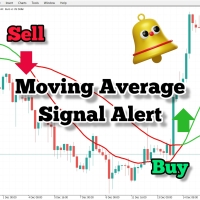
Wenn Sie gleitende Durchschnitte in Ihrer Handelsstrategie verwenden, kann dieser Indikator sehr nützlich sein. Er bietet Alarme beim Überschreiten von zwei gleitenden Durchschnitten, sendet hörbare Alarme, zeigt Benachrichtigungen auf Ihrer Handelsplattform an und sendet auch eine E-Mail über das Ereignis. Er wird mit leicht anpassbaren Einstellungen geliefert, um sich Ihrem eigenen Handelsstil und Ihrer Strategie anzupassen. Einstellbare Parameter: Schnelle MA Langsame MA E-Mail senden Hörba
FREE

Klassischer MACD
Er hat eine MACD-Linie , eine Signallinie und ein Histogramm . Das Histogramm hat 4 Farben und zeigt die Bewegungsrichtung so einfach wie möglich an. Der Glättungsfaktor in der Eingabe hilft, verrauschte Signale zu eliminieren. Neben verschiedenen Preistypen (hlc, hlcc, ohlc, ...) gibt es die Option, Volumendaten als Quelle für die MACD-Berechnungen zu verwenden (was besser ist, wenn das reale Volumen und nicht das unzuverlässige Tickvolumen verwendet wird). Während der ursprüng
FREE
KLICKEN SIE HIER FÜR ALLE MEINE KOSTENLOSEN PRODUKTE
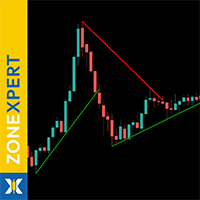
ZoneXpert ist dein visueller Marktanalyst für MetaTrader 5 – entwickelt, um Support- und Resistance-Zonen automatisch zu erkennen , farblich zu markieren und in Echtzeit zu aktualisieren. Der Indikator analysiert Preisstrukturen, Hochs, Tiefs und Volumenbereiche, um dir präzise zu zeigen, wo der Markt reagiert – und wo er durchbricht. Mit ZoneXpert erkennst du auf einen Blick, wo sich Marktkräfte sammeln – und handelst dort, wo echte Entsch
FREE
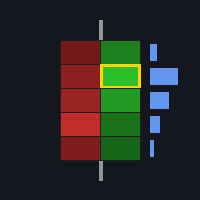
FOOTPRINTORDERFLOW: The Authoritative Guide ( Dieser Indikator ist auch mit Wirtschaftsanbietern kompatibel, die keine DOM-Daten und BID/ASK-Daten anbieten, Er unterstützt auch verschiedene Devisentransaktionen, DEMO Version,modleling muss " Every tick based on real ticks" wählen ) Wichtiger Hinweis: Bevor Sie eine Bestellung aufgeben, kontaktieren Sie mich bitte zuerst, und ich werde Sie mit professionellen Antworten und Dienstleistungen versorgen
1. Übersicht FOOTPRINTORDERFLOW ist ein fortsc

Indikator für Unterstützungs- und Widerstandszonen MT5 Dieser Indikator kann Hochs und Tiefs automatisch erkennen. Dieser Unterstützungs- und Widerstandsindikator erstellt Unterstützungslinien und Widerstandslinien basierend auf Hochs und Tiefs. wie man Unterstützungs- und Widerstandslinien erstellt. Dies ist ein Indikator, um automatische Unterstützungs- und Widerstandslinien zu erstellen. wie man das Unterstützungsniveau mit dem Indikator findet. Dieser Indikator findet automatisch Hochs und T
FREE

Der Indikator "Haven Candle Timer Countdown" ist ein einfaches und praktisches Werkzeug für Trader, das Ihnen hilft, die Zeitrahmen verschiedener Zeitintervalle im Blick zu behalten. Er zeigt die aktuelle Serverzeit und den Countdown bis zum Ende der Kerzen auf drei ausgewählten Zeitrahmen gleichzeitig an. Dieses Tool ist besonders nützlich für Trader, die genau wissen müssen, wie viel Zeit bis zum Ende der aktuellen Kerze in mehreren Zeitrahmen gleichzeitig bleibt, um rechtzeitig Entscheidungen
FREE

Dies ist ein Trendfolgeindikator basierend auf MACD, der Kaufsignale liefert, wenn über dem 200 MA und Verkaufssignale, wenn darunter. Das Signal wird generiert, wenn der MACD die Nulllinie kreuzt. Der Indikator zeigt auch ein Support- und Resistance-Level an, das als Stop-Loss verwendet werden kann. Einstellbare Parameter umfassen MA-Periode, MACD Fast EMA, Slow EMA und das Support-Resistance-Intervall. Es wird auf den niedrigsten und höchsten Punkten der aktuellen Kerzen dargestellt. Standardm
FREE
Spike Trap ist ein einfaches, aber leistungsfähiges Tool, das starke Marktspitzen erkennt und auf Kursrückschläge wartet, um Einstiegs- und Ausstiegsbereiche mit hoher Wahrscheinlichkeit zu markieren. Durch die Kombination von Volatilitätserkennung und intelligenter Retracement-Logik hilft es Händlern, von schnellen Kursbewegungen mit Präzision und reduziertem Risiko zu profitieren. Ideal für Scalping oder kurzfristigen Handel in volatilen Märkten. Spike Trap kann für den Handel mit synthetische

Der Golden PainX und GainX Spike Indicator ist ein hochmodernes, KI-gestütztes Handelsinstrument, das ausschließlich für den Markt der synthetischen Indizes entwickelt wurde. Er kombiniert auf meisterhafte Weise firmeneigene Algorithmen zur Spike-Erkennung mit der Analyse von Preisbewegungen in Echtzeit, um Handelssignale mit hoher Wahrscheinlichkeit und außergewöhnlicher Genauigkeit zu generieren, die sich nicht wiederholen. Wichtig( Nur für PainX 400 und GainX 400 verwenden (M1, einminütiger Z

Der Basic Renko-Indikator ist ein leistungsstarkes Werkzeug für Händler, die eine klare und präzise Marktperspektive suchen. Unser Indikator vereinfacht nicht nur die Visualisierung von Trends, sondern bietet auch genaue Warnungen für Umkehrungen, die Ihnen einen strategischen Vorteil bei Ihrem Handel verschaffen / Kostenlose MT4-Version
Merkmale Vollständig anpassbar: Passen Sie den Indikator mit fortschrittlichen Anpassungsoptionen an Ihre Geschäftsvorlieben an. Von den Farben bis hin z
FREE
Market Structure ICT Indikator 1. Automatisierte Marktstruktur Der größte Vorteil ist die Reduzierung von Fehlern durch subjektive Interpretation. Präzise Trenderkennung: Identifiziert automatisch BOS (Break of Structure) für Trendfortsetzungen und CHoCH (Change of Character) für Trendumkehrungen. Swing-Klassifizierung: Wählbar zwischen kurz-, mittel- und langfristigen Strukturen. Geeignet für Scalper und Swing-Trader. 2. Professionelles Dashboard Kein Bildschirmwechsel nötig, um andere Zeitrahm
Volumatic Trend ist ein leistungsfähiger, trendfolgender Indikator, der Richtungsanalysen mit Echtzeit-Volumenverhalten verbindet. Durch die Kombination von adaptiver Trendlogik und Volumen-Overlays bietet er Händlern eine detaillierte Momentaufnahme der Marktüberzeugung und potenzieller Wendepunkte. Von der sofortigen Erkennung von Trendwechseln bis hin zu volumengewichteten Kerzendarstellungen bietet dieses Tool einen tieferen Kontext für die Preisbewegung. MT4-Version - https://www.mql5.com/e
FREE

# Wave Trend Oscillator (WTO) Benutzerhandbuch
## Überblick Der Wave Trend Oscillator ist ein leistungsfähiges technisches Analysewerkzeug, das zur Analyse der Preisdynamik und der Trendrichtung verwendet wird. Er visualisiert die Marktbedingungen mit zwei Hauptlinien (WT1 und WT2) und einem Histogramm.
## Bestandteile 1. **WT1 (Grüne Linie)**: Haupttrendindikator 2. **WT2 (Rote Linie)**: Signallinie 3. **Histogramm (Blau)**: Zeigt den Unterschied zwischen WT1 und WT2 4. **Pfeile**: Markieren

Shadow AI Commander Ultimate - Taktische Handels-Suite
Konzept "Eliminieren Sie Emotionen. Ausführen mit Präzision. Chirurgische Gewinnmaximierung."
Der Shadow AI Commander ist nicht nur ein Indikator, er ist Ihr taktischer Partner auf dem Schlachtfeld. Er agiert als Kommandant, identifiziert Einstiegspunkte mit hoher Wahrscheinlichkeit und, was noch wichtiger ist, definiert strikt "Wartezonen" (Iron Wall Logic), um Ihr Kapital vor emotionalem Handel zu schützen.
Kernphilosophie ・Disziplin:

Einführung in den Double Harmonic Volatility Indicator Die Verwendung der Fibonacci-Analyse für den Finanzhandel reicht fast 85 Jahre zurück, seit der Geburt der Elliott-Wellen-Theorie von R. N. Elliott. Bis heute verwenden Händler die Fibonacci-Analyse, um die Muster in den Preisreihen zu erkennen. Wir konnten jedoch niemanden finden, der versucht hat, die Fibonacci-Analyse für die Volatilität zu verwenden. Der Harmonic Volatility Indicator war die erste technische Analyse, die die Fibonacci-An
Erhöhen Sie Ihre Trading-Strategie mit dem Nadaraya Watson Envelope Alert MT5 , einem innovativen Indikator, der nicht-parametrische Kernel-Regression nutzt, um eine glatte, adaptive Trendanalyse zu liefern. Inspiriert vom Nadaraya-Watson-Schätzer, wendet dieses Tool Gaussian Kernel-Glättung auf Preisdaten an, um dynamische Envelopes zu erzeugen, die sich an die Markvolatilität anpassen, ohne die übermäßige Verzögerung traditioneller gleitender Durchschnitte. Weit anerkannt auf Plattformen wie

Der ACB Breakout Arrows Indikator liefert ein entscheidendes Einstiegssignal am Markt, indem er ein spezielles Ausbruchsmuster erkennt. Der Indikator scannt kontinuierlich den Chart nach einer stabilen Bewegung in eine Richtung und liefert ein präzises Einstiegssignal kurz vor der Hauptbewegung.
Hier den Multi-Symbol- und Multi-Zeitrahmen-Scanner erhalten - Scanner für ACB Breakout Arrows MT5
Hauptfunktionen Stop-Loss- und Take-Profit-Level werden vom Indikator bereitgestellt. Enthält ein MTF-

Crypto_Forex Indikator „CCI mit dynamischen Überverkauft-/Überkauft-Zonen“ für MT5, ohne Repainting.
– Der Commodity Channel Index (CCI) eignet sich hervorragend für Momentum-Trading in Trendrichtung. – Er eignet sich hervorragend für Verkaufspositionen aus dynamischen Überkauft-Zonen und Kaufpositionen aus dynamischen Überverkauft-Zonen in Richtung des Haupttrends. – Dieser Indikator lässt sich auch hervorragend mit Price-Action-Positionen kombinieren. – Dynamische Überkauft-Zone – oberhalb d

Ulimate MTF Support & Resistance - 5-Sterne-Bestseller Neujahrsangebot - sparen Sie $20 (Normalpreis $79) Ob Anfänger oder Profi, unser meistverkaufter Multi-Timeframe Pivot Prof wird Ihren Handel verbessern und Ihnen großartige Handelsmöglichkeiten mit den Unterstützungs- und Widerstandsniveaus bieten, die auch Profis nutzen. Der Pivot-Handel ist eine einfache und effektive Methode für den Einstieg in den Markt und den Ausstieg aus dem Markt auf Schlüsselebenen und wird von Profis seit Jahrzehn
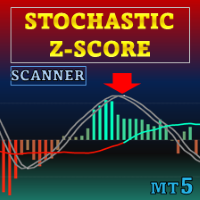
Sonderangebot : ALL TOOLS , nur $35 pro Stück! Neue Tools kosten $30 während der ersten Woche oder für die ersten 3 Käufe ! „Trading Tools“-Kanal auf MQL5 : Tritt meinem MQL5-Kanal bei, um die neuesten Updates zu erhalten Stochastic Z-Score ist ein Momentum-Oszillator, der den Preis mit einem Z-Wert normalisiert, das Signal per stochastischer Logik begrenzt und mit HMA glättet; ALMA liefert längerfristigen Kontext. Er bietet ein klares, reaktionsschnelles Signal sowie optional ein
Überblick Dieser Indikator überwacht drei Arten von Unterstützungs- und Widerstandsniveaus, die aus vorherigen Perioden abgeleitet sind: Daily (Hoch/Tief von gestern), Weekly (vorherige Woche) und Monthly (vorheriger Monat). Er bildet visuell Schlüsselpreisbereiche ab, in denen mit Reaktionen zu rechnen ist, und ist sowohl zur Identifikation möglicher Umkehrungen als auch signifikanter Breakouts nützlich. Funktionen Zeichnet automatisch: Hoch/Tief von gestern (Daily) Hoch/Tief der vorherigen Woc
FREE

Dieser VWAP ist ein einfacher VWAP, aber wir haben Warnungen hinzugefügt, damit Sie wissen, wann der Preis den einfachen VWAP berührt oder den VWAP kreuzt. Dieser Indikator ist ein traditioneller VWAP-Indikator für den MetaTrader 5 (MT5). Die Standardparameter sind die des normalen VWAP, aber Sie haben die Möglichkeit, neue Berechnungen zu verwenden und das Beste daran: Wenn der Preis den VWAP berührt oder kreuzt, werden Sie durch Warnungen, Benachrichtigungen auf dem Handy, E-Mail oder Tonsigna
FREE

Dieser MT5-Indikator ist eine Konvertierung des UT Bot Alerts-Indikators von @QuantNomad auf TradingView.
Er nutzt den ATR zur Erstellung benutzerdefinierter Kerzen auf dem Chart und liefert präzise Einstiegssignale basierend auf diesen Kerzen.
Alle Puffer, einschließlich der benutzerdefinierten Kerzen und Einstiegssignale, sind verfügbar, sodass der Indikator problemlos in jedes EA integriert werden kann.
Darüber hinaus gibt es verschiedene Strategien zu diesem Indikator im Internet, oder S
FREE

MT4-Version | Trend Monitor VZ-Indikator | Owl Smart Levels-Indikator | Owl Smart Levels-Strategie | FAQ Die Elliott-Wellentheorie ist eine Interpretation von Prozessen an den Finanzmärkten, die auf einem visuellen Wellenmodell in den Preisdiagrammen beruht. Der Valable ZigZag Indikator zeigt die Wellenstruktur des Marktes an, auf die Sie sich verlassen können, um Handelsentscheidungen zu treffen. Der Valable ZigZag-Indikator ist stabiler und ändert seine Richtung nicht oft wie der kl
FREE

ICT, SMC, SMART MONEY CONCEPTS, SMART MONEY, Smart Money Concept, Support and Resistance, Trend Analysis, Price Action, Market Structure, Order Blocks, BOS/CHoCH, Breaker Blocks , Momentum Shift, Supply&Demand Zone/Order Blocks , Strong Imbalance, HH/LL/HL/LH, Fair Value Gap, FVG, Premium & Discount Zones, Fibonacci Retracement, OTE, Buy Side Liquidity, Sell Side Liquidity, BSL/SSL Taken, Equal Highs & Lows, MTF Dashboard, Multiple Time Frame, BigBar, HTF OB, HTF Market Structure

Beschreibung:
Der Indikator „Marktstruktur HH HL LH LL“ ist ein leistungsstarkes und zugleich einfaches Instrument zur Analyse der Preisdynamik auf den Finanzmärkten. Dieser Indikator hilft Händlern und Investoren, Trendänderungen zu erkennen und wichtige Punkte in Preiszeitreihen zu identifizieren.
Hauptbestandteile des Indikators:
HH (Higher High): Der Höchststand, an dem der Preis über dem vorherigen Höchststand schließt. HH deutet auf einen sich verstärkenden Aufwärtstrend hin. HL (Highe

Gold Levels MTF - Dies ist ein ausgezeichneter technischer Indikator für Aktien. Der Algorithmus des Indikators analysiert die Preisbewegung des Vermögenswerts und zeigt die Preisniveaus der Unterstützung und des Widerstands in allen Zeitrahmen (TF) an, indem er die auf der Gann-Theorie basierende Murray-Methode verwendet. Der Indikator zeigt überkaufte und überverkaufte Bereiche an und gibt so einen Hinweis auf mögliche Umkehrpunkte und gleichzeitig einen Eindruck von der Stärke des aktuellen T
FREE

WARNUNG: Dieser Indikator wird AUSSCHLIESSLICH auf MQL5.com vertrieben MT4-Version: https: //www.mql5.com/it/market/product/160363 MT5-Version: https: //www.mql5.com/it/market/product/160410 ============================================================================================= MAX RIBBON ver 1.00 Der Indikator, der Ihnen den TREND klar und deutlich anzeigt! ============================================================================================= BESCHREIBUNG MAX RIBBON ist ein fortsch

Der Indikator zeichnet die Zeitskala auf dem Chart. Sie können die Zeitverschiebung festlegen, die Größe und die Schriftart für die Anzeige im Chart einstellen (es wird Ihre lokale Zeit im Chart anstelle der MT-Zeit angezeigt ). Sie können auch das gewünschte Format für die Anzeige von Datum und Zeit auswählen. Vielleicht interessieren Sie sich für mein anderes Produkt , das eine erweiterte Version der Zeitskala enthält.
Meine anderen Produkte finden Sie auch hier Parameter Stunden (Zeitverschi
FREE
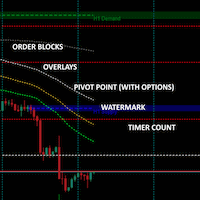
Mehrere Indikatoren in einem: Orderblöcke mit optionalem Overlay für einen höheren Zeitrahmen Wasserzeichen Countdown-Timer Pivot-Punkte Keine ausgefallenen Algorithmen, aber bei einigen Symbolen recht genaue Vorhersage von Bounce-, Return-to und Break-through-Channels. Es handelt sich um einen retrospektiven Indikator (wie alle anderen auch), der Ihnen helfen soll, besser abzuschätzen, wohin eine Bewegung geht. Die letzten beiden Orderblöcke sind schattiert und reichen über den aktuellen Zeitpu
FREE

Haven Bands Reversion – Ein professioneller Indikator für den Mean-Reversion-Handel Wir stellen vor: Haven Bands Reversion – ein leistungsstarkes und präzises Werkzeug für Trader, die Mean-Reversion-Strategien anwenden. Im Gegensatz zu den klassischen Bollinger-Bändern basiert dieser Indikator auf dem Volumengewichteten Gleitenden Durchschnitt (VWMA) , was seine Kanäle empfindlicher für die tatsächliche Marktaktivität macht. Am wichtigsten ist, dass der Indikator Signale generiert, die nicht neu

Der Best SMC for All-Indikator wurde für MetaTrader 5 (MT5) entwickelt, um Smart Money Concepts (SMC) für die Analyse der Marktstruktur und die Identifizierung wichtiger Handelszonen auf der Grundlage von Preisbewegungen zu implementieren. Er visualisiert Angebots- und Nachfragezonen, Break of Structure (BOS)-Levels, Points of Interest (POI) und optionale ZigZag-Muster, um Händlern dabei zu helfen, fundierte Entscheidungen zu treffen. Im Folgenden finden Sie eine detaillierte Beschreibung der Fu
FREE
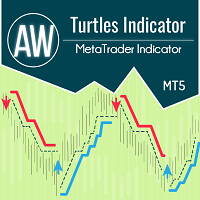
Der Indikator funktioniert nach dem Turtle-System und geht klassisch von einem Zeitintervall von 20 und 55 Kerzen aus. Ein Trend wird über ein bestimmtes Zeitintervall überwacht. Der Einstieg erfolgt zum Zeitpunkt des Durchbruchs des Unterstützungs- oder Widerstandsniveaus. Das Ausstiegssignal ist ein Preisausbruch in die entgegengesetzte Richtung des Trends im gleichen Zeitintervall. Vorteile:
Instrumente: Währungspaare, Aktien, Rohstoffe, Indizes, Kryptowährungen Zeitrahmen: Klassisch D1, au
FREE

Integrierter Dashboard-Scanner - Version 4.00 Das Ultimate Market Command Center ist jetzt noch intelligenter. Jetzt mit programmierbaren Logik-Voreinstellungen. Der Integrated Dashboard Scanner (IDS) überwacht mehrere Symbole und Zeitrahmen über ein einziges, DPI-fähiges Panel. Version 4.00 führt einen revolutionären Preset-Editor ein , mit dem Sie Signale aus verschiedenen Modulen zu komplexen, benutzerdefinierten Strategien kombinieren können, ohne eine einzige Zeile Code schreiben zu müssen.

Spike Phantom ist ein spezieller Indikator für die synthetischen Indizes PainX und GainX, der Handelssignale mit automatischen Warnmeldungen generiert.
Merkmale Der Indikator analysiert die Marktbedingungen mit Hilfe proprietärer Algorithmen und zeigt Kauf-/Verkaufspfeile direkt auf dem Chart an. Er arbeitet speziell mit PainX- und GainX-Indizes auf dem M5-Zeitrahmen. Die Signalerzeugung kombiniert mehrere technische Analysemethoden, um potenzielle Handelsmöglichkeiten zu identifizieren. Das Sy

Der Simple ICT Concepts Indicator ist ein leistungsfähiges Instrument, das Händlern hilft, die Prinzipien der Inner Circle Trader (ICT) Methodik anzuwenden. Dieser Indikator konzentriert sich auf die Identifizierung von Schlüsselzonen wie Liquiditätsniveaus, Unterstützungs- und Widerstandszonen und Marktstrukturen, was ihn zu einem unschätzbaren Wert für Händler von Preisaktionen und Smart Money-Konzepten macht.
Hauptmerkmale Marktstruktur: Marktstrukturkennzeichnungen werden aus dem Durchbrech

Angebots- oder Nachfragezonen beziehen sich auf Preisbereiche, in denen zuvor ein beträchtliches Angebot oder eine beträchtliche Nachfrage auf dem Markt herrschte, wodurch die Preise entweder fielen oder stiegen. Wenn der Kurs in die Nachfrage- oder Angebotszone zurückkehrt, wird er wahrscheinlich abprallen, da zuvor eine große Anzahl von Aufträgen in dieser Zone platziert wurde. Diese Aufträge werden in diesen Bereichen verteidigt.
Die Fair-Value-Lücke (FVG) ist ein Konzept, das dazu dient, Un
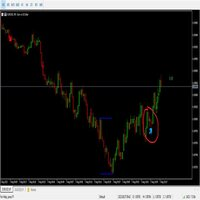
King Binary Profit System
1-Minuten-Kerze
3-4-Minuten-Ablauf
In Ordnung. Dieser Indikator funktioniert auf MT5 und ist sehr einfach zu bedienen. Wenn Sie ein Signal von ihm erhalten, warten Sie darauf, dass die Kerze mit dem Signal geschlossen wird, und Sie gehen zu Beginn der nächsten neuen Kerze in den Handel. Ein roter Pfeil bedeutet Verkauf und ein grüner Pfeil bedeutet Kauf. Alle Pfeile sind mit einer langen gepunkteten Linie versehen, damit Sie das Handelssignal leicht erkennen können. Is
Trader Dynamic Index Added Signal – Ein wissenschaftlicher, kontextbasierter Ansatz zur Marktanalyse 1. Einführung In der modernen technischen Analyse liefern traditionelle Oszillatoren häufig isolierte Signale , die vom übergeordneten Marktkontext abgekoppelt sind, was zu einer hohen Anzahl falscher oder schwacher Signale führt.
Trader Dynamic Index Added Signal (TDI-AS) wurde entwickelt, um dieses Problem zu lösen, indem die Signalgenerierung von Oszillatoren neu definiert und die Berücksichti
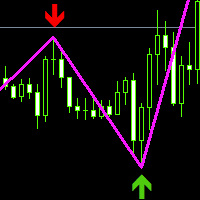
Dieser Index basiert auf der sekundären Entwicklung von Zickzack, das Hinzufügen von Hoch- und Niedrigpunktpfeil, Verdickung der Linie und Änderung der Farbe.Kann eine gute Anzeige der aktuellen Handelssignale, aktuelle lang oder kurz.Zur Bestimmung des Handelspunkts, der einen großen Bezugswert hat, kann er mit anderen Indikatoren kombiniert werden.Im Vergleich zum allgemeinen Trend-Index oder zum Oszillationschargenstandard ist die genaue Bestimmung aus der Perspektive historischer Datenforsch
FREE
Mit diesem Indikator können Sie mehrere Währungspaare und Zeitrahmen auf einmal überwachen. Er zeigt das Auftreten von Divergenzen zwischen dem Preis und dem MACD-Indikator in einer übersichtlichen und leicht zu lesenden Tabelle an. Die Überwachung mehrerer Zeitrahmen und Währungspaare an einem Ort hilft Händlern, eine Divergenz zu erkennen, ohne dass sie zwischen den Charts wechseln müssen. Divergenzen können sowohl nach oben als auch nach unten gerichtet sein. Wenn der Kurs beispielsweise ein

Beschreibung (Für MQL5 Website/Markt)
Titel: Subho SMC Konzept & Trend-Signale
Untertitel: All-in-one Smart Money Concepts (SMC) Dashboard mit hochpräzisen SUBHO Signalen.
Beschreibung: Das Subho SMC Concept & Trend Signals ist ein umfassendes professionelles Handelssystem, das für MetaTrader 5 entwickelt wurde. Es automatisiert fortschrittliche Smart Money Concepts (SMC) und kombiniert sie mit dem proprietären "SUBHO Signal System", um hochwahrscheinliche Handels-Setups zu finden. Dieser In

MTF VWAP-Indikator - Kurzübersicht Dieser Indikator zeigt Ihnen anhand des volumengewichteten Durchschnittspreises (VWAP), wohin institutionelles Geld über mehrere Zeitrahmen hinweg fließt, um Handelszonen mit hoher Wahrscheinlichkeit zu identifizieren. Was er tatsächlich tut: 1 . verfolgt die Smart Money Levels: - Zeigt auf Tages-, Wochen- und Monatsbasis die VWAP-Linien an, auf denen große Akteure (Banken, Fonds) handeln. - Sagt Ihnen, ob der Kurs über oder unter diesen wichtigen institutionel

Malaysischer SnR Pro: Fortgeschrittener Multi-Timeframe Unterstützungs- und Widerstandsindikator Professionelle Erkennung von Unterstützungen und Widerständen mit Top-Down-Analyse Malaysian SnR Pro ist ein umfassender Unterstützungs- und Widerstandsindikator, der fortschrittliche Preisanalysetechniken implementiert, die von institutionellen Händlern verwendet werden.
Unter Verwendung eines ausgeklügelten Multi-Timeframe-Ansatzes identifiziert er wichtige Marktniveaus mit Präzision und filtert M

Er prognostiziert die wahrscheinlichste kurzfristige Kursbewegung auf der Grundlage fortgeschrittener mathematischer Berechnungen.
Merkmale Schätzung der unmittelbaren Preisbewegung; Berechnung des tatsächlichen Markttrends; Berechnung der wichtigsten Unterstützungs- und Widerstandsniveaus; Optimierte Algorithmen für die Durchführung komplexer mathematischer Berechnungen bei minimaler Beanspruchung der Systemressourcen; Selbstanpassung für eine bessere Leistung, so dass es mit jedem Symbol (ega

Die "Power of Three" (PO3) ist ein Konzept, das vom Inner Circle Trader (ICT) entwickelt wurde, um einen dreistufigen Ansatz zu veranschaulichen, den das intelligente Geld an den Märkten verwendet: Akkumulation, Manipulation und Distribution . ICT-Händler betrachten dies als ein grundlegendes Muster, das die Entstehung jeder Kerze auf einem Preisdiagramm erklären kann. Vereinfacht ausgedrückt ist dieses Konzept für jeden Zeitrahmen gültig, solange es einen definierten Start, einen Höchststand, e
FREE

Dominion-Levels: Der Architekt der "Marktstruktur"
Perfekt für XAUUSD (Gold)
Das endgültige Tool zur Identifizierung von "harten" Unterstützungs- und Widerstandsniveaus, die tatsächlich halten. Die meisten Händler ziehen Unterstützungs- und Widerstandslinien auf der Grundlage von Gefühlen oder vagen Zonen. Das Ergebnis? Unübersichtliche Charts, subjektive Entscheidungen und Ausstiegsmöglichkeiten durch "Lärm". Dominion Levels löst dieses Problem, indem es die Subjektivität beseitigt. Es handel
Sind Sie bereit, die volatile Welt des Handels mit synthetischen Indizes zu beherrschen? Der Golden Boom and Crash Spike Indicator ist ein revolutionärer MT5-Indikator, der ausschließlich für Trader mit hohem Risiko entwickelt wurde, die auf explosive Spikes in Boom 300 und Crash 300 setzen . Dieses fortschrittliche Tool , das für den M1-Zeitrahmen (eine Minute) optimiert ist , nutzt eine proprietäre KI-gesteuerte Spike-Erkennung und eine präzise Preisaktionsanalyse, um Kauf-/Verkaufspfeile mit

VR Sync Charts ist ein Dienstprogramm zum Synchronisieren von Markierungen zwischen Fenstern. Mit VR Sync Charts werden Ihre Trendebenen, horizontale Ebenen, Fibonacci-Markierung mit allen Diagrammen synchronisiert. Das Dienstprogramm erm?glicht, alle Standard-Grafikobjekte im MetaTrader-Terminal zu synchronisieren, alle Ihre Trends, Gann-Linien und andere Objekte werden genau auf benachbarte Diagramme kopiert. Sie m?ssen nicht mehr ihre Lineatur und Markierung manuell kopieren. Unten in den Abb

Kurzbeschreibung:
Ein fortschrittliches Reversal-Trading-System, das die Wendepunkte des Marktes mit Hilfe von Liquiditätsmomentum in Kombination mit Price-Action-Bestätigung erkennt . Überblick:
Der Indikator Accurate Liquidity Pivot Signals wurde entwickelt, um hochwahrscheinliche Kauf- und Verkaufs-Setups zu identifizieren. Anstatt sich auf nachlaufende gleitende Durchschnitte zu verlassen, analysiert dieses Tool den internen Liquiditätsfluss des Marktes, um versteckte Unterstützungs- (Nach

Dark Absolute Trend ist ein Indikator für den Intraday-Handel. Dieser Indikator basiert auf der Trendfolgestrategie , verwendet aber auch Candlestick-Muster und Volatilität. Mit diesem Indikator kann man bei guten Preisen einsteigen, um dem Haupttrend des aktuellen Instruments zu folgen. Es wird empfohlen, ECN-Broker mit niedrigen Spreads zu verwenden. Dieser Indikator malt nicht nach und verzögert nicht . Empfohlene Zeitrahmen sind M5, M15 und H1. Empfohlene Arbeitspaare: Alle. Installations- u

Auto-Fibonacci-Retracement-Indikator - flexibel und verlässlich Dies ist nicht nur ein weiterer Auto-Fibonacci-Retracement-Indikator. Er ist eines der flexibelsten und zuverlässigsten Tools auf dem Markt . Wenn Sie ihn nützlich finden, hinterlassen Sie bitte eine Bewertung oder einen Kommentar - Ihr Feedback bedeutet mir viel! Sehen Sie sich meine anderen hilfreichen Tools unten an: Smart Alert Manager - Richten Sie erweiterte Alarme ein und senden Sie sie an Mobile, Telegram, Discord, Webhook.
FREE

Der Indikator bestimmt sehr genau die Niveaus des möglichen Endes des Trends und der Gewinnfixierung. Die Methode zur Bestimmung der Niveaus basiert auf den Ideen von W.D.Gann, unter Verwendung eines von seinem Nachfolger Kirill Borovsky entwickelten Algorithmus. Extrem hohe Zuverlässigkeit beim Erreichen der Niveaus (laut K. Borovsky - 80-90%) Unverzichtbar für jede Handelsstrategie - jeder Trader muss den Ausstiegspunkt aus dem Markt bestimmen! Bestimmt präzise Ziele auf jedem Zeitrahmen und f

SMC Liquidity MAX MT5 ist ein fortschrittlicher Smart Money Concepts (SMC)-Indikator, der für Intraday- und Swing-Trader entwickelt wurde, die eine klare und strukturierte Marktanalyse wünschen. Er integriert die wichtigsten Komponenten des institutionellen Ansatzes - Struktur, Liquidität und Volumen - in einem einzigen Panel mit optimierter Echtzeitdarstellung. Kernfunktionen Marktstruktur: Automatische Identifizierung von BOS (Break of Structure) und CHoCH (Change of Character). Ungleichgewic

Der Pips Chaser Indikator wurde entwickelt, um Ihren manuellen Handel zu ergänzen. Dieser Indikator kann sowohl für kurzes Scalping als auch für langes Swing-Trading verwendet werden // MT4 Version
Merkmale Indikator wird nicht neu gezeichnet Dieser Indikator ändert seine Werte nicht, wenn neue Daten eintreffen Handelspaare Jedes Währungspaar Zeitrahmen H1 ist vorzuziehen, aber Sie können ihn an jeden Zeitrahmen anpassen Trading time
Rund um die Uhr Buffers Buy Buffer: 0 / Sell Buffer: 1
FREE

Volumengewichteter Durchschnittspreis (VWAP) Der volumengewichtete Durchschnittspreis (VWAP) ist eine von Händlern verwendete Handelsbenchmark , die den Durchschnittspreis eines Wertpapiers im Laufe des Tages angibt, der sowohl auf dem Volumen als auch auf dem Preis basiert. Er ist wichtig, weil er Händlern einen Einblick sowohl in den Trend als auch in den Wert eines Wertpapiers gibt. Dieser Indikator VWAP V2 ist kostenlos und ist die manuelle Version des erweiterten Easy-VWAP-Indikators (30 Eu
FREE
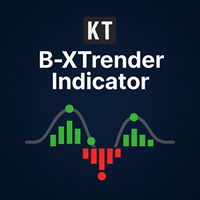
KT B-Xtrender ist eine weiterentwickelte Version des trendfolgenden Werkzeugs, das ursprünglich von Bharat Jhunjhunwala im IFTA-Journal vorgestellt wurde. Wir haben das Konzept verfeinert, um präzisere Signale und integrierte Benachrichtigungen bereitzustellen, damit Trader in Trendmärkten stärkere Handelschancen erkennen können. Obwohl der Indikator auf verschiedenen Zeitrahmen verwendet werden kann, zeigt er seine beste Leistung auf höheren Zeitrahmen wie dem 4-Stunden-Chart und dem Tageschar
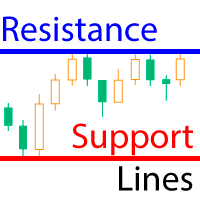
Der Indikator berechnet fraktale Linien, die technisch gesehen psychologische Unterstützungs-/Widerstandslinien sind. Es handelt sich dabei um die Höchst- und Tiefststände des Preises über einen bestimmten Zeitraum. Der Indikator funktioniert auf allen Charts und Zeitrahmen. Diese kostenlose Version des Resistance Support Lines Pro Indikators kommt so wie sie ist! Einstellungen: Diese Einstellungen können in dieser Version nicht geändert werden Fractal Candels = 5 - die Anzahl der Candlesticks,
FREE

Der RSI-Divergenz-Indikator findet Divergenzen zwischen dem Kurschart und dem RSI-Indikator und informiert Sie mit Warnungen (Popup, mobile Benachrichtigung oder E-Mail). Seine Hauptaufgabe besteht darin, Trendumkehrungen im Chart zu finden. Verwenden Sie die Divergenz-Indikatoren immer zusammen mit anderen technischen Hilfsmitteln wie Unterstützungs- und Widerstandszonen, Candlestick-Mustern und Preisaktionen, um eine höhere Wahrscheinlichkeit zu haben, Trendumkehrungen zu finden. Drei Bestätig
FREE
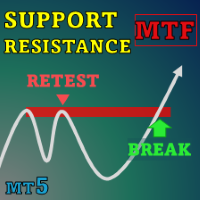
Special offer : ALL TOOLS , just $35 each! New tools will be $30 for the first week or the first 3 purchases ! Trading Tools Channel on MQL5 : Join my MQL5 channel to update the latest news from me In der sich ständig verändernden Landschaft des Finanzhandels ist die genaue Identifizierung und Analyse von Unterstützungs- und Widerstandsniveaus entscheidend für fundierte Investitionsentscheidungen. SnR Retest and Break Multi-Timeframe ist ein Unterstützungs- und Widerstandsindikator

Ekom Spike Detektor Pro
Bringen Sie Ihr Trading auf die nächste Stufe mit dem Ekom Boom and Crash Spike Detector Indicator Pro, der für ernsthafte Trader entwickelt wurde, die mehr verlangen. Diese erweiterte Version bietet: Hauptmerkmale: Präzise Spike-Erkennung: Identifizierung von Spike-Mustern mit hoher Wahrscheinlichkeit in Echtzeit anhand der Preisentwicklung Klare visuelle Signale: Klare Kauf- und Verkaufspfeile auf dem Chart für eine einfache Entscheidungsfindung Warnungsoptionen : MT5
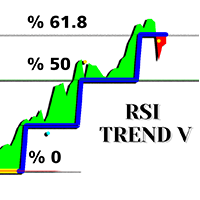
Wichtiger Hinweis: „Einige der Bilder“, die in den Screenshots angezeigt werden, stammen aus meinen Indikatoren, dem Suleiman Levels Indicator und dem RSI Trend V Indicator . Der RSI Trend V Indicator wurde zur Trenderkennung entwickelt und ist mit Fibonacci integriert, um Zielzonen und potenzielle Umkehrpunkte zu bestimmen. Es ist ein sehr leistungsstarker, strenger und nützlicher Indikator zur Bestimmung der allgemeinen Trendrichtung. Er enthält bullische und bärische Pfeile, die in potenziel
Anzeige der Zeit bis zum Ende der Kerze. Zeigt die Zeit bis zum Ende der Kerze sowie die Serverzeit an. Text kann den Trend oder die Richtung der Kerze anzeigen, akustische Benachrichtigungen sind integriert Besonderheiten:
Zeigt die Zeit bis zum Ende der aktuellen Kerze sowie andere Zeitrahmen an, die bei Bedarf angepasst oder deaktiviert werden können AW Candle Time kann die Richtung der aktuellen Kerze oder des Trends mit dem AW Super Trend Indikator auswählen Die Trendstrategie wird in der a
FREE

MT4-Version: https://www.mql5.com/en/market/product/157679 MT5-Version: https://www.mql5.com/en/market/product/157680
Support & Resistance – Intelligente Marktstruktur-Levels
Ein übersichtlicher, intelligenter und hochzuverlässiger Support- und Resistance-Indikator, entwickelt für professionelle Trader und automatisierte Systeme.
Support & Resistance erkennt mithilfe eines fortschrittlichen Clustering-Algorithmus, der Fraktale, ATR-basierte Preissegmentierung und Multi-Timeframe-Analyse komb
Erhöhen Sie Ihre Trading-Strategie mit dem Keltner Channel Indicator MT5 , einem zeitlosen Volatilitätswerkzeug, inspiriert von Chester Keltner's Innovationen der 1960er Jahre, das exponentielle gleitende Durchschnitte mit dem Average True Range (ATR) kombiniert, um dynamische Preisspannen zu schaffen. Seit seiner Wiederbelebung im digitalen Zeitalter in Trading-Kreisen gefeiert, hat dieser Indikator auf Plattformen wie TradingView und MQL5 an Popularität gewonnen, da er zuverlässig Breakouts
Haven ZScore Oszillator ist ein leistungsstarker statistischer Oszillator, der entwickelt wurde, um anomale Preisabweichungen von seinem Mittelwert zu erkennen. Der Indikator folgt nicht nur dem Preis, sondern misst, wie statistisch signifikant der aktuelle Preis ist, was es ermöglicht, überkaufte/überverkaufte Zonen mit hoher Präzision zu definieren und potenzielle Trendwendepunkte zu finden. Dieses Tool wird zu einem unverzichtbaren Helfer für Händler, die einen datengesteuerten Ansatz bevorzu
Der MetaTrader Market ist die beste Plattform für den Verkauf von Handelsroboter und technischen Indikatoren.
Sie brauchen nur ein gefragtes Programm für die MetaTrader Plattform schreiben und schön gestalten sowie eine Beschreibung hinzufügen. Wir helfen Ihnen, das Produkt im Market Service zu veröffentlichen, wo Millionen von MetaTrader Benutzern es kaufen können. Konzentrieren Sie sich auf dem Wesentlichen - schreiben Sie Programme für Autotrading.
Sie verpassen Handelsmöglichkeiten:
- Freie Handelsapplikationen
- Über 8.000 Signale zum Kopieren
- Wirtschaftsnachrichten für die Lage an den Finanzmärkte
Registrierung
Einloggen
Wenn Sie kein Benutzerkonto haben, registrieren Sie sich
Erlauben Sie die Verwendung von Cookies, um sich auf der Website MQL5.com anzumelden.
Bitte aktivieren Sie die notwendige Einstellung in Ihrem Browser, da Sie sich sonst nicht einloggen können.