YouTubeにあるマーケットチュートリアルビデオをご覧ください
ロボットや指標を購入する
仮想ホスティングで
EAを実行
EAを実行
ロボットや指標を購入前にテストする
マーケットで収入を得る
販売のためにプロダクトをプレゼンテーションする方法
MetaTrader 5のためのテクニカル指標 - 3

今の価格で入手できるうちに、ぜひ手に入れてください。価格はいつでも変更される可能性があります。 "Black Horse" インディケーターの目的は、価格アクションとVWAPインディケーターとの間のダイバージェンスを特定することです。これは潜在的な誤ったダイバージェンスを取り除き、高品質で正確なアラートを生成するためにフィルターを使用します。
ベアリッシュなダイバージェンスは、キャンドルの上に表示される赤いドットで示され、ブルリッシュなダイバージェンスはキャンドルの下に緑のドットで表示されます。
ダイバージェンスの主なフィルターは、ATR(平均真のレンジ)および見直し期間内の前のキャンドルの価格変動を中心にしています。ダイバージェンスは、見直し期間内の価格変動が十分に鋭いことで、ATR倍数とATRをかけたものを上回ると判定されます。
計算の特性から、より高いタイムフレームで作業する際には、ATR倍数と見直し期間により低い値を設定することが望ましいです。より高いタイムフレームでは、価格変動がより平滑化されるため、15分足のようなシャープな価格変動はより頻繁に発生せず、通常はより少
Haven Trend Tracker PRO - トレンドの世界のナビゲーター ご紹介します Haven Trend Tracker PRO – 市場と調和して取引したいトレーダーのために作られた、強力なマルチタイムフレームインジケーターです。その主な目的は、あなたのワーキングタイムフレーム(LTF)と上位タイムフレーム(HTF)の両方でトレンドの方向性を同時に示すことで、あなたの疑問を解消することです。 私の他の製品 -> こちら . トレンドに従った取引は、最も信頼性の高い戦略です。このインジケーターは、市場の支配的な力を特定し、ローカルとグローバルのトレンドが一致したときに最適なエントリーポイントを見つけるのに役立ち、成功の確率を大幅に高めます。 重要なアイデア – 2つのタイムフレームの力 LTF (Lower Timeframe / 下位タイムフレーム) – これは現在のチャートのトレンドです。細い点線と矢印で表示され、短期的な価格の動きを示します。正確なエントリーポイントを見つけるのに最適です。 HTF (Higher Timeframe / 上位タイムフ

MT4版 | Trend Monitor VZインジケーター | Owl Smart Levelsインジケーター | Owl Smart Levels戦略 | FAQ エリオット波理論は 、価格チャート上の波の視覚的モデルに依存している金融市場のプロセスの解釈です。 Valable ZigZagインジケータは、取引の決定を行うために使用することができる市場の波の構造を表示します。 Valable ZigZag indicatorはより安定しており、古典的なZigZag indicatorのように方向を変えることはなく、トレーダーを誤解させます。 これは、指標波の構築にフラクタルを使用することによって達成される。 Telegram チャット: @it_trader_chat 新しい Expert Advisor Prop Master - 取引ターミナルでテストしてください https://www.mql5.com/ja/market/product/115375
Valable ZigZagは、主にトレンド指標です 。 これは、トレーダーが取引すべき主な方向
FREE

Gravity Bands
A powerful all-in-one market structure, momentum, and trend framework for any intraday trader. The Gravity Bands Indicator is designed for traders who want clarity — not noise.
Whether you scalp or day-trade, this tool gives you a clean visual structure of the market: Where the trend is Where momentum is accelerating Where structure shifts happen Where price is fair or extendedWhen sessions activate and volatility begins It does not predict the market. It reveals the market. Gravit

Special offer : ALL TOOLS , just $35 each! New tools will be $30 for the first week or the first 3 purchases ! Trading Tools Channel on MQL5 : Join my MQL5 channel to update the latest news from me SMC は、流動性ゾーン、機関注文の配置、そして市場の主要な転換点を特定するためのトレーディングアプローチです。SMCの原則を活用することで、トレーダーは市場をより効果的にナビゲートし、最適なエントリーとエグジットを見つけることができます。 SMC System インジケーターはこれらの概念を自動化し、以下のような重要なプライスアクション要素でチャートをすばやくマークすることを可能にします: リアルタイムの市場構造 (内部構造およびスイング構造のBOS / CHoCH) オーダーブロック (強気および弱気) プレミアムゾーンとディスカウントゾーン イコールハイとイ

サポートゾーンとレジスタンスゾーンのインジケーターMT5 このインジケーターは、トップとボトムを自動的に識別する方法を知っています。 このサポートとレジスタンスインジケーターは、トップとボトムに基づいてサポートラインとレジスタンスラインを作成します。 サポートラインとレジスタンスラインの作り方。 これは、自動サポートラインとレジスタンスラインを作成するためのインジケーターです。 インジケーターを使用してサポートレベルを見つける方法。 このインジケーターはトップとボトムを自動的に検出します。 インジケーターは、「ZigZag」が自動的に底を作成するか、新しい底を前の底より低くするたびにサポートラインを自動的に作成するため、インジケーターは画面に自動サポートラインを自動的に描画します。 レジスタンスラインの作成方法。 インジケーターは、「ZigZag」が新しいトップまたは前のトップよりも高いトップを作成するたびに、サポートレベルを作成するのと同じ方法で抵抗線を自動的に作成します。したがって、インジケーターは新しい抵抗を自動的に作成します。トップレベルとボトムレベルがどこにあるかを心配する必
FREE

このVWAPはシンプルなVWAPですが、価格がVWAPに触れるか、VWAPをクロスするときにアラートが表示されるようになっています。 このインジケーターは、MetaTrader 5(MT5)向けの伝統的なVWAPインジケーターです。 デフォルトのパラメータは通常のVWAPと同じですが、新しい計算を使用することができるのはもちろん、さらに: 価格がVWAPに触れたりクロスしたりすると、アラート、携帯電話の通知、メール、またはサウンドイベントでお知らせします。 MetaTrader 5用の無料アンカードVWAPインジケーター 。 パラメータ: VWAPサイクル VWAPは時間サイクルに基づいて計算されます。通常のVWAPは毎日新しい計算で始まりますが、このパラメータを使用して好みのVWAP計算のための時間サイクルを選択できます。つまり、M1のタイムフレームであっても、常に新しいH1のバーごとにリセットされるH1のVWAPの計算を見ることができます。計算は選択した時間サイクルごとに常にリセットされます。 ただし、現時点ではこれを心配する必要はありません。デフォルトのパラメータは通常のVWAP
FREE

Dark Power is an Indicator for intraday trading. This Indicator is based on Trend Following strategy, also adopting the use of an histogram to determine the right power . We can enter in good price with this Indicator, in order to follow the strong trend on the current instrument. The histogram is calculated based on the size of the bars and two moving averages calculated on the histogram determine the direction of the signal
Key benefits
Easily visible take profit/stop loss lines Intui
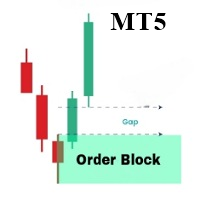
OrderBlock Analyzer は、MetaTrader 5 (MT5) 用にカスタマイズされたインジケーターで、価格チャート上のオーダーブロック(Order Blocks)を検出し、ハイライトします。このインジケーターは、市場の主要な構造を特定するのに役立ち、反転や継続の可能性のある領域を示します。OrderBlock Analyzer は、マーケットの動きに基づいて、自動的にオーダーブロックを描画し、上昇と下降のブロックを異なる色で区別します。 主な機能: 上昇および下降オーダーブロックの検出とマーキング。 グラフ上でリアルタイムにオーダーブロックを更新し、トレーディングのチャンスを迅速に特定します。 オーダーブロックの色、ボーダーライン、ラインスタイルのカスタマイズが可能です。 ボーダーラインの色と厚さの柔軟な設定。 このインジケーターは、トレンドや反転に基づいたトレーディング戦略を使用するすべてのタイプのトレーダーに最適です。

Crystal Buy Sell Liquidity — MT5流動性スイープ指標 概要
Crystal Buy Sell Liquidity は MetaTrader 5 向けのプロ仕様インジケーターで、流動性スイープパターンに基づく売買チャンスを検出します。日中の市場構造を分析し、機関投資家の流動性狩りを捉え、小口投資家の流動性が吸収された後に明確なシグナルを提供します。 主な機能 高値/安値における流動性スイープの自動検出 反転確認後の売買シグナル表示 SMC (Smart Money Concepts) ロジックの統合 セッション高値・安値を利用した日中市場構造分析 H1, M15, M5 推奨 シンプルで見やすいチャート表示 動作原理 セッション高値/安値の突破を検出 流動性吸収後の反転条件を確認 売買シグナルを生成 使用方法 MT5チャートに適用 タイムフレームを選択 (M5, M15, H1) セッション高値・安値付近のシグナルに注目 市場構造やオーダーフローと組み合わせて使用 互換性 プラットフォーム: MetaTrader 5 対応市場: FX、指数、商品、暗号資産
FREE

The Golden PainX and GainX Spike Indicator is a cutting-edge, AI-powered trading tool engineered exclusively for the synthetic indices market. It masterfully combines proprietary spike detection algorithms and real-time price action analysis to generate high-probability, non-repainting trade signals with exceptional accuracy. Important( Use only on PainX 400and GainX 400 (M1 one minute timeframe) Identifies high-probability spikes with non-repainting buy/sell arrows. Automatically sets profit t
This indicator shows the remaining time until the current candle closes on an MT5 chart. It works on selected intraday timeframes and provides a clear, stable display. Features Countdown timer for candle closing on M1, M15, and H1 charts Fixed position, font, and colors for easy readability Informative header and description labels Automatic removal of chart objects when detached Lightweight modular structure for reliable performance How to Use Attach the indicator to an M1, M15 or H1 chart. The
FREE

* 主要通貨のデータの信頼性を確保するため、ライブチャートのご利用を推奨いたします。
UEX Pure USD Euro Index とは: 英語での説明: https://www.mql5.com/en/market/product/152936
Pure USD & Euro Indexで、外国為替市場の真の脈動を探りましょう。 — 世界で最も強力な2つの通貨間の隠れた強みと弱みを真に明らかにする革新的なインジケーターです。
EURUSDのような単一の通貨ペアに頼るのではなく、このツールは複数の主要通貨ペアにわたる米ドルとユーロの総合的なパフォーマンスを測定し、 真の市場センチメントを明確かつバランスよく把握します。
このインジケーターは、すべての主要USDおよびEuroペアのデータを組み合わせることで、 真の通貨変動を反映した同期インデックスチャートを構築します。 単一の通貨ペアの変動だけでなく、真の通貨変動を反映します。 ドルが優勢になった時、ユーロが反落した時、即座に通知を受け取り、 市場が反応する数分前に、両者のバランスが変化する局面を洞察できます。 このコンセ

TREND FLOW PRO TREND FLOW PRO は、市場の方向を表示するリペイントなしのインジケーターです。トレンドの反転だけでなく、大口市場参加者の初回および再エントリーを特定します。チャート上の BOS マークは、実際のトレンド転換と上位タイムフレームの重要なレベルを示します。データはリペイントされず、各バーの確定後もチャート上に残ります。 戦略例を含む詳細な PDF ガイド は、プライベートメッセージでリクエストして受け取ることができます。 インジケーターの主な要素: BOS FLOW ― トレンド波動と実際のトレンド転換。これは大口参加者のエントリーと、その存在の確認を示します(数字で表示)。 BOS FILL ― トレンド方向にローソク足を着色します。大口プレイヤーのエントリーポイントや、トレンドが変化するポイントを示します。 シグナルレベル: BOS ― 強さが未確定な参加者のエントリー(多くの場合、メイントレンド内の調整)。 Move SL ― 大口参加者がポジションをどのように移動させているかを視覚的に表示します。トレーダーはストップロス調整の参考として使用

Dark Oscillator is an Indicator for intraday trading. This Indicator is based on Counter Trend strategy, trying to intercept changes in direction, in advance compared trend following indicators. We can enter in good price with this Indicator, in order to follow the inversion of the trend on the current instrument. It is advised to use low spread ECN brokers. This Indicator does Not repaint and N ot lag . Recommended timeframes are M5, M15 and H1. Recommended working pairs: All. I nst
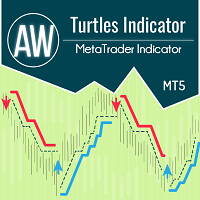
このインジケーターはタートル システムに従って機能し、古典的に 20 ローソク足と 55 ローソク足の時間間隔を想定しています。傾向は、指定された時間間隔にわたって監視されます。エントリーはサポートまたはレジスタンスレベルを下抜けた瞬間に行われます。出口シグナルは、同じ時間間隔のトレンドの反対方向への価格ブレイクアウトです。 利点:
金融商品: 通貨ペア、株式、商品、指数、暗号通貨 タイムフレーム: 古典的には D1、あらゆるタイムフレームでの作業にも適しています 取引時間: 24時間 資金管理戦略: 取引あたりのリスクは 1% 以下 追加注文を使用する場合、追加ポジションごとのリスクは 0.25% MT4 indicator version -> HERE / AW Turtles EA MT5 -> HERE / More products -> HERE エントリールール: 1) 短いエントリー: エントリー条件は20日間の高値または安値をブレイクアウトすることです。
前のシグナルが成功した場合、取引はスキップされます。
注記!以前の取引が利益で終了した場合は、
FREE

基本的なRenkoインディケータは、明確で簡潔な相場観を求めるトレーダーにとって強力なツールです。当社のインディケータは、トレンドの視覚化を簡素化するだけでなく、反転の正確なアラートを提供し、あなたの取引に戦略的な優位性を提供します / MT4無料版
特徴 フルカスタマイズ可能: 高度なカスタマイズオプションにより、インジケーターをお好みに合わせてカスタマイズできます。色からボックスサイズ設定まで、チャート上の情報表示方法を完全にコントロールできます。 反転アラート: 反転アラートで、市場の方向性が変化する可能性をいち早く知ることができます。これにより、利益を最大化し、損失を最小化するために、情報に基づいたタイムリーな意思決定を行うことができます。
入力項目 Size of the boxes: ボックスサイズ(ポイントベース) Bullish box colour: 強気ボックスの色 Bearish box colour: 弱気ボックスの色 Box opacity: 不透明度(0から100の間)。不透明度が低くなるにつれて透明度が高くなる Text
FREE

The indicator is designed for easy construction of synthetic charts based on data of various financial instruments. It will be useful both arbitrage and pair trading, as well as for analysis purposes. Its main advantage is simplicity and clarity. Each chart is given as a common mathematical formula. For example, if you want to plot the spread (difference) between EURUSD and GBPUSD with coefficients 4 and 3, then set the following formula: EURUSD * 4 - GBPUSD * 3 The resulting chart is shown in t

Gold Levels MTF - this is a fine stock technical indicator. The indicator algorithm analyzes the movement of the asset price, displays price levels of support and resistance from all time frames (TF) using the Murray method based on the Gann theory. The indicator indicates overbought and oversold fields, giving an idea of possible reversal points and at the same time giving some idea of the strength of the current trend.
Description of levels: (Extreme Overshoot) - these levels are the ultimate
FREE

FREE
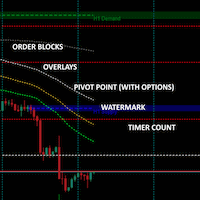
Multiple indicators in one: Order Blocks with optional higher timeframe overlay Watermark Count down timer Pivot points No fancy algorithms but tends to be quite accurate for some symbols to predict bounce, return-to and break-through channels. It is a retrospective indicator (as they all are) and there to help you with better guesses as to where a movement is going towards. The last two order blocks are shaded and extends past the current time. Prior order blocks (within your selected timeframe
FREE

あなたはICTコンセプトを取引するための信頼できるインジケーターを探しているということですね。ICTマーケットストラクチャーは、より高度な戦略を使うトレーダーのためのユーザーマニュアルを提供します。 このオールインワンのインジケーターは、ICTコンセプト(スマートマネーコンセプト)に焦点を当て、大手機関がどのように取引しているかを分析し、彼らの動きを予測するのに役立ちます。この戦略を理解し、活用することで、トレーダーは市場の動きに関する貴重な洞察を得ることができ、プライスアクションに基づいてより実用的なエントリーとエグジットを見つけることができます。
以下は、いくつかの機能の簡単な紹介です:
再描画、再描画、遅延のないインジケーター。 オーダーブロック(強気と弱気)、ボリュームメトリクスとアラート付きのオーダーブロック。 リアルタイムのマーケット構造とスイング構造の高値と安値(HH, HL, LL, LH)とアラート。 構造の崩壊(BOS)、性格の変化(CHoCH)/モメンタムシフト(MS)。 ブレーカーブロックのラベリングとアラート。 公正価値ギャップ(強気と弱気のFVG)の検出

概要 このインジケーターは、前の期間から導出される3種類のサポート&レジスタンスレベルを監視します: Daily (前日の高値・安値)、 Weekly (前の週)、 Monthly (前の月)。価格が反応しやすい重要なレベルを視覚的にマッピングし、潜在的な 反転 や有意な ブレイクアウト の識別に役立ちます。 機能 自動で描画: 前日 の高値/安値(Daily) 前週 の高値/安値(Weekly) 前月 の高値/安値(Monthly) 各レベルは固有の色、ラインスタイル、ラベルを持つ。 Daily、Weekly、Monthly のレイヤーおよびそれぞれのラベルは独立してオン/オフ可能。 反転を狙ったエントリー これらのレベル付近でのリバウンド/反転を狙う際には、以下のような追加の確認シグナルを併用するのが推奨されます: テストされているレベル上での反転系ローソク足パターン(例:ピンバー、エンゴルフィング、ドージ) 価格との比較におけるオシレーター(RSI、MACD)でのダイバージェンス レベルからの明確な拒否(ローソク足の実体が離れて閉じるなど)、いわゆるフェイクブレイクの否定 上位足
FREE

ゴールドターゲットは最良のトレンド指標です。 このインジケーターの独自のアルゴリズムは、テクニカル分析と数学的分析の要素を考慮して資産価格の動きを分析し、最も収益性の高いエントリーポイントを決定し、矢印の形でシグナルと価格レベル(買いエントリー/売りエントリー)を発行します。 注文を開きます。 このインジケーターには、ストップロスの価格レベルとテイクプロフィットの 5 つの価格レベルもすぐに表示されます。
注意: このインジケーターは非常に使いやすいです。 ワンクリックでチャートにインジケーターをインストールし、そのシグナルと価格レベルに基づいて取引します。チャート上では、インジケーターが設置されている時間枠に関わらず、4つの時間枠(M30 H1 H4 D1)からトレンド状況が表示されます。
インジケーターの利点:
1. インジケーターは高精度の信号を生成します。 2. インジケーター信号は再描画されません。 価格が各ラインを超えた場合に音声通知(アラート&メッセージ)を搭載しています。 3. どのブローカーの MetaTrader 5 取引プラットフォームでも取引できます

Was: $299 Now: $99 Supply Demand uses previous price action to identify potential imbalances between buyers and sellers. The key is to identify the better odds zones, not just the untouched ones. Blahtech Supply Demand indicator delivers functionality previously unavailable on any trading platform. This 4-in-1 indicator not only highlights the higher probability zones using a multi-criteria strength engine, but also combines it with multi-timeframe trend analysis, previously confirmed swings a

Volatility Master for MetaTrader is a real-time dashboard tool that scans up to 56 symbols using up to 2 flexible dashboards on different charts to identify high-volatility, trending markets instantly. With clear bullish/bearish signals, customizable alerts, and a user-friendly interface, it helps you avoid range-bound conditions and focus on high-probability trades. Clarity leads to confidence. Trade confidently and protect your capital effectively with this powerful dashboard. Setup & Guide:

"Haven Candle Timer Countdown" インジケーターは、さまざまなタイムフレームの時間枠を管理するためのシンプルで便利なツールです。現在のサーバー時間と、3つの選択したタイムフレームで同時にローソク足の終了までのカウントダウンを表示します。このツールは、複数のタイムフレームで現在のローソク足が終了するまでの残り時間を正確に知る必要があるトレーダーに特に役立ち、タイムリーに意思決定を行うことができます。このインジケーターを使用することで、分析プロセスが大幅に加速され、時間に関する情報不足による誤りを避けることができます。 その他の製品 -> こちら 主な機能: 時間と色の表示設定を柔軟にカスタマイズ 1分から1ヶ月までのタイムフレームをサポート チャート上での便利な配置 現在の期間および次の期間の情報への迅速なアクセス 取引決定時に正確に時間間隔を制御する必要があるトレーダーに最適です。このインジケーターは、ローソク足の終了時刻に関する不確実性に関連するリスクを最小限に抑え、効果的に行動計画を立てるのに役立ちます。短期のタイムフレームで分析を行うトレーダーにも、
FREE

Prices move for many reasons and these can vary from one operator to another: software, private and institutional traders simultaneously contribute to the formation of the price, making predictive art very difficult. However, there are measurable factors that bind the price to an underlying trend in line with the physical reality that the financial asset represents: these are the macroeconomic indicators. Large investors use this information wisely to set their strategies. Understanding these m

TPSproTrend PRO は、市場が実際に方向転換する瞬間を識別し、動きの開始時にエントリー ポイントを形成します。
価格が動き始めた直後に市場に参入し、すでに動き出した後に参入してはいけません。 インジケーター シグナルを再描画せず、エントリーポイント、ストップロス、テイクプロフィットを自動的に表示するため、取引が明確かつ視覚的かつ構造化されます。 説明書 RUS - MT4 バージョン 主な利点 再描画のない信号。 すべての信号は固定です。 矢印が表示された場合 - もう変化したり消えたりすることはありません。
誤ったシグナルのリスクなしに、安定したデータに基づいて取引の決定を下すことができます。 既製の買い/売りエントリーポイント このインジケーターは、取引を開始するのに最適なタイミングを自動的に決定し、チャート上に矢印で表示します。
推測や主観的な分析は不要。明確なシグナルだけです。 自動ストップロスとテイクプロフィットゾーン 信号の直後に次のものが表示されます: エントリーポイント リスク制限ゾーン(ストップロス) 利益確定ゾーン これにより、

WARNING: This indicator is distributed EXCLUSIVELY on MQL5.com MT4 version: https://www.mql5.com/it/market/product/160363 MT5 version: https://www.mql5.com/it/market/product/160410 ============================================================================================= MAX RIBBON ver 1.00 The indicator that shows you the TREND clearly and unambiguously! ============================================================================================= DESCRIPTION MAX RIBBON is an advanced tre

Strong Bull V7 B&C The ultimate M5 indicator for Boom & Crash indices, providing clear, filtered buy/sell signals to eliminate market noise and enhance your trading precision. Benefit-Focused Master the volatile Boom & Crash markets with Strong Bull V7 B&C . This intelligent indicator provides clear visual arrows and text labels for high-probability setups on the M5 timeframe. Its unique symbol-filtering technology automatically hides conflicting signals (no buys on Crash, no sells on Boom), en

Matreshka self-testing and self-optimizing indicator: 1. Is an interpretation of the Elliott Wave Analysis Theory. 2. Based on the principle of the indicator type ZigZag, and the waves are based on the principle of interpretation of the theory of DeMark. 3. Filters waves in length and height. 4. Draws up to six levels of ZigZag at the same time, tracking waves of different orders. 5. Marks Pulsed and Recoil Waves. 6. Draws arrows to open positions 7. Draws three channels. 8. Notes support and re

こんにちは、レンジャーズFXです。 私たちは、ブーム 1000 インデックス、ブーム 500 インデックス、およびブーム 300 インデックスのスパイクを検出するためのインジケーターを作成することができました。このインジケーターは、利用可能なすべてのブームと今後登場する他のブームに影響を与えます。 このインジケーターの使用方法 まず第一に、タイムフレームを M1/M5 タイムフレームに切り替える必要があります。このインジケーターは、いつ買い取引を行うか、いつ取引を終了/終了するか (X) についてのアラートを送信します。取引を開始するときに恐れることはありません。このインジケーターが終了のサイン (X) を示さない限り、あなたは損失を抱えています。つまり、市場の正しい方向にまだいることを意味します。 このインジケーターは再描画されず、チュートリアルで表示されている内容のみが表示されます。 このインジケーターを Mql5 または whatsApp で自由にテストして入手するか、mql5 で購入してください。 WhatsApp +27786420491 Kon'nichiwa, renj

ブレーカートレーダーになり、価格が反転すると市場構造からの利益が変化します。
注文ブロックブレーカーインジケーターは、トレンドまたは価格の動きが枯渇に近づいており、逆転の準備ができていることを識別します。通常、反転または大規模なプルバックが発生しようとしているときに発生する市場構造の変化について警告します。
この指標は、ブレイクアウトと価格の勢いを識別する独自の計算を使用します。使い果たされる可能性のあるポイントの近くで新しい高値が形成されるたびに、インディケーターはその高値の作成を担当する最後の注文ブロックを描きます。次に、移動する価格とともに注文ブロックを追跡します。その後、価格が反対方向にシフトし、その注文ブロックを突破すると、新しい市場構造を作成し、トレンドまたは大きな後退の可能性のある反転の開始を警告します。
注文ブロックは、高値/安値が作成される前の最後の反対色のろうそくであり、価格がこれらの重要な領域を下抜けすると、トレンドの短期的または長期的な反転の兆候です。
特徴 重要な枯渇点での市場構造の変化を警告します 価格が使い果たされるレベルに近づくと、自動的に
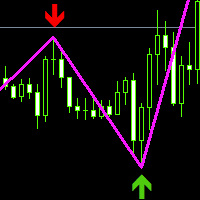
本指標は、zigzingの二次開発に基づいて、高値と安値の矢印を追加し、線を太くし、色を変更します。現在の入場売買信号をよく見せてくれます。今は多くしますか?それとも空いていますか?実際の取引のプロセスでは、より正確なことを発見し、他の指標と組み合わせて使用することができます。この指標自体は標準的に未来の関数を持っています。一般的な傾向指標や振動バッチに対して、ヒストリカルデータの研究判断から見れば、必ず高いものを確定します。この指标は価格点の変化を消し、分析の価値が与えられた価値より少ないです。そのため、字形の指标は明らかな変化だけを反映しています。多くの场合、私たちが使っている字形は価格点の具体的な位置を感知しやすいです。最も重要なのは、その転換と変化を示すことができます。同時に重要なのは、指標の最終四半期はあなたの分析データの変化に依存するかもしれません。それは特殊な指標の一つです。いくつかの取引価格に対して変更すると、前の値が変わります。すでに突然価格の変化を分析するために、Zigzagツールのこの能力は価格によって自身を訂正することができます。
FREE

The Best SMC for All indicator is designed for MetaTrader 5 (MT5) to implement Smart Money Concepts (SMC) for analyzing market structure and identifying key trading zones based on price action. It visualizes supply and demand zones, Break of Structure (BOS) levels, Points of Interest (POI), and optional ZigZag patterns to assist traders in making informed decisions. Below is a detailed description of its features:
---
Features
1. Swing High/Low Detection:
- Functionality: Automatically iden
FREE

特別オファー : ALL TOOLS 、各 $35 ! 新しいツール は 最初の1週間 または 最初の3件の購入 について $30 です! MQL5 の Trading Tools チャンネル :最新情報を受け取るために私の MQL5 チャンネルに参加してください 本インジケーターは、“Smart Breakout Channels” と呼ばれるブレイクアウト検出ゾーンを描画します。これはボラティリティで正規化された価格の動きに基づいています。これらのゾーンは出来高オーバーレイを備えた動的なボックスとして表示されます。本ツールは、カスタムの正規化ボラティリティ計算を用いて一時的な蓄積または分配レンジを検出し、価格がそのレンジを上方または下方に抜けた瞬間をマークします。各チャネルは構造化されたレンジを表し、出来高デルタ、上昇/下降出来高、そしてモメンタムバイアスを示すグラデーションのビジュアルゲージによる追加コンテキストを提供します。 MT5 版はこちら: Smart Breakout Channels MT5 Scanner
MT4 版はこちら: S

[ マイチャンネル ] , [ マイプロダクト ]
このインジケーターは、全体的なトレンドが上昇または下降している間に、一時的な圧力によってローソク足のトレンドが変化するポイントを示します。 インジケーターに表示される矢印は、前のローソク足が特定の条件を満たすと描画されます。 戦略を構築する際、3〜4本連続の矢印を潜在的なブレイクアウトシグナルとして解釈できます。 例えば、4本目の矢印が表示された時に取引を開始することを検討できます。 これは、市場の重要な動きを予測し、取引判断を最適化するための信頼できるツールです。 簡単に言えば、このインジケーターはローソク足パターンに基づいてシグナルを生成します: ローソク足は bearish だが、上ヒゲが前のローソク足を超える。 ローソク足は bullish だが、下ヒゲが前のローソク足を下回る。 強いシグナル,
シグナルが強いことを確認できます。 取引に入る前に「Data Window」でこれを確認すると、勝率が向上します。 このインジケーターを VolumeHedger EA と一緒に使用すると、非常に良い結果が得られ、場合によっては
FREE

The Forex Master Pattern is an alternative form of technical analysis that provides a framework which will help you to find and follow the hidden price pattern that reveals the true intentions of financial markets. This algorithm here does a good job detecting the Phase 1 of the Forex Master Pattern cycle, which is the contraction point (or Value).
On Phase 2 we get higher timeframe activation (also called Expansion), which is where price oscillates above and below the average price defined

簡単に言えば、現在のローソク足の横に「ピップス」として知られる白い数字の動きが現れ始めたら、取引を開始できます。白い「ピップス」は、買いまたは売りの取引が現在アクティブであり、白色で示されるように正しい方向に動いていることを示しています。白いピップスの動きが止まり、静的な緑色に変わったとき、それは現在のモメンタムの終了を示します。数字の緑色は、買いまたは売りの取引から得られた「ピップス」での総利益を表します。 さらに、インジケーター内の他の高度でプロフェッショナルな分析ツールに従って取引を開始することも可能です。インジケーターに表示されるシグナルや色を観察することで、高精度で多数のスキャルピングチャンスを捉えることができます。テスト中またはリアルチャート上でインジケーターの動作を理解しておくことをお勧めします。 ほとんどのFX市場に対応:金(ゴールド)や人気の株価指数市場(ダウ・ジョーンズ、S&P500、ナスダック、DAXなど)、およびEUR/USD、GBP/USD、USD/JPYなどの主要通貨ペアでの取引に最適です。また、ビットコイン、イーサリアム、ステーブルコインなどの主要な暗号

The indicator draws the time scale on the chart. You can specify the time offset, adjust the size and font to display on the chart ( it is displaying your local time on your chart instead of MT time ). You can also select the desired format for displaying the date and time. You may be interested in my other product , which contains a more advanced version of the Time Scale .
You can also find my other products here Parameters Hours (time shift) — time shift (hours); Minutes (time shift) — time
FREE

Market Structure ICT インジケーター 1. 自動化された市場構造 (Market Structure) 最大の利点は、主観的な判断によるミスを減らせることです。 正確なトレンド識別: トレンド継続のための BOS (Break of Structure) と、トレンド反転のための CHoCH (Change of Character) を自動的に識別します。 スイングの分類: ユーザーは市場構造のタイプ(短期、中期、長期)を選択でき、スキャルパーにもスイングトレーダーにも適しています。 2. プロフェッショナル・ダッシュボード 他のタイムフレームを確認するために画面を切り替える必要はありません。 一目でわかる分析: ダッシュボードは、1つの画面にすべてのタイムフレーム(M1からW1)のステータスを表示します。 スコアリングシステム: 小さなタイムフレームからのスコアを集計し、 全体的なバイアス (Overall Bias) (例:「強い強気」や「混在」)を要約します。これにより、自信を持ってエントリーできます。 トレンドの鮮度: BOSが「フレッシュブレイク(発生し

Multi timeframe ZigZag indicator. It displays the support/resistance horizontal lines and their breakouts, as well as draws the current targets of the market. It can also display lines of the Fractals indicator and candles from other periods (up to Quarterly). So, you can actually see the supply and demand levels. Indicator – connects key lows and highs to show trend lines. You can also use it as indicator for the Break of Structure(BOS) & Market Structure Shift(MSS). The indicator redraws the

RBC Range Bar Chart is a classical range bar chart indicator. The indicator features price ranges for charting: High/Low price range is a classical option for analysis. It also has Open, High, Low and Close prices. In the first option, two price values are analyzed at the same time, while other options only use one price. Conventionally, range bars are drawn using tick data but since tick data is not available on the server, charting is only possible based on bar data from standard time frames.
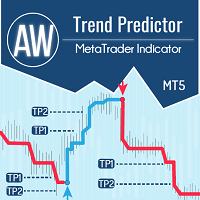
1 つのシステムでのトレンド レベルとブレイクダウン レベルの組み合わせ。高度なインジケーター アルゴリズムは、市場のノイズをフィルター処理し、トレンド、エントリー ポイント、および可能なエグジット レベルを決定します。インジケーターシグナルは統計モジュールに記録されるため、最適なツールを選択してシグナル履歴の有効性を示すことができます。この指標は、テイクプロフィットとストップロスのマークを計算します。 マニュアルと説明書 -> ここ / MT4 バージョン -> ここ インジケーターで取引する方法: Trend Predictor での取引は、たった 3 つの簡単なステップです。 ステップ 1 - ポジションを開く 70% 以上の成功率で買いシグナルが受信されました ステップ 2 - ストップロスの決定 逆信号でトランクを選択 ステップ 3 - テイクプロフィット戦略の定義 戦略 1: TP1 に到達したらポジション全体をクローズする 戦略 2: TP1 に達した時点でポジションの 50% をクローズし、TP2 に達した時点で残りの 50% をクローズします。 戦略 3:

Pips Chaser は、マニュアル取引を補完するために開発されたインジケーターです。このインディケータは短期スキャルピングと長期スイングトレードの両方に使用することができます // MT4バージョン
特徴 リペイントなしインジケーター このインディケータは、新しいデータが到着しても値を変更しません。 取引通貨ペア 全ての通貨ペア 時間軸 H1が望ましいが、どのタイムフレームにも適用可能。 取引時間 24時間 Buffers Buy Buffer: 0 / Sell Buffer: 1
必要条件
一部のポジションのスキャルピングには、スプレッドが狭いECNブローカーの利用が必須です。 中程度のインパクトと高いインパクトのニュースリリース時間には取引しないこと。
インストール方法
ご希望の取引ペア(H1推奨)にインジケータを装着してください。
設定方法
インジケーターの設定です 。 インジケーターのパラメータを変更し、自分に合った戦略を採用することができます。 追加設定 ここでは、インジケータの様々な部分の色を変更することができます。また、アラートの設定を変更することがで
FREE

The Market Structure Analyzer is a powerful tool designed for traders who follow market structure and smart money concepts. This comprehensive indicator provides a suite of features to assist in identifying key market levels, potential entry points, and areas of liquidity. Here's what it offers:
1. Swing High/Low Detection : Accurately identifies and marks swing highs and lows, providing a clear view of market structure.
2. Dynamic Supply and Demand Zones: Draws precise supply and demand zone
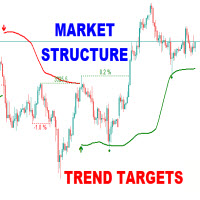
The Market Structure Trend Targets is a powerful trading indicator designed to give traders a clear, structured, and data-driven view of market momentum, breakouts, and key price reaction zones. Built on the principles of smart market structure analysis , it helps identify not only trend direction, but also precise breakout levels , trend exhaustion , and potential reversal zones — all with visual clarity and trader-friendly metrics. Key Features Breakout Points with Numbered Markers Track signi

TickFlow はティックデータを解析し、チャート上で重要なゾーンを視覚的に強調するツールです。現在および過去のティックを集計し、買い/売りの比率を表示し、サポート/レジスタンスレベルやクラスター領域の把握に役立ちます。 MetaTrader 4 用バージョンです。 動作概要(簡潔) TickFlow はティックデータを収集し、価格ステップとローソク足(キャンドル)ごとに集計します。
蓄積されたデータに基づいて、アップ/ダウンのティックカウンター、買い/売り比率、履歴レベル、クラスターといった可視化を構築します。
ユーザーは設定で感度や分析期間を調整できます。本ツールはトレードの判断を行うものではなく、分析用のデータを提供します。 特長 ローソク足ごとのティック活動表示(tick counters) 買い/売りの割合(パーセンテージ表示) ティック出来高に基づく履歴のサポート/レジスタンスレベル構築 価格領域のクラスター分析(cluster analysis) スキャルピング、デイトレード、中期取引など用途に応じた柔軟な感度設定 チャートの煩雑化を抑えるためのティック履歴の表示

Moving Average Convergence Divergence(MACD)トレーディング戦略は、勢いとトレンドの方向の変化を特定するために使用される人気のあるテクニカル分析ツールです。 MACDは、26期間の指数移動平均(EMA)から12期間のEMAを引いて計算されます。 MACDの上には、トリガーとして機能する9期間のEMAである「シグナルライン」がプロットされます。 MACDラインがシグナルラインの上にある場合、MACDはブルッシュ領域と見なされ、下にある場合はベア領域と見なされます。トレーダーはこの情報を使用して、潜在的な買いと売りの機会を特定することがよくあります。 MACDは多目的な指標であり、さまざまな方法で使用できます。一般的な使用方法のいくつかは次のとおりです。 クロスオーバー:MACDラインがシグナルラインを上回るときにはブルッシュクロスオーバーが発生し、MACDラインがシグナルラインを下回るときにはベアクロスオーバーが発生します。 ダイバージェンス:MACDが新しい高値をつけている間に基礎となるセキュリティがそうでない場合、ブルッシュダイバージェンスが発
FREE

The "Power of Three" (PO3) is a concept developed by the Inner Circle Trader (ICT) to illustrate a three-stage approach used by smart money in the markets: Accumulation, Manipulation, and Distribution . ICT traders view this as a foundational pattern that can explain the formation of any candle on a price chart. In simple terms, this concept is effective for any time frame, as long as there's a defined start, highest point, lowest point, and end. MT4 - https://www.mql5.com/en/market/product/1
FREE
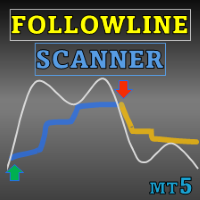
Special offer : ALL TOOLS , just $35 each! New tools will be $30 for the first week or the first 3 purchases ! Trading Tools Channel on MQL5 : Join my MQL5 channel to update the latest news from me Follow Line MT5 とスキャナーを使って、ボラティリティに基づいた高度なインジケーターでトレーディングエッジを最大限に活用しましょう。このツールは、カスタマイズ可能な設定とともに、ボリンジャーバンドの力を組み合わせ、価格の動きについて正確な洞察を提供します。 See more MT4 version at: Follow Line MT4 with Scanner See more products at: https://www.mql5.com/en/users/ndhsfy/seller Follow Line の鍵は、価格が 1 標準偏差に設
FREE

SuperTrend Alert MT5で市場トレンドをマスターしましょう。この強力なインジケーターは、外国為替、株式、暗号通貨、商品取引向けに正確なトレンド追従シグナルを提供するために設計されています。Forex FactoryやRedditのr/Forexなどのトレーディングコミュニティで称賛され、InvestopediaやTradingViewの議論でもその堅牢なトレンド検出能力で高く評価されており、信頼性の高いエントリーとエグジットを求めるトレーダーにとって必須のツールです。ユーザーは、SuperTrendのシグナルをプライスアクションと組み合わせることで、トレンド方向を最大90%の精度で特定し、リアルタイムアラートを活用してトレンドの変化を捉えることで、取引タイミングが25-35%向上したと報告しています。主な利点には、高度なトレンド分析、カスタマイズ可能な設定によるパーソナライズされた戦略、チャートを常に監視せずに意思決定を向上させる軽量デザインが含まれ、スカルパー、デイトレーダー、スイングトレーダーに最適です。 SuperTrend Alert MT5は、独自のアルゴリズ
FREE

What is the Volume Weighted Average Price (VWAP)? The volume weighted average price (VWAP) is a trading benchmark used by traders that gives the average price an instrument has traded at throughout the day, based on both volume and price. It is important because it provides traders with insight into both the trend and value of the instrument.
What is the Difference between VWAP and AVWAP? While VWAP is having as starting point the beggining of the day,week,month etc. in the AVWAP you can pla

Auto Fibonacci Retracement Indicator — Flexible and Reliable This isn’t just another Auto Fibonacci Retracement indicator. It’s one of the most flexible and dependable tools available . If you find it useful, please consider leaving a review or comment — your feedback means a lot! Check out my other helpful tools below: Smart Alert Manager - Set up advanced alerts and send them to Mobile, Telegram, Discord, Webhook...
Timeframes Trend Scanner - Scan the trend of assets in difference timefr
FREE

Trend Battle Indicator
Overview The Trend Battle Indicator is a professional technical analysis tool that reveals the battle between buyers (Bulls) and sellers (Bears) in the market through a comprehensive dashboard. Using an intuitive visual interface, the indicator offers a unique perspective on market power dynamics by analyzing the last twenty bars to provide precise insights into momentum and directional strength. Additionally, the panel provides automatic real-time updates for bars in for

RSI divergence indicator finds divergences between price chart and RSI indicator and informs you with alerts (popup, mobile notification or email). Its main use is to find trend reversals in the chart. Always use the divergence indicators with other technical assets like support resistance zones, candlestick patterns and price action to have a higher possibility to find trend reversals. Three confirmation type for RSI divergences: RSI line cross 50 level Price returns to previous H/L C
FREE
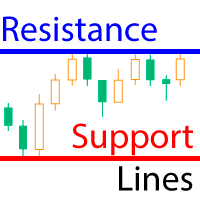
The indicator calculates fractal lines, which are technically psychological support/resistance lines. In fact, these are the highs and lows of the price over a period of time. The indicator works on all charts and timeframes. This free version of the Resistance Support Lines Pro indicator comes as is! Settings: These settings cannot be changed in this version Fractal Candels = 5 - number of candles from which a fractal is built. Calculates the maximum/minimum at which a psychological price can b
FREE
ろうそくの終わりまでの時間の指標。ろうそくの終わりまでの時間とサーバー時間を表示します。テキストはろうそくの傾向または方向を表示でき、サウンド通知が組み込まれています 特徴:
現在のろうそくの終わりまでの時間と、必要に応じて調整または無効にできる他の時間枠を表示します AWキャンドルタイムは、AWスーパートレンドインジケーターで現在のキャンドルまたはトレンドの方向を選択できます トレンド戦略は選択した色で強調表示されます ろうそく交換前の音通知と追加彩色を内蔵 表示は、現在の価格の横またはチャートの隅に設定でき、入力設定で柔軟に調整できます Instruction -> ここ / その他の製品 -> ここ 入力変数:
主要 Candle_Time_Location - ローソクのタイムスタンプの場所。チャートの隅または現在の価格の隣に配置できます Trend_Strategy - 色付きのろうそくのタイムスタンプを使用します。 AW SuperTrend インジケーターを使用して、トレンドの方向に色を付けることができます。現在のろうそくの方向に応じて色を付けることができ
FREE
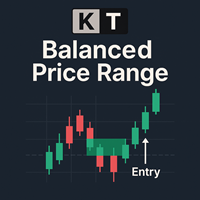
KT Balanced Price Rangeは、連続する反対方向の フェアバリューギャップ(FVG) の重なり合った領域をハイライトします。この概念はBalanced Price Range(BPR)として知られており、プライスアクショントレーダーの間で人気があり、特にSmart Money Concepts(SMC)やInner Circle Trader(ICT)の手法に従うトレーダーによく使用されます。 トレーダーは、これらのBPRゾーンを高確率のトレードセットアップとして使用することが多く、特にプルバック時やトレンド継続の局面で活用されます。BPRゾーンは、市場が反転したり、トレンドを継続したり、ブレイクアウトする可能性がある重要なエリアとして機能するため、エントリーやイグジットのタイミングを取る上で役立ちます。
特徴
完全なFVGの重なりのみを使用して、Balanced Price Range(BPR)ゾーンを特定するためにゼロから設計されており、質の高いトレード機会を提供します。 重要でないゾーンを除外するために、BPRのパーセンテージ閾値をカスタマイズ可能です。 各セ

Golden Spikes Indicator Technical indicator for synthetic indices trading on M1 timeframe. Compatible with Boom/Crash indices on Deriv platform and Gain/Pain indices on Weltrade platform. send me A private message to receive trade ASISTANT EA.. booklet guide: https://drive.google.com/file/d/1knQJqGHZSP5eQN24ndRz2ayZVCst6XhN/view?usp=sharing
Also check my premium spikes bot: https://www.mql5.com/en/market/product/142350 Features Uses Parabolic SAR, RSI, and Bollinger Bands analysis Three risk

Documentation for connecting Metatrader 5 with Python with a simple drag and drop EA.
A full end-to-end solution ,fully tested ,fast and efficient!
The Pytrader ecosystem consists of a python script and a MT5 or MT4 version EA.
Further for the licensing an indicator is used.
The communication between the python script and the EA is based on sockets.
EA is the Server and the python script the Client .
It is always query(function / python script) and output(data / server).
T
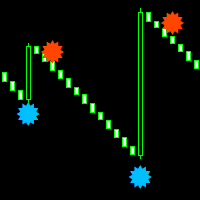
Boom and crash smasher free indicator that works on all timeframe from the one minute to the monthly timeframe. the indicator is 100% non-repaint. the indicator come with sound alerts and email push notification the indicator appears on the current candle stick for faster entries can be used on all charts and renko charts orange dot is your sell signal blue dot is your buy signal
FREE

ツインピークインジケーターMT5へようこそ --(ダブルトップ/ボトム)-- ダブルトップアンドボトムインジケーターは、市場の潜在的な反転パターンを特定するために設計されたテクニカル分析ツールです。
これは、価格がほぼ同じ高さの 2 つの連続した山または谷を形成し、その後、反対方向に価格が変動した領域を特定します。
このパターンは、市場が勢いを失いつつあり、トレンド反転の準備ができている可能性があることを示しています。 ※購入後、 説明書と手順ガイドをお送りしますのでご連絡ください。 特徴:
チャートの自動注釈: インディケータはチャート上のダブルトップとボトムのパターンを自動的にマークします。 使いやすさ: このインジケーターはユーザーフレンドリーで、MT5 プラットフォームのどのチャートにも簡単に適用できます。 カスタマイズ可能: インジケーターにはカスタマイズ可能な設定があります カスタマイズされたアラート 。 あらゆる楽器で動作します。 このインジケーターを他のテクニカル分析ツールと組み合わせて使用すると、トレンドの方向と反転パターンの潜在的な強さを確認できま

Fine Timeframesは、MT5用の1分足以下の時間足インジケーターです。1秒から30秒までの間隔でチャートを作成し、分足や時間足チャートでは見えない市場の動きを把握しながら、取引機能を完全に維持します。つまり、標準の時間足と同様にポジションを開閉できます。 Fine Timeframes はライブティックでのみ機能し、戦略テスター用に設計されていません。 デモ バージョンをダウンロードし 、EURUSD および AUDUSD の実際の市場条件下でインジケーターをテストしてください。 主な特徴 • 範囲は 1 秒から 30 秒で、ワンクリックで時間枠を切り替えることができます。 • チャートから直接フル取引:Fine Timeframes は内蔵の端末機能をブロックしません。通常の時間枠と同様に、秒単位のチャート上で標準の MT5 コントロールを使用して取引を開始したり、保留注文を出したり、ポジションを管理したりできます。 • 柔軟な表示設定:3 種類のチャート(ローソク足、棒グラフ、折れ線グラフ)、4 種類のカラー スキーム。
ユースケース • ニュース取引 - 重要な経済

エキスパートアドバイザー (EA) バージョン
手動シグナルではなく自動売買を希望する場合は、こちらでこのインジケーターのエキスパートアドバイザー版をご利用いただけます:
https://www.mql5.com/en/market/product/148222
このインジケーターは、ローソク足が ボリンジャーバンド(Bollinger Bands) の外側に抜けた後に価格が再びバンド内に戻る リエントリ(再突入)タイミング を計算し、それを RSIによる確認 と組み合わせて誤検知を減らします。
価格が下側のバンドの下に出た後に再び内部に戻り、かつ(オプションで)RSIがちょうど**オーバーソールド(売られ過ぎ)**状態から抜けたときに、**Buy ReEntry(買い再突入) シグナルが検出されます。
価格が上側のバンドの上に出た後に再び内部に戻り、かつ(オプションで)RSIがちょうど オーバーボート(買われ過ぎ)**状態から抜けたときに、**Sell ReEntry(売り再突入)**シグナルが生成されます。
シグナルはチャート上に矢印で表示され、視認性を高めるために高値/安値
FREE

CGE Trading Suite is a market analysis system designed to eliminate guesswork from trading. It continuously adapts to real-time price behavior, helping traders stay aligned with key market levels and evolving market conditions. This comprehensive system integrates multiple analytical tools into a single workflow, including dynamic grid mapping, liquidity behavior analysis, ECM, trend lines, supply and demand zones, MIDAS, trade cycles, and directional channel projections. Together, these tools p

次のトレードが心配ですか?戦略が本当に機能しているのか分からないことに疲れましたか? CRT Liquidity Proを使えば、感情ではなく実際の統計データでトレードできます。確率を知り、パフォーマンスを追跡し、「3の力」、スマートな流動性検出、CRT確認に基づいて自信を持ってトレードできます。 CRT Liquidity戦略の現実を見たいですか?購入後、 お問い合わせください 、他の製品を1つ無料で提供します。
他の製品をチェック して、さらに実際の戦略を確認し、 Real Tradesコミュニティに参加 して、自信を持ってトレードし、本物のトレーダーとつながりましょう! CRT Liquidity Proを使う理由: スマート流動性検出 – 前のセッション、日次、週次、月次のレベルから流動性ゾーンを自動的に検出します。 「3の力」(PO3)統合 – より高い時間枠の現在のキャンドルを確認し、リアルタイムで主要なトレンドを簡単に見ることができます。市場が蓄積、操作、拡大の準備をしているタイミングを知ることができます。 精密な流動性シグナル – 最大3つのテイクプロフィットとストッ

アダプティブADR アダプティブADR は、平均日中レンジ(ADR)を計算・表示するためのプロフェッショナル向けインジケーターで、日々の値動きの特徴を把握したいトレーダーに最適です。柔軟な設定により、さまざまな市場環境に対応できます。 計算と手法 4種類の平滑化: SMA、EMA、SMMA(Wilder)、LWMA トレードスタイルやボラティリティモデルに合わせて選択可能 トレンド相場・レンジ相場どちらにも対応 ダイナミックデイロジック 取引開始と同時に自動起動 始値を中心に2つの対称レベルを設定 ADR到達までレベルが徐々に収束 到達後は終日固定され、日内の値動きの限界を明確化 異常なボラティリティや過伸びの判断にも役立つ 視覚ガイド 始値ラインの表示が可能 色、ラインスタイル、透明度、表示設定を自由に調整 どのチャートテーマにも自然に馴染むデザイン メリット 明確なイントラデイ構造 日々のボラティリティを正確に評価 ブレイクアウト、平均回帰、ボラティリティ戦略に最適 過剰なエントリーを避け、効率的なトレード判断をサポート

Volume Weighted Average Price (VWAP) The volume weighted average price (VWAP) is a trading benchmark used by traders that gives the average price a security has traded at throughout the day, based on both volume and price. It is important because it provides traders with insight into both the trend and value of a security. This indicator VWAP V2 is free and is the manual version of the extended Easy VWAP indicator (30 Euro), where the date and time properties are automatically entered. With
FREE
MetaTraderマーケットはMetaTraderプラットフォームのためのアプリを購入するための便利で安全な場所を提供します。エキスパートアドバイザーとインディケータをストラテジーテスターの中でテストするためにターミナルから無料のデモバージョンをダウンロードしてください。
パフォーマンスをモニターするためにいろいろなモードでアプリをテストし、MQL5.community支払いシステムを使ってお望みのプロダクトの支払いをしてください。
取引の機会を逃しています。
- 無料取引アプリ
- 8千を超えるシグナルをコピー
- 金融ニュースで金融マーケットを探索
新規登録
ログイン