RSI Pro Analyser MT5

The RSI Pro Analyzer Indicator is a powerful tool designed for traders looking to make informed decisions across multiple time frames simultaneously. This indicator uses the RSI to provide overbought, oversold and trend signals, making it easier to identify market entry opportunities. Its main advantage is its ease of reading thanks to its clear and distinct color codes to indicate different market conditions.

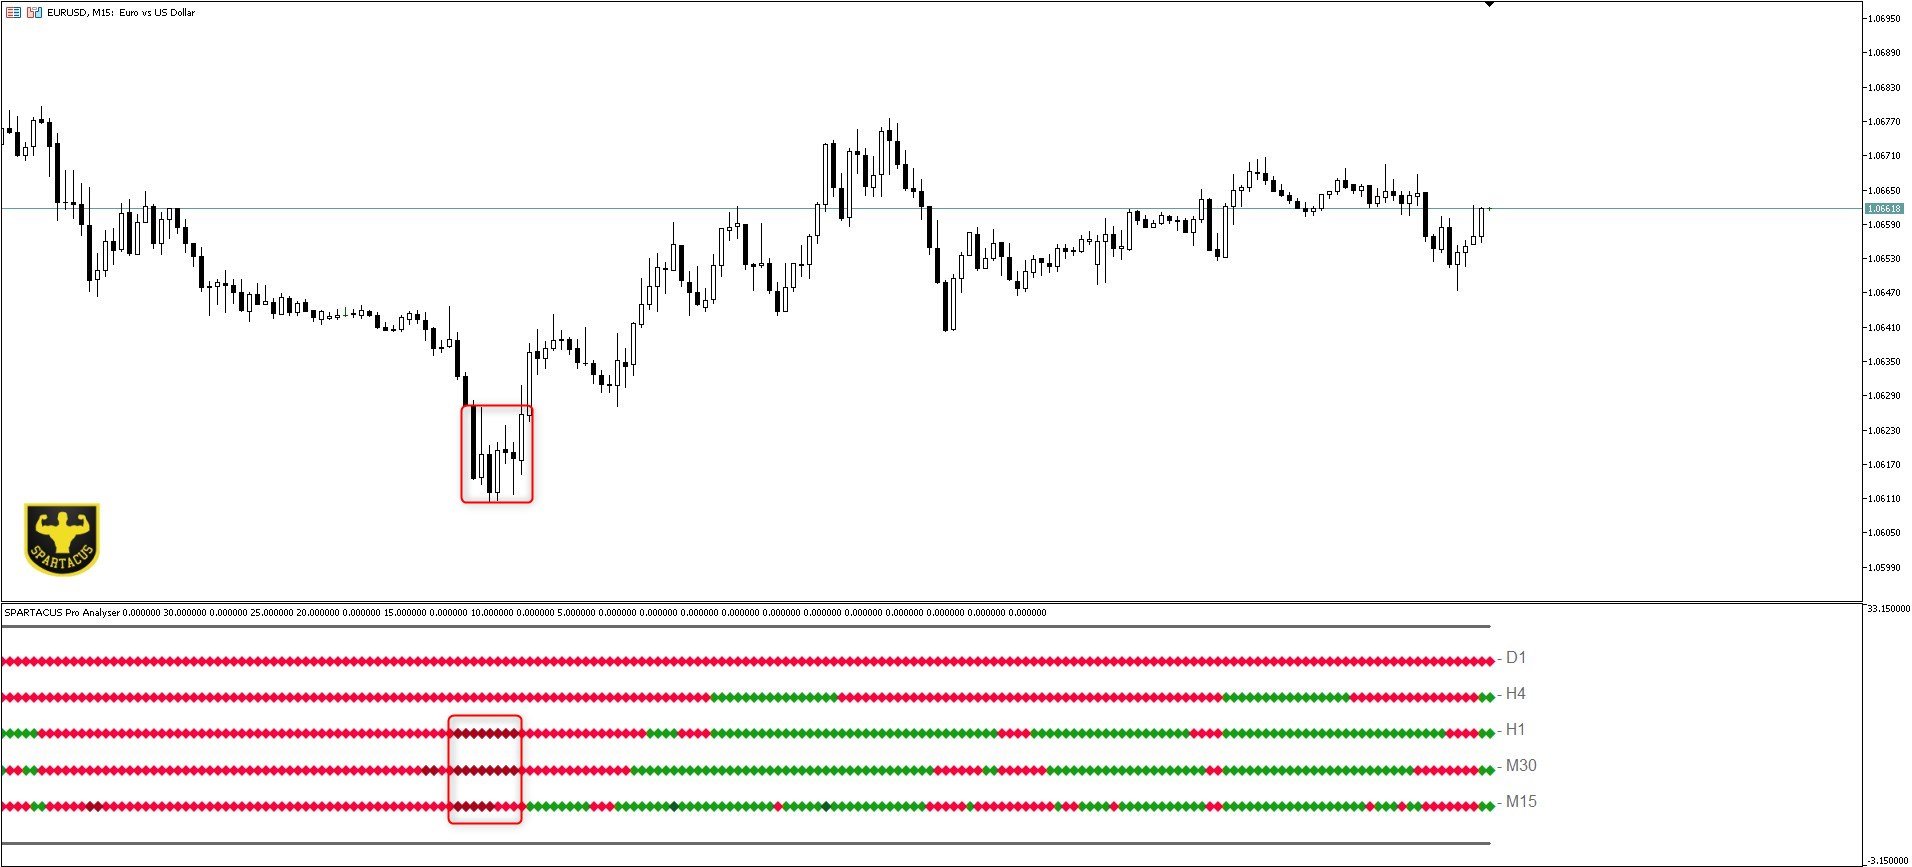
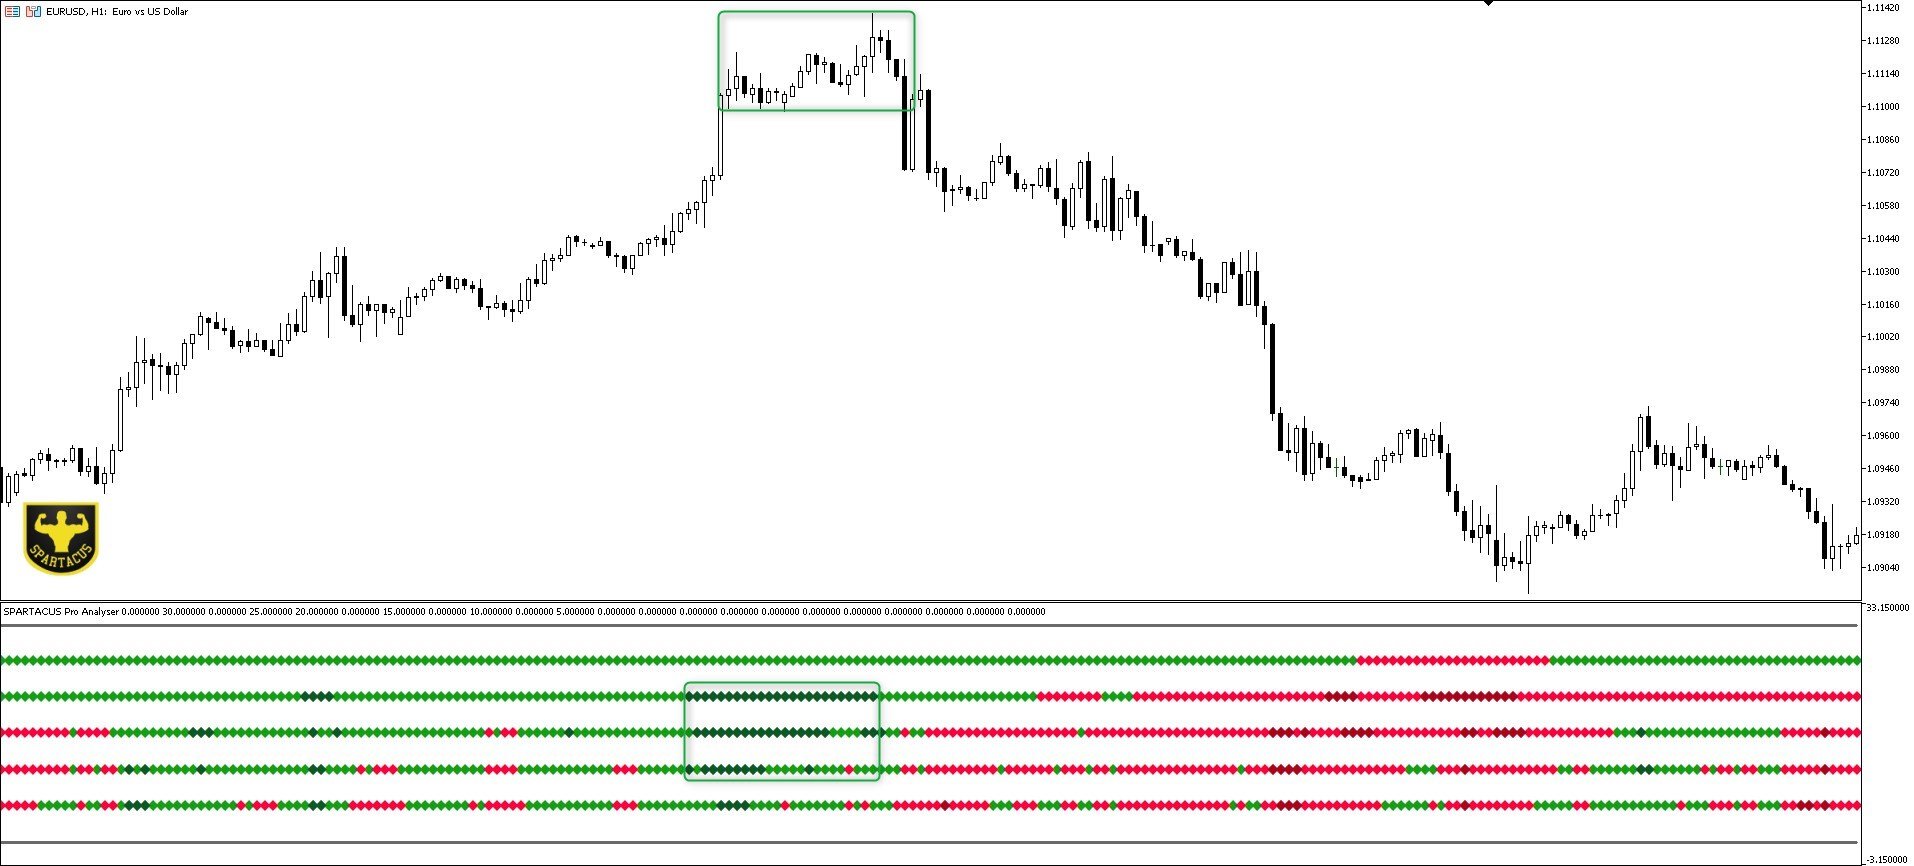
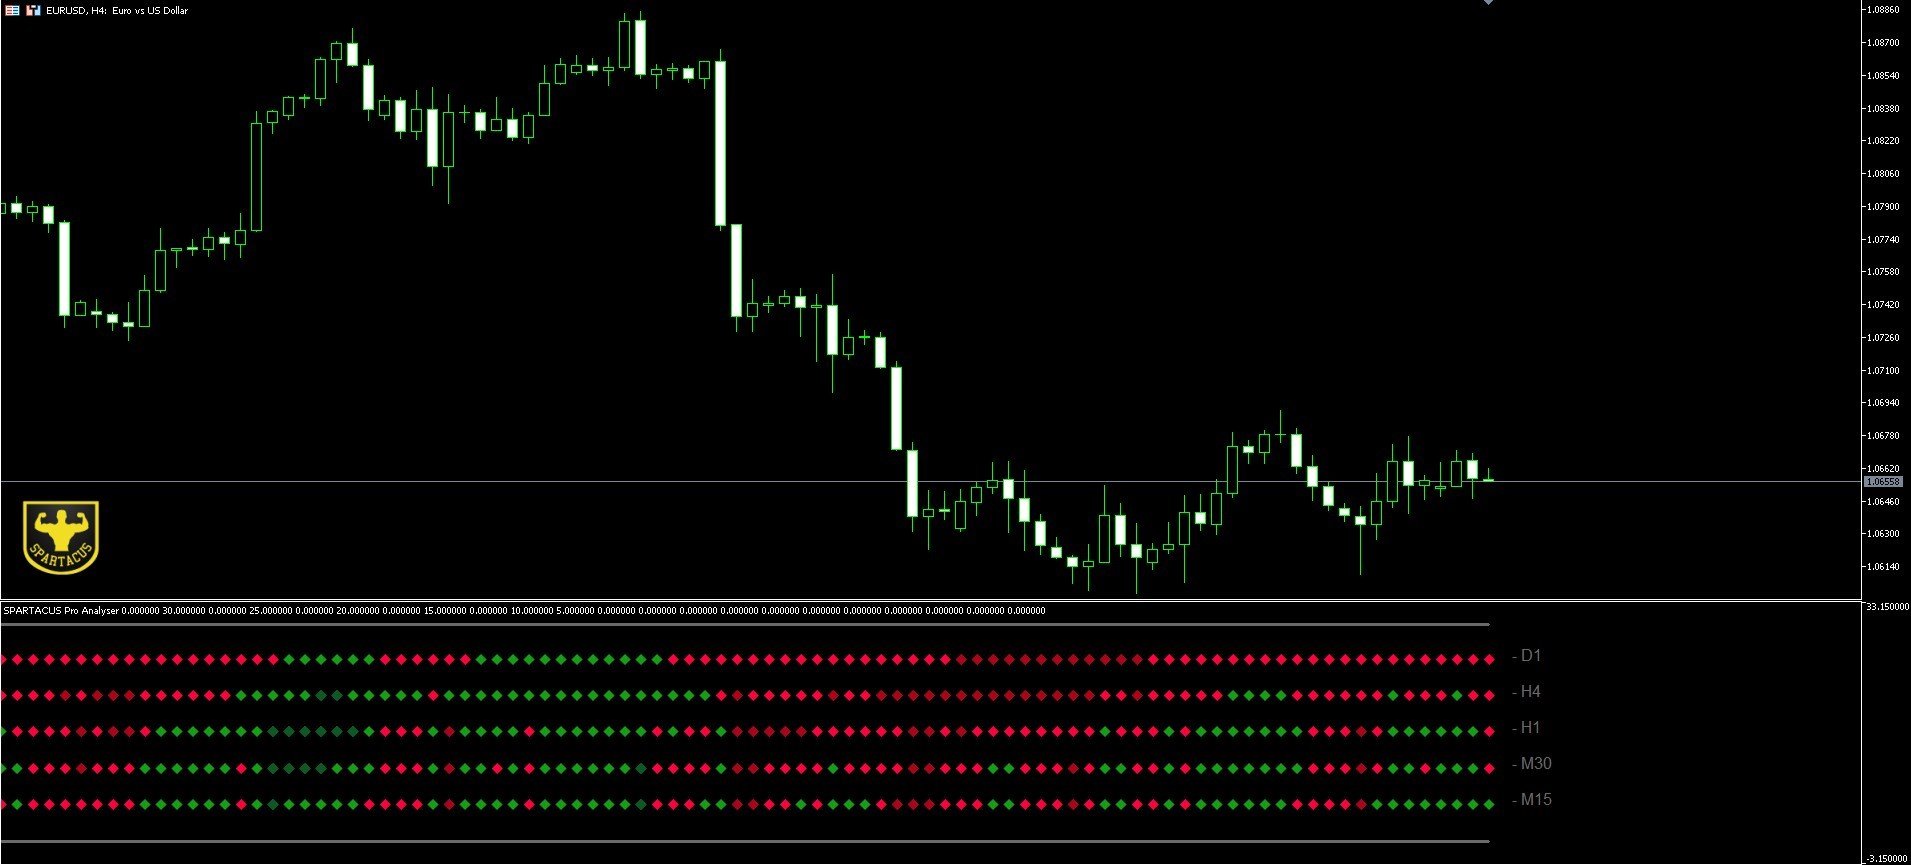
The indicator displays RSI values and associated signals in five different time frames (D,H4,H1,M30,M15), allowing traders to get a comprehensive market perspective and make informed decisions on multiple time horizons.
Use color changes to identify trends and potential reversals across different time frames. Look for overbought and oversold areas to spot counter-trend or trend reversal trading opportunities.

Red: RSI indicating a downtrend.
Green: RSI indicating an uptrend.
Dark red: RSI signaling an oversold area.
Dark green: RSI signaling an overbought zone.

You can also be notified of purchase and sale entries by precise alerts which can be sent by Pop Up, email and Push notification.
The RSI Pro Analyzer indicator is a complementary tool in the trader's decision-making process. It is recommended to use it in conjunction with other indicators and analyzes to get an overview of the market.


MT4 version.


Input parameter:

RSI Period: 14 (default), adjustable according to your preferences.

Enable/disable alert: Enable or disable the 3 types of alerts, Pop Up/mail and Push notification.

Buy/Sell Text: Fully configurable alert text.


SPARTACUS®2024
Recommended products
MACD Pro Master
Itumeleng Mohlouwa Kgotso Tladi
MACD Pro Master The MACD Pro Master is your ultimate trading companion, designed to revolutionize your financial journey and unlock the doors to wealth. Here's why it's the next best thing since sliced bread: Advantages Precision Trading : The MACD Pro Master leverages the powerful Moving Average Convergence Divergence (MACD) indicator to provide accurate buy and sell trades,  ensuring you capitalize on every market opportunity. Customizable Settings : Tailor the trading strategy to your unique
RBreaker
Zhong Long Wu
RBreaker Gold Indicators is a short-term intraday trading strategy for gold futures that combines trend following and intraday reversal approaches. It not only captures profits during trending markets but also enables timely profit-taking and counter-trend trading during market reversals. This strategy has been ranked among the top ten most profitable trading strategies by the American magazine   Futures Truth   for 15 consecutive years. It boasts a long lifecycle and remains widely used and st
Universal Soul Reaper
Pieter Gerhardus Van Zyl
Universal Soul Reaper is an atmospheric market-flow oscillator designed to interpret price behavior as a cycle of spiritual energy. Instead of reacting to raw price alone, it visualizes the state of the market’s soul —revealing when momentum is awakening, stabilizing, or fading. The indicator operates in a separate window and presents three interwoven entities: the Ectoplasmic Veil , the Spirit Boundary , and the Soul Core . Together, they form a living framework that helps traders sense pressu
Gobbo MT5
Alessandro Grossi
Gobbo è un indicatore professionale che evidenzia il trend del mercato con un aspetto grafico chiaro e comprensibile, è basato sulla Moving Average e può essere impostato su qualsiasi periodo di intervallo, di default impostato sul periodo 14, scegliendo un periodo più alto evidenzierà meno cambi di tendenza per un approccio sul medio o lungo periodo, con un periodo più basso più cambi di tendenza per un approccio sul breve termine L'aggiornamento e l'adattamento al time frame scelto avviene in
CosmiCLab SMC FIBO CosmiCLab SMC FIBO is a professional trading indicator designed for traders who use Smart Money Concepts (SMC), market structure analysis and Fibonacci retracement levels. The indicator automatically detects market swings and builds Fibonacci levels based on the latest impulse movement. It also identifies market structure changes such as BOS (Break of Structure) and CHOCH (Change of Character), helping traders understand the current market direction. CosmiCLab SMC FIBO also pr
Heiken Ashi Smoothed Strategy is a very simple but powerful system to get forex market trend direction. This indicator is actually 2 indicators in 1 pack, Heiken Ashi and Heiken Ashi Smoothed Moving Average both included. Because HA (Heiken Ashi) and HAS (Heiken Ashi Smoothed) are calculated in the same one system event with necessary buffers and loop only, so it is the FAST, OPTIMIZED and EFFICIENT HA having the combined indicator of MetaTrader 5. You can choose to display HA and HAS in the sam
STRICTLY FOR BOOM INDEX ONLY!!!!! Here I bring the Maximum Trend Arrows OT1.0 MT5 indicator. This indicator is made up of a combination of different trend indicators for entries and exits, for entries an orange arrow will paint on the chart below the current market and a red flag for closing of trades and it produces buy arrows only. When the orange arrow appears, it will appear along with it's sound to notify you. The 1H timeframe is recommended, don't use it anywhere else than on the 1H timefr
PipFinite Trend PRO MT5
Karlo Wilson Vendiola
4.84 (557)
Breakthrough Solution For Trend Trading And Filtering With All Important Features Built Inside One Tool! Trend PRO's smart algorithm detects the trend, filters out market noise and gives entry signals with exit levels. The new features with enhanced rules for statistical calculation improved the overall performance of this indicator. Important Information Revealed Maximize the potential of Trend Pro, please visit www.mql5.com/en/blogs/post/713938 The Powerful Expert Advisor Version Automatin
Noize Absorption Index - is the manual trading system that measures the difference of pressure between bears forces and bulls forces. Green line - is a noize free index that showing curent situation. Zero value of index shows totally choppy/flat market.Values above zero level shows how powerfull bullish wave is and values below zero measures bearish forces.Up arrow appears on bearish market when it's ready to reverse, dn arrow appears on weak bullish market, as a result of reverse expectation.
Rainbow EA MT5
Jamal El Alama
Description : Rainbow EA MT5 is a simple Expert advisor based on   Rainbow MT5 indicator witch is based on Moving average with period 34. The indicator is incorporated in the EA, therefore, it is not required for the EA to operate, but if you wish, you can download it from   my product page . The Expert Advisor settings are as follows : Suitable for Timeframes up to H1 The parameters below can be set according to your trading rules. StopLoss ( Stop Loss in pips) TakeProfit ( Take Profit in pips
"Impulses and Corrections 5" is created to help traders navigate the market situation. The indicator shows multi-time frame upward and downward "Impulses" of price movements. These impulses are the basis for determining the "Base" , which is composed of zones of corrections of price movements, as well as "Potential" zones for possible scenarios of price movement. Up and down impulses are determined based on a modified formula of Bill Williams' "Fractals" indicator. The last impulse is always "U
Supertrend indicator uses a combination of a moving average and average true range to detect the trend of a trading instrument. Supertrend indicator for MetaTrader 5 easily shows the trend as a line following the price. Triple SuperTrend Histo indicator  calculate  three supertrends to show the trend as a histogram. Changing the color from red to green means you can BUY , from green to red means you can SELL . Description of the method of drawing a histogram. The price is above the EMA 200,
DAILY OH/OL SDEV QUANT MODEL - STATISTICAL TRADING WITH PRECISION RISK MANAGEMENT TRADE WITH MATHEMATICAL CERTAINTY - KNOW YOUR EXACT STOP-LOSS AND TAKE-PROFIT BEFORE YOU ENTER This indicator analyzes 5,000+ days of price history to give you: Exact entry levels (sigma bands locked at daily open) Exact stop-loss distance (from M
The RSI Divergence + FVG Signal indicator combines Relative Strength Index (RSI) Divergence with Fair Value Gap (FVG) detection to generate high-probability buy and sell signals based on both momentum shifts and institutional imbalance zones. Core Features: RSI Divergence Detection : Identifies both regular and hidden bullish/bearish divergences between price and RSI. Divergences indicate potential trend reversals or continuation. FVG Zone Recognition : Detects Fair Value Gaps (imbalances caused
Fellow Traders, If you've ever spent 30+ minutes manually scanning charts for divergence setups — only to miss the entry — this thread is for you. I've just released the Divergence Dashboard, a professional-grade automated scanner that detects Regular and Hidden divergences across all your favourite pairs and timeframes, using your choice of 10 different oscillators — with signals that never repaint. See more MT4 version at:  Divergence Dashboard MT4 See more products at:   All P roducts For liv
# DRAWDOWN INDICATOR V4.0 - The Essential Tool to Master Your Trading ## Transform Your Trading with a Complete Real-Time Performance Overview In the demanding world of Forex and CFD trading, **knowing your real-time performance** isn't a luxury—it's an **absolute necessity**. The **Drawdown Indicator V4.0** is much more than a simple indicator: it's your **professional dashboard** that gives you a clear, precise, and instant view of your trading account status. --- ## Why This Indicator
This indicator is used to compare the relative strength of the trade on the chart against the other several selected symbols. By comparing the price movement of each traded variety based on the same base day, several trend lines of different directions can be seen, reflecting the strong and weak relationship between the several different traded varieties, so that we can have a clearer understanding of the market trend. For example, you can apply this indicator on a EurUSD chart and compare it w
Naturu
Ivan Stefanov
5 (1)
'Naturu' is a manual indicator that uses nature’s symmetry as its algorithm. Master the market with a simple strategy and hidden wisdom!   This is a manual indicator and contains features that are not supported by the MetaTrader testing environment When you load the indicator, you’ll see two lines—Top and Bottom. Click once on a line to activate it. To move it, simply click on the candlestick where you want it placed. You define a high point and a low point, and the indicator then calculates
TendencyView is an MQL5 indicator/expert designed to display and analyze the trend of a financial asset (the current symbol) across multiple timeframes in parallel: H1, H4, and D1. It calculates fast and slow moving averages for each timeframe, compares their crossovers, and determines the trend: TREND_UP (bullish)  -> Fast MA > Slow MA TREND_DOWN (bearish)  -> Fast MA < Slow MA TREND_SIDEWAYS (sideways)  -> No clear consensus On the chart, regardless of the timeframe, it displays color panels
ADX ClrDynamic  MTF Dashboard: The Ultimate Multi-Timeframe Trend and Momentum Command Center Tired of switching between timeframes to get the full market picture? Most ADX indicators show you only one timeframe at a time, forcing you to piece together the puzzle manually.   ADX ClrDynamic MTF indicator   changes everything by displaying up to 8 timeframes simultaneously in a single, elegant dashboard. This isn't just an indicator; it's your complete multi-timeframe decision-engine that identifi
HMA Trend Professional MT5
Pavel Zamoshnikov
4.25 (4)
Improved version of the free HMA Trend indicator (for MetaTrader 4) with statistical analysis. HMA Trend is a trend indicator based on the Hull Moving Average (HMA) with two periods. HMA with a slow period identifies the trend, while HMA with a fast period determines the short-term movements and signals in the trend direction. The main differences from the free version: Ability to predict the probability of a trend reversal using analysis of history data. Plotting statistical charts for analyzi
Master Edition
Peter Ofunda Fischer
Harvester Pro Universal Master The Ultimate Volatility Breakout & Trend-Following Solution for XAUUSD and Major Pairs. Harvester Pro Universal Master is a professional-grade Expert Advisor (EA) engineered for high-performance trading on the MetaTrader 5 (MT5) platform. Optimized specifically for XAUUSD (Gold) and major currency pairs like EURUSD , this EA combines a sophisticated Volatility Breakout engine with a robust EMA/TEMA Trend-Following filter to capture explosive market moves with surg
ATrend
Zaha Feiz
4.83 (18)
ATREND: How It Works and How to Use It How It Works The " ATREND " indicator for the MT5 platform is designed to provide traders with robust buy and sell signals by utilizing a combination of technical analysis methodologies. This indicator primarily leverages the Average True Range (ATR) for volatility measurement, alongside trend detection algorithms to identify potential market movements. Leave a massage after purchase and receive a special bonus gift. Key Features: ⦁ Dynamic Trend Detect
# RSI Pro Alert - Advanced RSI Indicator A powerful professional-grade RSI indicator with intelligent alerts, scheduled snapshots, and multi-dimensional notifications to help you capture market opportunities with precision! --- ## Key Features ### Smart Signal Detection - **Precision Cross Detection** : Automatically identifies critical moments when RSI crosses overbought/oversold levels - **State Tracking Mechanism** : Real-time monitoring of market state changes (Overbought/Overso
Introduction The "Two Moving Average Crossover" indicator for MetaTrader 5 (MT5) is a technical analysis tool that displays two moving averages and notifies when the moving averages cross each other. The indicator calculates and plots two moving averages, one of which is faster and the other is slower. When the faster moving average crosses above the slower moving average, it is considered a bullish signal, indicating a potential trend reversal or the start of a new uptrend. Conversely, when th
Crash 600 Precision Spike Detector The Crash 600 Precision Spike Detector is an essential tool designed to help traders navigate the Crash 600 market with accuracy and efficiency. Packed with advanced features, this indicator provides precise alerts that allow traders to capture spikes and reversals with confidence. Key Features: Non-Repainting Signals: Dependable, non-repainting signals that ensure your trading decisions are based on real-time, accurate data. Audible Alerts: Receive sound notif
Wave Trend MT5
Diego Arribas Lopez
MT4 Version Wave Trend MT5 Wave Trend is an oscillator, which helps identifing in a extremely accurate manner market reversals. The Oscillator being obove the overbought level and a cross down of the fast into the slow MA usually indicates a good SELL signal. If the oscillators is below the oversold level and the fast MA crosses over the slower MA usually highlights a good BUY signal. The Wave Trend indicator can be also used when divergences appear against the price, indicating the current move
TRI Visualizer
Yoshimi Mon 三 Ura
TRI Visualizer MT5 – Thermodynamic Market Analysis Overview The TRI (Thermal Range Indicator) Visualizer Enhanced is a rare market analysis indicator that goes beyond conventional technical analysis, applying principles of thermodynamics from physics. It interprets market price fluctuations as “thermodynamic energy,” enabling the highly accurate detection of subtle market changes that are often overlooked. Innovative Mechanisms 1. Dual Calculation Engines Classic TRI Mode Formula: |Close
Identify precise entry and exit points with AB=CD patterns This indicator finds AB=CD retracement patterns. The AB=CD Retracement pattern is a 4-point price structure where the initial price segment is partially retraced and followed by an equidistant move from the completion of the pullback, and is the basic foundation for all harmonic patterns. [ Installation Guide | Update Guide | Troubleshooting | FAQ | All Products   | Get Help ] Customizable pattern sizes Customizable AC and BD ratios
DESCRIPTION ICSM (Impulse-Correction SCOB Mapper) is the indicator that analyzes the price movement and identifies valid impulses, corrections and SCOBs (Single Canndle Ordere Block). It is a powerful tool that can be used with any type of technical analysis because it's flexible, informative, easy to use and it does substantially improve trader's awareness of the most liquid zones of interest. SETTINGS General | Visuals Colour theme — defines the colour theme of the ICSM. SCOB | Visuals Show
Buyers of this product also purchase
ARIPoint
Temirlan Kdyrkhan
ARIPoint is a powerful trading companion designed to generate high-probability entry signals with dynamic TP/SL/DP levels based on volatility. Built-in performance tracking shows win/loss stats, PP1/PP2 hits, and success rates all updated live. Key Features: Buy/Sell signals with adaptive volatility bands Real-time TP/SL/DP levels based on ATR Built-in MA Filter with optional ATR/StdDev volatility Performance stats panel (Success, Profit/Loss, PP1/PP2) Alerts via popup, sound, push, or email Cu
SuperScalp Pro
Van Minh Nguyen
4.57 (21)
SuperScalp Pro – Advanced Multi-Filter Scalping Indicator System SuperScalp Pro is an advanced scalping indicator that combines the classic Supertrend with multiple intelligent confirmation filters to help identify trading opportunities. It works efficiently across multiple timeframes from M1 to H4, with optimized performance on XAUUSD, BTCUSD, and major Forex pairs. The indicator provides clear Buy and Sell signals, along with automatically calculated entry price, stop loss, and take profit lev
Divergence Bomber
Ihor Otkydach
4.9 (86)
Each buyer of this indicator also receives the following for free: The custom utility "Bomber Utility", which automatically manages every trade, sets Stop Loss and Take Profit levels, and closes trades according to the rules of this strategy Set files for configuring the indicator for various assets Set files for configuring Bomber Utility in the following modes: "Minimum Risk", "Balanced Risk", and "Wait-and-See Strategy" A step-by-step video manual to help you quickly install, configure, and s
Entry In The Zone and SMC Multi Timeframe is a real-time 2-in-1 market analysis tool that combines market structure analysis and a No Repaint BUY / SELL signal system into a single indicator, built on Smart Money Concepts (SMC) — a widely adopted framework used by professional traders to understand market structure. This indicator helps you see the market more clearly, make decisions based on structure rather than guesswork, and focus on high-probability zones where price is more likely to react
Quantum TrendPulse
Bogdan Ion Puscasu
5 (23)
Introducing Quantum TrendPulse , the ultimate trading tool that combines the power of SuperTrend , RSI , and Stochastic into one comprehensive indicator to maximize your trading potential. Designed for traders who seek precision and efficiency, this indicator helps you identify market trends, momentum shifts, and optimal entry and exit points with confidence. Key Features: SuperTrend Integration: Easily follow the prevailing market trend and ride the wave of profitability. RSI Precision: Detect
Power Candles MT5
Daniel Stein
4.75 (8)
Power Candles – Strength-Based Entry Signals for Any Market Power Candles brings Stein Investments’ proven strength analysis directly onto your price chart. Instead of reacting to price alone, each candle is colored based on real market strength, allowing you to instantly identify momentum build-ups, strength acceleration, and clean trend transitions. This tool is part of the Stein Investments ecosystem.  Browse all 18 tools, get AI-powered setup recommendations,  and join the community at http
Azimuth Pro
Ottaviano De Cicco
5 (7)
Azimuth Pro V2: Synthetic Fractal Structure and Confirmed Entries for MT5 Overview Azimuth Pro is a multi-level swing structure indicator by Merkava Labs . Four nested swing layers, swing-anchored VWAP, ABC pattern detection, three-timeframe structural filtering, and closed-bar confirmed entries — one chart, one workflow from micro-swings to macro-cycles. This is not a blind signal product. It is a structure-first workflow for traders who care about location, context, and timing. V2 Launch Offe
Gann Made Easy   is a professional and easy to use Forex trading system which is based on the best principles of trading using the theory of W.D. Gann. The indicator provides accurate BUY and SELL signals including Stop Loss and Take Profit levels. You can trade even on the go using PUSH notifications. PLEASE CONTACT ME AFTER PURCHASE TO GET TRADING  INSTRUCTIONS   AND GREAT EXTRA INDICATORS   FOR FREE! Probably you already   heard   about the Gann trading methods before. Usually the Gann theory
New Update of   Smart Trend Trading System MT5 For  2026 Market: If You Buy this Indicator you will Get my Professional Trade Manager + EA  for FREE . First of all Its worth emphasizing here that this Trading System is Non-Repainting   , Non Redrawing and Non Lagging Indicator Which makes it ideal from both manual and robot trading .  [Online course] , [manual] and [download presets] . The Smart Trend Trading System MT5 is a comprehensive trading solution tailored for new and experienced traders
FX Trend MT5 NG
Daniel Stein
5 (4)
FX Trend NG: The Next Generation Multi-Market Trend Intelligence Overview FX Trend NG is a professional multi-timeframe trend and market monitoring tool designed to give you a complete structural overview of the market in seconds. Instead of switching between dozens of charts, you instantly see which symbols are trending, where momentum is fading, and where strong alignment exists across timeframes. This tool is part of the Stein Investments ecosystem.  Browse all 18 tools, get AI-powered set
SignalTech MT5 is a trading system for EURUSD, USDCHF, USDJPY, AUDUSD, NZDUSD, EURJPY, AUDJPY, NZDJPY, CADJPY H2 and H3 Timeframe.  It can generate signals with Buy/Sell Arrows and Pop-Up/Sound Alerts. Each signal has clear Entry and Stop Loss levels, which should be automatically flagged on the chart, as well as potential Targets 1, 2, and 3. The Entry and TP levels are fixed after the trade is taken. The exit level is dynamic. If there are signs of a potential short-term trend reversal, the
Let's be honest first. No indicator will make you profitable on its own. If someone tells you otherwise, they're selling you a dream. Every indicator that shows perfect buy/sell arrows can be made to look flawless — just zoom into the right window of history and screenshot the winners. We won't do that. SMC Intraday Formula is a tool. It reads the market structure for you, maps the highest-probability price zones, and tells you exactly what the smart money footprint looks like right now — in pl
Introducing   Quantum Breakout PRO , the groundbreaking MQL5 Indicator that's transforming the way you trade Breakout Zones! Developed by a team of experienced traders with trading experience of over 13 years,   Quantum Breakout PRO   is designed to propel your trading journey to new heights with its innovative and dynamic breakout zone strategy. Quantum Breakout Indicator will give you signal arrows on breakout zones with 5 profit target zones and stop loss suggestion based on the breakout b
Grabber System MT5
Ihor Otkydach
4.83 (23)
Let me introduce you to an excellent technical indicator – Grabber, which works as a ready-to-use "All-Inclusive" trading strategy. Within a single code, it integrates powerful tools for technical market analysis, trading signals (arrows), alert functions, and push notifications. Every buyer of this indicator also receives the following for free: Grabber Utility for automatic management of open orders Step-by-step video guide: how to install, configure, and trade with the indicator Custom set fi
Meravith MT5
Ivan Stefanov
5 (1)
Market makers' tool. Meravith will: Analyze all timeframes and display the current trend in force. Highlight liquidity zones (volume equilibrium) where bullish and bearish volumes are equal. Display all liquidity levels across different timeframes directly on your chart. Generate and present text-based market analysis for your reference. Calculate targets, support levels, and stop-loss points based on the current trend. Compute the risk/reward ratio for your trades. Determine position size accor
Trend Screener Pro MT5
STE S.S.COMPANY
4.85 (104)
Trend Screener Indicator --Professional Trend Trading & Market Scanning System for MetaTrader Unlock the true power of trend trading with Trend Screener Indicator — a complete multi-currency, multi-timeframe trend analysis solution powered by Fuzzy Logic,Trend Pulse Technology  and advanced market structure algorithms.   Trend Screener transforms your MetaTrader platform into a professional-grade Trend Analyzer and Market Scanner, helping you identify high-probability trend opportunities, early
CGE Trading Suite
Carl Gustav Johan Ekstrom
5 (2)
Institutional-Grade Analytics for MT5 C GE Trading Suite delivers the analytical edge typically reserved for professional trading desks. The platform integrates a full suite of analytical tools into one seamless workflow: dynamic grid mapping, liquidity behavior analysis, ECM, trend lines, MIDAS, trade cycles, and directional channel projections. Together, these provide a unified view of market structure and momentum. Directional clarity is further enhanced by the capital flow index, which meas
See which strategy actually works on your symbol - before you risk real money. Power Bar detects extreme price bars on any symbol and any timeframe, then instantly backtests 3 different trading strategies so you can compare win rates, profit factors, and P&L side by side. All in a single interactive panel. No guessing. No curve-fitting. Just data. This tool is part of the Stein Investments ecosystem.  Browse all 18 tools, get AI-powered setup recommendations,  and join the community at https://
Btmm state engine pro
Garry James Goodchild
5 (4)
BTMM State Engine Pro is a MetaTrader 5 indicator for traders who use the Beat The Market Maker approach: Asian session context, kill zone timing, level progression, peak formation detection, and a multi-pair scanner from a single chart. It combines cycle state logic with a built-in scanner dashboard so you do not need the same tool on many charts at once. What it does Draws the Asian session range; session times can follow broker server offset or be set in inputs. Tracks level progression (L
Atomic Analyst MT5
Issam Kassas
3.94 (31)
New Update of   Atomic Analyst MT5 For  2026 Market: If You Buy this Indicator you will Get my Professional   Trade Manager + EA  for   FREE . First of all Its worth emphasizing here that this Trading Indicator is   Non-Repainting   , Non Redrawing and Non Lagging Indicator   Indicator, Which makes it ideal from both manual and robot trading.  User manual: settings, inputs and strategy . The Atomic Analyst  is a PA Price Action Indicator that uses Strength and Momentum of the price to find a bet
FX Power MT5 NG
Daniel Stein
5 (31)
FX Power: Analyze Currency Strength for Smarter Trading Decisions Overview FX Power is your go-to tool for understanding the real strength of currencies and Gold in any market condition. By identifying strong currencies to buy and weak ones to sell, FX Power simplifies trading decisions and uncovers high-probability opportunities. Whether you’re looking to follow trends or anticipate reversals using extreme delta values, this tool adapts seamlessly to your trading style. Don’t just trade—trade
OmniSync Projection
Antonio-alin Teculescu
5 (1)
Chronos Fractal Engine is an innovative price projection indicator for MetaTrader 5, designed to transform your technical analysis by intelligently identifying and projecting historical price patterns. Built upon an advanced correlation algorithm and the fractal principles of the market, this powerful tool visualizes potential future price movements, giving you a unique edge in your trading decisions. What is Chronos Fractal Engine? At its core, the Chronos Fractal Engine employs a sophisticat
Bill Williams Advanced
Siarhei Vashchylka
5 (11)
Bill Williams Advanced is designed for automatic chart analysis using Bill Williams' "Profitunity" system. The indicator analyzes four timeframes at once. Manual (Be sure to read before purchasing) Advantages 1. Analyzes the chart using Bill Williams' "Profitunity" system. Signals are displayed in a table in the corner of the screen and on the price chart. 2. Finds all known AO and AC signals, as well as zone signals. Equipped with a trend filter based on the Alligator. 3. Finds "Divergence Bar
Berma Bands
Muhammad Elbermawi
5 (8)
The Berma Bands (BBs) indicator is a valuable tool for traders seeking to identify and capitalize on market trends. By analyzing the relationship between the price and the BBs, traders can discern whether a market is in a trending or ranging phase. Visit the [ Berma Home Blog ] to know more. Berma Bands are composed of three distinct lines: the Upper Berma Band, the Middle Berma Band, and the Lower Berma Band. These lines are plotted around the price, creating a visual representation of the pric
Market Structure Order Block Dashboard MT5 is an MT5 indicator designed for traders who want to read market structure and the main price reaction zones directly on the chart. It combines BOS, ChoCH, Order Blocks, Fair Value Gaps (FVG), Liquidity, Kill Zones, Volume Profile, and a compact dashboard for quick analysis. This indicator targets traders who use market structure, ICT and Smart Money concepts as a decision framework. It can help spot trend continuations, possible reversals, price imbala
Auto Optimized Parabolic RSI: Advanced 3D Momentum Engine Most retail indicators fail because they rely on static inputs that break the moment market volatility shifts. Auto Optimized Parabolic RSI solves the problem of "indicator decay" by continuously recalculating its own mathematical edge, bringing institutional-grade quantitative adaptation directly to your MT5 terminal. The Core Advantage: Custom In-Memory 3D Optimization Standard auto-optimizers often freeze the MT5 platform because they
Crystal Heikin Ashi Signals
Muhammad Jawad Shabir
5 (2)
Crystal Heikin Ashi Signals - Professional Trend & Signal Detection Indicator Advanced Heikin Ashi Visualization with Intelligent Signal System for Manual & Automated Trading Final Price: $149 ---------> Price goes up $10 after every 10 sales . Limited slots available — act fast . Overview Crystal Heikin Ashi Signals is a professional-grade MetaTrader 5 indicator that combines pure Heikin Ashi candle visualization with an advanced momentum-shift detection system. Designed for both manual traders
Meridian Pro
Ottaviano De Cicco
5 (1)
Meridian Pro: Professional Multi-Timeframe Trend Matrix for MT5 Overview Meridian Pro is a multi-timeframe trend matrix by Merkava Labs that compresses directional state, strength, momentum condition and matrix agreement into one compact panel. One adaptive engine, applied consistently from M1 to W1. No per-symbol tuning. No indicator stacking. One structured readout across every asset and every timeframe. Launch Offer — Get Meridian Pro for USD 99 (introductory). Regular price: USD 149. 1. Why
FX Levels MT5
Daniel Stein
5 (13)
FX Levels: Exceptionally Accurate Support & Resistance for All Markets Quick Overview Looking for a reliable way to pinpoint support and resistance levels across any market—currencies, indices, stocks, or commodities? FX Levels merges our traditional “Lighthouse” method with a forward-thinking dynamic approach, offering near-universal accuracy. By drawing from real-world broker experience and automated daily plus real-time updates, FX Levels helps you identify reversal points, set profit targe
Top indicator for MT5   providing accurate signals to enter a trade without repainting! It can be applied to any financial assets:   forex, cryptocurrencies, metals, stocks, indices .  Watch  the video  (6:22) with an example of processing only one signal that paid off the indicator! MT4 version is here It will provide pretty accurate trading signals and tell you when it's best to open a trade and close it. Most traders improve their trading results during the first trading week with the help of
More from author
Naked chart MT5
Frederic Jacques Collomb
One button. One click. A naked chart. MT4 version You've drawn everything. Trend lines, Fibonacci, rectangles, zones, arrows... Your chart looks like a modern art canvas. Beautiful — but you can't see the price anymore. NAKED CHART solves this in one click. Click once → all drawings instantly disappear Click again → everything comes back, exactly as you left it Indicators are untouched — only your drawings are hidden Draggable button — place it wherever you want on the chart No settings. No com
FREE
Gann Box MT4
Frederic Jacques Collomb
5 (1)
The Gann Box indicator is a powerful and versatile tool designed to help traders identify and exploit key market levels. This indicator draws a rectangle on the chart, which is automatically divided into several zones with strategic levels 0, 0.25, 0.50, 075, 1 . When the price touches one of these levels, alerts are triggered, providing valuable assistance for trading decisions. You instantly know the evolution of the market in relation to the zone you have drawn. To draw a zone, simply draw a
Gann Box MT5
Frederic Jacques Collomb
The Gann Box indicator is a powerful and versatile tool designed to help traders identify and exploit key market levels. This indicator draws a rectangle on the chart, which is automatically divided into several zones with strategic levels 0, 0.25, 0.50, 075, 1 . When the price touches one of these levels, alerts are triggered, providing valuable assistance for trading decisions. You instantly know the evolution of the market in relation to the zone you have drawn. To draw a zone, simply draw a
Naked chart MT4
Frederic Jacques Collomb
One button. One click. A naked chart. MT5 version You've drawn everything. Trend lines, Fibonacci, rectangles, zones, arrows... Your chart looks like a modern art canvas. Beautiful — but you can't see the price anymore. NAKED CHART solves this in one click. Click once → all drawings instantly disappear Click again → everything comes back, exactly as you left it Indicators are untouched — only your drawings are hidden Draggable button — place it wherever you want on the chart No settings. No com
FREE
Trend Master Chart MT4
Frederic Jacques Collomb
Trend Master Chart is the trend indicator you need. It overlays the chart and uses color coding to define different market trends/moves. It uses an algorithm that combines two moving averages and different oscillators. The periods of these three elements are modifiable. It works on any time-frame and any Pair. At a glance you will be able to identify an upward or downward trend and the different entry points into this trend. For example during a marked upward trend (light green color) the diffe
Moving Average Scanner MT4
Frederic Jacques Collomb
Moving Average Scanner is a multi-timeframe scanner perfect for seeing the trend over several time frames at a glance without changing the chart. It can use up to 4 moving averages of your choice over 9 time units. It is fully configurable and can be moved anywhere on the graph by simply “drag and drop”. Moving averages can be configured in 4 different calculation methods. You can also set alerts based on the number of moving averages and the number of periods. MT5 version here. Input param
Trend Master Histogram MT4
Frederic Jacques Collomb
Trend Chart Histogram is an indicator based on an algorithm using two moving averages and several oscillators. Thanks to its color code, it allows you to quickly identify the trend and take advantage of the biggest market impulses. Light colors indicate the trend, dark colors define impulses and gray indicates that you should not enter the market. It will be a very good ally in your decision-making, combined with your other indicators. MT5 version here. Input parameters: - Period 1 (fast perio
MA Killer MT4
Frederic Jacques Collomb
The MA Killer indicator is the ultimate weapon for traders using moving averages. It is a complete system that uses several tools directly accessible by a management panel . Thanks to its tools you have an overview of the market and a valuable aid in decision-making for entering a position . MT5 version It consists of: - The Trend Master chart indicator which displays the trend directly on the chart using a color code. This trend is calculated by an algorithm using two moving averages and se
RSI Pro Analyser MT4
Frederic Jacques Collomb
The RSI Pro Analyzer Indicator is a powerful tool designed for traders looking to make informed decisions across multiple time frames simultaneously. This indicator uses the RSI to provide overbought, oversold and trend signals, making it easier to identify market entry opportunities. Its main advantage is its ease of reading thanks to its clear and distinct color codes to indicate different market conditions. The indicator displays RSI values and associated signals in five different time frame
Zonecore MT4
Frederic Jacques Collomb
ZONECORE — Volume Profile & Pivot Levels Identify the most traded price zones with surgical precision. MT5 version What is ZONECORE? ZONECORE is a professional-grade indicator that combines Volume Profile and high-volume Pivot Levels to reveal the price zones where the market has spent the most time and traded the most volume. These zones act as magnets for price — knowing them gives you a decisive edge in identifying supports, resistances, and high-probability reversal areas. 3 Independent Cal
CoPilot dashboard MT4
Frederic Jacques Collomb
CoPilot — Daily Trading Dashboard Know your numbers. Trade with clarity. MT5 version What is CoPilot? CoPilot is a professional-grade trading assistant that displays in real time all your daily performance statistics directly on the chart — with a live equity curve that updates trade by trade. Designed for active traders who need instant visibility into their session without leaving the chart, CoPilot aggregates every closed trade of the day across all symbols and presents them in a clean, color
Trend Master Chart MT5
Frederic Jacques Collomb
Trend Master Chart is the trend indicator you need. It overlays the chart and uses color coding to define different market trends/moves. It uses an algorithm that combines two moving averages and different oscillators. The periods of these three elements are modifiable. It works on any time-frame and any Pair. At a glance you will be able to identify an upward or downward trend and the different entry points into this trend. For example during a marked upward trend (light green color) the diffe
Moving Average Scanner MT5
Frederic Jacques Collomb
Moving Average Scanner is a multi-timeframe scanner perfect for seeing the trend over several time frames at a glance without changing the chart. It can use up to 4 moving averages of your choice over 9 time units. It is fully configurable and can be moved anywhere on the graph by simply “drag and drop”. Moving averages can be configured in 4 different calculation methods. You can also set alerts based on the number of moving averages and the number of periods. MT4 version here. Input param
Trend Master Histogram MT5
Frederic Jacques Collomb
Trend Chart Histogram is an indicator based on an algorithm using two moving averages and several oscillators. Thanks to its color code, it allows you to quickly identify the trend and take advantage of the biggest market impulses. Light colors indicate the trend, dark colors define impulses and gray indicates that you should not enter the market. It will be a very good ally in your decision-making, combined with your other indicators. MT4 version here. Input parameters: - Period 1 (fast perio
MA Killer MT5
Frederic Jacques Collomb
The MA Killer indicator is the ultimate weapon for traders using moving averages. It is a complete system that uses several tools directly accessible by a management panel. Thanks to its tools you have an overview of the market and a valuable aid in decision-making for entering a position . It consists of: - The Trend Master chart indicator which displays the trend directly on the chart using a color code. This trend is calculated by an algorithm using two moving averages and several oscillato
ZoneCore MT5
Frederic Jacques Collomb
ZONECORE — Volume Profile & Pivot Levels Identify the most traded price zones with surgical precision. MT4 version What is ZONECORE? ZONECORE is a professional-grade indicator that combines Volume Profile and high-volume Pivot Levels to reveal the price zones where the market has spent the most time and traded the most volume. These zones act as magnets for price — knowing them gives you a decisive edge in identifying supports, resistances, and high-probability reversal areas. 3 Independent Cal
CoPilot dashboard MT5
Frederic Jacques Collomb
CoPilot — Daily Trading Dashboard Know your numbers. Trade with clarity. MT4 version What is CoPilot? CoPilot is a professional-grade trading assistant that displays in real time all your daily performance statistics directly on the chart — with a live equity curve that updates trade by trade. Designed for active traders who need instant visibility into their session without leaving the chart, CoPilot aggregates every closed trade of the day across all symbols and presents them in a clean, color
Filter:
No reviews
Reply to review