适用于MetaTrader 4的技术指标 - 14

Alan Hull's moving average, more sensitive to the current price activity than the normal MA. Reacts to the trend changes faster, displays the price movement more clearly. Color version of the indicator. Improvement of the original version of the indicator by Sergey <wizardserg@mail.ru>. Suitable for all timeframes.
Parameters Period - smoothing period, recommended values are from 9 to 64. The greater the period, the smoother the indicator. Method - smoothing method, suitable values are 0, 1, 2
FREE
Trend Reversal Master Unlock Your Trading Potential with Precision Are you tired of missing key market reversals? Do you struggle to find high-probability entry points? "Trend Reversal Master" is the smart MQL4 indicator designed to help you spot potential trend shifts with confidence and clarity. This powerful tool combines the best of two worlds: the dynamic Parabolic SAR (PSAR) and the robust 200-period Exponential Moving Average (EMA). By filtering PSAR signals through the long-term trend de
FREE
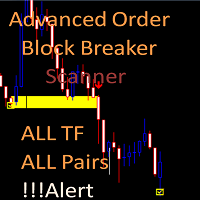
FREE

Overbought – Smoothed CCI Indicator with Signals Overbought — это профессиональный индикатор перекупленности и перепроданности, построенный на основе CCI с EMA-сглаживанием . Индикатор помогает находить потенциальные точки разворота рынка и фильтровать шум стандартного CCI. Индикатор работает в отдельном окне и подходит для любых торговых инструментов и таймфреймов. Основные возможности Сглаженная линия CCI (EMA smoothing) Чёткие уровни перекупленности и перепроданности Стрелочные сигналы BUY
FREE
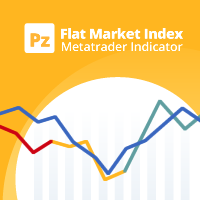
该指标计算代号相对移动了多少才能找到趋势或平淡的市场。它显示最新价格范围的定向百分比。 [ 安装指南 | 更新指南 | 故障排除 | 常见问题 | 所有产品 ] 零值表示市场绝对平稳 值100表示市场完全处于趋势 蓝线表示价格区间健康 红线表示价格范围窄 移动平均线是平坦市场指数(FMI) 它具有直接的交易含义。 当线条为蓝色且在FMI上方时,使用趋势交易策略 当线条为红色且低于FMI时,请使用范围交易策略 根据FMI执行仪器选择 该指标对于避免EA交易平淡交易特别有用。
输入参数 最大历史记录条数:加载时回顾过去的条数。 回顾:研究平盘市场指数的柱线数量。 周期:计算索引的平均周期。 ATR周期:指标中用于计算移动单位的ATR周期。
ATR乘数:ATR的乘数,用于计算索引的移动单位。
作者 ArturoLópezPérez,私人投资者和投机者,软件工程师和Point Zero Trading Solutions的创始人。
FREE

产品标题 Smart ZigZag (MT4) – SmartView 系列的一部分 简短描述 具有独特用户体验的 ZigZag 指标,在 MetaTrader 平台上提供。提供以前不可用的高级功能,例如双击打开设置、隐藏和显示指标而无需删除它们,以及以全图表大小显示指标窗口。设计用于与 SmartView 指标系列的其余部分无缝协作。 概述 SmartView 系列通过创新功能为 MetaTrader 平台上的指标提供独特且与众不同的用户体验,使指标管理更快、更轻松。每个指标都配备了图表上的智能控制面板,显示基本信息并提供对所有重要功能的快速访问。 以前不可用的独特功能 SmartView 系列提供使指标工作更简单、更快速的高级功能: 双击打开设置: 无需在指标列表中搜索,双击面板上的指标名称即可直接打开设置窗口。 隐藏和显示指标: 一键隐藏和显示指标,无需从指标列表中删除和重新添加它们。 以全图表大小显示指标窗口: 在子窗口中,您可以最大化指标窗口以全图表大小显示,并临时隐藏其他窗口。 折叠和展开子窗口: 折叠子窗口以减少其高度并节省屏幕空间,然后在需要时将其展开回全尺寸。 重新排
FREE

指标在图表上显示基于终端RSI振荡器的信号。 从而能够滤除重复信号。
这里振荡器用于搜索反向信号。 建议将其作为波段策略和水平交易的切入点。
多币种仪表板可用。 有了它,您可以轻松地在图表之间切换。 在产品讨论中,您可以建议一种可以在其中嵌入仪表板的算法。
输入参数 。
主要设置 。
Bars Count – 指标将工作的历史柱的数量 。 RSI Period – 振荡器周期 。 RSI Level – 振荡器的电平。 振荡器在0到100之间。 如果选择10,信号将高于10,低于90 。 RSI Applied Price 。 Repeat Signal - 重复信号 。 Enable – 所有重复的信号将与箭头/图标 。 No Signal – 所有重复的将被忽略 。
视觉箭头 。 Sell Code – Sell rsi图标的代码编号 。 Sell Color – 出售RSI图标的颜色 。 Buy Code – 购买RSI图标的代码编号 。 Buy Color – 购买RSI图标的颜色 。 Indent Coeff – 由波动系数从阴影缩进 。 Size – 图标大
FREE
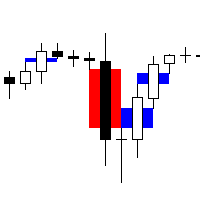
Fair Value Gap Scanner 4 is a sophisticated MetaTrader 5 indicator designed to detect fair value gaps (FVGs) in price action and display them as rectangles directly on the chart. This powerful tool empowers traders by providing visual representations of FVGs, enabling them to identify potential trading opportunities with ease and precision. With customizable parameters for color, width, and style, traders can tailor the indicator's appearance to suit their preferences and trading strategies. Key
FREE

It is a custom non-repaint indicator to identify trade opportunities in swing action as prices move within an upper and lower band. Inspired by the Keltner Channel, the most popular channel Indicator introduced by Chester Keltner. It is different with a Bollinger Bands. It represents volatility using the high and low prices, while Bollinger's studies rely on the standard deviation. The algorithm for this indicator is also available in the EntryMaximator EA. Including the option to use it or not.
FREE

A unique author's strategy that simultaneously determines the trend reversal, entry points and estimated profit levels for each transaction. The indicator can determine entry points on any trading period, starting with the M5 chart to W1. At the same time, for the convenience of the user, an arrow is always drawn at a certain point and the recommended profit levels (Take Profit1, Take Profit2, Manual Take Profit) the Stop Loss level is also displayed.
A great advantage of the indicator Trend Sw

想象一下:你正处于巨额利润的边缘,但市场突然发生变化,你错过了机会。 或者更糟糕的是,你得到的是损失而不是利润。 如果你有一个可靠的盟友提前低语:"做好准备-海浪来了!"? 遇见 Harbinger,MetaTrader4 的革命性指标,专为厌倦混乱并希望预测市场变化的交易者而设计!
Harbinger 是一种智能算法,可以分析隐藏的趋势波动模式,以令人难以置信的准确性发出即将到来的回调,反转或累积的信号。 Harbinger mt5 version
如何使用Harbinger指标.
当指标 Harbinger 的信号出现在图表上时,这意味着信号之前的价格走势将被停止。 并且会有累积,回滚,或者一起回调的累积,或者趋势反转。 通常这两件事同时发生。 最主要的是要明白,如果一个信号出现,这意味着先前趋势的变化即将到来。 所有这些都让我们明白,我们需要重新考虑我们在这个工具市场上的未平仓头寸。 并采取必要的安全措施。 例如,您可以将其设置为盈亏平衡,或锁定部分利润,甚至完全锁定整个利润。
如果在指标 Harbinger 的信号出现后,市场的积累阶段已经开始,最好等待积累结束,然后

The " Countdown Candle Timer " indicator is a visual tool for the MetaTrader 4 platform that displays an accurate countdown of the time remaining until the next candle on the chart. It provides real-time information about the remaining duration of the current candle, allowing traders to track time precisely and optimize their trading decision-making. The indicator can be customized in terms of color, font size, and position on the chart, providing flexibility and convenience to the user. You can
FREE
This is a combine that combines the ATR, Candle Timer, Watermark indicators and a tool for working with graphical objects, which allows you to reduce the time for marking charts. Functionality: Levels and proteins with price tags; drawing strictly horizontal levels; continuous zigzag manually; expansion / truncation of lines, wrinkles; quick change of colors and fonts and shapes; Filling/removing the filling of vessels, triangles, ellipses; dragging by 1 (first) point and auto alignment of the h
FREE
The Pulse 是实时显示累积周期的指标。 简单来说:积累是"聪明的钱"在市场上发起强大的运动之前悄悄地收集资产。 在图表上,看起来价格"卡在"一个范围内。 这是积累阶段-有人正在准备一个大动作。 如果你学会注意到这些时刻-当市场似乎"冻结",但在同一时间感到紧张—你可以在正确的时间在正确的地方。
确定累积周期意味着能够等待合适的时机。 The Pulse 指标显示积累周期,积累中的价格可以随心所欲地移动,但最常见的是横向移动。 The Pulse Blog. The blog: Why every trader should have The Pulse indicator as an additional tool for trading. Version mt5
累积周期可以以不同的方式使用:
在积累期间,您可以远离市场,等待价格释放积累的能量并开始移动。 适当的技能和经验,你可以在积累本身内进行交易。 如果在长期价格或趋势变动后出现累积,则可能更好地查看以前打开的交易。 例如,固定利润或将其设置为盈亏平衡。
而且,在 The Pulse 指标的帮助下,你会更好地看到和

Round Numbers Levels indicator for MT4 Round Numbers indicator is a simple but useful indicator to draw 00 and 50 price levels in your chart.
These levels act as supports and resistances, and therefore should be taken into account when trading.
These levels can be used as profit targets or entry points.
Inputs of the indicator are:
TGridColor00: color to be used for xx00 levels GridStyle00: line style to be used for xx00 levels GridWidth00: line width to be used for xx00 levels GridColor50:
FREE

VWAP and Moving Average A combination of Supertrend and Moving Average to create a converging trade setup Input parameters: signal mode: set it to true if you want to plug it into STAT (Signal Tester and Trader) arrow shift: distance between fast EMA line to arrow on chart turn on moving average signal for converging setup VWAP period MA period MA averaging method MA pricing method upper level limit ( VWAP ) lower level limit ( VWAP ) You can find the best setting for 4 hour EURUSD on this v
FREE

该指标的目的在于在您的交易图表上可视化表示唐奇安通道。唐奇安通道是一种直观的技术工具,用于描述特定时期内的最高高点和最低低点之间的范围。此指标增强了价格运动的视觉分析,为潜在的突破和趋势延续点提供了洞察力。唐奇安通道可以应用于当前时间框架和更高的时间框架,如果您选择启用该选项的话。 指标的主要特点: Use_System_Visuals:此参数允许您在使用系统视觉样式和自定义指标外观之间进行切换。当激活时,指标的视觉元素将与您的交易平台整体主题相匹配。 Signal_from_HT_Timeframe:启用此选项允许您从更高的时间框架接收信号。换句话说,您可以考虑在更长的时间框架上观察唐奇安通道的行为,以影响您在当前时间框架上的交易决策。 HT_Timeframe:当激活Signal_from_HT_Timeframe时,此参数允许您选择更高的时间框架,从中您希望接收信号。比较唐奇安通道在不同时间框架上的行为可以为交易决策提供有价值的背景。 Period:此参数定义计算唐奇安通道的时期。它确定用于建立通道上限和下限的条形或蜡烛数量。 Down_Side和Up_Side:这些参数允许您为
FREE
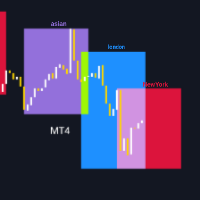
TradingSessionVisualizer – 交易者的必备工具! 在深入了解此指标的功能之前,请 评分 此产品, 留下评论 以分享您的体验,并 订阅 我的页面,以便随时了解最新的发布和工具。您的支持非常宝贵,帮助我不断改进我的创作! 描述: TradingSessionVisualizer 是一款强大的 MetaTrader 4 指标,旨在为您的图表提供清晰且可自定义的主要交易时段可视化。该工具允许您轻松区分亚洲、伦敦和纽约交易时段,帮助您更好地理解这些关键时期的市场走势。 主要功能: 交易时段显示: 使用彩色矩形在图表上清晰地可视化亚洲、伦敦和纽约的交易时段。 可自定义参数: 调整每个时段的颜色、线条宽度以及矩形是否填充。 动态显示: 指标会根据您选择显示的天数自动调整(最多可显示 3 天)。 易于管理: 该代码有效管理图形对象,删除旧的对象并更新新的对象。 指标参数: 天数数量: 显示最多 3 天的时段。 颜色和样式: 自定义时段的颜色和矩形边框样式。 矩形填充: 选择矩形是否应填充或仅显示边框。 使用方法: 安装: 下载并将指标安装到 MetaTrader 4 的指标文件
FREE

The " YK Find Support And Resistance " indicator is a technical analysis tool used to identify key support and resistance levels on a price chart. Its features and functions are as follows:
1. Displays support and resistance levels using arrow lines and colored bands, with resistance in red and support in green.
2. Can be adjusted to calculate and display results from a specified timeframe using the forced_tf variable. If set to 0, it will use the current timeframe of the chart.
3. Uses the
FREE

The indicator builds a Renko chart in the sub window for the current symbol. The bars are formed from live data and the desired bar size can be set in the inputs tab. Most importantly, because the Renko chart only uses price to construct bars and ignores time, the indicator can be applied to any time frame and same results can be achieved. Recommended usage
As Renko charts are famous for eliminating noise so traders can use this tool to see clear picture of the trend to help their analysis, entr
FREE

哨兵箭頭
主要特點:
⊗採用獨家演算法,快速且準確地辨識趨勢、反轉和動量變化。
⊗專為專業用途設計,擁有強大的訊號邏輯,可消除延遲或錯誤更新。
⊗適用於各種時間框架。
⊗不會重繪、刪除或修改過去的訊號。
⊗所有買進和賣出訊號均在K線圖上產生並保持不變。
⊗在實際交易中,訊號不會重繪-它會立即顯示在K線圖上。
⊗確保穩定性、準確性和靈活性。
⊗提供高勝率的訊號。
⊗每個訊號只觸發一次-不會重複。
⊗適用於所有貨幣對、指數、股票、外匯、金屬和加密貨幣。
⊗支援趨勢交易、波段交易和反轉確認。 ⊗為尋求可靠且易於理解的專業交易訊號的交易者。
⊗完全可客製化。
⊗簡單、穩定、可靠,適用於實盤交易。
⊗使用規則簡單。
⊗適合新手和經驗豐富的交易者。
FREE

"Experience the full power on EURUSD!" Title: ChanLun Structure and SMC System Description: This indicator combines ChanLun Theory (Bi, Duan, Zhongshu) with Smart Money Concepts (SMC) to analyze market structure. It visualizes the market in three distinct layers—Pen, Segment, and Wave—and automatically identifies Premium, Discount, and Optimal Trade Entry (OTE) zones. The tool features an Interactive Hybrid Control System , allowing traders to manage the chart using keyboard hotkeys or mouse int
FREE

该指标测量所选时段内牛市和熊市之间的不平衡,并在两点之间显示一条直线。
如果牛市的成交量大于熊市,则该线变为绿色。 如果熊市成交量更大,则为红色。 直线还显示成交量的百分比差异。
该指标在单独的窗口中显示相同的数据。您还可以看到分割后的成交量。
该指标有两种模式。
为此,左上方有一个按钮、
- 如果不按下,它将测量市场任意点与当前价格之间的不平衡。 - 如果按下按钮,则可以测量市场任意两点之间的平衡。
该指标测量所选时段内牛市和熊市之间的不平衡,并在两点之间显示一条直线。
如果牛市的成交量大于熊市,则该线变为绿色。 如果熊市成交量更大,则为红色。 直线还显示成交量的百分比差异。
该指标在单独的窗口中显示相同的数据。您还可以看到分割后的成交量。
该指标有两种模式。
为此,左上方有一个按钮、
- 如果不按下,它将测量市场任意点与当前价格之间的不平衡。 - 如果按下按钮,则可以测量市场任意两点之间的平衡。

This is a modified Fractals indicator. It works similar the original Bill Williams' indicator, and is additionally enhanced with the possibility to change the top radius, in contrast to the standard radius of 2 bar. Simply put, the indicator checks the top and if it is the minimum/maximum in this radius, such a top is marked by an arrow. Advantages Adjustable radius. Use for drawing support and resistance levels. Use for drawing trend channels. Use within the classical Bill Williams' strategy or
FREE

江恩箱(或江恩方)是一种基于 W.D. Gann 的“市场预测的数学公式”文章的市场分析方法。 该指标可以绘制三种正方形模型:90、52(104)、144。有六种网格变体和两种弧形变体。 您可以在一张图表上同时绘制多个方块。
参数 Square — 江恩方格模型的选择: 90 — 90 的平方(或 9 的平方); 52 (104) — 52(或 104)的平方; 144 — 144的万能平方; 144 (full) — 正方形的“完整”版本,结合了其他正方形的线条。 据我们所知,W.D.江恩并没有这样的加价; for Arcs — 圆弧的简化正方形; Grid — 网格的变体: 4x4 (52) — 4 x 4 网格,52 个标记; 5x5 (40); 8x8 (90); 8x8 (104); 8x8 (144); 16x16 (144); 36x36 (144); disable — 禁用网格; Arcs — 弧线的变体: 4x4; 5x5; disable — 禁用弧; 开始时的方形参数: Length of Square, Bars (X-axis) — 正方形的长度(以条

--- FREE VERSION - WORKS ONY ON EURUSD
------------------------------------------------------------------- This is a unique breakout strategy that is used for determination of the next short term trend/move. The full system is available on MQL5 under the name "Forecast System". Here is the link --> https://www.mql5.com/en/market/product/104166?source=Site Backtest is not possible, because calculations are done based on the data of all timeframes/periods. Therefore I propose you use the technolo
FREE

Stop Guessing, Start Winning: Meet Swing Hunter Pro! Are you tired of confusing charts and late entries? The Swing Hunter Pro indicator is your ultimate weapon for capturing profitable market swings with unmatched clarity and confidence. This powerful tool combines the best of Hull Moving Averages (HMA) and Exponential Moving Averages (EMA) with a strict trend filter, giving you strong, high-probability signals right on your chart. Available in EA format. Link download https://www.mql5.com/en
FREE

The indicator of a Professional Trader is an arrow indicator for predicting the direction of price movement. I have been working on this indicator since 2014.
You can use this indicator as your main indicator, use its entry signals, and use it as your only indicator to find entry points.
About the product: Recommended TF [H4-D1-W1] . The indicator predicts the direction of the next candle. Fits a variety of tools; Flexibility in settings for different instruments and intervals through the MO
FREE

Price Channels are also known as Donchian Channels being named after Richard Donchian. They use the highest and lowest price of a set number of periods to create an upper and lower channel or envelope around the price. The upper channel shows the high of the number of periods chosen. The lower channel shows the low of the number of periods chosen. For example, the screenshot shows the Price Channels using 320 periods. The upper channel in the screenshot shows the highest high of the previous 3
FREE

MT4 的 R 2EMA 颜色指标基于 2 个 EMA 的交叉提供可靠的交易信号。
关键点 当价格交叉并收于两条绿色 EMA 上方时,它会产生买入交易信号。 当价格交叉并收于两条红色 EMA 上方时,它会产生卖出交易信号。 R 2EMA Color Forex 指标使确定何时买卖变得更加容易
当 2 条 EMA 线变为绿色时,出现买入信号。 当 2 条 EMA 线变为红色时,出现卖出信号。 如何与之交易? 一旦两条 EMA 信号线从红色变为绿色,就开始买入交易,现在趋势是积极的。 一旦两条 EMA 信号线从绿色变为红色,就开始卖出交易,现在趋势是负面的。 当图表上出现相反的交易信号时退出交易。
随意使用您自己喜欢的交易方法通过 R 2EMA 颜色指标打开和关闭交易。
规格 交易平台:Metatrader 4 (MT4)
货币对:适用于任何货币对
时间范围:适用于任何时间范围
输入参数:快、慢、模式、价格、信号条、警报消息、警报声音、警报电子邮件、警报移动、颜色设置和样式
指标类型:价格行为
FREE
ALGO BOX – Advanced Day Trading System ALGO BOX is a powerful day trading indicator designed for serious traders who demand precision and reliability in breakout trading. Combining advanced price action analysis with real-time data, it helps you spot high-probability trades while keeping risk under control. Why ALGO BOX Stands Out Identify clear, profitable breakout opportunities Reduce false signals for better trade accuracy Track your trading performance with live stats Make smart, data-driven
FREE

RaysFX Supertrend + Alert RaysFX Supertrend è un indicatore di tendenza superiore progettato per i trader che desiderano avere un vantaggio nel mercato. Questo indicatore utilizza una combinazione di CCI (Commodity Channel Index) e ATR (Average True Range) per identificare le tendenze del mercato e fornire segnali di trading accurati. Caratteristiche principali Indicatori CCI e ATR: Utilizza due degli indicatori più popolari e affidabili per identificare le tendenze del mercato e generare segnal
FREE
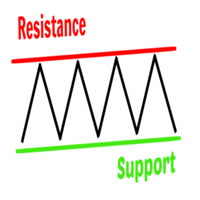
Support and resistance levels are the key factors that determine the price movement from one zone to another. They are levels for trend reversal/breakout signals forex traders look out for before making a trade decision. The Support and Resistance Indicator is a custom trading tool for MT4 developed to plot support/resistance zones from past price actions. The indicator also helps a trader evaluate optimal zones to place a BUY/SELL order or to exit a trade. In other words, it assists traders to
FREE

A simple but effective helper that will allow you to track both global and local market trends. The indicator combines the work of two oscillators: Stochastic and RSI. Both indicators can be set to any timeframe.
Advantages of Use Multitimeframe - you can adjust both indicators to the desired timeframes. To obtain the entry points, you can use the Elder's triple screen system. Highly customizable - you can configure not only the parameters of the indicators, but also their appearance (color and
FREE

This Dashboard is free to download but is dependent on you owning the Gold Pro MT4 indicator. Get the indicator here: https://www.mql5.com/en/market/product/60430
The Dashboard will show you on a single chart all the timeframes (M1 to Monthly) with their own status for the indicator: Gold Pro MT4
all time frame and all symbol: smart algorithm detects the trend, filters out market noise and gives entry signals!!!
How to understand the status: Dashboard Show "Buy" - Buy Signal Das
FREE
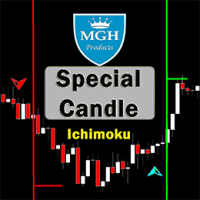
特殊蜡烛
您想使用其中一个最佳的外汇指标和成功的Ichimoku策略吗?您可以使用基于Ichimoku策略的这个令人惊叹的指标。
MT5版本在这里 。
第一策略:
此策略涉及识别很少出现相似强交叉。
此策略的最佳时间框架为30分钟(30M)和1小时(H1)。
适用于30分钟时间框架的合适符号包括:
• CAD/JPY
• CHF/JPY
• USD/JPY
• NZD/JPY
• AUD/JPY
• EUR/USD
• EUR/GBP
对于1小时时间框架,适当的符号包括:
• GBP/USD
• GBP/NZD
• GBP/AUD
• USD/CAD
• USD/CHF
• USD/JPY
• EUR/AUD
第二策略:
此策略涉及识别与趋势方向相同的强大Tenkunsen和Kijunsen交叉。
此策略的最佳时间框架为1分钟(1M)至15分钟(15M)。
此策略可应用于大多数货币和符号。
第三策略:
此策略涉及将第一和第二策略组合起来,它们之间有x个蜡烛的距离。您可以从设置中更改X。默认设置为3。
我们提供支持,无论何时出现问题: https://www.mql5.com/en
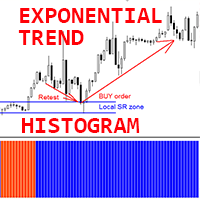
Crypto_Forex MT4 指标“指数趋势直方图”,无需重绘。
- 指数趋势直方图指标对于趋势检测非常有效。 - 最佳使用方法是结合支撑/阻力位和重测技术(见图): - 一旦指标检测到新趋势,找到局部阻力位并在那里设置相应的挂单,等待该区域重测。 - 如果新趋势看涨,则设置买入限价挂单;如果新趋势看跌,则设置卖出限价挂单。 - 指标有两种颜色:红色代表看跌下行趋势,蓝色代表看涨上行趋势(可在设置中更改颜色)。 - 提供手机和电脑端警报。 ................................................................................................................. // 优秀的交易机器人和指标可在此处获取: https://www.mql5.com/en/users/def1380/seller 这是仅在 MQL5 网站上提供的原创产品。
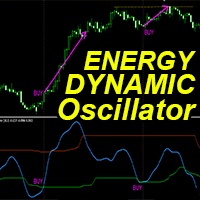
“动态能量震荡指标”是一款高级自定义加密货币外汇指标,适用于 MT4 平台,高效交易!
- 新一代震荡指标 - 请查看图片了解如何使用。 - 动态能量震荡指标具有自适应超卖/超买区域。 - 这是一个技术动量指标,在趋势市场中非常有用。 - 震荡指标是一种辅助工具,可帮助您从超卖/超买区域找到准确的入场点。 - 超卖值:低于绿线,超买值:高于橙线。 - 它比标准震荡指标更精准。适用时间范围:30 分钟、1 小时、4 小时、1 天、1 周。 - 提供 PC 和移动端提醒。 ................................................................................................................. // 优秀的交易机器人和指标可在此处获取: https://www.mql5.com/en/users/def1380/seller 本产品为独家产品,仅在 MQL5 网站上提供。

Immediately plots renko bars in an external/indicator window. One of the distinctive advantages Renko charts offer is the fact that they are not time dependent. Therefore, the new Renko blocks are only traced when the price moves higher or lower by the specified number of points.
For example, a 10 pip (100 points) Renko chart would plot the blocks when price moves 10 pips higher in an uptrend or 10 pips lower in a downtrend. Renko charts removes "noises" from the Market and i t helps to identi

Future Trend Channel 是一款动态直观的趋势指标,专为识别趋势方向和预测潜在价格走势而设计。该工具最初由ChartPrime为TradingView开发,现已适配MetaTrader 4平台,为交易者提供同等强大的功能。无论您是波段交易者、日内交易者还是长线投资者,Future Trend Channel都能帮助您直观判断趋势强度、预判反转时机并优化进出场点位。 主要特点
• 全周期兼容 - 适用于所有时间周期和金融品种,包括外汇、股票、大宗商品和加密货币
• 智能趋势检测 - 结合SMA、ATR和HL2(高低均价)动态绘制多空趋势通道
• 未来价格预测 - 根据当前趋势斜率投射潜在价格区间,辅助交易规划
• 清晰视觉信号 - 多空信号标记趋势确认,色码通道随市况自动调整
• 可调参数 - 可自定义通道长度、宽度和未来价格索引值以匹配交易策略
• 无重绘 - 所有信号和通道实时计算且绝不重绘,确保回测和实盘可靠性
• 轻量高效 - 经过优化不会拖慢MT4平台运行速度 参数设置
Trend Length(趋势长度) - 调整SMA周期以改变趋势灵敏度
Channel W

CS ATR FIBO CHANNELS MULTI TIMEFRAME
Additional tool to trade with Cycle Sniper Indicator.
Cycle Sniper : https://www.mql5.com/en/market/product/51950 Indicator Draws Channels based on: - Cycle Sniper Price and Moving Averages - ATR Deviations - Fibonacci Retracement and Extensions
Features: - Multi TimeFrame - Full alert and Notification options. - Simple Settings - Finds the trend change or extreme reversals.
Inputs: - Arrow Mode: ATR Levels or Median Line If Median Line is selected ind
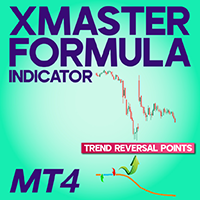
XMaster XHMaster Formula MT4 Indicator – No Repaint Strategy The XMaster / XHMaster Formula Indicator for MetaTrader 4 (MT4) is one of the most popular non-repaint tools used in Forex trading. According to sources like XS.com and TradingFinder, the indicator is designed to detect market direction, momentum strength, and potential reversal areas with high accuracy. This MT4 version blends multiple technical elements—such as EMA-based trend analysis, MACD momentum, RSI and Stochastic oscillators,
FREE

The ACB Trade Filter indicator provides a solution for filtering out the low probability trading setups in a trading strategy. The indicator uses a sophisticated filtration algorithm based on the market sentiment and trend.
Applications Works great with our indicator " ACB Breakout Arrows ". Filter out low probability signals from any indicator. Avoid overtrading and minimize the losses. Trade in the direction of market sentiment and trend. Avoid the choppiness in the market.
How to use Only L
- Real price is 80$ - 60% Discount (It is 30$ now) - It is enabled for 1 purchase. Contact me for extra bonus tool, instruction or any questions! - Non-repaint, No lag - I just sell my products in Elif Kaya Profile, any other websites are stolen old versions, So no any new updates or support. - Lifetime update free
Introduction Smart Money Concepts (SMC) strategy was initially popularized the Inner Circle Trading (ICT) method which is claimed to be the evolved version of the SMC. Essenti

产品标题 Smart Ichimoku (MT4) – SmartView 系列的一部分 简短描述 具有独特用户体验的 Ichimoku 指标,在 MetaTrader 平台上提供。提供以前不可用的高级功能,例如双击打开设置、隐藏和显示指标而无需删除它们,以及以全图表大小显示指标窗口。设计用于与 SmartView 指标系列的其余部分无缝协作。 概述 SmartView 系列通过创新功能为 MetaTrader 平台上的指标提供独特且与众不同的用户体验,使指标管理更快、更轻松。每个指标都配备了图表上的智能控制面板,显示基本信息并提供对所有重要功能的快速访问。 以前不可用的独特功能 SmartView 系列提供使指标工作更简单、更快速的高级功能: 双击打开设置: 无需在指标列表中搜索,双击面板上的指标名称即可直接打开设置窗口。 隐藏和显示指标: 一键隐藏和显示指标,无需从指标列表中删除和重新添加它们。 以全图表大小显示指标窗口: 在子窗口中,您可以最大化指标窗口以全图表大小显示,并临时隐藏其他窗口。 折叠和展开子窗口: 折叠子窗口以减少其高度并节省屏幕空间,然后在需要时将其展开回全尺寸。
FREE
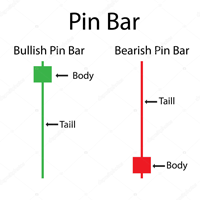
Pin bar pattern is characterized by a long upper or lower wick with a small body relative to the size of the wick with little to no lower or upper shadows. Pin bars are not to be traded in isolation , but need to be considered within the larger context of the chart analysis. A pin bar entry signal, in a trending market, can offer a very high-probability entry and a good risk to reward scenario.
Inputs MinimumTailPips- Minimum size of Tail in pips; TailBodyCandle- means how many times Tail grea
FREE

Crypto_Forex 指标“分形趋势线”适用于 MT4。
- 此指标非常适合使用突破图形分析的交易者!!! - “分形趋势线”显示图形上升趋势(紫色)和下降趋势(红色)线。 - 上升趋势和下降趋势线建立在 2 个最接近的对应分形上。 - 指标有几个参数负责趋势线的颜色和宽度。 - 指标内置移动和 PC 突破警报。 ....................................................................................................................... 点击这里查看高质量的交易机器人和指标! 这是仅在此 MQL5 网站上提供的原创产品。

Auto Order Block with break of structure based on ICT and Smart Money Concepts (SMC)
Futures Break of Structure ( BoS )
Order block ( OB )
Higher time frame Order block / Point of Interest ( POI ) shown on current chart
Fair value Gap ( FVG ) / Imbalance - MTF ( Multi Time Frame )
HH/LL/HL/LH - MTF ( Multi Time Frame )
Choch MTF ( Multi Time Frame )
Volume Imbalance , MTF vIMB
Gap’s Power of 3
Equal High / Low’s
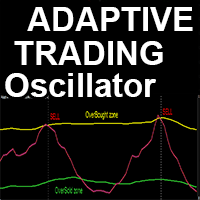
高级自定义加密货币外汇指标“自适应交易震荡指标”——MT4平台的高效辅助交易工具!
- 该指标是新一代震荡指标——请查看图片了解使用方法。 - “自适应交易震荡指标”具有可调节的自适应超卖/超买区域。 - 该震荡指标是一款辅助工具,用于在动态超卖/超买区域的出场点位上寻找精准的交易入场点。 - 超卖区域:绿线下方。 - 超买区域:黄线上方。 - 该指标非常适合与价格行为模式和趋势策略结合使用。 - 它比标准震荡指标更加精准。 - 该指标可用于任何时间周期。 - 内置PC和移动设备警报功能。 .................................................................. 点击这里查看高质量的交易机器人和指标! 本产品为MQL5独家原创产品。
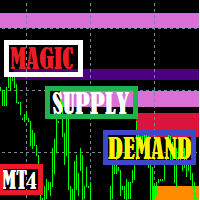
Magic Supply Demand Indicator works on all products and timeframes. It is a new formula, and the very new features are two zone strength functions adjustable by user input! This is a great advantage in trading. When you learn how to use the proprietary features such as the zone strength with min X-factor of price travel away, you will be able to tell whether the zone is strong or not.
The supply and demand zones are used as an alert trigger. You can use popup alert with sound on MetaTra
FREE

40% off. Original price: $50
Moving Average Trend Scanner is a multi symbol multi timeframe triple MA crossover dashboard that helps traders to monitor, and identify potential market trends from one chart. This panel scans 3 moving averages in up to 28 configurable instruments and 9 timeframes for triple moving average alignment and moving average crossover with a deep scan feature to scan all market watch symbols (up to 1000 instruments!).
Download Demo here (Scans only M1 and M5) Settings

Zen Arrows
專為專業用途而設計,它擁有強大的訊號邏輯和安全的運算,可消除延遲或錯誤更新。
它不會重繪、刪除或修改過去的訊號。
所有買入和賣出訊號均在K線圖上產生並保持不變。
在實際交易中,訊號不會重繪-它會立即顯示在K線圖上。
它提供專業級的穩定性、準確性和靈活性。
該系統能夠準確識別趨勢反轉和動量變化,
提供高勝率的訊號,同時最大限度地減少雜訊和錯誤訊號。
主要功能
多級過濾系統(模組化,完全可自訂)
逼真的即時視覺化效果
圖表上直接顯示清晰的買入/賣出訊號
多級警報系統
彈出窗口,聲音提示
每個訊號僅觸發一次-不會重複。
針對MT4平台進行了全面最佳化。
適用於所有貨幣對、指數、股票、外匯和加密貨幣。
趨勢交易、波段交易、反轉確認。
尋求可靠、清晰的專業交易訊號的交易者。
交易者選擇此指標的原因:
高精度和高勝率,經多層過濾驗證。
無噪音、無重繪、無延遲。
清晰的視覺化效果,即時呈現趨勢資訊。
簡單易用、穩定可靠,適用於實盤交易。
FREE

This is an unconventional version of the Heiken Ashi Smoothed indicator implemented as lines rather than a histogram. Unlike a usual histogram, the indicator draws the readings of the two moving averages in the form of colored lines.
Example If the candle crosses two indicator lines upwards, a trend is assumed to be changing from bearish to bullish. If the candle crosses two indicator lines downwards, a trend is assumed to be changing from bullish to bearish. The indicator is good at displaying
FREE
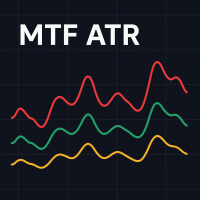
Multi-Timeframe ATR 指标是 MetaTrader 4 标准 ATR 指标的增强版,它允许交易者在当前图表上查看 任意时间框架 的波动性。与只显示当前图表时间框架 ATR 的普通版本不同,本指标可让您选择其他时间框架,例如在 M15 或 H1 图表上直接展示 日线 ATR 。 运行原理:
本指标从您选定的时间框架(如 H1、H4 或 D1)提取 ATR 值,并以与标准 ATR 相同的方式在独立窗口中绘制。它会自动将较高时间框架的条形对齐当前图表,使您在分析短周期走势时,了解更高周期的波动情况。同时,图表上还会显示一个 以点(pips)为单位 的当前 ATR 值标签,该值根据您的经纪商报价精度(2–6位小数)自动转换并四舍五入。 交易者实用用途: 跨时间框架波动性背景 — 在操作低周期图表时,监控高周期如日线或周线的 ATR,以判断市场何时处于扩张或收缩状态。 仓位规模制定 — 使用以 pips 表示的当前 ATR 值来设置止损或计算仓位规模,使其与市场波动性成比例。 交易时机把握 — ATR 上升时可确认突破或趋势阶段;ATR 下降时可警示合并阶段。 策略过滤器 —
FREE

The SPV Volatility indicator is one of the most effective filters. Volatility filter. Shows three volatility options. The so-called limit, real, and the last most effective filter for the filter is the percentage filter. Percentage display of folatility shows the ratio of limit to real volatility. And thus, if we trade in the middle of the channel, then it is necessary to set a condition that the percentage is less than a certain indicator value. If we trade on the channel breakout - following t
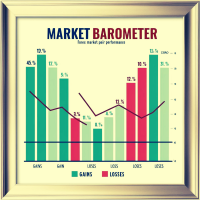
Market Barometer is a cheat code for trading, it acts as a "barometer" for market sentiment across various pairs, showcasing their changes. You can tell right away what to trade. You can trade trends or reversals. MT5 Version: https://www.mql5.com/en/market/product/127467 Market Barometer is a powerful tool designed to track and visualize the percentage changes across multiple currency pairs. By analyzing the price shifts of different forex pairs, it helps you understand how they are correlat
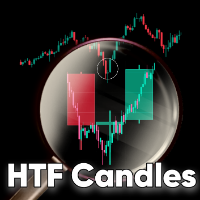
HTF Candles MT4 is a mt4 indicator which plots the outline of the higher time-frame candles on the lower candle, including any MT5 higher time-frame chosen. The indicator gives you the option to choose whether or not to view live current HTF candle, with no lag or repainting. Features MT5 Period Candles: This indicator plots any mt5 time-frame candle e.g m3, m5, m12, m15, m20... and so on, on the lower time-frame. Heiken Ashi Options: You have the option to view the HTF Heiken ashi instead of

This indicator is designed to detect high probability reversal patterns: Double Tops/Bottoms with fake breakouts . Please read also the blog post " How To Yield Big Winners Consistently! " which explains the concepts behind the ULTIMATE Double Top/Bottom indicator and how you can use a top-down approach to get 15 - 20R winning trades on a regular basis . The provided video shows the maximum performance of the indicator. With maximum performance, I mean that this could have been the profit if you

Gold Trend M1 - Optimized Scalping Tool for Gold (XAUUSD) Gold Trend M1 is a high-frequency trading indicator for the MetaTrader 4 platform, specifically optimized for the M1 timeframe on the Gold market. It combines a powerful SuperTrend trend filter with buy/sell signals derived from Heiken Ashi calculation logic, helping traders identify precise and disciplined entry points for optimal trading performance.
Key Features Optimized for M1 Scalping: Specifically developed for high-speed scalping
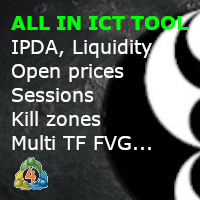
ICT Template Indicator visualizes and automatically updates all important ICT elements for Scalpers, Day and Swing traders. It allows you too keep your chart clean and bring any elements by just one click to the side buttons. Thanks to mobile notifications on external liquidity levels, you will not miss any opportunity and you don't have to sit behind the screens whole day. Each element has fully customizable colours, width, line types, max timeframe to be shown etc... so you can really tweak y

SmoothedRSI 是一款自定义指标:先计算标准 RSI,然后对 RSI 数值应用所选的平滑方法。指标仅在独立窗口中显示一条平滑后的 RSI 线,输出范围为 0–100。 RSI 对短周期价格波动较为敏感,在某些市场条件下会出现较多细小震荡。本指标通过对 RSI 数值进行进一步平滑处理,以减少短期噪声,使更大级别的动量变化更容易观察。 基本规格 显示:一条平滑 RSI 线(0–100) 平滑方法:SMA / EMA / WMA / SMMA / ALMA 平滑周期可调 水平参考线:默认 70 / 50 / 30(可自行修改) 标准 RSI:默认隐藏;通过设置线条颜色可显示(隐藏选项) 使用说明 通过平滑线确认方向
与标准 RSI 相比,平滑 RSI 往往能更清晰地呈现上行/下行阶段以及切换点,适合用于关注动量趋势,而非短期细小波动。 将水平线(如 70 / 50 / 30)作为参考 Upper / Lower:用于整理市场状态的参考值,并不代表反转或延续的保证。 Middle(50):观察曲线在 50 上下停留的时间,可用于理解动量偏向。 平滑方法选择(一般参考) SMA:简单、中
FREE

as the name suggest Trend Maker Master is a trend scalping indicator that give long and short trading opportunity based on price action and ma style trend filter, the indicator Trend Period and Trend Extra Filter will change arrows signals quality and frequency, this leave a space for trader to come out with good combos for each pair. How to trade : Buy : when white buy arrow prints, set sl below recent swing low, and set tp to 1-1 Risk to reward ratio. Sell : when white Sell arrow prints, set
FREE
该指标根据指定的系数找到一个低,高,极端的体积,并用指定的颜色绘制它们。 它取代了metatrader终端中的标准体积绘制功能。 蜡烛也可以在体积的颜色着色。 在具有极端体积的烛台上,确定最大水平体积(cluster/POC)。 根据它的位置(推动,中立,停止),集群也有自己的颜色。 如果集群在阴影中,并且蜡烛有一个极端的体积,那么我们得到一个逆转的箭头。 您可以在设置中启用警报。 此外,指示器中还有一个单独的选项,以阴影显示群集。
输入参数 。 (一些与颜色和视觉设置相关的跳过) 。
基本设置 。 Bars Count – 指标将工作的历史柱数 。 Data Source - 报价时间范围的选择。 如果您认为您认为过去的历史被截断和不完整,那么为您正在研究的仪器下载更多M1报价。 Vertical Step - 影响密度和垂直精度 。 Calc Bars - 用于体积计算的平均蜡烛数 。 Low Volume Factor - 我们固定最小音量的系数。 如果不需要,请将值设置为0 。 High Volume Factor - 我们固定大体积的系数 。 Extreme Volum
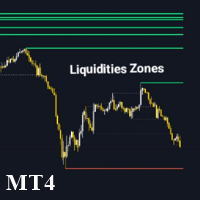
Liquidity Zone Detector 是一款高级技术指标,旨在通过使用 ZigZag 指标来识别和标注市场中的关键流动性区域。该工具通过在 ZigZag 检测到的高点和低点绘制趋势线来定位可能存在显著流动性的价格水平。Liquidity Zone Detector 帮助交易者根据流动性的累积或释放发现潜在的反转或趋势延续区域。 主要特点: 自动识别流动性区域 :在 ZigZag 指标识别的高点和低点绘制趋势线。 高级定制 :可配置流动性线的颜色、厚度和样式。 动态颜色变化 :当流动性水平被突破时,可选择更改线条颜色。 可调 ZigZag 参数 :调整 ZigZag 的深度、偏差和回溯步长以获得更精确的检测。 Liquidity Zone Detector 是分析市场结构并识别可能发生显著价格变动的关键区域的交易者的必备工具。
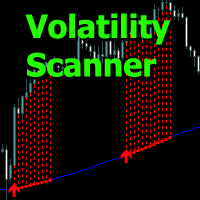
Volatility Scanner - 该指标分析市场状况,并用直方图显示波动率上升的区域。
该指标允许您确定入场和持仓的时机、顺势操作或观望的时机。
输入参数允许您根据所需的交易工具或时间范围独立配置指标。
适用于从分钟到日的任何时间范围。
提供多种警报类型。
所有指标信号均不会重新绘制且无滞后,在K线收盘时显示。
适用于从剥头皮交易到日内交易的任何交易系统。
指标工作原理
该指标包含一条移动平均线,并以此为基准进行进一步计算。“ Moving Average Period ”参数可以通过更改趋势方向的周期进行调整。 垂直蓝线表示熊市中波动率的上升。 垂直红线表示牛市中波动率的上升。 “ Candles Calculation ”参数用于更改用于计算波动率的K线数量。

The indicator looks for consolidation (flat) in the market at a certain time, builds a box-channel and marks levels indented from it for a breakdawn. After crossing one of the levels, the indicator marks the zone for take profit and calculates the corresponding profit or loss in the direction of this entry on the panel. Thus, the indicator, adjusting to the market, finds a flat area of the market, with the beginning of a trend movement to enter it. Version for MT5: https://www.mql5.com/en/market
FREE

Crypto_Forex MT4 指标“趋势平直柱状图”,无需重绘。
- 趋势平直柱状图指标非常灵敏,比任何标准移动平均线都更高效。 - 它旨在显示当前市场状况:平缓、上升趋势、下降趋势。 - 指标有三种颜色:黄色表示平缓市场状况,红色表示下降趋势,绿色表示上升趋势(可在设置中更改颜色)。 - 提供移动端和 PC 端警报。 - 此指标可与其他交易方法结合使用,例如价格行为、剥头皮交易、动量交易和其他指标。 ................................................................................................................. 点击这里查看高质量的交易机器人和指标! 这是仅在 MQL5 网站上提供的原创产品。
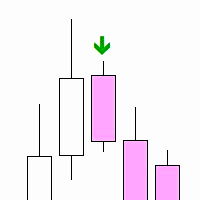
"Inside Bar PA" is a technical indicator designed to determine the inner bars on the chart. An internal bar is a bar or candle, the maximum and minimum of which are completely contained in the previous bar. This may signal a potential reversal or continuation of the trend, depending on the context.
Features: Automatic detection of internal bars. Visual marking of internal bars with arrows on the chart. The ability to adjust the distance of the mark from the bar. How to use: Attach the indicato
FREE

YOU CAN NOW DOWNLOAD FREE VERSIONS OF OUR PAID INDICATORS . IT'S OUR WAY OF GIVING BACK TO THE COMMUNITY ! >>> GO HERE TO DOWNLOAD Most of the time, market reversals / pull backs usually follow volume and price spikes thus these spikes could be the first indication of an exhaustion and possible reversal/pullback. High volume Turns is an indicator that scans the market for price and volume spikes around over-bought/over-sold market conditions. These spikes when spotted serves as the first indi
FREE

Introduction This indicator detects volume spread patterns for buy and sell opportunity. The patterns include demand and supply patterns. You might use each pattern for trading. However, these patterns are best used to detect the demand zone (=accumulation area) and supply zone (=distribution area). Demand pattern indicates generally potential buying opportunity. Supply pattern indicates generally potential selling opportunity. These are the underlying patterns rather than direct price action. T
FREE
MetaTrader市场是一个简单方便的网站,在这里开发者可以出售自己的交易应用程序。
我们将帮助您发布您的产品,并向您解释如何为市场准备您的产品描述。市场上所有的应用程序都是加密保护并且只能在买家的电脑上运行。非法拷贝是不可能的。
您错过了交易机会:
- 免费交易应用程序
- 8,000+信号可供复制
- 探索金融市场的经济新闻
注册
登录