Regardez les tutoriels vidéo de Market sur YouTube
Comment acheter un robot de trading ou un indicateur
Exécutez votre EA sur
hébergement virtuel
hébergement virtuel
Test un indicateur/robot de trading avant d'acheter
Vous voulez gagner de l'argent sur Market ?
Comment présenter un produit pour qu'il se vende bien
Indicateurs techniques pour MetaTrader 4 - 14
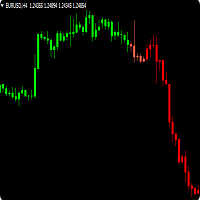
Trendfinder SMA are Colored candlesticks showing the trend based on two Simple Moving Averages and the slope of the slow moving average. This indicator will give you the color change on the next bar on the confirmation candle and will never repaint Trendfinder SMA is optimize to trade on any market and to be used trending and None trending markets. PLEASE TAKE NOTICE: For best results use this indicator as an extra tools after you have completed your regular analysis and use it for alerts base
FREE

TDI Multi Timeframe Scanner:
This Dashboard indicator uses the TDI (Trader's Dynamic Index) Indicator to find best trades. Read detailed How to Use Guide: https://www.mql5.com/en/blogs/post/758252
Extra indicators also available in above post.
Checks for: - SharkFin Pattern Free indicator for SharkFin: https://www.mql5.com/en/market/product/42405/ - TDI Trend: Strong/Weak Trend Up/Down - TDI Signal: Strong/Medium/Weak Signal for Buy/Sell - Consolidation - Overbought/Oversold - Volatility Ban

This is based on Demark's TD Sequential and TD Combo set of indicators. It mostly has the TD Sequential features. It contains the Arrows Indicator showing Buy/Sell signals and the scanner dashboard. Both are for MT4 (Metatrader 4) Platform.
Read in detail in this blog post. And get extra indicators here: https://www.mql5.com/en/blogs/post/749596 and commentary about signals and how to wait for right time: https://www.mql5.com/en/blogs/post/759157
Feature List: - Set TD Setup (9), Countdown (13

BUY INDICATOR AND GET A PIVOT POINT EA FOR FREE AS A BONUS + SOME OTHER GIFTS! ITALO PIVOTS INDICATOR is the best pivot point indicator for strong price reversals and continuations of price movements ever created , and why is that? You will have for the first time inside a pivot point indicator the pivots above the monthly, so, you will have the 3-month pivot lines, 6 months, 1 year, 2 years, 3 years, 5 years and 10 years, very strong support and resistances. Not only that but for the fi

The Supply and Demand with Swap zones MTF indicator is a powerful tool for technical analysis that has been modified and enhanced to provide traders with even more valuable information. This tool is based on the rule of supply and demand and allows traders to analyze a chart on three different timeframes at once, providing a more comprehensive view of the market. One of the key features of this indicator is the so-called swap zones, which are areas that have been broken through by the price but
FREE
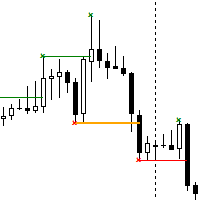
The Break of Structure (BoS) and Change of Character indicator is a powerful tool designed to identify significant turning points in price movements on financial charts within the MetaTrader 4 platform. By analyzing price action, this indicator highlights instances where the market shifts from a trend to a potential reversal or consolidation phase. Utilizing sophisticated algorithms, the indicator identifies breakouts where the structure of price movement undergoes notable changes. These breakou
FREE
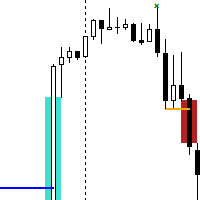
The Break of Structure (BoS) and Change of Character indicator with Fair Value Gap (FVG) filter is a specialized tool designed to enhance trading strategies by pinpointing high-probability trading opportunities on price charts. By integrating the BoS and Change of Character concepts with the FVG formation, this indicator provides traders with a robust filtering mechanism to identify optimal entry and exit points. The indicator identifies instances where the structure of price movements is disrup
FREE

Après avoir acheté l'indicateur Tpx Dash Supply Demand, vous devez télécharger l'indicateur qui se connectera à ce dernier et lui fournira les données de marché. Il vous fournira également tous les signaux de prix de l'offre et de la demande, l'ATR Stop, le VAH et le VAL, les valeurs de tendance avec l'ADX, ainsi que les prix et les emplacements des points de contact (POC) sur le marché. Il vous suffit de le télécharger et Dash le localisera pour récupérer les informations !
FREE

Tipu Trend is a non-lag, non-repaint, smart indicator, that shows the trend of selected time frames.
Features Customizable Buy/Sell alerts, push alerts, email alerts, or visual on-screen alerts. As easy to trade indicator that smooths the noise in the price action. Highlights ranging markets. Add Tipu Panel (found here ) and unlock the following additional features. An easy to use Panel that shows the trend + signal of the selected time frames. Customizable Panel. The panel can be moved to any
FREE

The ADX Indicator is known to be used to determine the trend direction. Not only that, but it also has deviation (+DI and -DI) that determine the direction of the trend as well. The role of the indicator is to spot the trend and its direction and generate signals accordingly.
Indicator Settings: - ADX period : default is 14 periods (it works best with the timeframe H1). - Signal Width : the size of signals arrows. - Signal Distance : the distance of the signal arrow from the candle. - Signal co
FREE

Multi Time Frame Indicator acts as a Scanner based on the Ichimoku Trading System. The outcome is displayed on a board. This helps you to make "at a glance" a mental picture of the System without having to open the chart. Up to 10 Currencies can be watched. Scanned elements And Legend "KUMO Futur" - Green : The Kumo Futur is Bullish. "KUMO Futur" - Red : The Kumo Futur is Bearish. "PRICE Cross KJ" - Green : The Price is Above the Kijun Sen. "PRICE Cross KJ" - Red : The Price is Below the Kijun
FREE
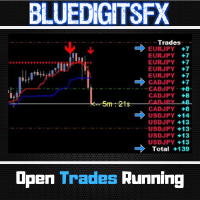
BlueDigitsFx Open Trades est un outil puissant pour MT4 qui affiche en temps réel le total des pips de toutes les positions ouvertes. Son interface intuitive, codée par couleurs, indique rapidement les trades gagnants et perdants sur toutes les paires de devises. Cela vous aide à suivre vos performances de trading facilement, permettant une prise de décision plus rapide et une meilleure gestion de vos positions.
FREE
Double top and bottom indicator is a pattern scanning indicator which scans the tops and bottoms using zig zag pattern. When it find price bouncing back from the same point twice after a long trend then it generate arrow signals whenever the last resistance points is broken for double bottom and last support price broken for double top. Unlike other top bottom scanner it does not give only 1 signal. it alerts user when ever the last support /resistance is broker from double top/bottom pattern un
FREE
Magic Supply Demand Indicator works on all products and timeframes. It is a new formula, and the very new features are two zone strength functions adjustable by user input! This is a great advantage in trading. When you learn how to use the proprietary features such as the zone strength with min X-factor of price travel away, you will be able to tell whether the zone is strong or not.
The supply and demand zones are used as an alert trigger. You can use popup alert with sound on MetaTra
FREE

A unique author's strategy that simultaneously determines the trend reversal, entry points and estimated profit levels for each transaction. The indicator can determine entry points on any trading period, starting with the M5 chart to W1. At the same time, for the convenience of the user, an arrow is always drawn at a certain point and the recommended profit levels (Take Profit1, Take Profit2, Manual Take Profit) the Stop Loss level is also displayed.
A great advantage of the indicator Trend Sw
Imaginez: vous êtes sur le point de réaliser d'énormes profits, mais le marché change soudainement et vous manquez une chance. Ou pire, au lieu de profits, vous obtenez des pertes. Et si vous aviez un allié fiable qui murmure à l'avance: "Préparez-vous-les vagues arrivent!"? Découvrez Harbinger , un indicateur révolutionnaire pour MetaTrader 4 spécialement conçu pour les traders qui sont fatigués du chaos et qui veulent anticiper les changements du marché! Harbinger est un algorithme intelligent
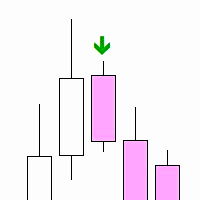
"Inside Bar PA" is a technical indicator designed to determine the inner bars on the chart. An internal bar is a bar or candle, the maximum and minimum of which are completely contained in the previous bar. This may signal a potential reversal or continuation of the trend, depending on the context.
Features: Automatic detection of internal bars. Visual marking of internal bars with arrows on the chart. The ability to adjust the distance of the mark from the bar. How to use: Attach the indicato
FREE

Titre du produit Smart Williams' %R (MT4) – partie de la série SmartView Indicators Description courte Indicateur Williams' %R avec une expérience utilisateur unique sur la plateforme MetaTrader. Offre des capacités avancées non disponibles auparavant, telles que l'ouverture des paramètres par double-clic, le masquage et l'affichage des indicateurs sans les supprimer, et l'affichage de la fenêtre de l'indicateur en taille pleine du graphique. Conçu pour fonctionner parfaitement avec le reste de
FREE
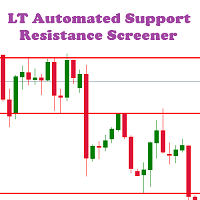
LT Automated Support Resistance Screener is a level indicator or a support resistance indicator that can be used to determine the level of support and resistance values. This indicator is free and easy to used in the Metatrader 4 platform which is built using the MQL4 programming language. Support resistance indicator is an important indicator that is often to used, but it is not available on the MT4 platform. This indicator can be used for all markets like forex, indices, gold etc and all time
FREE
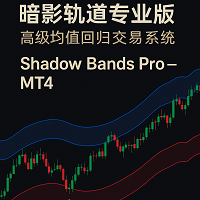
Shadow Bands Pro – MT4 说明(中英文) English Description (MT4) Shadow Bands Pro – Advanced Reversion System for MT4 Shadow Bands Pro is a non-repainting (on candle close) trend-reversal and mean-reversion indicator designed for traders who need clear, rule-based entries and exits.
By combining a dynamic volatility band, entity-break logic, and a built-in statistics panel, it helps you quickly see where price is stretched and where high-probability reversals may occur. Key Features Non-repainting on
FREE
The Pulse est un indicateur qui montre la période d'accumulation en temps réel.
En termes simples: la accumulation est lorsque l'argent intelligent recueille discrètement un actif avant de lancer un mouvement puissant sur le marché.
Sur le graphique, il semble que le prix soit "coincé" dans une fourchette. C'est la phase d'accumulation — quelqu'un se prépare pour le grand déménagement.
Et si vous apprenez à remarquer ces moments — où le marché semble "geler", mais il y a une tension — vous po
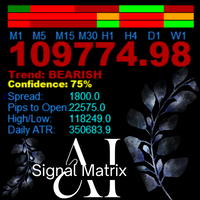
AanIsnaini Signal Matrix Multi-Timeframe Confidence Signal Dashboard AanIsnaini Signal Matrix is a powerful all-in-one indicator that analyzes market direction and confidence levels across multiple timeframes — allowing traders to see the overall bias of the market at a single glance. It combines signals from Price Action , Support–Resistance , and several proven technical tools (MACD, ADX, RSI, MA slope, ATR, and Volume Ratio), then calculates a confidence score showing how strongly th
FREE

Gorilla Channel VZ est un indicateur de canal développé sur la base de nombreuses années d'observations.
Un indicateur de trading de signaux peut être utilisé à la fois comme indicateur d'affichage d'un canal de tendance et comme l'une des sources de signaux d'entrée, sous réserve d'un filtrage supplémentaire. Avec une approche appropriée, au moins 80% des transactions réussies.
Principales caractéristiques de Gorilla Channel VZ: Fonctions analytiques
Peut être utilisé sur toutes les paires
FREE

[NEW RELEASE] Horse All in Signal – WinWiFi Robot Series ต้อนรับปีใหม่ 2026 ด้วยความมั่งคั่งและพลังที่คึกคักเหมือนม้าศึก! สัมผัสประสบการณ์การเทรดเหนือระดับกับอินดิเคเตอร์ตัวล่าสุดจาก WinWiFi Robot Series ในชื่อ "Horse All in Signal" เครื่องมือที่จะเปลี่ยนกราฟของคุณให้กลายเป็นสนามทำกำไร ด้วยระบบ AI อัจฉริยะที่สแกน Price Action ในทุกช่วงเวลา คุณสมบัติเด่น (Key Features): AI Price Action Engine: วิเคราะห์พฤติกรรมราคาแบบ Real-time แม่นยำทั้งในช่วงตลาดมีเทรนด์ (Trend) และช่วงพักตัว (Sideway)
FREE
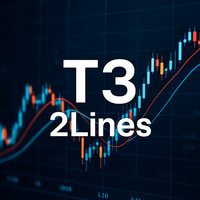
T3 2Lines – Analyse de tendance précise avec deux lignes T3 “T3 2Lines” est un indicateur pour MT4 qui affiche simultanément deux moyennes mobiles T3 (Triple Exponential Moving Average) sur le graphique : une ligne à court terme et une à long terme. Grâce à ces deux courbes lissées, les traders peuvent mieux détecter le début, la continuation et les éventuels retournements de tendance. Fonctionnalités principales Affichage simultané de deux lignes T3 (courte et longue) Période et facteur de liss
FREE

Necessary for traders: tools and indicators Waves automatically calculate indicators, channel trend trading Perfect trend-wave automatic calculation channel calculation , MT4 Perfect trend-wave automatic calculation channel calculation , MT5 Local Trading copying Easy And Fast Copy , MT4 Easy And Fast Copy , MT5 Local Trading copying For DEMO Easy And Fast Copy , MT4 DEMO Easy And Fast Copy , MT5 DEMO Advanced Bollinger Bands:
1. The Bollinger rail will change color with the direction"
2. The
FREE

L'indicateur mesure le déséquilibre entre les haussiers et les baissiers sur une période donnée et affiche une ligne droite entre les deux points.
Si les haussiers ont plus de volume que les baissiers, la ligne devient verte. Si les baissiers ont plus de volume, elle est rouge. La ligne indique également le pourcentage de différence de volume.
L'indicateur affiche les mêmes données dans une fenêtre séparée. Vous pouvez également voir le volume divisé.
L'indicateur a deux modes.
À cet effe

The Gann Box (or Gann Square) is a market analysis method based on the "Mathematical formula for market predictions" article by W.D. Gann. This indicator can plot three models of Squares: 90, 52(104), 144. There are six variants of grids and two variants of arcs. You can plot multiple squares on one chart simultaneously.
Parameters Square — selection of a Gann square model: 90 — square of 90 (or square of nine); 52 (104) — square of 52 (or 104); 144 — universal square of 144; 144 (full) — "fu

--- FREE VERSION - WORKS ONY ON EURUSD
------------------------------------------------------------------- This is a unique breakout strategy that is used for determination of the next short term trend/move. The full system is available on MQL5 under the name "Forecast System". Here is the link --> https://www.mql5.com/en/market/product/104166?source=Site Backtest is not possible, because calculations are done based on the data of all timeframes/periods. Therefore I propose you use the technolo
FREE

Alan Hull's moving average, more sensitive to the current price activity than the normal MA. Reacts to the trend changes faster, displays the price movement more clearly. Color version of the indicator. Improvement of the original version of the indicator by Sergey <wizardserg@mail.ru>. Suitable for all timeframes.
Parameters Period - smoothing period, recommended values are from 9 to 64. The greater the period, the smoother the indicator. Method - smoothing method, suitable values are 0, 1, 2
FREE

as the name suggest Trend Maker Master is a trend scalping indicator that give long and short trading opportunity based on price action and ma style trend filter, the indicator Trend Period and Trend Extra Filter will change arrows signals quality and frequency, this leave a space for trader to come out with good combos for each pair. How to trade : Buy : when white buy arrow prints, set sl below recent swing low, and set tp to 1-1 Risk to reward ratio. Sell : when white Sell arrow prints, set
FREE

The Turtle Trading Indicator implements the original Dennis Richards and Bill Eckhart trading system, commonly known as The Turtle Trader. This trend following system relies on breakouts of historical highs and lows to take and close trades: it is the complete opposite to the "buy low and sell high" approach. The main rule is "Trade an N-day breakout and take profits when an M-day high or low is breached (N must me above M)". [ Installation Guide | Update Guide | Troubleshooting | FAQ | All Prod
FREE

Pivot Classic, Woodie, Camarilla, Fibonacci and Demark
Floor/Classic Les points pivots, ou simplement les pivots, sont utiles pour identifier les niveaux de support/résistance potentiels, les fourchettes de négociation, les inversions de tendance et le sentiment du marché en examinant les valeurs hautes, basses et de clôture d'un actif. Les points pivots Floor/Classic peuvent être calculés comme suit. Pivot Point (P) = (High + Low + Close)/3 S1 = P * 2 - High S2 = P - (High - Low) S3 = Low – 2*
FREE

The indicator defines the buy and sell arrows with high performance and consistent results. Trend Reverting PRO indicator is suitable for trend trading or following the trend - Test for free!.. Professional and accurate trading system ;
Displays the current market situation; Automatic analysis of market opportunities ; Help traders earn more from their investments;
Never repaints, recalculates or backpaints signals; Test how it works download Now! This is FREE version of the indicator and wo
FREE

Powerful non-repainting tool for intraday or swing tading, part of the Power Lines Trading System, used in real trading on a daily basis with proven solid trading signals. The Power Lines indicator is pretty straightforward and easy to set up and can be used perfectly on every timeframe and with every currency pair or other financial instrument. For intraday trading the using of M5, M15 or M30 timeframes and for swing trading H1, H4 or D are recommended. Avoid M1 and be careful with M5 timeframe
FREE

Indicateur de recherche de prix magnétique, le prix moyen vers lequel le prix tend à revenir. Optimisé pour XAUUSD H1. Il possède 3 lignes, la ligne centrale étant le prix sur lequel il faut se concentrer. Sur la base des données historiques, le taux de succès du retour au prix moyen a dépassé 92% avec les paramètres par défaut ; dans les autres cas, le stop loss, qui est défini par défaut, a été déclenché. Le point d'entrée et l'heure d'entrée sont approximativement au début de la journée et, p
FREE
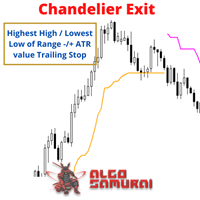
Developed by Chuck LeBeau, the Chandelier Exit indicator uses the highest high / lowest low -/+ a multiple of the ATR value to draw trailing stop lines (orange under buys, magenta over sells) that advance with the trend until the trend changes direction.The value of this trailing stop is that it rapidly moves upward in response to the market action. LeBeau chose the chandelier name because "just as a chandelier hangs down from the ceiling of a room, the chandelier exit hangs down from the high
FREE

Titre du produit Smart Ichimoku (MT4) – partie de la série SmartView Indicators Description courte Indicateur Ichimoku avec une expérience utilisateur unique sur la plateforme MetaTrader. Offre des capacités avancées non disponibles auparavant, telles que l'ouverture des paramètres par double-clic, le masquage et l'affichage des indicateurs sans les supprimer, et l'affichage de la fenêtre de l'indicateur en taille pleine du graphique. Conçu pour fonctionner parfaitement avec le reste de la série
FREE
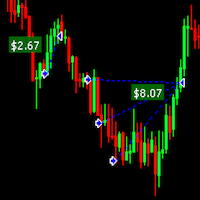
Draw Profit indicator can efficiently help those traders who want to see on the chart all closed positions output: profit or loss. If set DrawProfit on your chart managed by an Expert Advisor (EA) you will see clearly it’s performance by its profits & losses. My other products: https://www.mql5.com/en/users/hoangvudb/seller
Input parameters: Show Profit Labels : show profit of orders with a label (true/false). Profit Mode : available options: Show in currency. Show in pips. Show in currency a
FREE

Buy Sell Magic AI – Dynamic Trend Line & Bollinger Bands for MT4 Buy Sell Magic AI is a professional indicator for MetaTrader 4 that combines the power of Bollinger Bands with a dynamic central midline that acts as a real-time trend line . It delivers clear entry signals, visual trend confirmation, and automatic Stop Loss placement—plus a built-in candle timer for precise trade timing. My indicators for free. I only ask that leave your feedback to help me improve them or as a thank you. Have
FREE

First RSI level indicator analyzes and displays the level, at which the first crossing of the standard RSI maximum or minimum value took place for the subsequent definition of strong trends. The indicator allows you to track the beginning of a trend that does not follow the signals of the standard RSI trading strategy, for example, when the price rushes downwards after reaching an oversold level instead of reversing. In this case, we have to conclude that a strong trend is underway and the next
FREE

Il s'agit d'un produit gratuit que vous êtes libre d'utiliser pour vos besoins !
J'apprécie également beaucoup vos commentaires positifs ! Merci beaucoup !
Cliquez ici pour découvrir des robots de trading et des indicateurs de haute qualité !
Affichage du spread de l'indicateur Forex pour MT4, excellent outil de trading auxiliaire.
- L'indicateur Spread Display affiche le spread actuel de la paire de devises à laquelle il est attaché. - Il est possible de localiser la valeur d'affichage du
FREE

Gina Dual TPO — Brief MQL4 indicator TPO + Volume profile overlaid on chart — fast, scalable, and beginner-friendly. Built for traders who read market structure by POC and Value Area. What it is An MQL4 indicator that overlays dual market profiles—Time-at-Price (TPO) and Volume-at-Price (VPO)—directly on your chart. It’s fast (pixel-based drawing), scalable, and beginner-friendly. Who it’s for Intraday and swing traders who read market structure via POC (Point of Control) and Value Area to spot
FREE
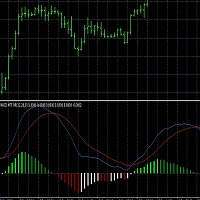
This script generates a MACD with 6 color-coded histogram bars based on the position (above or below zero) and direction (rising or falling) of the histogram. It provides multi-time frame support , allowing users to view the MACD from different time frames on a single chart. The indicator uses customizable settings for MACD periods, histogram width, and vertical scaling. This script could be useful for traders who want a visually enhanced MACD with clearer trend and momentum representation acro
FREE
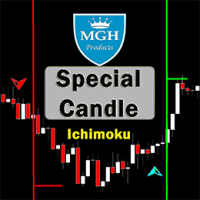
Bougie spéciale
Voulez-vous utiliser l'un des meilleurs indicateurs Forex avec une stratégie Ichimoku réussie ? Vous pouvez utiliser cet indicateur impressionnant qui est basé sur la stratégie Ichimoku.
La version MT5 est disponible ici .
Première stratégie :
Cette stratégie consiste à identifier des croisements forts similaires qui se produisent rarement.
Les meilleurs délais pour cette stratégie sont de 30 minutes (30M) et d'une heure (H1).
Les symboles appropriés pour le laps de temps de 30

Ou ( BD% ) qui est un indice de volatilité qui mesure la volatilité en pourcentage plutôt qu'en points. L'idée de BD% est de créer un indice en fonction de l'écart type classique (CSD) qui évolue entre 0 et 100 pour cent.
Vous pouvez utiliser BD% pour comparer la volatilité d'un même titre sur différentes périodes ou sur différentes périodes. De plus, vous pouvez utiliser BD% pour comparer la volatilité entre différents titres sur différents marchés en termes de pourcentage plutôt que de points
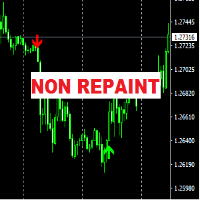
The "FCK Trend Arrow No Repaint" indicator is designed for analyzing market dynamics and determining potential trading signal moments. The main feature of this indicator is the absence of signal repainting, which contributes to more accurate and reliable forecasting of price movements in the market.
Mechanism of Operation: The "FCK Trend Arrow No Repaint" indicator uses several types of graphical elements to indicate trading signals: Up and Down Arrows: The indicator marks possible market entr
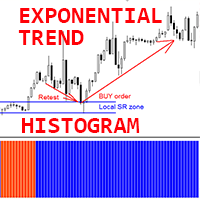
Indicateur Crypto_Forex « Histogramme de tendance exponentielle » pour MT4, sans refonte.
- L'indicateur Histogramme de tendance exponentielle est très efficace pour la détection de tendance. - La meilleure façon de l'utiliser est de combiner les niveaux de support/résistance et la technique de retest (voir images) : - Une fois que l'indicateur détecte une nouvelle tendance, recherchez le niveau SR local et placez l'ordre en attente correspondant en attendant un retest de cette zone. - Si la n
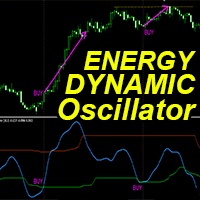
« Dynamic Energy Oscillator » est un indicateur Crypto Forex personnalisé avancé, un outil de trading performant pour MT4 !
- Nouvelle génération d'oscillateurs - voir les images pour comprendre son utilisation. - L'oscillateur Dynamic Energy Oscillator intègre des zones de survente/surachat adaptatives. - Cet indicateur de momentum technique est très utile sur les marchés en tendance. - L'oscillateur est un outil auxiliaire permettant de trouver des points d'entrée précis dans les zones de su
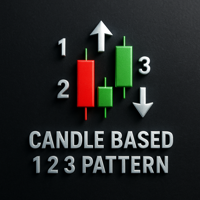
Motif 1 2 3 Basé sur les Bougies Le Motif 1 2 3 Basé sur les Bougies est un indicateur qui identifie des configurations de retournement à haute probabilité en s’appuyant sur la structure classique de prix 1-2-3, à partir de la formation des bougies et des points de swing. Il n’affiche les signaux qu’après une confirmation de rupture , ce qui réduit le bruit et évite les entrées prématurées. Fonctionnalités principales : Détection basée sur les bougies des motifs 1-2-3 haussiers et baissiers conf

Immediately plots renko bars in an external/indicator window. One of the distinctive advantages Renko charts offer is the fact that they are not time dependent. Therefore, the new Renko blocks are only traced when the price moves higher or lower by the specified number of points.
For example, a 10 pip (100 points) Renko chart would plot the blocks when price moves 10 pips higher in an uptrend or 10 pips lower in a downtrend. Renko charts removes "noises" from the Market and i t helps to identi

Future Trend Channel est un indicateur dynamique et visuellement intuitif conçu pour identifier les directions de tendance et anticiper les mouvements de prix potentiels. Développé à l'origine par ChartPrime pour TradingView, cet outil a été adapté pour MetaTrader 4, offrant aux traders une fonctionnalité similaire. Que vous soyez trader swing, day trader ou investisseur à long terme, le Future Trend Channel vous aide à visualiser la force des tendances, anticiper les renversements et optimiser

Introduction Harmonic Patterns are best used to predict potential turning point. Traditionally, Harmonic Pattern was identified manually connecting peaks and troughs points in the chart. Manual harmonic pattern detection is painfully tedious and not suitable for everyone. You are often exposed under subjective pattern identification with manual pattern detection. To avoid these limitations, Harmonic Pattern Plus was designed to automate your harmonic pattern detection process. The functionality

CS ATR FIBO CHANNELS MULTI TIMEFRAME
Additional tool to trade with Cycle Sniper Indicator.
Cycle Sniper : https://www.mql5.com/en/market/product/51950 Indicator Draws Channels based on: - Cycle Sniper Price and Moving Averages - ATR Deviations - Fibonacci Retracement and Extensions
Features: - Multi TimeFrame - Full alert and Notification options. - Simple Settings - Finds the trend change or extreme reversals.
Inputs: - Arrow Mode: ATR Levels or Median Line If Median Line is selected ind

The ACB Trade Filter indicator provides a solution for filtering out the low probability trading setups in a trading strategy. The indicator uses a sophisticated filtration algorithm based on the market sentiment and trend.
Applications Works great with our indicator " ACB Breakout Arrows ". Filter out low probability signals from any indicator. Avoid overtrading and minimize the losses. Trade in the direction of market sentiment and trend. Avoid the choppiness in the market.
How to use Only L
- Real price is 80$ - 60% Discount (It is 30$ now) - It is enabled for 1 purchase. Contact me for extra bonus tool, instruction or any questions! - Non-repaint, No lag - I just sell my products in Elif Kaya Profile, any other websites are stolen old versions, So no any new updates or support. - Lifetime update free
Introduction Smart Money Concepts (SMC) strategy was initially popularized the Inner Circle Trading (ICT) method which is claimed to be the evolved version of the SMC. Essenti
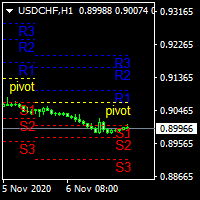
.................................if you need pivot point s levels............................... ............................this is a daily pivot point level creator........................... ...it is for daily pivots and show levels at times period H4 , H1 , M30 , M15 ,M 5... .................................also shows levels for 3 last days.............................. ................can use it with other indicators and see important levels...............
FREE

Smart Fibo Zones are powerful, auto-generated Fibonacci Retracements that are anchored to key market structure shifts . These zones serve as critical Supply and Demand levels, guiding you to identify potential price reactions and confirm market direction. Fibonacci calculations, widely used by professional traders, can be complex when it comes to identifying highs and lows. However, Smart Fibo Zones simplify this process by automatically highlighting order blocks and key zones, complete with St
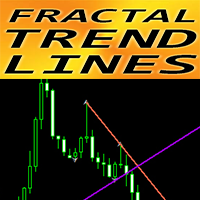
Indicateur Crypto_Forex "Fractal Trend Lines" pour MT4.
- Cet indicateur est excellent pour les traders qui utilisent l'analyse graphique avec des cassures !!! - "Fractal Trend Lines" affiche des lignes graphiques de tendance à la hausse (couleur violette) et de tendance à la baisse (couleur rouge). - Les lignes de tendance à la hausse et à la baisse sont construites sur 2 fractales correspondantes les plus proches. - L'indicateur a peu de paramètres responsables de la couleur et de la largeur
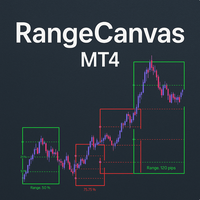
Daily Range Boxes : The indicator draws rectangular boxes around each day's high and low prices, creating a clear visual boundary for the daily trading range. Color-Coded Logic : Green boxes when the current price (or close) is above the daily open Red boxes when the current price is below the daily open Percentage Level Lines : Inside each box, it draws three horizontal lines at: 25% of the daily range 50% of the daily range (midpoint) 75% of the daily range Range Information : Each box displa
FREE
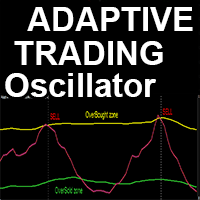
Indicateur Crypto_Forex personnalisé avancé « Oscillateur de Trading Adaptatif » : un outil de trading auxiliaire performant pour MT4 !
- Cet indicateur est un oscillateur nouvelle génération. Consultez les images pour découvrir comment l'utiliser. - L'« Oscillateur de Trading Adaptatif » dispose de zones de survente/surachat adaptatives et ajustables. - Cet oscillateur est un outil auxiliaire permettant de trouver des points d'entrée précis lors des sorties des zones de survente/surachat dyna
40% off. Original price: $50
Moving Average Trend Scanner is a multi symbol multi timeframe triple MA crossover dashboard that helps traders to monitor, and identify potential market trends from one chart. This panel scans 3 moving averages in up to 28 configurable instruments and 9 timeframes for triple moving average alignment and moving average crossover with a deep scan feature to scan all market watch symbols (up to 1000 instruments!).
Download Demo here (Scans only M1 and M5) Settings

RSI DIVERENCE INDICATOR
RSI divergence is very powerful pattern which is often used to detect a strong trend reversal. it also indicates the weakening of strong signal. So some traders want to use it as the exit criteria. This indicator works in all timeframe and send notification, alert or email to the user. It also show the Higher Highs and Lower Low Pattern with its corresponding RSI divergency. This indicator can be used in Expert Advisors as it has accessible buffers List of Inputs ______
FREE

The SPV Volatility indicator is one of the most effective filters. Volatility filter. Shows three volatility options. The so-called limit, real, and the last most effective filter for the filter is the percentage filter. Percentage display of folatility shows the ratio of limit to real volatility. And thus, if we trade in the middle of the channel, then it is necessary to set a condition that the percentage is less than a certain indicator value. If we trade on the channel breakout - following t
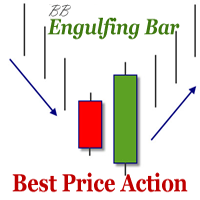
The indicator defines the Bullish and Bearish Engulfing Bar. The pattern has greater reliability when the open price of the engulfing candle is well above the close of the first candle, and when the close of the engulfing candle is well below the open of the first candle. For an engulfing bar to be valid it must fully engulf at least one previous bar or candle - includes all the body and the wick. The engulfing bar can engulf more than one bar as long as it completely engulfs the previous bar.
FREE
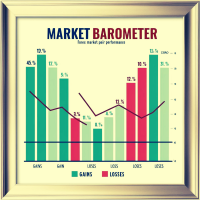
Market Barometer is a cheat code for trading, it acts as a "barometer" for market sentiment across various pairs, showcasing their changes. You can tell right away what to trade. You can trade trends or reversals. MT5 Version: https://www.mql5.com/en/market/product/127467 Market Barometer is a powerful tool designed to track and visualize the percentage changes across multiple currency pairs. By analyzing the price shifts of different forex pairs, it helps you understand how they are correlat
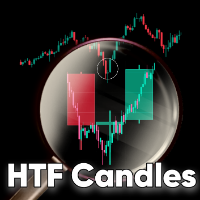
HTF Candles MT4 est un indicateur pour MT4 qui trace le contour des bougies de période supérieure (HTF) directement sur les bougies de période inférieure, y compris toute période HTF de MT5 choisie. L'indicateur vous offre la possibilité d'afficher ou non la bougie HTF actuelle en temps réel, sans décalage ni repainting. Fonctionnalités Bougies des Périodes MT5 : Trace les bougies de n'importe quelle période MT5 (ex : m3, m5, m12, m15, m20...) sur la période inférieure. Option Heiken Ashi

Dies ist ein durchschnittlicher Index basierend auf einem benutzerdefinierten Algorithmus. Je nach Band können Uplink und Downlink farblich identifiziert werden. Das Pop-up-Feld kann ein- oder ausgeschaltet werden, um anzuzeigen, dass der aktuelle Kauf- oder Verkaufsauftrag platziert werden soll.
Beschreibung der Parameterliste:
Extern int price = 0; / /anfänglicher Durchschnittspreis des Indikators
Externe int length = 20; / / der Indikator berechnet den Durchschnittszeitraum, der dem Du
FREE

This indicator is designed to detect high probability reversal patterns: Double Tops/Bottoms with fake breakouts . Please read also the blog post " How To Yield Big Winners Consistently! " which explains the concepts behind the ULTIMATE Double Top/Bottom indicator and how you can use a top-down approach to get 15 - 20R winning trades on a regular basis . The provided video shows the maximum performance of the indicator. With maximum performance, I mean that this could have been the profit if you
Gold Trend M1 - Optimized Scalping Tool for Gold (XAUUSD) Gold Trend M1 is a high-frequency trading indicator for the MetaTrader 4 platform, specifically optimized for the M1 timeframe on the Gold market. It combines a powerful SuperTrend trend filter with buy/sell signals derived from Heiken Ashi calculation logic, helping traders identify precise and disciplined entry points for optimal trading performance.
Key Features Optimized for M1 Scalping: Specifically developed for high-speed scalping
MetaTrader Market - les robots de trading et les indicateurs techniques pour les traders sont disponibles directement dans votre terminal de trading.
Le système de paiement MQL5.community est disponible pour tous les utilisateurs enregistrés du site MQL5.com pour les transactions sur les Services MetaTrader. Vous pouvez déposer et retirer de l'argent en utilisant WebMoney, PayPal ou une carte bancaire.
Vous manquez des opportunités de trading :
- Applications de trading gratuites
- Plus de 8 000 signaux à copier
- Actualités économiques pour explorer les marchés financiers
Inscription
Se connecter
Si vous n'avez pas de compte, veuillez vous inscrire
Autorisez l'utilisation de cookies pour vous connecter au site Web MQL5.com.
Veuillez activer les paramètres nécessaires dans votre navigateur, sinon vous ne pourrez pas vous connecter.