- Overview
- Reviews
- Comments
Lisek Weis Wave
This Weis Wave Volume indicator is a tool to help traders identify the current price trend.
Understanding volume can provide insight into a market's behavior to help you determine its overall health. The most important rule is this: volume precedes price. Typically, before a market price moves, volume comes into play.
It has 2 main colors histogram which are green and red.
– Green indicates an upward wave. The more the price increases, the bigger the green volume gets.
– The red color shows a decreasing wave. The more the price decreases, the bigger the red volume becomes.
Meaning of the Weis Wave Volume
When trading and analyzing the market, professional traders use the Weis Wave indicator primarily to determine the current price trend. Because this is the most intuitive signal that the indicator offers.
Recommended products

PipTick VWAP MT4
67 USD Michal Jurnik
PipTick VWAP is our version of Volume-Weighted Average Price indicator. VWAP is the ratio between the value traded (price multiplied by number of volume traded) and total volume traded over a specific time period. It measures the average price of the instrument much better than the simple moving average. Although there are many ways how to use the VWAP, most investors use it to calculate the daily average. The indicator works in five modes: Moving - In this mode the PipTick WVAP works as Moving

Magic Candles
34.90 USD Evgeny Belyaev
Magic Candles is a new unique product that allows identifying the current market phase (uptrend, downtrend or flat). This indicator paints bars in different colors depending on the current state of the market and signals the user about trend changes with alerts. Magic Candles is perfect for trading currencies (including cryptocurrencies) and binary options. Magic Candles is another product of the Magic series: Magic Arrow , Magic Histogram .
Advantages High accuracy of signals. Suitable for sc

Accumulation Profile
150 USD Ivan Vlasenko
A.Profile shows accumulation zones, support - resistance and zigzag levels. The largest and most relevant zones are combined into one non-linear histogram - Accumulation Profile. The profile shows support - resistance levels. The longer the line, the stronger the level. A.Profile unleashes the full potential of horizontal volume from the iRenko analytical platform. Renko size is set automatically. Renko size depends on volatility, timeframe and market. A.Profile works on time frames from M1 to H

PZ Lopez Pressure
30 USD Arturo Lopez Perez
This indicator anticipates price reversals analyzing bullish and bearish pressure in the market. The buying pressure is the sum of all the accumulation bars over a certain number of days, multiplied by the volume. The selling pressure is the sum of all of the distribution over the same number of bars, multiplied by the volume. [ Installation Guide | Update Guide | Troubleshooting | FAQ | All Products ] The indicator ratio gives you a measure of the buying pressure as a percentage of the total ac

Buy Sell Visual MTF V2 for MT4
69 USD Naththapach Thanakulchayanan
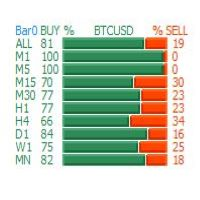
This MT4 indicator, Bull Bear Visual MTF V2, summarize the strength color graphic and percentages of power for both Bull and Bear in current market emotion stage which will show you in multi timeframes (9) and sum of the total Bull and Bear power strength which is an important information for traders especially you can see all Bull and Bear power in visualized graphic easily, Hope it will be helpful tool for you for making a good decision in trading.

Weis Wave for MT4
100 USD Ruslan Safin
This indicator is analogous to Weis Wave from the recognized expert David Weiss. It is a modern adaptation of the Wyckoff Method featuring 30-years experience on different markets. The main indicator objective is to calculate the cumulative volumes of the previous waves and the current one.
Indicator Features It responds to changes in a price behavior of the current wave. The indicator may begin to form a new unconfirmed wave. It works in all possible time periods. Four types of different pric

Market Marker MT4
39 USD Evgeny Shevtsov
The indicator displays peak levels of activity formed by the maximum volume, tracks the correlation of the candles on all timeframes (from the highest to the lowest one). Each volume level is a kind of key trading activity. The most important cluster is inside a month, week, day, hour, etc.
Indicator operation features A volume level receives Demand status if the nearest volume level located to the left and above has been broken upwards. A volume level receives Supply status if the nearest vol

Att Market Profile TPO
50 USD Ioana Alina Stanescu
Att Market Profile TPO is an indicator that was build to have as many features possible from different trading platforms. It comes with a complexity of design possibility, where practically the limitation is given by user imagination and MT4 coding.
VOLUME PROFILE : It can be displayed simultaneously with MP Can be set to be displayed as session, left chart side, right chart side or all
On session the pointing direction can be change, left / right Display as radiant, outline, rectangles, o

Volume Pointer
29 USD Adrian Modlinski
Why do we use Volume? Volume is the most valuable data after the price. What can this Indicator do? It can confirm the current open interest according to the volume Volume above average means that the open interest among traders is high. Volume below average means that the open interest among traders is low. Parameters The Fast Volume Index . The histogram represents the average volume according to the shorter amount of periods. The Slow Volume Index . The line represents the average volume acco

Magneto Volume Trigger
79 USD Vladimir Blednov
The Magneto Volume Trigger indicator is designed for determining the volume confirmed by the candlestick pattern and predicting the trend tendency.
Indicator setup and use The calculation of values is affected by two parameters - Period and Gate . The lower the value of Gate , the higher the sensitivity of the indicator. Period allows making a sample of data for the specified number of candles. The lower the value of Period , the more the indicator is adapted to the current market conditions.

Clever Market Profile LVNs
59 USD Carlos Forero
Description The indicator uses market profile theory to show the most relevant trading zones, on a daily basis. The zones to be shown are LVN (low volume nodes) and POC (point of control). An LVN zone is one which represents price areas with the least time or volume throughout the day. Typically, these areas indicate a supply or demand initiative, and in the future, they can turn into important breakout or retracement zones. A POC zone is one which represents price areas with the most time or v

Anchored VWAP with Alert
60 USD Panagiotis Diamantopoulos
What is the Volume Weighted Average Price (VWAP)? The volume weighted average price (VWAP) is a trading benchmark used by traders that gives the average price an instrument has traded at throughout the day, based on both volume and price. It is important because it provides traders with insight into both the trend and value of the instrument.
What is the Difference between VWAP and AVWAP? While VWAP is having as starting point the beggining of the day,week,month etc. in the AVWAP you can pla

VSAMultiAnalize
69 USD Andrei Novichkov
The VSAMultiAnalize indicator serves to construct a horizontal volume profile and delta on the symbol graph ( VSA - Volume spread analysis ). The MT5 version is here . Construction can be performed in various ways. Input parameters: View Type. What is displayed on the chart. Volume by Range. The horizontal volume profile for the specified timeframe is the Target parameter. Previous and current. Two horizontal volume profiles for the current and past period (for example for the current and last d

PipTick Volume
37 USD Michal Jurnik
PipTick Volume indicator is a great tool for measuring tick volume activity. It quickly and easily helps traders to evaluate the current size of volume. The indicator for the classification of the volume size uses the moving average and its multiples. Accordingly, the area where the volume is located (relative to the moving average) is labeled as ultra low, low, average, high, very high or ultra high. This indicator can calculate moving average by four methods: SMA - Simple Moving Average SMMA -

Candle Size with MA
30 USD Roman Salivon
Индикатор отображает High-Low и Open-Close размеры свечей. Также по этим размерам можно построить простые скользящие средние. Линия скользящей средней строится по формуле: Линия MA = MA(Period) * Delta. Чтобы скрыть скользящую среднюю, достаточно установить ее период равным 0.
Чтобы собрать статистику по размерам свечей, используйте скрипт Candle Size Stats .
ПАРАМЕТРЫ Period_MA_HL: период усреднения скользящей средней, построенной по размерам High-Low свечей Delta_MA_HL: множитель для Hig

COSMOS4U Volume MT4
39 USD COSMOS4U - D. Vezeris & Co, L.P.
COSMOS4U Volume indicator facilitates your trade decisions. It gives confirmation of the running movement and market trends. It highlights current and past accumulation and distribution volumes, comparing them to moving average volume and the highest volume. In addition, it identifies and marks nuances as well as convergence and divergence patterns of bears and bulls in order to provide the market trend and price ranges. The supported features are as follows: Fast Volume Moving Average Slow Volu

GND Tail Candle
30 USD Nguyen Dang Giang
A tall upper shadow occurs when the price moves during the period, but goes back down, which is a bearish signal. A tall lower shadow forms when bears push the price down, but bulls pull it back up, which leaves a long line or shadow. This is considered a bullish signal.
Some technical analysts believe a tall or long shadow means the stock will turn or reverse. Some believe a short or lower shadow means a price rise is coming. In other words, a tall upper shadow means a downturn is coming, whil

New Bar Alarm Pro
35 USD Tomoyuki Nakazima
This indicator alerts you when/before new candle bar formed. In other words,this indicator alerts you every 1/5/30/60/240 minutes.
This indicator is especially useful for traders who trade when new bars formed.
*This indicator don't work propery in strategy tester.Use Free Version to check functionality in live trading.
Input Parameters Alert_Or_Sound =Sound ----- Choose alert or sound or both to notify you when new bar is coming.
Enable_1mBarAlert ----- Enable alert for 1 min bar
dif

Norepaint Harmonic Patterns with minimal Lag
50 USD Sergey Efimenko
This non-repainting indicator displays harmonic patterns with minimal lag. The indicator applies enhanced wave calculation allowing you to select parameters fitting your trading style. When a new figure is formed, the most probable price movement direction is displayed as a non-repainting arrow at a candle (bar) opening. The indicator recognizes the following patterns and their varieties: ABCD, Gartley (Butterfly, Crab, Bat), 3Drives, 5-0, Batman, SHS, One2One, Camel, Triangles, WXY, Fibo and Vi

Simply The Best Pro
78 USD Szymon Palczynski
This indicator displays the histogram and arrows on chart. When Simple The Best Pro are placed on a chart, they identify the trend. The color of may be blue or red. The blue color stands for upside moves and the red color stands for downside trends. The indicator offers to set Stop Loss (SL) and Take Profit (TP) setting. The default value is ATR. Indicator has automatic optimization. The STB is a unique indicator that shows the tendency (button Bars) of a particular signals. The STB tells us

Market Profile Track Volume Levels
30 USD Pietro Viviani
IMPORTANT PIECE OF INFORMATION: the demo is not working properly because of problems related to MQL. The indicator is fully working. If you want to try it or buy it please get in touch by email first tracktheworld2@gmail.com or via MQL message service. Once you have bought I will send you also a free guide and free resources on how to trade with Market Profile. This indicator is working like in the pictures, 100%. With me you have prime customer service. You are never left alone. I will send

Demand And Supply Diagram MT4
35 USD Evgeny Shevtsov
The balance of supply and demand is a simple and effective market analysis method. The supply and demand diagram can show you in advance, even before the trend reversal, where the supply ends and the demand is already emerging, where the demand ends and the supply is emerging, while substantially increasing the probability of making a deal in the right direction and with a high profit factor.
Indicator Signals The indicator uses the price/volume values to generate signals: ED – excess demand.

PZ Penta O MT4
FREE
Arturo Lopez Perez
The Penta-O is a 6-point retracement harmonacci pattern which usually precedes big market movements. Penta-O patterns can expand and repaint quite a bit. To make things easier this indicator implements a twist: it waits for a donchian breakout in the right direction before signaling the trade. The end result is an otherwise repainting indicator with a very reliable trading signal. The donchian breakout period is entered as an input. [ Installation Guide | Update Guide | Troubleshooting | FAQ | A

Tick Chart
30 USD Maxim Romanov
As we know, МТ4 and МТ5 do not store tick history, which may be necessary to develop trading strategies and market analysis. I have developed a method allowing you to receive tick history very easily. The indicator gathers tick history in real time and writes it to XXXXXX2.hst file, where XXXXXX is a symbol name. This file can be used to create an offline chart or something else. If you use a trading robot, then launch the indicator and control your broker by examining the spread and quotes. All

TS krachobor
120 USD Magomed Zakaryaev
Всем привет! Выставляю свою торговую стратегию для форекс (далее - ТС). После покупки или аренды ТС пишете мне, я вас добавляют в закрытый чат телеграм, где дам все индикаторы и поддержку по торговле, и мы вместе будем торговать. Статистику по торговле в ТС я добавлю чуть позже, так как открыл новый счет по ТС, что бы было наглядно как проходит торговля. Кроме этого я дам счет и пароль инвестора, можете сами смотреть в живую торговлю и решить для себя подходит ли она для вас. Два режима, 1) Сре

Zig Zag 123
30 USD Stephen Reynolds
Zig Zag 123 tells us when a reversal or continuation is more likely by looking at the shift in supply and demand. When this happens a signature pattern appears known as 123 (also known ABC) will often break out in direction of higher low or lower high.
Stop loss and take profit levels have been added. There is a panel that shows the overall performance of your trades for if you was to use these stop loss and take profit levels.
We get alerted if a pattern 123 appears and also if the price r

Trajecta StarSignal MT4
30 USD Rogerio Figurelli
What about a new kind of Signal Indicator with self adjustment and Trend Force Analysis? This is an innovative and powerful trading system based on Signal Indicators. The indicator is self adjusted and non lagging for all currency pairs and time frames, looking for the highest possible performance. Trajecta TFA - Trend Force Analysis: this brand new technology of Trajecta Labs enables different signals forces represented in the same graph, so you can check if the major signal is really strong e

Trajecta ViewSignal MT4
30 USD Rogerio Figurelli
What about a new kind of Signal Indicator with self adjustment and Trend Force Analysis? This is an innovative and powerful trading system based on Signal Indicators. The indicator is self adjusted and non lagging for all currency pairs and time frames, looking for the highest possible performance. Trajecta TFA - Trend Force Analysis: this brand new technology of Trajecta Labs enables different signals forces represented in the same graph, so you can check if the major signal is really strong en

Trajecta AutoSignal MT4
30 USD Rogerio Figurelli
What about a new kind of a signal indicator with self-adjustment and trend force analysis? This is an innovative and powerful trading system based on signal indicators. The indicator is self-adjusted and non-lagging for all currency pairs and timeframes, looking for the highest possible performance. Trajecta TFA - Trend Force Analysis: this brand new technology of Trajecta Labs enables different signals forces represented in the same graph, so you can check if the major signal is really strong

EZ Binary USJP Pair
FREE
Tuan Anh Dao
The indicator allows you to trade binary options. The recommended time frame is М1 and the expiration time is 1,2,3 minutes. The indicator suitable for auto and manual trading. A possible signal is specified as a arrows above/under a candle. You should wait until the candle closes! Arrows are not re-painted Trade sessions: TOKYO section (Half-end) Currency pairs: USD/JPY Working time frame: M1 Expiration time: 1,2,3 minutes. The indicator also shows good results when using the martingale strateg
Buyers of this product also purchase

Entry Points Pro
125 USD Yury Orlov
This is a trend indicator for MT4 providing accurate signals to enter a trade without redrawing or delays.
It can be applied to any financial assets: forex, cryptocurrencies, metals, stocks, indices . The best results are on the timeframe M15+
Our Telegram group | MT5 version of the indicator
IMPORTANT! Contact me after your purchase to get the detailed guide and bonus. Video (6:22) - one signal that made a profit equal to triple the price of the indicator. Video (4:4

Advanced Supply Demand
148 USD Bernhard Schweigert
CURRENTLY 33% OFF !! Best Solution for any Newbie or Expert Trader! This indicator is a unique, high quality and affordable trading tool because we have incorporated a number of proprietary features and a new formula. With this update, you will be able to show double timeframe zones . You will not only be able to show a higher TF but to show both, the chart TF, PLUS the higher TF: SHOWING NESTED ZONES . All Supply Demand traders will love it. :) Important Information Revealed
Maximize th

Advanced Currency Strength28 Indicator
148 USD Bernhard Schweigert
CURRENTLY 26% OFF Best Solution for any Newbie or Expert Trader! This Indicator is a unique, high quality and affordable trading tool because we have incorporated a number of proprietary features and a new formula. With only ONE chart you can read Currency Strength for 28 Forex pairs! Imagine how your trading will improve because you are able to pinpoint the exact trigger point of a new trend or scalping opportunity? User manual: click here That's the first one, the original! Don't buy a worthle

Best Currency Strength Indicator
149 USD Tumelo Rakotsoane
Advanced Currency Strength Indicator
The Advanced Divergence Currency Strength Indicator. Not only it breaks down all 28 forex currency pairs and calculates the strength of individual currencies across all timeframes , but, You'll be analyzing the WHOLE forex market in 1 window (In just 1 minute) . This indicator is very powerful because it reveals the true movements of the market. It is highly recommended to analyze charts knowing the performance of individual currencies or the countries ec

PipFinite Breakout EDGE
98 USD Karlo Wilson Vendiola
The Missing Edge You Need To Catch Breakouts Like A Pro. Follow a step-by-step system that detects the most powerful breakouts!
Discover market patterns that generate massive rewards based on a proven and tested strategy.
Unlock Your Serious Edge
Get it here www.mql5.com/en/blogs/post/723208
Have access to the game changing indicator that will take your trading to the next level!
How To Trade
Execute your trades in 3 Easy Steps!
Step 1: Trade Setup Enter a signal if Success Rate is

PipFinite Trend PRO
98 USD Karlo Wilson Vendiola
Breakthrough Solution For Trend Trading And Filtering With All Important Features Built Inside One Tool! Trend Pro's smart algorithm detects the trend, filters out market noise and gives entry signals with exit levels. The new features with enhanced rules for statistical calculation improved the overall performance of this indicator.
Important Information Revealed Maximize the potential of Trend Pro, please visit www.mql5.com/en/blogs/post/713938 Test the demo version and explore its feature

FX Power
75 USD Daniel Stein
️️️️️ You want to become a constantly profitable 5-star forex trader? ️️️️️ 1. Read the basic description of our simple trading system & and it's major strategy update in 2020 2. Send a screenshot of your purchase to get your personal invitation to our exclusive trading chat
FX Power is the first currency strength meter with a complete history across all time frames.
It analyzes the momentum and strength of all major currencies to determine high probability trades. Key Fe

FX Volume
75 USD Daniel Stein
You want to become a constantly profitable 5-star forex trader? 1. Read the basic description of our simple trading system & and it's major strategy update in 2020 2. Send a screenshot of your purchase to get your personal invitation to our exclusive trading chat
Following the smart money is finally possible! FX Volume is the FIRST and ONLY volume indicator that provides a REAL insight into the market sentiment from a broker's point of view. It provides awesome insights into how ins

Infinity TrendLine PRO
99 USD Evgenii Aksenov
PROMO: Buy Trend Line PRO today and contact me to get for free:
1) User's Manual about the indicator and built in pop-up Scanner 2) Settings files for Bitcoin, GOLD, EURUSD, GBPUSD 3) HTF Histogram (basement indicator) which shows Higher TimeFrame trend in the bottom of chart TrendLine PRO indicator is based on the analysis of the strength of bulls and bears. TrendLine PRO never repaint and does not change the levels!!! It shows the highlighted trend line (blue is bulls and red is bea

Advanced Currency IMPULSE with ALERT
78 USD Bernhard Schweigert
CURRENTLY 39% OFF !! Best Solution for any Newbie or Expert Trader! This indicator is a unique, high quality and affordable trading tool because we have incorporated a number of proprietary features and a secret formula. With only ONE chart it gives Alerts for all 28 currency pairs . Imagine how your trading will improve because you are able to pinpoint the exact trigger point of a new trend or scalping opportunity! Built on new underlying algorithms it makes it even easier to identify an

True Direction Oscillator
60 USD Muhammad Elbermawi
Or (TDO) which is an index that measures the price rate of change using the principle of " Pure Momentum ".
When a security price advances from 10 to 15 then the price rate of change is 150% but when it declines back from 15 to 10 then price rate of change is 33.3% only. That is why technical analysis indicators like "Price Rate of Change" (ROC) or "Momentum" gives higher readings for ascending price movements than that given to descending ones. TDO fixes this problem to help traders at

Precision Support Resistance MT4
60 USD Young Ho Seo
Support and Resistance are the important price levels to watch out during intraday market. These price levels are often tested before development of new trend or often stop the existing trend causing trend reversal at this point. Highly precise support and resistance are indispensable for experienced traders. Many typical trading strategies like breakout or trend reversal can be played well around these support and resistance levels. The Precision Support and Resistance are highly accurate suppo

Actual Levels
99 USD Ilya Fomin
The indicator shows significant support and resistance levels. When the price approaches these levels, it in some way responds either to the levels themselves, or to the areas that are near these levels. These levels can be viewed as potential reversal zone. Accordingly, the levels can be used for performing trading operations or closing previously opened positions.
For example You can buy if the price rolls back from the support level upwards, or sell if the price rolls back from the resistan

Best And Worst Dashboard
100 USD Chantal Sala
Best and worst Dashboard was born from the idea to have a panel that includes all the symbols in a chart. It is very importance to understand which symbols are both positive and negative. In the past, we realized the single indicator Best and Worst ( https://www.mql5.com/en/market/product/11784 ), now thanks to the upgrading of the Metatrader the dashboard displays all the instruments simultaneously. A great revolution. This Dashboard is able to calculate performance at any time frame and clicki

Blahtech Supply Demand
124 USD Blahtech Limited
Supply Demand uses previous price action to identify potential imbalances between buyers and sellers. The key is to identify the better odds zones, not just the untouched ones. Blahtech Supply Demand indicator delivers functionality previously unavailable on any trading platform. This 4-in-1 indicator not only highlights the higher probability zones using a multi-criteria strength engine, but also combines it with multi-timeframe trend analysis, previously confirmed swings and engulfing detector

FX Trend
75 USD Daniel Stein
️️️️️ You want to become a constantly profitable 5-star forex trader? ️️️️️ 1. Read the basic description of our simple trading system & and it's major strategy update in 2020 2. Send a screenshot of your purchase to get your personal invitation to our exclusive trading chat
FX Trend displays the trend direction, duration, intensity and the resulting trend rating for all time frames in real time.
You'll see at a glance at which direction the trends are running, how long

TPA True Price Action MT4 Indicator
168 USD InvestSoft
TPA True Price Action indicator reveals the true price action of the market makers through 100% non-repainting signals (except early signals mode) strictly at the close of a candle!
TPA shows entries and re-entries, every time the bulls are definitely stronger than the bears and vice versa. Not to confuse with red/green candles. The shift of power gets confirmed at the earliest stage and is ONE exit strategy of several. The first part of the TPA manual "The Basics" is now available (free to g

Lighthouse
75 USD Daniel Stein
You want to become a constantly profitable 5-star forex trader? 1. Read the basic description of our simple trading system & and it's major strategy update in 2020 2. Send a screenshot of your purchase to get your personal invitation to our exclusive trading chat
Lighthouse is an amazing precise and reliable support and resistance indicator.
It displays the most important trading levels and draws them according to their relevance.
If a level is clearly broken, it changes its rol

FXtraderariel Indicator
100 USD Ariel Capja
This is the FXTraderariel-Indicator . It scans the market for opportunities and creates a buy or sell signal. Depending on the settings and trading style, it can be used for scalping or long-term trading . The indicator can be used on every time frame , but we advise to use it on H1, H4 and D1 . Especially if you are a novice trader. Pro Traders can also you use it for scalping in smaller timeframes (M1, M5 and M15). This indicator is not a complete trading system. It doesn't give you exit point

Advanced Dashboard for Currency Strength and Speed
199 USD Bernhard Schweigert
CURRENTLY 20% OFF !! Best Solution for any Newbie or Expert Trader! This dashboard software is working on 28 currency pairs. It is based on 2 of our main indicators (Advanced Currency Strength 28 and Advanced Currency Impulse). It gives a great overview of the entire Forex market. It shows Advanced Currency Strength values, currency speed of movement and signals for 28 Forex pairs in all (9) timeframes. Imagine how your trading will improve when you can watch the entire market using a sin

TickUnit Scalper Currency Strength28 PRO
148 USD Bernhard Schweigert
CURRENTLY 26% OFF !! This indicator is a super combination of both our main indicators ( Advanced Currency Strength 28 and Advanced Currency IMPULSE with ALERT ). It shows Currency Strength values for TICK-UNITS and alert signals for 28 Forex pairs. 11 different Tick-Units can be used. Those are 1, 2, 3, 4, 5, 6, 10, 12, 15, 20, and 30 Seconds. The Tick-Unit bar in the sub-window will be shown and shifted to the left when there is at least 1 tick within the second’s timer. With only ONE

Naked Forex Kangaroo Tail
147 USD Renaud Candel
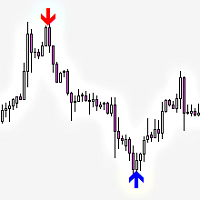
Kangaroo Tail Indicator is a pattern recognition indicator for Forex, Stocks, Indices, Commodities, Metals, Cryptos. The Kangaroo Tail is a simple and very effective pattern to trade. The strategy that comes with the Kangaroo Tail is purely based on price action. Inputs of the indicator are : Distance: distance in pixel relative to top or bottom of candle to display the arrow symbol MaxBars: number of bars back used to calculate the indicator TradeDirection (Long/Short/LongAndShort): filter sign

No Demand No Supply
80 USD Panagiotis Diamantopoulos
This indicator identifies No Demand –No Supply candles to your chart and plots volume bars colored according to the signal. It can be applied to all timeframes or to a specific one only. It can also be used as regular volume indicator but with exceptional future of WEIGHTED VOLUME. Furthermore is has an alert notification, sound and email when a signals occurs. The VSA (Volume Spread Analysis) definition for No Demand and No supply is as follows: No Demand (no buyers-potential short position):

Double Top Tracker
70 USD Dorian Baranes
This indicator analyzes in parallel price charts for multiple currency pairs on all timeframes and notifies you as soon as a double tops or double bottoms pattern has been identified.
Definition Double Top / Double Bottom pattern Double Top is a trend reversal pattern which are made up of two consecutive peaks that are more and less equal with a trough in-between. This pattern is a clear illustration of a battle between buyers and sellers. The buyers are attempting to push the security but are

Square of 9 for all
99.99 USD Francesco Rubeo
Welcome all to the famous Gann's "Square Of 9"!! This method was used by one of the best traders in the history, a person who made his way among the top traders. An "Holy Grail" for whoever wants to learn trading. The "Square of 9" was used by this genius to find the market's future supports and future resistances. Nowadays is possible to find them with just a click, thanks to softwares. At the time Gann was using just his set of square and goniometer!! Gann describes, partially, the tecnique on

Auto Trend Liner Displaying chart patterns
90 USD Velmurugan Esakki
The Indicator automatically draws trend lines ( Support & Resistance Lines) when attached to any opened chart with any time frame. Button controls with on(green)/off(red) are provided to display the Support & Resistance lines of short, medium, long, very long, v.v.long trends. For ex: to display only short, long term trend lines, make sure that the short and long buttons are in green color and the remaining 3 buttons in red color.

TPOChart2
60 USD Ahmad Yani
Features Supports the creation of Monthly, Weekly, Daily, 4 Hours, 1 Hours and 30 Minutes Market Profile. Daily Profile can have custom start time. Merge and Split of Market Profile Market Profile References Point can be exported to CSV format for any further analysis.
Indicator Parameters Indicator Update Interval - Choose indicator calculation period from 250 milliseconds to 2.5 seconds Indicator Setting ID - An ID for this particular indicator setting. Profile Number - The Number of Market

PipTick VSA MT4
97 USD Michal Jurnik
PipTick VSA is based on the original Volume Spread Analysis method. It was designed for quick and easy recognition of VSA patterns. Even though this indicator looks very simple, it is the most sophisticated tool that we have ever made. PipTick VSA indicator is a really powerful analytical tool that generates very reliable trading signals. Because it is very user friendly and understandable, it is suitable for every type of trader, regardless of their experience.
What Is VSA? VSA (Volume Spread

Semafor 3LZZ Scanner Dashboard
60 USD Abir Pathak
3 Level ZZ Semafor Scanner:
This is a Dashboard indicator which uses 3LZZ Indicator in the background to find semafors. It will give priority to the semafors3 because they specify a strong signal. You can go through this video tutorial to see how it works: https://youtu.be/Z4v4h8U6RiM Get all extra Indicators/Template from here: https://abiroid.com/extras/semafor-3lzz-scanner-dashboard
To use this template just specify "3LZZ" in Dashboard Property: "Use Template For New Window" (without the

Excessive Momentum Indicator MT4
200 USD Young Ho Seo
Introduction Excessive Momentum Indicator is the first indicator to measure the excessive momentum directly from raw price series. Hence, this is an extended price action and pattern trading. Excessive Momentum Indicator was originally developed by Young Ho Seo. This indicator demonstrates the concept of Equilibrium Fractal Wave and Practical Application at the same time. Excessive Momentum detects the market anomaly. Excessive momentum will give us a lot of clue about potential reversal and bre
More from author

Lisek Levels EA
FREE
Darius Hans Lischka
Simple but powerfull Trend and Hedge EA for Lisek Levels and Channels Indicator . 1. Download Lisek Levels and Channels Indicator . 2. Backtest and optimize in Strategy Tester. 3. For Agressive Tick Mode set your Chart to M1 Time Frame. 4. To speed up Strategy Tester, set "Show Info" to false ! 5. After backtesting, it’s important to analyse the test results (best profit and smallest drawdown). 6. Test your EA settings on Demo Account. Happy Trading !!!

Lisek Levels and Channels Indicator
FREE
Darius Hans Lischka
Are you looking for Price Levels and Price Channels and Price VWAP and Volume On Balance Indicators ? Now you have all in one !!! With Alarm and Push Notification. Info on your chart is showing you: where current price is and all levels, channels and vwap, how big is current On Balance Volume, is it going Bearish or Bullish, and who has the power, Buyers or Sellers. Up and down arrows showing you growing Seller or Buyer Volume. Lines showing you all Levels and Channels. Search f

Lisek Waves
150 USD Darius Hans Lischka
Search for an entry with low risk for trading by Lisek Waves Indicator. Using Lisek Waves Indicator can improve your trading performance. In it’s simplest form, this trading tool make it easy to s earch for an entry with low risk and to manage your trade and risk. Lisek Wave analysis is based on the notion that markets follow specific patterns called waves which are the result of a natural rhythm of crowd psychology that exists in all markets. You can avoid the loss from taking trades that are

Lisek Multi MA
45 USD Darius Hans Lischka
Search for an entry with low risk for trading by Lisek Moving Average Indicator. There are many ways to trade with Lisek Moving Average Indicator: Trend continuation (Trend trading). Trade pullbacks (Range trading). Trade breakouts. Trade reversals. Take profits or set stop-loss based on your MA.
Moving Averages are a frequently used technical indicator in forex trading, especially over 10, 50, 100, and 200 periods. Moving Averages are lagging indicators, which means they don't predict where
Filter:
No reviews