YouTubeにあるマーケットチュートリアルビデオをご覧ください
ロボットや指標を購入する
仮想ホスティングで
EAを実行
EAを実行
ロボットや指標を購入前にテストする
マーケットで収入を得る
販売のためにプロダクトをプレゼンテーションする方法
MetaTrader 4のためのテクニカル指標 - 14
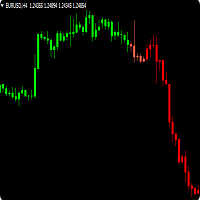
Trendfinder SMA are Colored candlesticks showing the trend based on two Simple Moving Averages and the slope of the slow moving average. This indicator will give you the color change on the next bar on the confirmation candle and will never repaint Trendfinder SMA is optimize to trade on any market and to be used trending and None trending markets. PLEASE TAKE NOTICE: For best results use this indicator as an extra tools after you have completed your regular analysis and use it for alerts base
FREE

TDI Multi Timeframe Scanner:
This Dashboard indicator uses the TDI (Trader's Dynamic Index) Indicator to find best trades. Read detailed How to Use Guide: https://www.mql5.com/en/blogs/post/758252
Extra indicators also available in above post.
Checks for: - SharkFin Pattern Free indicator for SharkFin: https://www.mql5.com/en/market/product/42405/ - TDI Trend: Strong/Weak Trend Up/Down - TDI Signal: Strong/Medium/Weak Signal for Buy/Sell - Consolidation - Overbought/Oversold - Volatility Ban

This is based on Demark's TD Sequential and TD Combo set of indicators. It mostly has the TD Sequential features. It contains the Arrows Indicator showing Buy/Sell signals and the scanner dashboard. Both are for MT4 (Metatrader 4) Platform.
Read in detail in this blog post. And get extra indicators here: https://www.mql5.com/en/blogs/post/749596 and commentary about signals and how to wait for right time: https://www.mql5.com/en/blogs/post/759157
Feature List: - Set TD Setup (9), Countdown (13

BUY INDICATOR AND GET A PIVOT POINT EA FOR FREE AS A BONUS + SOME OTHER GIFTS! ITALO PIVOTS INDICATOR is the best pivot point indicator for strong price reversals and continuations of price movements ever created , and why is that? You will have for the first time inside a pivot point indicator the pivots above the monthly, so, you will have the 3-month pivot lines, 6 months, 1 year, 2 years, 3 years, 5 years and 10 years, very strong support and resistances. Not only that but for the fi

The Supply and Demand with Swap zones MTF indicator is a powerful tool for technical analysis that has been modified and enhanced to provide traders with even more valuable information. This tool is based on the rule of supply and demand and allows traders to analyze a chart on three different timeframes at once, providing a more comprehensive view of the market. One of the key features of this indicator is the so-called swap zones, which are areas that have been broken through by the price but
FREE
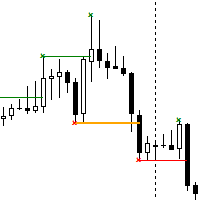
The Break of Structure (BoS) and Change of Character indicator is a powerful tool designed to identify significant turning points in price movements on financial charts within the MetaTrader 4 platform. By analyzing price action, this indicator highlights instances where the market shifts from a trend to a potential reversal or consolidation phase. Utilizing sophisticated algorithms, the indicator identifies breakouts where the structure of price movement undergoes notable changes. These breakou
FREE
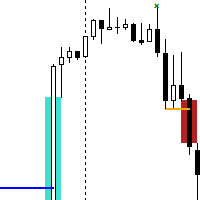
The Break of Structure (BoS) and Change of Character indicator with Fair Value Gap (FVG) filter is a specialized tool designed to enhance trading strategies by pinpointing high-probability trading opportunities on price charts. By integrating the BoS and Change of Character concepts with the FVG formation, this indicator provides traders with a robust filtering mechanism to identify optimal entry and exit points. The indicator identifies instances where the structure of price movements is disrup
FREE

After purchasing the Tpx Dash Supply Demand indicator, you must download this indicator which will link and feed market data to the Tpx Dash Supply Demand indicator and will provide all Supply Demand price signals, ATR Stop, VAH and VAL, trend values with the ADX, and POC prices and locations in the market. Just download it and Dash will locate the indicator to retrieve the information!
FREE

Tipu Trend is a non-lag, non-repaint, smart indicator, that shows the trend of selected time frames.
Features Customizable Buy/Sell alerts, push alerts, email alerts, or visual on-screen alerts. As easy to trade indicator that smooths the noise in the price action. Highlights ranging markets. Add Tipu Panel (found here ) and unlock the following additional features. An easy to use Panel that shows the trend + signal of the selected time frames. Customizable Panel. The panel can be moved to any
FREE

The ADX Indicator is known to be used to determine the trend direction. Not only that, but it also has deviation (+DI and -DI) that determine the direction of the trend as well. The role of the indicator is to spot the trend and its direction and generate signals accordingly.
Indicator Settings: - ADX period : default is 14 periods (it works best with the timeframe H1). - Signal Width : the size of signals arrows. - Signal Distance : the distance of the signal arrow from the candle. - Signal co
FREE

Multi Time Frame Indicator acts as a Scanner based on the Ichimoku Trading System. The outcome is displayed on a board. This helps you to make "at a glance" a mental picture of the System without having to open the chart. Up to 10 Currencies can be watched. Scanned elements And Legend "KUMO Futur" - Green : The Kumo Futur is Bullish. "KUMO Futur" - Red : The Kumo Futur is Bearish. "PRICE Cross KJ" - Green : The Price is Above the Kijun Sen. "PRICE Cross KJ" - Red : The Price is Below the Kijun
FREE
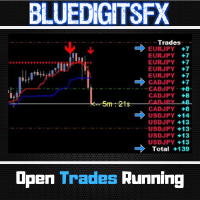
Free Utility Tool by BlueDigitsFx
Designed to improve workflow and trade management
Also available for MetaTrader 5
Optional access to updates & support via the BlueDigitsFx Telegram Assistant Bot BlueDigitsFx Open Trades is a powerful MT4 tool that displays your total pips from all open trades in real time.
Its intuitive color-coded interface quickly indicates winning and losing trades across all currency pairs.
This helps you monitor your trade performance effortlessly, enabling faster d
FREE
Double top and bottom indicator is a pattern scanning indicator which scans the tops and bottoms using zig zag pattern. When it find price bouncing back from the same point twice after a long trend then it generate arrow signals whenever the last resistance points is broken for double bottom and last support price broken for double top. Unlike other top bottom scanner it does not give only 1 signal. it alerts user when ever the last support /resistance is broker from double top/bottom pattern un
FREE
Magic Supply Demand Indicator works on all products and timeframes. It is a new formula, and the very new features are two zone strength functions adjustable by user input! This is a great advantage in trading. When you learn how to use the proprietary features such as the zone strength with min X-factor of price travel away, you will be able to tell whether the zone is strong or not.
The supply and demand zones are used as an alert trigger. You can use popup alert with sound on MetaTra
FREE

A unique author's strategy that simultaneously determines the trend reversal, entry points and estimated profit levels for each transaction. The indicator can determine entry points on any trading period, starting with the M5 chart to W1. At the same time, for the convenience of the user, an arrow is always drawn at a certain point and the recommended profit levels (Take Profit1, Take Profit2, Manual Take Profit) the Stop Loss level is also displayed.
A great advantage of the indicator Trend Sw

想像してみてください:あなたは巨額の利益の危機に瀕していますが、市場は突然変化し、あなたはチャンスを逃します。 あるいはさらに悪いことに、あなたは利益の代わりに損失を得る。 事前にささやく信頼できる味方がいたらどうなりますか:「準備をしてください–波が来ています!"? 知る Harbinger ,メタトレーダーのための革命的な指標4,特別に混乱の疲れていると市場の変化を予測したいトレーダーのために設計されました! Harbinger は、隠れたトレンドボラティリティパターンを分析して、今後のプルバック、リバーサル、または累積を信じられないほどの精度で信号を送るスマートアルゴリズムです。 Harbinger mt5 version
インジケータHarbingerを操作する方法。
Harbinger からの信号がチャートに表示されると、それは信号の前にあった価格の動きが変化することを意味します。 そしてすぐに、蓄積段階またはプルバックまたはプルバックを伴う蓄積、またはおそらくトレンドの逆転があるかもしれません。 多くの場合、両方のことが一度に起こります。 主なことは、信号が表示された
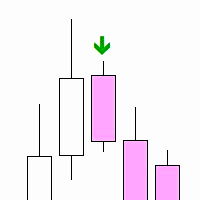
"Inside Bar PA" is a technical indicator designed to determine the inner bars on the chart. An internal bar is a bar or candle, the maximum and minimum of which are completely contained in the previous bar. This may signal a potential reversal or continuation of the trend, depending on the context.
Features: Automatic detection of internal bars. Visual marking of internal bars with arrows on the chart. The ability to adjust the distance of the mark from the bar. How to use: Attach the indicato
FREE

製品名 Smart Williams' %R (MT4) – SmartView シリーズ 短い説明 MetaTrader プラットフォームで独特なユーザー体験を提供する Williams' %R インジケーター。以前は利用できなかった高度な機能を提供し、ダブルクリックで設定を開く、削除せずにインジケーターを非表示/表示する、インジケーターウィンドウをチャート全体のサイズで表示するなどの機能を備えています。SmartView Indicators シリーズの残りの部分とシームレスに連携するように設計されています。 概要 SmartView シリーズは、革新的な機能を通じて MetaTrader プラットフォーム上のインジケーターに独特で特徴的なユーザー体験を提供し、インジケーター管理をより速く、より簡単にします。各インジケーターには、チャート上のスマートコントロールパネルが装備されており、基本情報を表示し、すべての重要な機能への迅速なアクセスを提供します。 以前は利用できなかった独自の機能 SmartView シリーズは、インジケーターでの作業をより簡単で迅速にする高度な機能を提供しま
FREE
LT Automated Support Resistance Screener is a level indicator or a support resistance indicator that can be used to determine the level of support and resistance values. This indicator is free and easy to used in the Metatrader 4 platform which is built using the MQL4 programming language. Support resistance indicator is an important indicator that is often to used, but it is not available on the MT4 platform. This indicator can be used for all markets like forex, indices, gold etc and all time
FREE
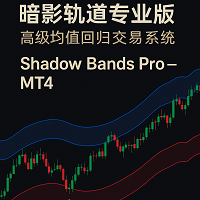
Shadow Bands Pro – MT4 说明(中英文) English Description (MT4) Shadow Bands Pro – Advanced Reversion System for MT4 Shadow Bands Pro is a non-repainting (on candle close) trend-reversal and mean-reversion indicator designed for traders who need clear, rule-based entries and exits.
By combining a dynamic volatility band, entity-break logic, and a built-in statistics panel, it helps you quickly see where price is stretched and where high-probability reversals may occur. Key Features Non-repainting on
FREE

The Pulse は、蓄積期間をリアルタイムで示す指標である。 簡単に言えば、蓄積とは、「スマートマネー」が市場で強力な動きを起こす前に静かに資産を集めることです。 チャート上では、価格が1つの範囲で「立ち往生」しているように見えます。 これは蓄積段階です-誰かが大きな動きの準備をしています。 そして、市場が"凍結"しているように見えるが、同時に緊張が感じられるときに、これらの瞬間に気づくことを学ぶなら、適切なタイミングで適切な場
蓄積期間を決定することは、適切な瞬間を待つことができることを意味します。 インジケータ The Pulse は蓄積期間を示し、価格は蓄積において望むように動くことができるが、ほとんどの場合、動きは横方向である。 The Pulse Blog. The blog: Why every trader should have The Pulse indicator as an additional tool for trading. Version mt5
累積期間はさまざまな方法で使用できます:
蓄積期間中は、市場の外に滞在し、蓄積されたエネルギーを解
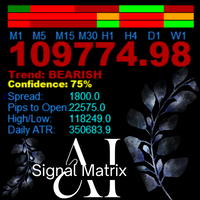
AanIsnaini Signal Matrix Multi-Timeframe Confidence Signal Dashboard AanIsnaini Signal Matrix is a powerful all-in-one indicator that analyzes market direction and confidence levels across multiple timeframes — allowing traders to see the overall bias of the market at a single glance. It combines signals from Price Action , Support–Resistance , and several proven technical tools (MACD, ADX, RSI, MA slope, ATR, and Volume Ratio), then calculates a confidence score showing how strongly th
FREE

ゴリラチャンネルVZは、長期観測に基づいて変更されたチャンネルインジケータです。
シグナル取引指標は、トレンドチャネルを表示する指標としても、追加のフィルタリングの対象となる入力信号源のいずれかとしても使用できます。 適切なアプローチでは、成功した取引の少なくとも80%。
ゴリラチャンネルVZの主な特長: 分析関数
これは、任意の通貨ペアと時間枠で使用することができます; インジケーターは再描画されません; それは他の指標に大きな追加です; グラフィカルな機能
チャート上の最小位置数を占めています; 柔軟性のあるチンキ; 簡単に学ぶことができます; 主な特長
アラートをオン/オフする機能; メッセージやモバイル通知の形で電子メールアラート、; ゴリラチャンネルVZを起動します。: インジケーターを起動し、最適なチンキを調整します。
ゴリラチャンネルVZ設定:
表示
チェックバー-チャンネルインジケータサイズ(最適値:150-200); 柔軟性-信号チューニング(最適値:5-20); 偏差-チャネル幅(最適値:1.618-3); 中央の線-中央の点線を表示する
FREE

[NEW RELEASE] Horse All in Signal – WinWiFi Robot Series ต้อนรับปีใหม่ 2026 ด้วยความมั่งคั่งและพลังที่คึกคักเหมือนม้าศึก! สัมผัสประสบการณ์การเทรดเหนือระดับกับอินดิเคเตอร์ตัวล่าสุดจาก WinWiFi Robot Series ในชื่อ "Horse All in Signal" เครื่องมือที่จะเปลี่ยนกราฟของคุณให้กลายเป็นสนามทำกำไร ด้วยระบบ AI อัจฉริยะที่สแกน Price Action ในทุกช่วงเวลา คุณสมบัติเด่น (Key Features): AI Price Action Engine: วิเคราะห์พฤติกรรมราคาแบบ Real-time แม่นยำทั้งในช่วงตลาดมีเทรนด์ (Trend) และช่วงพักตัว (Sideway)
FREE
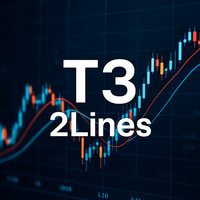
T3 2Lines – ダブルラインで捉えるトレンドの精度 「T3 2Lines」は、T3(Triple Exponential Moving Average)をベースにした2本の移動平均ラインを表示するMT4インジケーターです。短期および長期のT3ラインを同時に描画することで、トレンドの転換点や持続性をより精緻に判断することが可能になります。 このインジケーターでできること 短期と長期、2種類のT3移動平均線をチャートに同時表示 各ラインの期間と平滑係数(smoothing factor)を個別に設定可能 トレンドの初動や継続判断、押し目・戻りの識別に活用 視認性の高いライン表示で裁量トレードの補助に最適 T3とは? T3(Triple Exponential Moving Average)は、一般的な移動平均(SMAやEMA)よりも滑らかなカーブを描くのが特徴です。従来の移動平均に比べてノイズが少なく、トレンドの本質をより明確に視覚化することができます。「T3 2Lines」では、このT3を短期・長期で重ねることで、より多角的な相場分析が可能になります。 主な用途と活用シナリオ ク
FREE

Necessary for traders: tools and indicators Waves automatically calculate indicators, channel trend trading Perfect trend-wave automatic calculation channel calculation , MT4 Perfect trend-wave automatic calculation channel calculation , MT5 Local Trading copying Easy And Fast Copy , MT4 Easy And Fast Copy , MT5 Local Trading copying For DEMO Easy And Fast Copy , MT4 DEMO Easy And Fast Copy , MT5 DEMO 高度なボリンジャーバンド:
1.ボリンジャーレールは方向によって色が変わります」
2.ボリンジャーアウターレールの伸縮はアウターレールの色の変化でマークされます。」 3.ボリンジャーミ
FREE

このインディケータは、選択した期間における強気と弱気の不均衡を測定し、2 点間の直線を示す。
強気派が弱気派より出来高が多ければ、線は緑色に変わる。 ベアの方が出来高が多い場合、線は赤になる。 線は、出来高の差のパーセンテージも示します。
このインジケーターは、同じデータを別ウィンドウで表示します。また、分割された出来高を見ることもできます。
このインジケーターには2つのモードがあります。
そのために、左上にボタンがあります、
- ボタンを押さなければ、市場の任意のポイントと現在の価格との間の不均衡を測定します。 - ボタンを押すと、市場の任意の2点間のバランスを測定できます。 このインディケータは、選択した期間における強気と弱気の不均衡を測定し、2 点間の直線を示す。
強気派が弱気派より出来高が多ければ、線は緑色に変わる。 ベアの方が出来高が多い場合、線は赤になる。 線は、出来高の差のパーセンテージも示します。
このインジケーターは、同じデータを別ウィンドウで表示します。また、分割された出来高を見ることもできます。
このインジケーターには2つのモードがあります

The Gann Box (or Gann Square) is a market analysis method based on the "Mathematical formula for market predictions" article by W.D. Gann. This indicator can plot three models of Squares: 90, 52(104), 144. There are six variants of grids and two variants of arcs. You can plot multiple squares on one chart simultaneously.
Parameters Square — selection of a Gann square model: 90 — square of 90 (or square of nine); 52 (104) — square of 52 (or 104); 144 — universal square of 144; 144 (full) — "fu

--- FREE VERSION - WORKS ONY ON EURUSD
------------------------------------------------------------------- This is a unique breakout strategy that is used for determination of the next short term trend/move. The full system is available on MQL5 under the name "Forecast System". Here is the link --> https://www.mql5.com/en/market/product/104166?source=Site Backtest is not possible, because calculations are done based on the data of all timeframes/periods. Therefore I propose you use the technolo
FREE

Alan Hull's moving average, more sensitive to the current price activity than the normal MA. Reacts to the trend changes faster, displays the price movement more clearly. Color version of the indicator. Improvement of the original version of the indicator by Sergey <wizardserg@mail.ru>. Suitable for all timeframes.
Parameters Period - smoothing period, recommended values are from 9 to 64. The greater the period, the smoother the indicator. Method - smoothing method, suitable values are 0, 1, 2
FREE

as the name suggest Trend Maker Master is a trend scalping indicator that give long and short trading opportunity based on price action and ma style trend filter, the indicator Trend Period and Trend Extra Filter will change arrows signals quality and frequency, this leave a space for trader to come out with good combos for each pair. How to trade : Buy : when white buy arrow prints, set sl below recent swing low, and set tp to 1-1 Risk to reward ratio. Sell : when white Sell arrow prints, set
FREE

The Turtle Trading Indicator implements the original Dennis Richards and Bill Eckhart trading system, commonly known as The Turtle Trader. This trend following system relies on breakouts of historical highs and lows to take and close trades: it is the complete opposite to the "buy low and sell high" approach. The main rule is "Trade an N-day breakout and take profits when an M-day high or low is breached (N must me above M)". [ Installation Guide | Update Guide | Troubleshooting | FAQ | All Prod
FREE

Pivot Classic, Woodie, Camarilla, Fibonacci and Demark
Floor/Classic Pivot points, or simply pivots, are useful for identifying potential support/resistance levels, trading ranges, trend reversals, and market sentiment by examining an asset's high, low, and closing values. The Floor/Classic Pivot Points can be calculated as follows. Pivot Point (P) = (High + Low + Close)/3 S1 = P * 2 - High S2 = P - (High - Low) S3 = Low – 2*(High - P) R1 = P * 2 - Low R2 = P + (High - Low) R3 = High + 2*(P - L
FREE

The indicator defines the buy and sell arrows with high performance and consistent results. Trend Reverting PRO indicator is suitable for trend trading or following the trend - Test for free!.. Professional and accurate trading system ;
Displays the current market situation; Automatic analysis of market opportunities ; Help traders earn more from their investments;
Never repaints, recalculates or backpaints signals; Test how it works download Now! This is FREE version of the indicator and wo
FREE

Powerful non-repainting tool for intraday or swing tading, part of the Power Lines Trading System, used in real trading on a daily basis with proven solid trading signals. The Power Lines indicator is pretty straightforward and easy to set up and can be used perfectly on every timeframe and with every currency pair or other financial instrument. For intraday trading the using of M5, M15 or M30 timeframes and for swing trading H1, H4 or D are recommended. Avoid M1 and be careful with M5 timeframe
FREE

磁気価格ファインダーインジケーターは、価格が回帰する傾向にある平均価格です。 XAUUSD H1向けに最適化されています。3本のラインがあり、中央のラインは焦点を当てるべき価格です。 過去のデータに基づくと、デフォルト設定での平均価格への回帰成功率は92%を超えました。その他のケースでは、デフォルトで設定されているストップロスが発動しました。 エントリーポイントとエントリー時間は、概ね一日の始まりであり、便宜上、新日最初のローソク足は、磁気ラインより下で開いたか上で開いたかに応じて矢印でマークされます。 このインジケーターは、日中の単一エントリーで回帰に重点を置く取引戦略や、グリッド戦略に適しています。 利用可能な設定: Candles:微調整のためのローソク足の数。12-24-48の値を使用するか、デフォルトのままにすることをお勧めします。 ATR設定:ご自身の戦略に合わせてストップロスを微調整するために必要です。 ShowLabels:ラインの右側にマーカーテキストを表示します。 LabelOffsetBars:テキストのオフセット。 ArrowOffset_Multiplier:
FREE
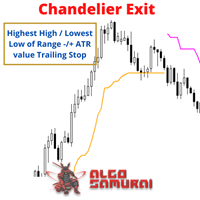
Developed by Chuck LeBeau, the Chandelier Exit indicator uses the highest high / lowest low -/+ a multiple of the ATR value to draw trailing stop lines (orange under buys, magenta over sells) that advance with the trend until the trend changes direction.The value of this trailing stop is that it rapidly moves upward in response to the market action. LeBeau chose the chandelier name because "just as a chandelier hangs down from the ceiling of a room, the chandelier exit hangs down from the high
FREE

製品名 Smart Ichimoku (MT4) – SmartView シリーズ 短い説明 MetaTrader プラットフォームで独特なユーザー体験を提供する Ichimoku インジケーター。以前は利用できなかった高度な機能を提供し、ダブルクリックで設定を開く、削除せずにインジケーターを非表示/表示する、インジケーターウィンドウをチャート全体のサイズで表示するなどの機能を備えています。SmartView Indicators シリーズの残りの部分とシームレスに連携するように設計されています。 概要 SmartView シリーズは、革新的な機能を通じて MetaTrader プラットフォーム上のインジケーターに独特で特徴的なユーザー体験を提供し、インジケーター管理をより速く、より簡単にします。各インジケーターには、チャート上のスマートコントロールパネルが装備されており、基本情報を表示し、すべての重要な機能への迅速なアクセスを提供します。 以前は利用できなかった独自の機能 SmartView シリーズは、インジケーターでの作業をより簡単で迅速にする高度な機能を提供します: ダブルクリ
FREE
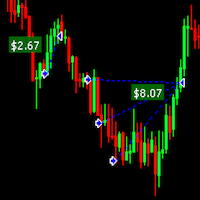
Draw Profit indicator can efficiently help those traders who want to see on the chart all closed positions output: profit or loss. If set DrawProfit on your chart managed by an Expert Advisor (EA) you will see clearly it’s performance by its profits & losses. My other products: https://www.mql5.com/en/users/hoangvudb/seller
Input parameters: Show Profit Labels : show profit of orders with a label (true/false). Profit Mode : available options: Show in currency. Show in pips. Show in currency a
FREE

Buy Sell Magic AI – Dynamic Trend Line & Bollinger Bands for MT4 Buy Sell Magic AI is a professional indicator for MetaTrader 4 that combines the power of Bollinger Bands with a dynamic central midline that acts as a real-time trend line . It delivers clear entry signals, visual trend confirmation, and automatic Stop Loss placement—plus a built-in candle timer for precise trade timing. My indicators for free. I only ask that leave your feedback to help me improve them or as a thank you. Have
FREE

First RSI level indicator analyzes and displays the level, at which the first crossing of the standard RSI maximum or minimum value took place for the subsequent definition of strong trends. The indicator allows you to track the beginning of a trend that does not follow the signals of the standard RSI trading strategy, for example, when the price rushes downwards after reaching an oversold level instead of reversing. In this case, we have to conclude that a strong trend is underway and the next
FREE

これは無料でご利用いただける製品です。お客様のニーズに合わせてご利用ください。
また、肯定的なフィードバックをいただき、大変ありがたく思っています。どうもありがとうございます。
高品質のトレーディングロボットとインジケーターをご覧になるにはここをクリックしてください!
MT4 用 Forex インジケーター スプレッド ディスプレイ、優れた補助取引ツール。
- スプレッド ディスプレイ インジケーターは、接続された Forex ペアの現在のスプレッドを表示します。 - スプレッド ディスプレイの値は、チャートのどのコーナーにも配置できます: 0 - 左上コーナー、1 - 右上、2 - 左下、3 - 右下 - 色とフォント サイズも設定できます。 これは、この MQL5 Web サイトでのみ提供されるオリジナル製品です。
FREE

Gina Dual TPO — Brief MQL4 indicator TPO + Volume profile overlaid on chart — fast, scalable, and beginner-friendly. Built for traders who read market structure by POC and Value Area. What it is An MQL4 indicator that overlays dual market profiles—Time-at-Price (TPO) and Volume-at-Price (VPO)—directly on your chart. It’s fast (pixel-based drawing), scalable, and beginner-friendly. Who it’s for Intraday and swing traders who read market structure via POC (Point of Control) and Value Area to spot
FREE
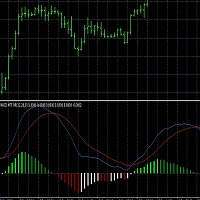
This script generates a MACD with 6 color-coded histogram bars based on the position (above or below zero) and direction (rising or falling) of the histogram. It provides multi-time frame support , allowing users to view the MACD from different time frames on a single chart. The indicator uses customizable settings for MACD periods, histogram width, and vertical scaling. This script could be useful for traders who want a visually enhanced MACD with clearer trend and momentum representation acro
FREE
スペシャルキャンドル
成功した一目均衡表戦略を持つ最高の外国為替指標の1つを使いたいですか?この一目均衡表戦略に基づく素晴らしいインジケーターを利用できます。
MT5バージョンはこちらです 。
第1戦略:
この戦略では、まれに発生する類似した強いクロスを特定することが含まれます。
この戦略に最適な時間枠は、30分(30M)および1時間(H1)です。
30分間隔の適切なシンボルには以下が含まれます:
• CAD/JPY
• CHF/JPY
• USD/JPY
• NZD/JPY
• AUD/JPY
• EUR/USD
• EUR/GBP
1時間のタイムフレームに適したシンボルには以下が含まれます:
• GBP/USD
• GBP/NZD
• GBP/AUD
• USD/CAD
• USD/CHF
• USD/JPY
• EUR/AUD
第2戦略:
この戦略では、トレンドと同じ方向に発生した強力なTenkunsenおよびKijunsenのクロスを特定することが含まれます。
この戦略に最適な時間枠は、1分(1M)から15分(15M)です。
この戦略はほとんどの通貨およびシンボルに適用でき

または(BD%)は、ポイントではなくパーセントでボラティリティを測定するボラティリティ指数です。 BD%の考え方は、0から100パーセントの間で移動するClassic Standard Deviation(CSD)に応じてインデックスを作成することです。
BD%を使用して、異なる期間または異なる時間枠での同じ証券のボラティリティを比較できます。さらに、BD%を使用して、ポイントではなくパーセントで、さまざまな市場のさまざまな証券間のボラティリティを比較できます。
「BD%」の使い方
BD%が90%未満で、このレベルを上向きに超えた場合、これは価格がさまざまな領域で変動する可能性があることを示しています。 BD%が90%を上回り、その後このレベルを下向きに超え、価格がすでに単純移動平均を上回っている場合、これは新しい上昇トレンドの始まりの兆候です。 BD%がマイナス面に深くなるにつれて、ボラティリティとトレンドの強さが増しています。 BD%が0%の場合、これはボラティリティが最大値にあることを意味します。 BD%が90%を上回り、その後このレベルを下向きに超え、価格がすでに単純
The "FCK Trend Arrow No Repaint" indicator is designed for analyzing market dynamics and determining potential trading signal moments. The main feature of this indicator is the absence of signal repainting, which contributes to more accurate and reliable forecasting of price movements in the market.
Mechanism of Operation: The "FCK Trend Arrow No Repaint" indicator uses several types of graphical elements to indicate trading signals: Up and Down Arrows: The indicator marks possible market entr
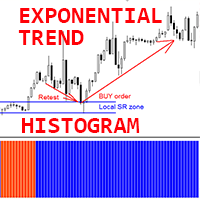
Crypto_Forex MT4用インジケーター「指数トレンドヒストグラム」、リペイント機能なし。
- 指数トレンドヒストグラムインジケーターは、トレンド検知に非常に効果的です。 - 最適な使用方法は、サポート/レジスタンスレベルとリテストテクニックを組み合わせることです(画像参照)。 - インジケーターが新しいトレンドを検知したら、ローカルSRレベルを探し、そのゾーンの再テストに備えて対応する指値注文を設定します。 - 新しいトレンドが強気の場合は、買い指値指値注文を設定します。新しいトレンドが弱気の場合は、売り指値指値注文を設定します。 - インジケーターの色は2色です。弱気な下降トレンドは赤、強気な上昇トレンドは青です(色は設定で変更できます)。 - モバイルとPCの両方でアラート機能があります。
// 優れたトレードロボットとインジケーターは、こちらから入手できます: https://www.mql5.com/en/users/def1380/seller これは、このMQL5ウェブサイトでのみ提供されるオリジナル製品です。
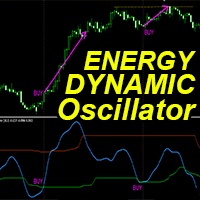
「ダイナミック・エナジー・オシレーター」は、MT4向けの高度なカスタムCrypto_Forexインジケーターです。効率的な取引ツールです!
- 新世代のオシレーターです。使い方は画像をご覧ください。 - ダイナミック・エナジー・オシレーターは、適応型の売られ過ぎ/買われ過ぎゾーンを備えています。 - トレンド相場で非常に有用なテクニカルモメンタムインジケーターです。 - オシレーターは、売られ過ぎ/買われ過ぎエリアから正確なエントリーポイントを見つけるための補助ツールです。 - 売られ過ぎ値:グリーンラインより下、買われ過ぎ値:オレンジラインより上。 - 標準的なオシレーターよりもはるかに正確です。対応時間足:M30、H1、H4、D1、W1。 - PCとモバイルのアラート機能付き。
// 優れたトレーディングロボットとインジケーターは、こちらから入手できます: https://www.mql5.com/en/users/def1380/seller これは、このMQL5ウェブサイトでのみ提供されるオリジナル製品です。
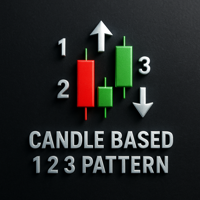
ローソク足ベースの 1 2 3 パターン ローソク足ベースの 1 2 3 パターン は、クラシックな 1-2-3 の価格構造に基づいて高確率の反転パターンを識別するインジケーターです。ローソク足とスイングポイントを活用し、 ブレイクアウトが確定した後にのみ シグナルを表示するため、ノイズを減らし早すぎるエントリーを回避できます。 主な特徴: 確定済みの強気・弱気 1-2-3 パターンをローソク足ベースで検出 パターンのポイント間にトレンドラインを描画し、ブレイクアウト時に矢印を表示 アラート(ターミナル、メール、プッシュ通知、サウンド)対応 見た目やシグナルバー、パターン期間など柔軟にカスタマイズ可能 すべての時間足と金融商品で、反転・押し目買い・ブレイクアウト戦略に最適です。

Immediately plots renko bars in an external/indicator window. One of the distinctive advantages Renko charts offer is the fact that they are not time dependent. Therefore, the new Renko blocks are only traced when the price moves higher or lower by the specified number of points.
For example, a 10 pip (100 points) Renko chart would plot the blocks when price moves 10 pips higher in an uptrend or 10 pips lower in a downtrend. Renko charts removes "noises" from the Market and i t helps to identi

Future Trend Channel は、トレンドの方向性を識別し、価格変動の可能性を予測するために設計されたダイナミックで視覚的に直感的なインジケーターです。もともとChartPrimeによってTradingView用に開発されたこのツールは、MetaTrader 4用に適応されており、トレーダーに同等の機能を提供します。スウィングトレーダー、デイトレーダー、長期投資家のいずれであっても、Future Trend Channelはトレンドの強さを可視化し、反転を予測し、エントリー/エグジットポイントを最適化するのに役立ちます。 主な特徴: マルチタイムフレーム対応 - 外国為替、株式、商品、暗号通貨を含む全ての時間軸と金融商品で動作 スマートトレンド検出 - SMA、ATR、HL2(高値-安値の平均)を組み合わせて強気・弱気のトレンドチャネルを動的にプロット 未来価格予測 - 現在のトレンド勾配に基づいて潜在的な将来価格レベルを投影し、取引計画を支援 明確な視覚的シグナル - 強気・弱気シグナルがトレンド確認を示し、色分けされたチャネルが市場状況に適応 カスタマイズ可能なパラメー

Introduction Harmonic Patterns are best used to predict potential turning point. Traditionally, Harmonic Pattern was identified manually connecting peaks and troughs points in the chart. Manual harmonic pattern detection is painfully tedious and not suitable for everyone. You are often exposed under subjective pattern identification with manual pattern detection. To avoid these limitations, Harmonic Pattern Plus was designed to automate your harmonic pattern detection process. The functionality

CS ATR FIBO CHANNELS MULTI TIMEFRAME
Additional tool to trade with Cycle Sniper Indicator.
Cycle Sniper : https://www.mql5.com/en/market/product/51950 Indicator Draws Channels based on: - Cycle Sniper Price and Moving Averages - ATR Deviations - Fibonacci Retracement and Extensions
Features: - Multi TimeFrame - Full alert and Notification options. - Simple Settings - Finds the trend change or extreme reversals.
Inputs: - Arrow Mode: ATR Levels or Median Line If Median Line is selected ind

The ACB Trade Filter indicator provides a solution for filtering out the low probability trading setups in a trading strategy. The indicator uses a sophisticated filtration algorithm based on the market sentiment and trend.
Applications Works great with our indicator " ACB Breakout Arrows ". Filter out low probability signals from any indicator. Avoid overtrading and minimize the losses. Trade in the direction of market sentiment and trend. Avoid the choppiness in the market.
How to use Only L
- Real price is 80$ - 60% Discount (It is 30$ now) - It is enabled for 1 purchase. Contact me for extra bonus tool, instruction or any questions! - Non-repaint, No lag - I just sell my products in Elif Kaya Profile, any other websites are stolen old versions, So no any new updates or support. - Lifetime update free
Introduction Smart Money Concepts (SMC) strategy was initially popularized the Inner Circle Trading (ICT) method which is claimed to be the evolved version of the SMC. Essenti
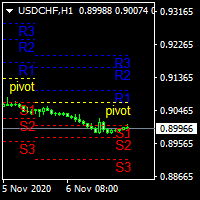
.................................if you need pivot point s levels............................... ............................this is a daily pivot point level creator........................... ...it is for daily pivots and show levels at times period H4 , H1 , M30 , M15 ,M 5... .................................also shows levels for 3 last days.............................. ................can use it with other indicators and see important levels...............
FREE

Smart Fibo Zones are powerful, auto-generated Fibonacci Retracements that are anchored to key market structure shifts . These zones serve as critical Supply and Demand levels, guiding you to identify potential price reactions and confirm market direction. Fibonacci calculations, widely used by professional traders, can be complex when it comes to identifying highs and lows. However, Smart Fibo Zones simplify this process by automatically highlighting order blocks and key zones, complete with St
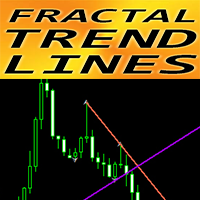
Crypto_Forex インジケーター「フラクタルトレンドライン」MT4用。
- このインジケーターは、ブレイクアウトを伴うグラフィカル分析を使用するトレーダーに最適です!!! - 「フラクタルトレンドライン」は、グラフィカルな上昇トレンド (紫色) と下降トレンド (赤色) のラインを表示します。 - 上昇トレンドと下降トレンドのラインは、2つの最も近い対応するフラクタルに基づいて構築されます。 - インジケーターには、トレンドラインの色と幅を決定するパラメーターがほとんどありません。 - インジケーターには、ブレイクアウトのモバイルおよびPCアラートが組み込まれています。
高品質のトレーディングロボットとインジケーターをご覧になるにはここをクリックしてください! これは、このMQL5 Webサイトでのみ提供されるオリジナル製品です。
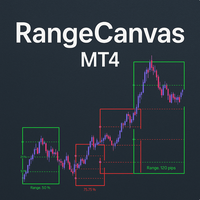
Daily Range Boxes : The indicator draws rectangular boxes around each day's high and low prices, creating a clear visual boundary for the daily trading range. Color-Coded Logic : Green boxes when the current price (or close) is above the daily open Red boxes when the current price is below the daily open Percentage Level Lines : Inside each box, it draws three horizontal lines at: 25% of the daily range 50% of the daily range (midpoint) 75% of the daily range Range Information : Each box displa
FREE
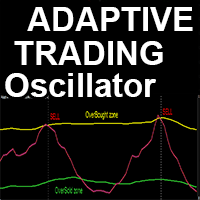
高度なカスタムCrypto_Forexインジケーター「アダプティブ・トレーディング・オシレーター」 - MT4用の効率的な補助取引ツール!
- このインジケーターは新世代のオシレーターです。使い方は画像をご覧ください。 - 「アダプティブ・トレーディング・オシレーター」には、調整可能な売られ過ぎ/買われ過ぎゾーンがあります。 - このオシレーターは、動的な売られ過ぎ/買われ過ぎエリアからの決済時に、正確なエントリーポイントを見つけるための補助ツールです。 - 売られ過ぎゾーン:グリーンラインより下。 - 買われ過ぎゾーン:イエローラインより上。 - このインジケーターは、プライスアクションパターンやトレンド戦略と組み合わせるのに最適です。 - 標準的なオシレーターよりもはるかに正確です。 - インジケーターは任意の時間枠で使用できます。 - PCとモバイルの両方にアラート機能を搭載しています。
高品質のトレーディングロボットとインジケーターをご覧になるにはここをクリックしてください! これは、このMQL5ウェブサイトでのみ提供されるオリジナル製品です。
40% off. Original price: $50
Moving Average Trend Scanner is a multi symbol multi timeframe triple MA crossover dashboard that helps traders to monitor, and identify potential market trends from one chart. This panel scans 3 moving averages in up to 28 configurable instruments and 9 timeframes for triple moving average alignment and moving average crossover with a deep scan feature to scan all market watch symbols (up to 1000 instruments!).
Download Demo here (Scans only M1 and M5) Settings

RSI DIVERENCE INDICATOR
RSI divergence is very powerful pattern which is often used to detect a strong trend reversal. it also indicates the weakening of strong signal. So some traders want to use it as the exit criteria. This indicator works in all timeframe and send notification, alert or email to the user. It also show the Higher Highs and Lower Low Pattern with its corresponding RSI divergency. This indicator can be used in Expert Advisors as it has accessible buffers List of Inputs ______
FREE

The SPV Volatility indicator is one of the most effective filters. Volatility filter. Shows three volatility options. The so-called limit, real, and the last most effective filter for the filter is the percentage filter. Percentage display of folatility shows the ratio of limit to real volatility. And thus, if we trade in the middle of the channel, then it is necessary to set a condition that the percentage is less than a certain indicator value. If we trade on the channel breakout - following t
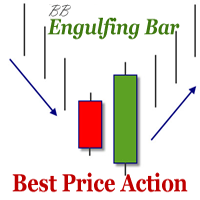
The indicator defines the Bullish and Bearish Engulfing Bar. The pattern has greater reliability when the open price of the engulfing candle is well above the close of the first candle, and when the close of the engulfing candle is well below the open of the first candle. For an engulfing bar to be valid it must fully engulf at least one previous bar or candle - includes all the body and the wick. The engulfing bar can engulf more than one bar as long as it completely engulfs the previous bar.
FREE
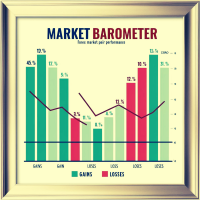
Market Barometer is a cheat code for trading, it acts as a "barometer" for market sentiment across various pairs, showcasing their changes. You can tell right away what to trade. You can trade trends or reversals. MT5 Version: https://www.mql5.com/en/market/product/127467 Market Barometer is a powerful tool designed to track and visualize the percentage changes across multiple currency pairs. By analyzing the price shifts of different forex pairs, it helps you understand how they are correlat
HTF Candles MT4 is a mt4 indicator which plots the outline of the higher time-frame candles on the lower candle, including any MT5 higher time-frame chosen. The indicator gives you the option to choose whether or not to view live current HTF candle, with no lag or repainting. Features MT5 Period Candles: This indicator plots any mt5 time-frame candle e.g m3, m5, m12, m15, m20... and so on, on the lower time-frame. Heiken Ashi Options: You have the option to view the HTF Heiken ashi instead of

よって上りと下りが表示され、弾倉を開いたり閉じたりすることができます。
パラメータリストの説明:
extern int Price=0;/指標初期計算平均価格
extern int Length=20;/指標計算平均周期は、MAの平均周期に相当する。
extern int Displace=0
extern int Filter=0//フィルターカラム数
extern int Color=1;/上り色
extern int ColorBarBack=0;/下り色
extern double Deviation=0.0;/逸脱
extern int BarsToDraw=2000;/柱の数を計算する
extern book AlertsOn=true;//オープンまたはクローズボックスのヒント
extern int RemindFrequency=60;/フレームの周波数は、デフォルトでは1分間に1回です。
FREE

This indicator is designed to detect high probability reversal patterns: Double Tops/Bottoms with fake breakouts . Please read also the blog post " How To Yield Big Winners Consistently! " which explains the concepts behind the ULTIMATE Double Top/Bottom indicator and how you can use a top-down approach to get 15 - 20R winning trades on a regular basis . The provided video shows the maximum performance of the indicator. With maximum performance, I mean that this could have been the profit if you

Gold Trend M1 - Optimized Scalping Tool for Gold (XAUUSD) Gold Trend M1 is a high-frequency trading indicator for the MetaTrader 4 platform, specifically optimized for the M1 timeframe on the Gold market. It combines a powerful SuperTrend trend filter with buy/sell signals derived from Heiken Ashi calculation logic, helping traders identify precise and disciplined entry points for optimal trading performance.
Key Features Optimized for M1 Scalping: Specifically developed for high-speed scalping
MetaTraderマーケットは、履歴データを使ったテストと最適化のための無料のデモ自動売買ロボットをダウンロードできる唯一のストアです。
アプリ概要と他のカスタマーからのレビューをご覧になり、ターミナルにダウンロードし、購入する前に自動売買ロボットをテストしてください。完全に無料でアプリをテストできるのはMetaTraderマーケットだけです。
取引の機会を逃しています。
- 無料取引アプリ
- 8千を超えるシグナルをコピー
- 金融ニュースで金融マーケットを探索
新規登録
ログイン