Articles on data analysis and statistics in MQL5
Articles on mathematical models and laws of probability are interesting for many traders. Mathematics is the basis of technical indicators, and statistics is required to analyze trading results and develop strategies.
Read about the fuzzy logic, digital filters, market profile, Kohonen maps, neural gas and many other tools that can be used for trading.
Add a new article

You are missing trading opportunities:
- Free trading apps
- Over 8,000 signals for copying
- Economic news for exploring financial markets
Registration
Log in
You agree to website policy and terms of use
If you do not have an account, please register

MetaTrader AppStore Results for Q3 2013
Another quarter of the year has passed and we have decided to sum up its results for MetaTrader AppStore - the largest store of trading robots and technical indicators for MetaTrader platforms. More than 500 developers have placed over 1 200 products in the Market by the end of the reported quarter.

Price series discretization, random component and noise
We usually analyze the market using candlesticks or bars that slice the price series into regular intervals. Doesn't such discretization method distort the real structure of market movements? Discretization of an audio signal at regular intervals is an acceptable solution because an audio signal is a function that changes over time. The signal itself is an amplitude which depends on time. This signal property is fundamental.
Price Action Analysis Toolkit Development (Part 47): Tracking Forex Sessions and Breakouts in MetaTrader 5
Global market sessions shape the rhythm of the trading day, and understanding their overlap is vital to timing entries and exits. In this article, we’ll build an interactive trading sessions EA that brings those global hours to life directly on your chart. The EA automatically plots color‑coded rectangles for the Asia, Tokyo, London, and New York sessions, updating in real time as each market opens or closes. It features on‑chart toggle buttons, a dynamic information panel, and a scrolling ticker headline that streams live status and breakout messages. Tested on different brokers, this EA combines precision with style—helping traders see volatility transitions, identify cross‑session breakouts, and stay visually connected to the global market’s pulse.
Other classes in DoEasy library (Part 70): Expanding functionality and auto updating the chart object collection
In this article, I will expand the functionality of chart objects and arrange navigation through charts, creation of screenshots, as well as saving and applying templates to charts. Also, I will implement auto update of the collection of chart objects, their windows and indicators within them.
Library for easy and quick development of MetaTrader programs (part VI): Netting account events
In the previous articles, we started creating a large cross-platform library simplifying the development of programs for MetaTrader 5 and MetaTrader 4 platforms. In the fifth part of the article series, we created trading event classes and the event collection, from which the events are sent to the base object of the Engine library and the control program chart. In this part, we will let the library to work on netting accounts.

MQL5 Wizard techniques you should know (Part 05): Markov Chains
Markov chains are a powerful mathematical tool that can be used to model and forecast time series data in various fields, including finance. In financial time series modelling and forecasting, Markov chains are often used to model the evolution of financial assets over time, such as stock prices or exchange rates. One of the main advantages of Markov chain models is their simplicity and ease of use.

Developing a Replay System — Market simulation (Part 01): First experiments (I)
How about creating a system that would allow us to study the market when it is closed or even to simulate market situations? Here we are going to start a new series of articles in which we will deal with this topic.
Timeseries in DoEasy library (part 45): Multi-period indicator buffers
In this article, I will start the improvement of the indicator buffer objects and collection class for working in multi-period and multi-symbol modes. I am going to consider the operation of buffer objects for receiving and displaying data from any timeframe on the current symbol chart.

Price Action Analysis Toolkit Development (Part 26): Pin Bar, Engulfing Patterns and RSI Divergence (Multi-Pattern) Tool
Aligned with our goal of developing practical price-action tools, this article explores the creation of an EA that detects pin bar and engulfing patterns, using RSI divergence as a confirmation trigger before generating any trading signals.

Creating a mean-reversion strategy based on machine learning
This article proposes another original approach to creating trading systems based on machine learning, using clustering and trade labeling for mean reversion strategies.

Building a Spectrum Analyzer
This article is intended to get its readers acquainted with a possible variant of using graphical objects of the MQL5 language. It analyses an indicator, which implements a panel of managing a simple spectrum analyzer using the graphical objects. The article is meant for readers acquianted with basics of MQL5.

Statistical Estimations
Estimation of statistical parameters of a sequence is very important, since most of mathematical models and methods are based on different assumptions. For example, normality of distribution law or dispersion value, or other parameters. Thus, when analyzing and forecasting of time series we need a simple and convenient tool that allows quickly and clearly estimating the main statistical parameters. The article shortly describes the simplest statistical parameters of a random sequence and several methods of its visual analysis. It offers the implementation of these methods in MQL5 and the methods of visualization of the result of calculations using the Gnuplot application.

Automating Trading Strategies with Parabolic SAR Trend Strategy in MQL5: Crafting an Effective Expert Advisor
In this article, we will automate the trading strategies with Parabolic SAR Strategy in MQL5: Crafting an Effective Expert Advisor. The EA will make trades based on trends identified by the Parabolic SAR indicator.

Price Action Analysis Toolkit Development (Part 39): Automating BOS and ChoCH Detection in MQL5
This article presents Fractal Reaction System, a compact MQL5 system that converts fractal pivots into actionable market-structure signals. Using closed-bar logic to avoid repainting, the EA detects Change-of-Character (ChoCH) warnings and confirms Breaks-of-Structure (BOS), draws persistent chart objects, and logs/alerts every confirmed event (desktop, mobile and sound). Read on for the algorithm design, implementation notes, testing results and the full EA code so you can compile, test and deploy the detector yourself.

Developing a trading robot in Python (Part 3): Implementing a model-based trading algorithm
We continue the series of articles on developing a trading robot in Python and MQL5. In this article, we will create a trading algorithm in Python.

MQL5 Wizard techniques you should know (Part 01): Regression Analysis
Todays trader is a philomath who is almost always (either consciously or not...) looking up new ideas, trying them out, choosing to modify them or discard them; an exploratory process that should cost a fair amount of diligence. This clearly places a premium on the trader's time and the need to avoid mistakes. These series of articles will proposition that the MQL5 wizard should be a mainstay for traders. Why? Because not only does the trader save time by assembling his new ideas with the MQL5 wizard, and greatly reduce mistakes from duplicate coding; he is ultimately set-up to channel his energy on the few critical areas of his trading philosophy.

Data Science and Machine Learning (Part 04): Predicting Current Stock Market Crash
In this article I am going to attempt to use our logistic model to predict the stock market crash based upon the fundamentals of the US economy, the NETFLIX and APPLE are the stocks we are going to focus on, Using the previous market crashes of 2019 and 2020 let's see how our model will perform in the current dooms and glooms.
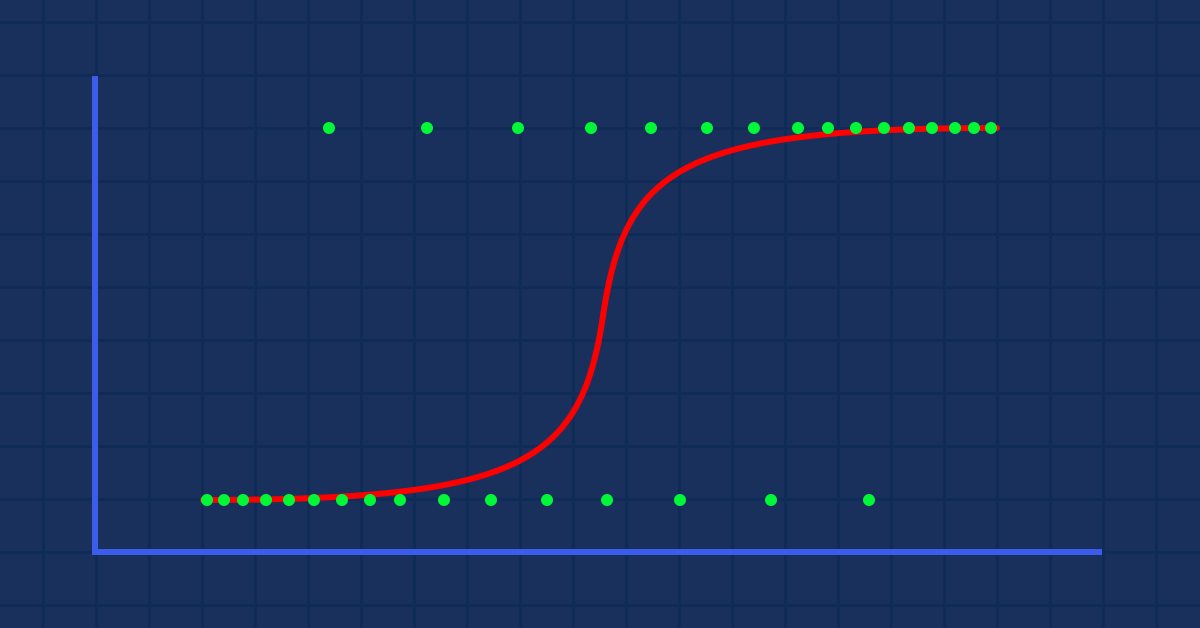
Data Science and Machine Learning (Part 02): Logistic Regression
Data Classification is a crucial thing for an algo trader and a programmer. In this article, we are going to focus on one of classification logistic algorithms that can probability help us identify the Yes's or No's, the Ups and Downs, Buys and Sells.

Visual evaluation of optimization results
In this article, we will consider how to build graphs of all optimization passes and to select the optimal custom criterion. We will also see how to create a desired solution with little MQL5 knowledge, using the articles published on the website and forum comments.

Brute force approach to pattern search (Part II): Immersion
In this article we will continue discussing the brute force approach. I will try to provide a better explanation of the pattern using the new improved version of my application. I will also try to find the difference in stability using different time intervals and timeframes.

Monte Carlo Permutation Tests in MetaTrader 5
In this article we take a look at how we can conduct permutation tests based on shuffled tick data on any expert advisor using only Metatrader 5.
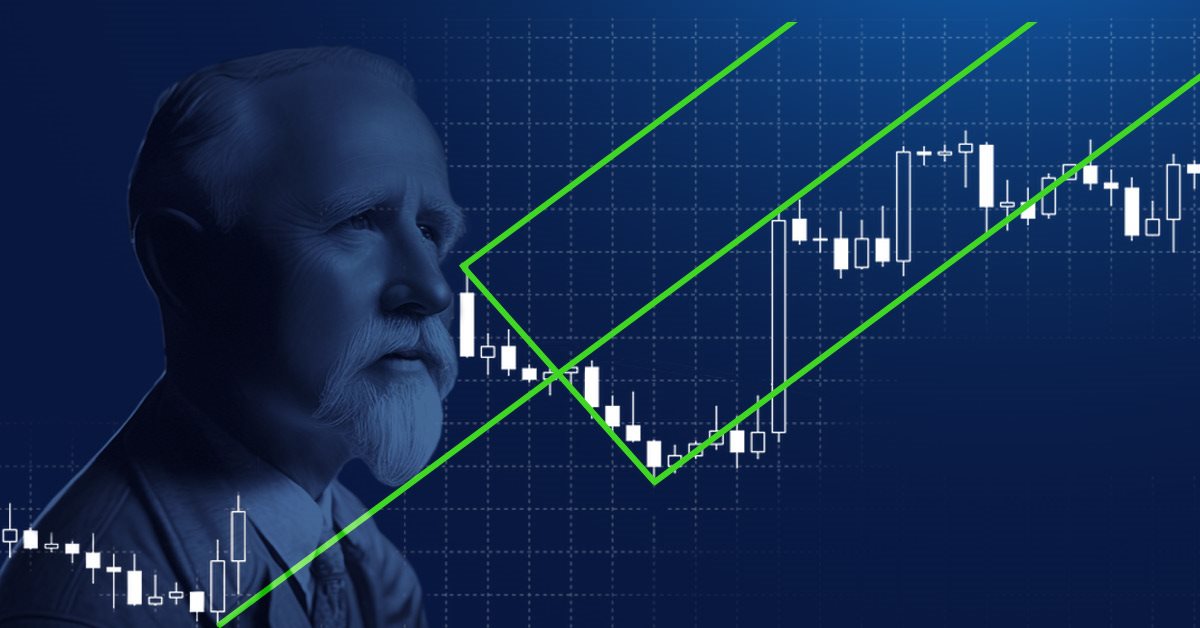
Alan Andrews and his methods of time series analysis
Alan Andrews is one of the most famous "educators" of the modern world in the field of trading. His "pitchfork" is included in almost all modern quote analysis programs. But most traders do not use even a fraction of the opportunities that this tool provides. Besides, Andrews' original training course includes a description not only of the pitchfork (although it remains the main tool), but also of some other useful constructions. The article provides an insight into the marvelous chart analysis methods that Andrews taught in his original course. Beware, there will be a lot of images.

Using Discriminant Analysis to Develop Trading Systems
When developing a trading system, there usually arises a problem of selecting the best combination of indicators and their signals. Discriminant analysis is one of the methods to find such combinations. The article gives an example of developing an EA for market data collection and illustrates the use of the discriminant analysis for building prognostic models for the FOREX market in Statistica software.

Growing Neural Gas: Implementation in MQL5
The article shows an example of how to develop an MQL5-program implementing the adaptive algorithm of clustering called Growing neural gas (GNG). The article is intended for the users who have studied the language documentation and have certain programming skills and basic knowledge in the area of neuroinformatics.

MQL5 Wizard techniques you should know (Part 06): Fourier Transform
The Fourier transform introduced by Joseph Fourier is a means of deconstructing complex data wave points into simple constituent waves. This feature could be resourceful to traders and this article takes a look at that.

Population optimization algorithms: Particle swarm (PSO)
In this article, I will consider the popular Particle Swarm Optimization (PSO) algorithm. Previously, we discussed such important characteristics of optimization algorithms as convergence, convergence rate, stability, scalability, as well as developed a test stand and considered the simplest RNG algorithm.
Prices in DoEasy library (part 60): Series list of symbol tick data
In this article, I will create the list for storing tick data of a single symbol and check its creation and retrieval of required data in an EA. Tick data lists that are individual for each used symbol will further constitute a collection of tick data.

Filtering Signals Based on Statistical Data of Price Correlation
Is there any correlation between the past price behavior and its future trends? Why does the price repeat today the character of its previous day movement? Can the statistics be used to forecast the price dynamics? There is an answer, and it is positive. If you have any doubt, then this article is for you. I'll tell how to create a working filter for a trading system in MQL5, revealing an interesting pattern in price changes.

Creating volatility forecast indicator using Python
In this article, we will forecast future extreme volatility using binary classification. Besides, we will develop an extreme volatility forecast indicator using machine learning.
Library for easy and quick development of MetaTrader programs (part IX): Compatibility with MQL4 - Preparing data
In the previous articles, we started creating a large cross-platform library simplifying the development of programs for MetaTrader 5 and MetaTrader 4 platforms. In the eighth part, we implemented the class for tracking order and position modification events. Here, we will improve the library by making it fully compatible with MQL4.

Neural networks made easy (Part 14): Data clustering
It has been more than a year since I published my last article. This is quite a lot time to revise ideas and to develop new approaches. In the new article, I would like to divert from the previously used supervised learning method. This time we will dip into unsupervised learning algorithms. In particular, we will consider one of the clustering algorithms—k-means.
Prices in DoEasy library (part 62): Updating tick series in real time, preparation for working with Depth of Market
In this article, I will implement updating tick data in real time and prepare the symbol object class for working with Depth of Market (DOM itself is to be implemented in the next article).
Gradient boosting in transductive and active machine learning
In this article, we will consider active machine learning methods utilizing real data, as well discuss their pros and cons. Perhaps you will find these methods useful and will include them in your arsenal of machine learning models. Transduction was introduced by Vladimir Vapnik, who is the co-inventor of the Support-Vector Machine (SVM).

Jeremy Scott - Successful MQL5 Market Seller
Jeremy Scott who is better known under Johnnypasado nickname at MQL5.community became famous offering products in our MQL5 Market service. Jeremy has already made several thousands of dollars in the Market and that is not the limit. We decided to take a closer look at the future millionaire and receive some pieces of advice for MQL5 Market sellers.

How to create and test custom MOEX symbols in MetaTrader 5
The article describes the creation of a custom exchange symbol using the MQL5 language. In particular, it considers the use of exchange quotes from the popular Finam website. Another option considered in this article is the possibility to work with an arbitrary format of text files used in the creation of the custom symbol. This allows working with any financial symbols and data sources. After creating a custom symbol, we can use all the capabilities of the MetaTrader 5 Strategy Tester to test trading algorithms for exchange instruments.

Timeseries in DoEasy library (part 58): Timeseries of indicator buffer data
In conclusion of the topic of working with timeseries organise storage, search and sort of data stored in indicator buffers which will allow to further perform the analysis based on values of the indicators to be created on the library basis in programs. The general concept of all collection classes of the library allows to easily find necessary data in the corresponding collection. Respectively, the same will be possible in the class created today.
Calculation of Integral Characteristics of Indicator Emissions
Indicator emissions are a little-studied area of market research. Primarily, this is due to the difficulty of analysis that is caused by the processing of very large arrays of time-varying data. Existing graphical analysis is too resource intensive and has therefore triggered the development of a parsimonious algorithm that uses time series of emissions. This article demonstrates how visual (intuitive image) analysis can be replaced with the study of integral characteristics of emissions. It can be of interest to both traders and developers of automated trading systems.

Rebuy algorithm: Math model for increasing efficiency
In this article, we will use the rebuy algorithm for a deeper understanding of the efficiency of trading systems and start working on the general principles of improving trading efficiency using mathematics and logic, as well as apply the most non-standard methods of increasing efficiency in terms of using absolutely any trading system.
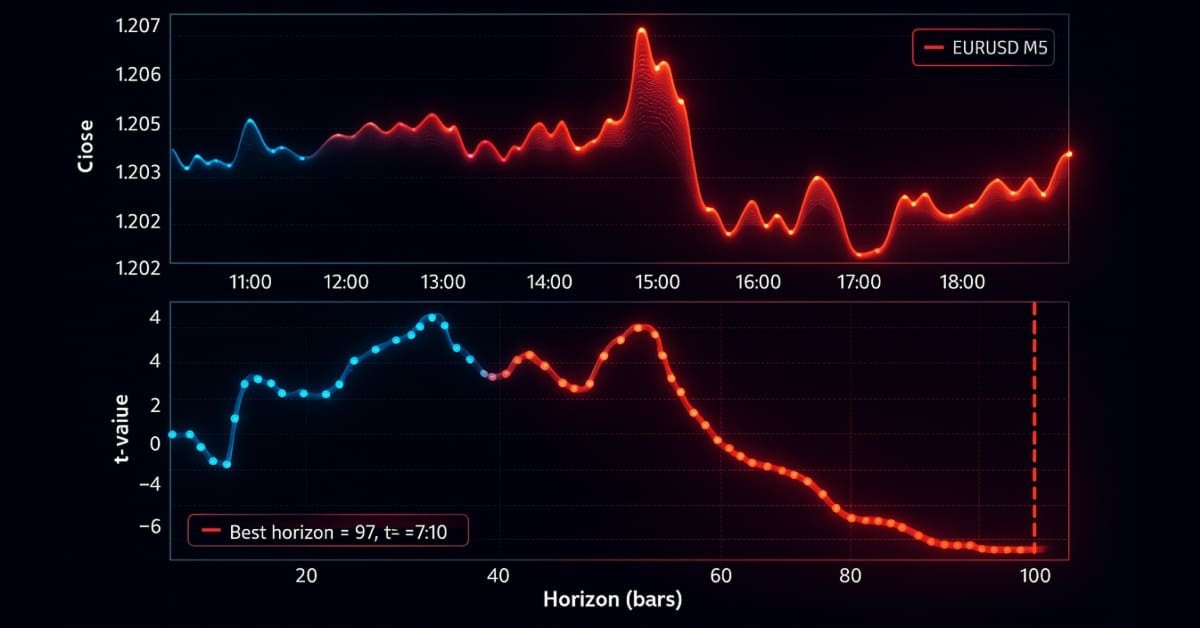
MetaTrader 5 Machine Learning Blueprint (Part 3): Trend-Scanning Labeling Method
We have built a robust feature engineering pipeline using proper tick-based bars to eliminate data leakage and solved the critical problem of labeling with meta-labeled triple-barrier signals. This installment covers the advanced labeling technique, trend-scanning, for adaptive horizons. After covering the theory, an example shows how trend-scanning labels can be used with meta-labeling to improve on the classic moving average crossover strategy.

From Novice to Expert: Demystifying Hidden Fibonacci Retracement Levels
In this article, we explore a data-driven approach to discovering and validating non-standard Fibonacci retracement levels that markets may respect. We present a complete workflow tailored for implementation in MQL5, beginning with data collection and bar or swing detection, and extending through clustering, statistical hypothesis testing, backtesting, and integration into an MetaTrader 5 Fibonacci tool. The goal is to create a reproducible pipeline that transforms anecdotal observations into statistically defensible trading signals.