Price Action Analysis Toolkit Development (Part 25): Dual EMA Fractal Breaker

Contents
Introduction
This article aims to present the development of a tool designed to assist in price action analysis by providing a deeper and more insightful evaluation using the Fractals indicator, originally developed by Bill Williams.
Bill M. Williams (1932–2019) was an influential American trader and author renowned for his contributions to trading psychology, technical analysis, and chaos theory in financial markets. Throughout his career, Williams studied stock, commodity, and foreign exchange (Forex) markets, developing a series of innovative technical analysis tools to identify trends and potential reversal points. Some of his most notable indicators include the Accelerator/Decelerator Oscillator, the Alligator indicator, the Awesome Oscillator, the Fractals indicator, the Gator Oscillator, and the Market Facilitation Index. Today, these indicators are widely utilized across Forex, stock, and other financial markets for their effectiveness in analyzing market behavior.
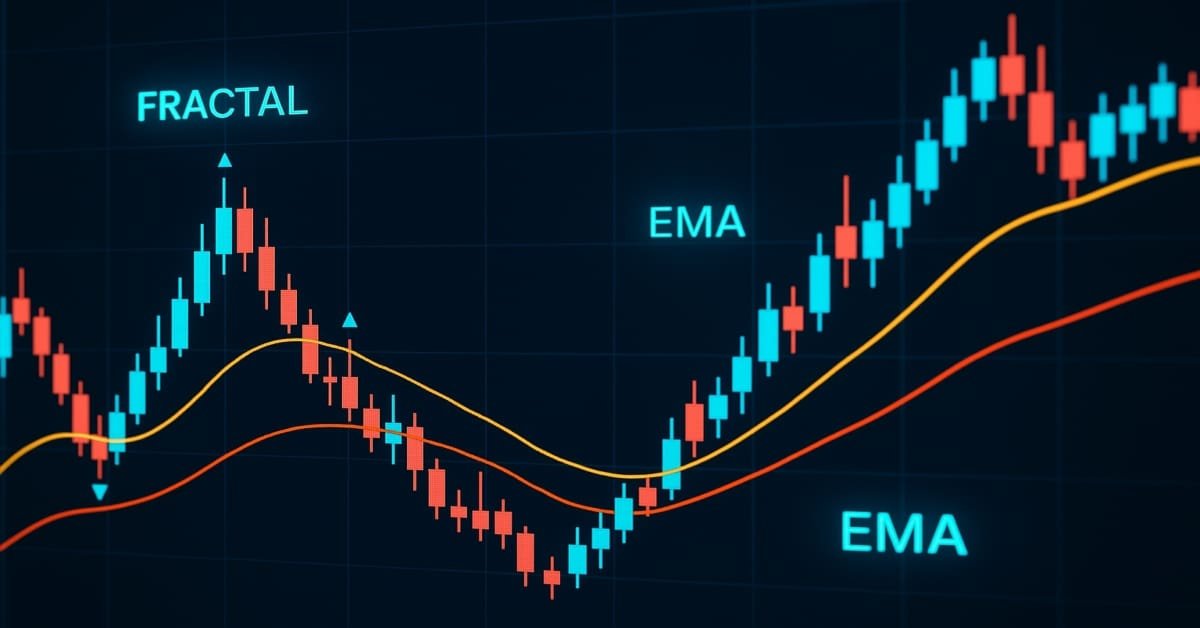
The Fractals indicator, a key component of Williams’ methodology, is combined in our approach with the Exponential Moving Averages (EMAs) of 14 and 200 periods. By integrating the fractal patterns with these dynamic trend filters, our Expert Advisor (EA) is designed to identify potential market reversals accurately while ensuring alignment with the overall trend direction. This combined strategy enhances trading decision-making by enabling early detection of reversal signals and confirming trend strength, ultimately leading to more reliable and high-probability entry points. The synergy between fractal analysis and moving averages provides traders with a powerful tool to interpret price action more profoundly, helping to optimize timing and improve trade outcomes.
Understanding The Strategy
Our Expert Advisor (EA) utilizes three key technical indicators: the Fractal indicator, EMA 14, and EMA 200. The Fractal indicator, developed by Bill Williams, is a popular tool in technical analysis for identifying potential trend reversals. It detects specific price patterns, called fractals, that appear as local highs or lows, signaling possible turning points in the market. These fractals serve as support or resistance levels, providing traders with visual cues to help time entries and exits more precisely.
The Exponential Moving Average (EMA) differs fundamentally from the Simple Moving Average (SMA) by assigning greater weight to the most recent price data, resulting in a more responsive indicator. This weighting is achieved through a smoothing factor that exponentially emphasizes recent prices, allowing the EMA to react more swiftly to market changes. Consequently, EMAs are highly effective for capturing emerging trends and providing early signals of trend shifts, especially over shorter periods.
The EMA 14 reflects short-term market momentum in our setup, reacting quickly to recent price movements, making it suitable for timely trade entries. Conversely, the EMA 200 is a long-term trend indicator, smoothing out short-term noise to reveal the overall market direction. When the price trades above the EMA 200, it indicates a bullish long-term trend; when below, a bearish trend is implied. Additionally, the EMA 200 often acts as a dynamic support or resistance level, helping traders filter out false signals and confirm trend validity.
Buy Signal (Bullish Breakout):
A buy signal is triggered when several conditions are simultaneously met, indicating a strong upward move. First, the EA monitors the most recent fractal low level (the support level). It looks for a scenario where the current market price crosses above this fractal support level, signaling a potential breakout. To confirm that the market is in an upward trend, the EA checks if the current price is above both the EMA 14 and EMA 200, with the EMA 14 being above the EMA 200, indicating a bullish trend. When these conditions align, a buy signal is generated. Visual cues such as an upward arrow and a label are placed on the chart, and an alert can be triggered to notify the trader.
- Price crosses above the most recent support fractal level.
- Current price is above EMA 14 and EMA 200.
- EMA 14 is above EMA 200, confirming an upward trend.
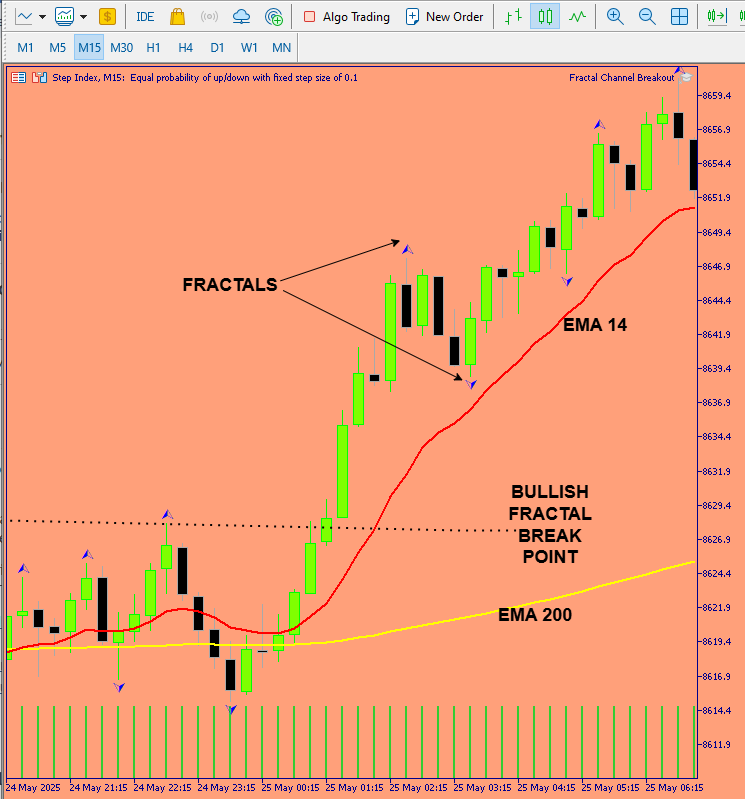
Fig. 1. Bullish Break
Sell Signal (Bearish Breakdown):
Conversely, a sell signal is produced when the price crosses below a significant fractal high (resistance level), indicating a potential downward move. The EA observes the most recent fractal high and waits for the market price to break below this level. To verify that the market is trending downward, it confirms that the current price is below both EMAs, with the EMA 14 below EMA 200, indicating a bearish trend. When these criteria are satisfied; namely, the price crossing below the resistance fractal level while the trend remains bearish, a sell signal is issued. Similar visual markers such as downward arrows and labels are plotted, and alerts may be activated.
- Price crosses below the most recent resistance fractal level.
- Current price is below EMA 14 and EMA 200.
- EMA 14 is below EMA 200, confirming a downward trend.
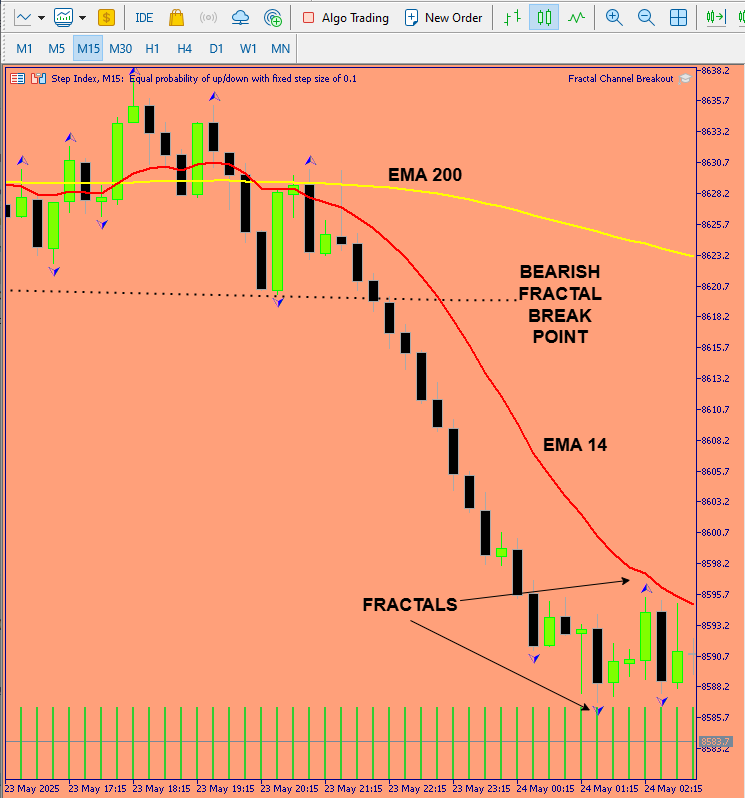
Fig. 2. Bearish Break
Code Components Breakdown
This EA integrates fractal analysis with moving average trend filters to identify and visualize potential breakout points in the market. By plotting horizontal levels at recent fractal highs and lows, it marks critical support and resistance zones. When the price crosses these levels in the direction confirmed by the EMA trend, the EA generates visual signals (arrows and labels) and auditory alerts, simplifying the trader’s decision-making process. Its modular design, with functions dedicated to drawing, signaling, and data management, makes it adaptable for various trading styles and preferences. Additionally, the emphasis on resource management and cleanup ensures stability and clarity during operation. Overall, this sophisticated combination of indicators and visual cues provides a comprehensive tool for traders seeking to exploit fractal breakout opportunities within a trending environment.Header and Metadata
The initial section of the code contains metadata that describes the script's authorship, version, and licensing information. The comments enclosed within //+------------------------------------------------------------------+ serve to identify the script's purpose and provide attribution. The #property directives specify the copyright owner, a hyperlink to the author's profile on the MetaTrader community, the version number, and enforce strict compilation rules. The #property strict directive is particularly important because it instructs the compiler to adhere to stricter coding standards, catching potential errors such as undeclared variables or type mismatches. These metadata and directives do not influence the runtime logic but serve as documentation and ensure code quality during compilation.
//+------------------------------------------------------------------+
//|                              Fractal Breakout, EMA 14 and EMA 200|
//|                                   Copyright 2025, MetaQuotes Ltd.|
//|                           https://www.mql5.com/en/users/lynnchris|
//+------------------------------------------------------------------+
#property copyright "Copyright 2025, MetaQuotes Ltd."
#property link      "https://www.mql5.com/en/users/lynnchris"
#property version   "1.0"
#property strict
Input Parameters
This section defines all configurable parameters that a user can modify without altering the core code. These inputs include the timeframe for analysis (InpTimeframe), the number of bars to examine (InpHistoryBars), and the periods for the two EMAs, which serve as trend filters (InpEMA14Period and InpEMA200Period).
Color parameters (InpBullColor and InpBearColor) enable visual customization of the arrows and lines indicating breakouts. Text labels (InpBullText and InpBearText) provide descriptive annotations for signals, enhancing chart clarity. The arrow offset (InpArrowOffset) and font size (InpArrowFontSize) give further control over the visual presentation, allowing the trader to position labels conveniently.
The alert system is governed by InpAlertsEnabled, which toggles pop-up notifications, and InpAlertSoundFile, which specifies the sound file played upon detection. These parameters make the EA flexible and adaptable to different trading styles and visual preferences, enabling users to tailor it to their specific needs.
input ENUM_TIMEFRAMES InpTimeframe      = PERIOD_CURRENT;  // chart TF
input int             InpHistoryBars    = 200;             // bars back to scan
input int             InpEMA14Period    = 14;              // fast EMA
input int             InpEMA200Period   = 200;             // slow EMA
input color           InpBullColor      = clrLime;         // bullish arrow color
input color           InpBearColor      = clrRed;          // bearish arrow color
input string          InpBullText       = "BULL Break";    // bullish label
input string          InpBearText       = "BEAR Break";    // bearish label
input int             InpArrowOffset    = 20;              // offset in points for label
input int             InpArrowFontSize  = 12;              // size of the arrow glyph
input bool            InpAlertsEnabled  = true;            // show pop-up alerts
input string          InpAlertSoundFile = "alert.wav";     // sound file in /Sounds/
Global Variables and Indicator Handles
The variables declared outside functions serve as storage for indicator handles and fractal data arrays. The handles (hFractals, hEMA14, hEMA200) are references to the indicator instances created during initialization. They are essential because they allow the EA to interact with the indicators' buffers, fetching real-time and historical data. The arrays fractalUp[] and fractalDown[] are dynamically allocated buffers that will hold the fractal high and low points, respectively. Managing these as global variables ensures that they can be accessed throughout the script, particularly during the OnTick processing, where real-time analysis occurs.
int  hFractals, hEMA14, hEMA200;
double fractalUp[], fractalDown[];
Initialization (OnInit)
During startup, the OnInit function is invoked to set up necessary resources. It creates indicator handles for fractals and EMAs using functions like iFractals and iMA, specifying the symbol and timeframe. Successful creation of these handles is crucial; if any handle is invalid (e.g., due to incorrect parameters or unavailable data), the initialization fails, preventing the EA from running improperly.
The code then configures the fractal data arrays to operate as series, meaning the latest data will be at index 0, which simplifies backward analysis. Resizing these arrays to the number of bars specified ensures that the data buffers are appropriately sized for efficient processing. Overall, this step establishes the foundation for reliable data retrieval, which is vital for accurate breakout detection.
int OnInit()
  {
   hFractals = iFractals(_Symbol, InpTimeframe);
   hEMA14    = iMA(_Symbol, InpTimeframe, InpEMA14Period, 0, MODE_EMA, PRICE_CLOSE);
   hEMA200   = iMA(_Symbol, InpTimeframe, InpEMA200Period,0, MODE_EMA, PRICE_CLOSE);
   if(hFractals==INVALID_HANDLE || hEMA14==INVALID_HANDLE || hEMA200==INVALID_HANDLE)
      return(INIT_FAILED);

   ArraySetAsSeries(fractalUp,   true);
   ArraySetAsSeries(fractalDown, true);
   ArrayResize(fractalUp,   InpHistoryBars);
   ArrayResize(fractalDown, InpHistoryBars);
   return(INIT_SUCCEEDED);
  }
Deinitialization (OnDeinit)
When the EA is removed from the chart or the terminal is closed, OnDeinit executes to clean up resources. It releases the indicator handles using IndicatorRelease, freeing associated memory and preventing leaks. Additionally, it iterates through all objects present on the chart, identifying and deleting those with the prefix "FB_", which are the visual signals (arrows, labels, lines) created during operation. This cleanup ensures that no residual objects clutter the chart after the EA is deactivated, maintaining a clean chart environment and preventing potential conflicts or confusion during subsequent analyses.
void OnDeinit(const int reason)
  {
   if(hFractals!=INVALID_HANDLE)
      IndicatorRelease(hFractals);
   if(hEMA14   !=INVALID_HANDLE)
      IndicatorRelease(hEMA14);
   if(hEMA200  !=INVALID_HANDLE)
      IndicatorRelease(hEMA200);

   for(int i=ObjectsTotal(0)-1; i>=0; i--)
     {
      string n = ObjectName(0,i);
      if(StringFind(n,"FB_")>=0)
         ObjectDelete(0,n);
     }
  }
Main Processing (OnTick)
The core logic resides in the OnTick function, which executes every time a new market tick arrives. It begins by fetching the latest values of the two EMAs using CopyBuffer. These EMA values serve as trend filters: their relative position indicates whether the market is in an uptrend or downtrend, aiding the breakout decision. If the EMA data retrieval fails, the function exits early to prevent erroneous signals. Next, the function retrieves fractal data buffers for both the most recent high and low fractals, again with error checking. The code then searches backward through these buffers to find the most recent valid fractals, ignoring any placeholder EMPTY_VALUEs. By identifying the most recent significant fractal points, the EA determines the critical support or resistance levels that could trigger breakouts. It then draws horizontal lines at these levels for visual reference, using a helper function. The terminal debugging output provides real-time insight into the levels, prices, and EMA states, helping traders verify the logic.
Finally, the EA checks for breakout conditions: a bearish breakout occurs when the previous close was above the down level, the current close crosses below it, and the price is below both EMAs in a downward trend. Conversely, a bullish breakout is recognized when the previous close was below the up level, the current cross is above it, and the price is above both EMAs in an upward trend. Detecting these conditions triggers the signaling function.
void OnTick()
  {
   // 1) Read current EMAs
   double ema14Arr[1], ema200Arr[1];
   if(CopyBuffer(hEMA14,0,0,1,ema14Arr)<=0 || CopyBuffer(hEMA200,0,0,1,ema200Arr)<=0)
      return;
   double ema14_now  = ema14Arr[0];
   double ema200_now = ema200Arr[0];

   // 2) Read fractal history (skip current bar)
   if(CopyBuffer(hFractals,0,1,InpHistoryBars,fractalUp)<=0 ||
      CopyBuffer(hFractals,1,1,InpHistoryBars,fractalDown)<=0)
      return;

   // 3) Find most recent valid fractals (ignore EMPTY_VALUE)
   int upShift=-1, downShift=-1;
   for(int i=1; i<InpHistoryBars; i++)
     {
      if(fractalUp[i]   != EMPTY_VALUE && upShift<0)
         upShift   = i+1;
      if(fractalDown[i] != EMPTY_VALUE && downShift<0)
         downShift = i+1;
      if(upShift>0 && downShift>0)
         break;
     }

   // 4) Levels
   double lvlUp   = (upShift>0)   ? fractalUp[upShift-1]     : 0.0;
   double lvlDown = (downShift>0) ? fractalDown[downShift-1] : 0.0;

   // 5) Draw level lines
   DrawHLine("FB_LevelUp",   lvlUp,   InpBullColor);
   DrawHLine("FB_LevelDown", lvlDown, InpBearColor);

   // 6) DEBUG print
   double prevC = iClose(_Symbol,InpTimeframe,1);
   double currC = iClose(_Symbol,InpTimeframe,0);
   PrintFormat(
      "DBG lvlUp=%.5f lvlDown=%.5f prevC=%.5f currC=%.5f EMA14=%.5f EMA200=%.5f",
      lvlUp, lvlDown, prevC, currC, ema14_now, ema200_now
   );

   // 7) Breakouts on the last closed candle (shift=1)

   // Bearish breakout detection
   if(lvlDown>0
      && prevC>=lvlDown && currC<lvlDown
      && currC<ema14_now && currC<ema200_now
      && ema200_now>ema14_now)
     {
      Print(">>> Bear breakout triggered");
      Signal(false, 1, lvlDown, ema14_now, ema200_now);
     }

   // Bullish breakout detection
   if(lvlUp>0
      && prevC<=lvlUp && currC>lvlUp
      && currC>ema14_now && currC>ema200_now
      && ema14_now>ema200_now)
     {
      Print(">>> Bull breakout triggered");
      Signal(true, 1, lvlUp, ema14_now, ema200_now);
     }
  }
Drawing Horizontal Lines (DrawHLine)
This utility function manages the creation and updating of horizontal lines on the chart. When invoked, it checks whether a line with the specified name exists; if not, it creates a new dotted line at the given price level with the specified color. If the line already exists, it simply updates its position. This approach prevents multiple overlapping lines and ensures that the visual levels stay current with the latest fractal analysis. The dotted style helps distinguish these lines from other chart objects, emphasizing their role as support or resistance levels. Such visual cues are invaluable for traders, enabling quick recognition of breakout zones and facilitating manual or automated decision-making.
void DrawHLine(string name, double price, color clr)
  {
   if(price<=0)
      return;
   if(ObjectFind(0,name)<0)
     {
      ObjectCreate(0,name,OBJ_HLINE,0,0,price);
      ObjectSetInteger(0,name,OBJPROP_COLOR,clr);
      ObjectSetInteger(0,name,OBJPROP_STYLE,STYLE_DOT);
      ObjectSetInteger(0,name,OBJPROP_WIDTH,1);
     }
   else
      ObjectSetDouble(0,name,OBJPROP_PRICE,price);
  }
Signaling and Visualization (Signal)
The Signal function encapsulates all actions related to signaling a breakout event. It begins by retrieving the timestamp of the bar at which the signal occurred, ensuring precise placement of visual objects. It then creates an arrow object at the breakout level, pointing up or down depending on whether it is bullish or bearish, with color coding matching the trend. The arrow's appearance is customized with width and size parameters for clarity. Alongside the arrow, a text label is added slightly offset vertically, displaying a descriptive message like "BULL Break" or "BEAR Break," reinforcing the visual cue.
The function logs a detailed message in the Experts tab, including the exact time, level, close price, and EMA values, providing a comprehensive record of signals. If alerts are enabled, a pop-up message appears, and a sound file is played to notify the trader immediately. This combination of visual, auditory, and log-based signals ensures that traders are promptly informed of potential breakout opportunities, enabling timely action.
void Signal(bool isBull, int shift, double level, double ema14, double ema200)
  {
   datetime t     = iTime(_Symbol,InpTimeframe,shift);
   double   price = level;
   string   side  = isBull ? "Bull" : "Bear";

   // Arrow
   string arrowName = StringFormat("FB_%sArrow_%d", side, (int)t);
   ObjectCreate(0, arrowName, OBJ_ARROW, 0, t, price);
   ObjectSetInteger(0, arrowName, OBJPROP_ARROWCODE,    isBull?233:234);
   ObjectSetInteger(0, arrowName, OBJPROP_COLOR,        isBull?InpBullColor:InpBearColor);
   ObjectSetInteger(0, arrowName, OBJPROP_WIDTH,        2);
   ObjectSetInteger(0, arrowName, OBJPROP_FONTSIZE,     InpArrowFontSize);

   // Label
   string lab = arrowName + "_L";
   double offset = (isBull ? InpArrowOffset : -InpArrowOffset) * _Point;
   ObjectCreate(0, lab, OBJ_TEXT, 0, t, price + offset);
   ObjectSetString(0, lab, OBJPROP_TEXT,    isBull?InpBullText:InpBearText);
   ObjectSetInteger(0, lab, OBJPROP_COLOR,  isBull?InpBullColor:InpBearColor);
   ObjectSetInteger(0, lab, OBJPROP_FONTSIZE, 11);

   // Log message
   string msg = StringFormat(
                   "%s breakout at %s | Level=%.5f | Close=%.5f | EMA14=%.5f | EMA200=%.5f",
                   side, TimeToString(t, TIME_DATE|TIME_SECONDS),
                   level, iClose(_Symbol,InpTimeframe,shift),
                   ema14, ema200
                );
   Print(msg);

   // Alert and sound
   if(InpAlertsEnabled)
     {
      Alert(msg);
      if(StringLen(InpAlertSoundFile)>0)
         PlaySound(InpAlertSoundFile);
     }
  }
MQL5 Code
//+------------------------------------------------------------------+
//|                              Fractal Breakout, EMA 14 and EMA 200|
//|                                   Copyright 2025, MetaQuotes Ltd.|
//|                           https://www.mql5.com/en/users/lynnchris|
//+------------------------------------------------------------------+
#property copyright "Copyright 2025, MetaQuotes Ltd."
#property link      "https://www.mql5.com/en/users/lynnchris"
#property version   "1.0"
#property strict

//---inputs
input ENUM_TIMEFRAMES InpTimeframe      = PERIOD_CURRENT;  // chart TF
input int             InpHistoryBars    = 200;             // bars back to scan
input int             InpEMA14Period    = 14;              // fast EMA
input int             InpEMA200Period   = 200;             // slow EMA
input color           InpBullColor      = clrLime;         // bullish arrow color
input color           InpBearColor      = clrRed;          // bearish arrow color
input string          InpBullText       = "BULL Break";    // bullish label
input string          InpBearText       = "BEAR Break";    // bearish label
input int             InpArrowOffset    = 20;              // offset in points for label
input int             InpArrowFontSize  = 12;              // size of the arrow glyph
input bool            InpAlertsEnabled  = true;            // show pop-up alerts
input string          InpAlertSoundFile = "alert.wav";     // sound file in /Sounds/

//---indicator handles & buffers
int  hFractals, hEMA14, hEMA200;
double fractalUp[], fractalDown[];

//+------------------------------------------------------------------+
//| Expert initialization                                            |
//+------------------------------------------------------------------+
int OnInit()
  {
   hFractals = iFractals(_Symbol, InpTimeframe);
   hEMA14    = iMA(_Symbol, InpTimeframe, InpEMA14Period, 0, MODE_EMA, PRICE_CLOSE);
   hEMA200   = iMA(_Symbol, InpTimeframe, InpEMA200Period,0, MODE_EMA, PRICE_CLOSE);
   if(hFractals==INVALID_HANDLE || hEMA14==INVALID_HANDLE || hEMA200==INVALID_HANDLE)
      return(INIT_FAILED);

   ArraySetAsSeries(fractalUp,   true);
   ArraySetAsSeries(fractalDown, true);
   ArrayResize(fractalUp,   InpHistoryBars);
   ArrayResize(fractalDown, InpHistoryBars);
   return(INIT_SUCCEEDED);
  }

//+------------------------------------------------------------------+
//| Expert deinitialization                                          |
//+------------------------------------------------------------------+
void OnDeinit(const int reason)
  {
   if(hFractals!=INVALID_HANDLE)
      IndicatorRelease(hFractals);
   if(hEMA14   !=INVALID_HANDLE)
      IndicatorRelease(hEMA14);
   if(hEMA200  !=INVALID_HANDLE)
      IndicatorRelease(hEMA200);

   for(int i=ObjectsTotal(0)-1; i>=0; i--)
     {
      string n = ObjectName(0,i);
      if(StringFind(n,"FB_")>=0)
         ObjectDelete(0,n);
     }
  }

//+------------------------------------------------------------------+
//| Tick handler                                                     |
//+------------------------------------------------------------------+
void OnTick()
  {
// 1) Read current EMAs
   double ema14Arr[1], ema200Arr[1];
   if(CopyBuffer(hEMA14,0,0,1,ema14Arr)<=0 || CopyBuffer(hEMA200,0,0,1,ema200Arr)<=0)
      return;
   double ema14_now  = ema14Arr[0];
   double ema200_now = ema200Arr[0];

// 2) Read fractal history (skip current bar)
   if(CopyBuffer(hFractals,0,1,InpHistoryBars,fractalUp)<=0 ||
      CopyBuffer(hFractals,1,1,InpHistoryBars,fractalDown)<=0)
      return;

// 3) Find most recent valid fractals (ignore EMPTY_VALUE)
   int upShift=-1, downShift=-1;
   for(int i=1; i<InpHistoryBars; i++)
     {
      if(fractalUp[i]   != EMPTY_VALUE && upShift<0)
         upShift   = i+1;
      if(fractalDown[i] != EMPTY_VALUE && downShift<0)
         downShift = i+1;
      if(upShift>0 && downShift>0)
         break;
     }

// 4) Levels
   double lvlUp   = (upShift>0)   ? fractalUp[upShift-1]     : 0.0;
   double lvlDown = (downShift>0) ? fractalDown[downShift-1] : 0.0;

// 5) Draw level lines
   DrawHLine("FB_LevelUp",   lvlUp,   InpBullColor);
   DrawHLine("FB_LevelDown", lvlDown, InpBearColor);

// 6) DEBUG print
   double prevC = iClose(_Symbol,InpTimeframe,1);
   double currC = iClose(_Symbol,InpTimeframe,0);
   PrintFormat(
      "DBG lvlUp=%.5f lvlDown=%.5f prevC=%.5f currC=%.5f EMA14=%.5f EMA200=%.5f",
      lvlUp, lvlDown, prevC, currC, ema14_now, ema200_now
   );

// 7) Breakouts on the last closed candle (shift=1)

// Bearish breakout
   if(lvlDown>0
      && prevC>=lvlDown && currC<lvlDown
      && currC<ema14_now && currC<ema200_now
      && ema200_now>ema14_now)
     {
      Print(">>> Bear breakout triggered");
      Signal(false, 1, lvlDown, ema14_now, ema200_now);
     }
// Bullish breakout
   if(lvlUp>0
      && prevC<=lvlUp && currC>lvlUp
      && currC>ema14_now && currC>ema200_now
      && ema14_now>ema200_now)
     {
      Print(">>> Bull breakout triggered");
      Signal(true, 1, lvlUp, ema14_now, ema200_now);
     }
  }

//+------------------------------------------------------------------+
//| Draw or update a dotted HLine                                    |
//+------------------------------------------------------------------+
void DrawHLine(string name, double price, color clr)
  {
   if(price<=0)
      return;
   if(ObjectFind(0,name)<0)
     {
      ObjectCreate(0,name,OBJ_HLINE,0,0,price);
      ObjectSetInteger(0,name,OBJPROP_COLOR,clr);
      ObjectSetInteger(0,name,OBJPROP_STYLE,STYLE_DOT);
      ObjectSetInteger(0,name,OBJPROP_WIDTH,1);
     }
   else
      ObjectSetDouble(0,name,OBJPROP_PRICE,price);
  }

//+------------------------------------------------------------------+
//| Plot arrow, label, log & alert                                   |
//+------------------------------------------------------------------+
void Signal(bool isBull, int shift, double level, double ema14, double ema200)
  {
   datetime t     = iTime(_Symbol,InpTimeframe,shift);
   double   price = level;
   string   side  = isBull ? "Bull" : "Bear";

// Arrow
   string arrowName = StringFormat("FB_%sArrow_%d", side, (int)t);
   ObjectCreate(0, arrowName, OBJ_ARROW, 0, t, price);
   ObjectSetInteger(0, arrowName, OBJPROP_ARROWCODE,    isBull?233:234);
   ObjectSetInteger(0, arrowName, OBJPROP_COLOR,        isBull?InpBullColor:InpBearColor);
   ObjectSetInteger(0, arrowName, OBJPROP_WIDTH,        2);
   ObjectSetInteger(0, arrowName, OBJPROP_FONTSIZE,     InpArrowFontSize);

// Label
   string lab = arrowName + "_L";
   double offset = (isBull ? InpArrowOffset : -InpArrowOffset) * _Point;
   ObjectCreate(0, lab, OBJ_TEXT, 0, t, price + offset);
   ObjectSetString(0, lab, OBJPROP_TEXT,    isBull?InpBullText:InpBearText);
   ObjectSetInteger(0, lab, OBJPROP_COLOR,  isBull?InpBullColor:InpBearColor);
   ObjectSetInteger(0, lab, OBJPROP_FONTSIZE, 11);

// Expert log
   string msg = StringFormat(
                   "%s breakout at %s | Level=%.5f | Close=%.5f | EMA14=%.5f | EMA200=%.5f",
                   side, TimeToString(t, TIME_DATE|TIME_SECONDS),
                   level, iClose(_Symbol,InpTimeframe,shift),
                   ema14, ema200
                );
   Print(msg);

// Pop-up alert + optional sound
   if(InpAlertsEnabled)
     {
      Alert(msg);
      if(StringLen(InpAlertSoundFile)>0)
         PlaySound(InpAlertSoundFile);
     }
  }
//+------------------------------------------------------------------+
Outcomes
To test the EA, first compile the code using MetaEditor. Once compiled, you can apply it to a chart in MetaTrader 5 for live testing or directly run it through the Strategy Tester for backtesting purposes. I have conducted tests of this EA in both live market conditions and historical backtests. This process is essential for fine-tuning the EA parameters to achieve the desired trading behavior and optimize its performance.
The chart in the image below demonstrates how the EA identifies a significant market reversal using fractals and EMA indicators. Specifically, the EA detects a bearish fractal break at a key support level, which is visually marked on the chart. The subsequent price movement confirms the reversal, as the market continues downward, aligning with the EMA trend, where the EMA 14 crosses below the EMA 200, indicating a shift to a bearish trend. The visual cues, such as the “BEAR Break” marker, support disciplined entry and exit decisions. This outcome illustrates the EA’s ability to recognize early signs of trend reversal, enabling traders to capitalize on high-probability opportunities while avoiding false signals.
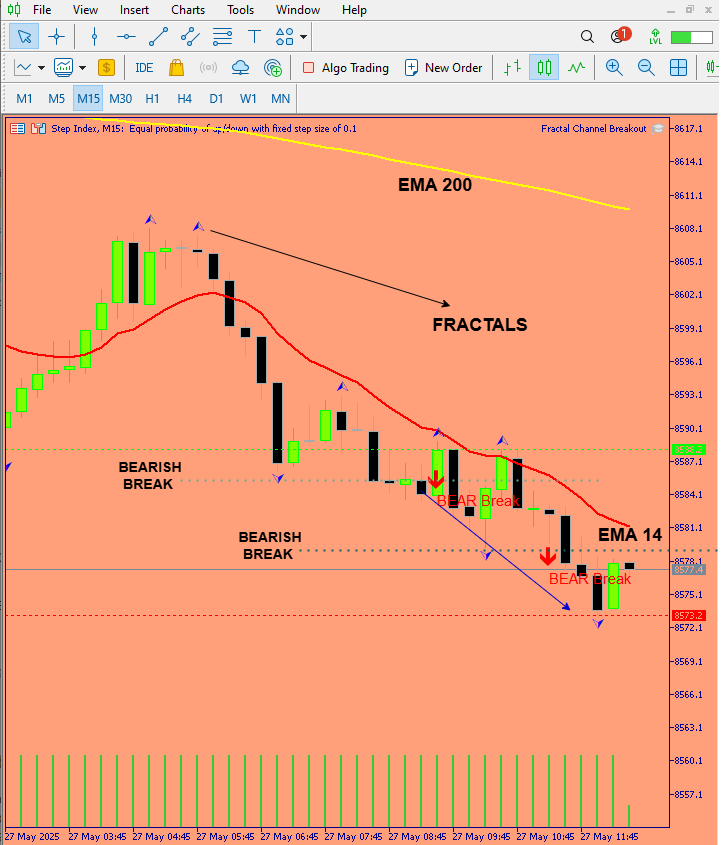
Fig. 3. Bear Break on Step Index
The GIF below showcases the real-time detection and confirmation process of a trend reversal by the EA. It highlights how the indicator system identifies a fractal support or resistance level and signals a potential breakout, prompting the trader to consider a position. As the market moves in the predicted direction, the EA’s signals are confirmed by the alignment of the EMAs; the EMA 14 crossing below the EMA 200, validating the bearish trend. The visual cues, such as arrows and alerts, demonstrate how the EA facilitates timely decision-making. This example underscores the importance of early detection combined with trend confirmation, which enhances trading confidence and reduces the likelihood of false entries.

Fig. 4. Backtesting on V75 (1s)
Conclusion
This expert advisor harnesses the power of Bill Williams’ Fractals indicator alongside both short-term and long-term exponential moving averages to pinpoint high-probability entry points. By combining these tools, it captures early reversal signals that are confirmed against the prevailing market trend, improving precision and consistency in trade execution. Rigorous backtests and live trials have shown its flexibility across diverse market conditions, and, when fine-tuned, its parameters can be adapted for optimal performance. With intuitive on-chart arrows and labels plus fully automated order placement, this EA brings discipline and speed to your trading routine. In essence, it delivers a systematic, rules-based framework for price-action analysis, ideal for traders seeking to blend technical rigor with automation.
Review our featured tools in the table below.
Warning: All rights to these materials are reserved by MetaQuotes Ltd. Copying or reprinting of these materials in whole or in part is prohibited.
This article was written by a user of the site and reflects their personal views. MetaQuotes Ltd is not responsible for the accuracy of the information presented, nor for any consequences resulting from the use of the solutions, strategies or recommendations described.

- Free trading apps
- Over 8,000 signals for copying
- Economic news for exploring financial markets
You agree to website policy and terms of use
Interesting article, and thank you for the EA source code. I'll try it out and provide feedback.