Articles on data analysis and statistics in MQL5

Articles on mathematical models and laws of probability are interesting for many traders. Mathematics is the basis of technical indicators, and statistics is required to analyze trading results and develop strategies.
Read about the fuzzy logic, digital filters, market profile, Kohonen maps, neural gas and many other tools that can be used for trading.
Add a new article

You are missing trading opportunities:
- Free trading apps
- Over 8,000 signals for copying
- Economic news for exploring financial markets
Registration
Log in
You agree to website policy and terms of use
If you do not have an account, please register


Developing a Replay System (Part 27): Expert Advisor project — C_Mouse class (I)
In this article we will implement the C_Mouse class. It provides the ability to program at the highest level. However, talking about high-level or low-level programming languages is not about including obscene words or jargon in the code. It's the other way around. When we talk about high-level or low-level programming, we mean how easy or difficult the code is for other programmers to understand.

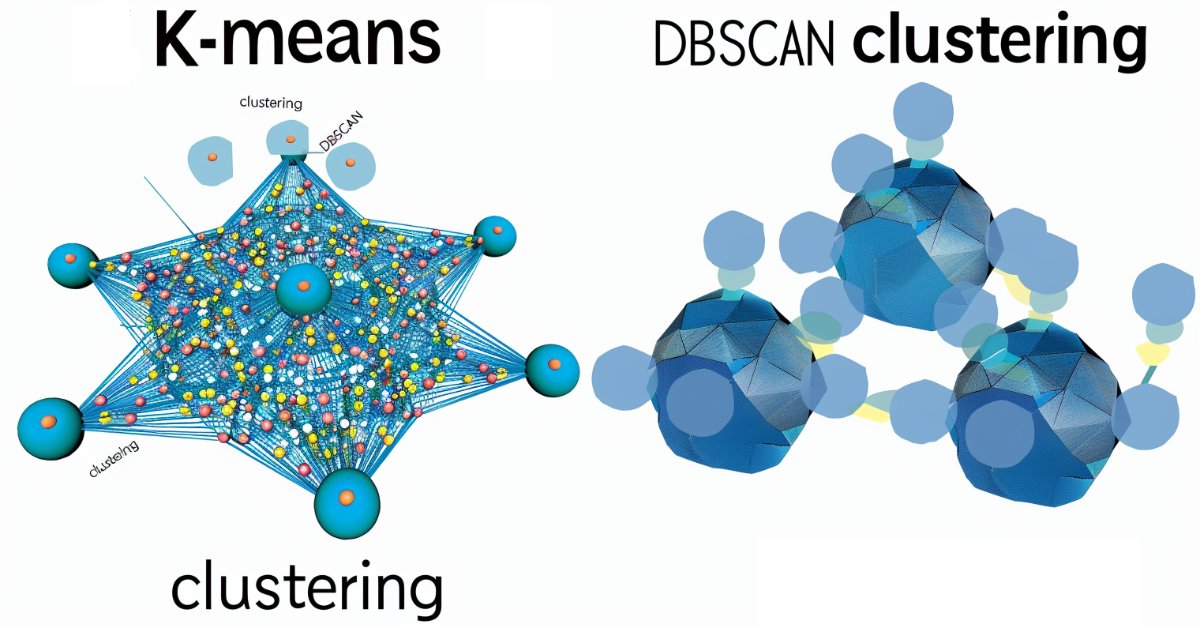
MQL5 Wizard Techniques you should know (Part 13): DBSCAN for Expert Signal Class
Density Based Spatial Clustering for Applications with Noise is an unsupervised form of grouping data that hardly requires any input parameters, save for just 2, which when compared to other approaches like k-means, is a boon. We delve into how this could be constructive for testing and eventually trading with Wizard assembled Expert Advisers


Category Theory in MQL5 (Part 13): Calendar Events with Database Schemas
This article, that follows Category Theory implementation of Orders in MQL5, considers how database schemas can be incorporated for classification in MQL5. We take an introductory look at how database schema concepts could be married with category theory when identifying trade relevant text(string) information. Calendar events are the focus.


Developing a Replay System (Part 74): New Chart Trade (I)
In this article, we will modify the last code shown in this series about Chart Trade. These changes are necessary to adapt the code to the current replay/simulation system model. The content presented here is intended solely for educational purposes. Under no circumstances should the application be viewed for any purpose other than to learn and master the concepts presented.


MQL5 Wizard Techniques you should know (Part 37): Gaussian Process Regression with Linear and Matérn Kernels
Linear Kernels are the simplest matrix of its kind used in machine learning for linear regression and support vector machines. The Matérn kernel on the other hand is a more versatile version of the Radial Basis Function we looked at in an earlier article, and it is adept at mapping functions that are not as smooth as the RBF would assume. We build a custom signal class that utilizes both kernels in forecasting long and short conditions.


Multi-Threaded Trading Robot with Machine Learning: From Concept to Implementation
The article presents a step-by-step development of a multi-threaded trading robot with machine learning in Python and MetaTrader 5. The system architecture is considered – from data collection and creation of technical indicators to training XGBoost models with portfolio risk management. The implementation of data augmentation, feature clustering via Gaussian Mixture Models, and flow coordination for parallel trading of multiple currency pairs is described in detail.


Turtle Shell Evolution Algorithm (TSEA)
This is a unique optimization algorithm inspired by the evolution of the turtle shell. The TSEA algorithm emulates the gradual formation of keratinized skin areas, which represent optimal solutions to a problem. The best solutions become "harder" and are located closer to the outer surface, while the less successful solutions remain "softer" and are located inside. The algorithm uses clustering of solutions by quality and distance, allowing to preserve less successful options and providing flexibility and adaptability.


Functions for activating neurons during training: The key to fast convergence?
This article presents a study of the interaction of different activation functions with optimization algorithms in the context of neural network training. Particular attention is paid to the comparison of the classical ADAM and its population version when working with a wide range of activation functions, including the oscillating ACON and Snake functions. Using a minimalistic MLP (1-1-1) architecture and a single training example, the influence of activation functions on the optimization is isolated from other factors. The article proposes an approach to manage network weights through the boundaries of activation functions and a weight reflection mechanism, which allows avoiding problems with saturation and stagnation in training.


MQL5 Trading Tools (Part 11): Correlation Matrix Dashboard (Pearson, Spearman, Kendall) with Heatmap and Standard Modes
In this article, we build a correlation matrix dashboard in MQL5 to compute asset relationships using Pearson, Spearman, and Kendall methods over a set timeframe and bars. The system offers standard mode with color thresholds and p-value stars, plus heatmap mode with gradient visuals for correlation strengths. It includes an interactive UI with timeframe selectors, mode toggles, and a dynamic legend for efficient analysis of symbol interdependencies.


Category Theory in MQL5 (Part 18): Naturality Square
This article continues our series into category theory by introducing natural transformations, a key pillar within the subject. We look at the seemingly complex definition, then delve into examples and applications with this series’ ‘bread and butter’; volatility forecasting.

Tracking Account Dynamics: Balance, Equity, and Floating P/L Visualization in MQL5
Create a custom MT5 indicator that processes the entire deal history and plots starting balance, balance, equity, and floating P/L as continuous curves. It updates per bar, aggregates positions across symbols, and avoids external dependencies through local caching. Use it to inspect equity–balance divergence, realized vs. unrealized results, and the timing of risk deployment.


Category Theory in MQL5 (Part 7): Multi, Relative and Indexed Domains
Category Theory is a diverse and expanding branch of Mathematics which is only recently getting some coverage in the MQL5 community. These series of articles look to explore and examine some of its concepts & axioms with the overall goal of establishing an open library that provides insight while also hopefully furthering the use of this remarkable field in Traders' strategy development.


Stress Testing Trade Sequences with Monte Carlo in MQL5
A backtest shows only one path among many possible outcomes. This MQL5 script performs 1000 bootstrap Monte Carlo resamples of a trade P&L series, draws a percentile fan chart on the chart via CCanvas, and reports probability of ruin, value at risk, and 95th‑percentile worst drawdown. The result is a practical view of path risk and drawdown exposure beyond a single equity curve.


Artificial Atom Algorithm (A3)
The article describes implementation of the A3 algorithm - a metaheuristic optimization method inspired by chemical processes - in MQL5. Only two adjustable parameters, compactness and a small population, ensure high operating speed with sufficient quality of solutions.


Market Reactions and Trading Strategies in Response to Dividend Announcements: Evaluating the Efficient Market Hypothesis in Stock Trading
In this article, we will analyse the impact of dividend announcements on stock market returns and see how investors can earn more returns than those offered by the market when they expect a company to announce dividends. In doing so, we will also check the validity of the Efficient Market Hypothesis in the context of the Indian Stock Market.


Across Neighbourhood Search (ANS)
The article reveals the potential of the ANS algorithm as an important step in the development of flexible and intelligent optimization methods that can take into account the specifics of the problem and the dynamics of the environment in the search space.


Data Science and Machine Learning (Part 20): Algorithmic Trading Insights, A Faceoff Between LDA and PCA in MQL5
Uncover the secrets behind these powerful dimensionality reduction techniques as we dissect their applications within the MQL5 trading environment. Delve into the nuances of Linear Discriminant Analysis (LDA) and Principal Component Analysis (PCA), gaining a profound understanding of their impact on strategy development and market analysis.


Python-MetaTrader 5 Strategy Tester (Part 05): Multi-Symbols and Timeframes Strategy Tester
This article presents a MetaTrader 5–compatible backtesting workflow that scales across symbols and timeframes. We use HistoryManager to parallelize data collection, synchronize bars and ticks from all timeframes, and run symbol‑isolated OnTick handlers in threads. You will learn how modelling modes affect speed/accuracy, when to rely on terminal data, how to reduce I/O with event‑driven updates, and how to assemble a complete multicurrency trading robot.


Developing a Replay System (Part 32): Order System (I)
Of all the things that we have developed so far, this system, as you will probably notice and eventually agree, is the most complex. Now we need to do something very simple: make our system simulate the operation of a trading server. This need to accurately implement the way the trading server operates seems like a no-brainer. At least in words. But we need to do this so that the everything is seamless and transparent for the user of the replay/simulation system.


Artificial Electric Field Algorithm (AEFA)
The article presents an artificial electric field algorithm (AEFA) inspired by Coulomb's law of electrostatic force. The algorithm simulates electrical phenomena to solve complex optimization problems using charged particles and their interactions. AEFA exhibits unique properties in the context of other algorithms related to laws of nature.


MQL5 Wizard Techniques you should know (Part 26): Moving Averages and the Hurst Exponent
The Hurst Exponent is a measure of how much a time series auto-correlates over the long term. It is understood to be capturing the long-term properties of a time series and therefore carries some weight in time series analysis even outside of economic/ financial time series. We however, focus on its potential benefit to traders by examining how this metric could be paired with moving averages to build a potentially robust signal.


Developing a Replay System (Part 48): Understanding the concept of a service
How about learning something new? In this article, you will learn how to convert scripts into services and why it is useful to do so.

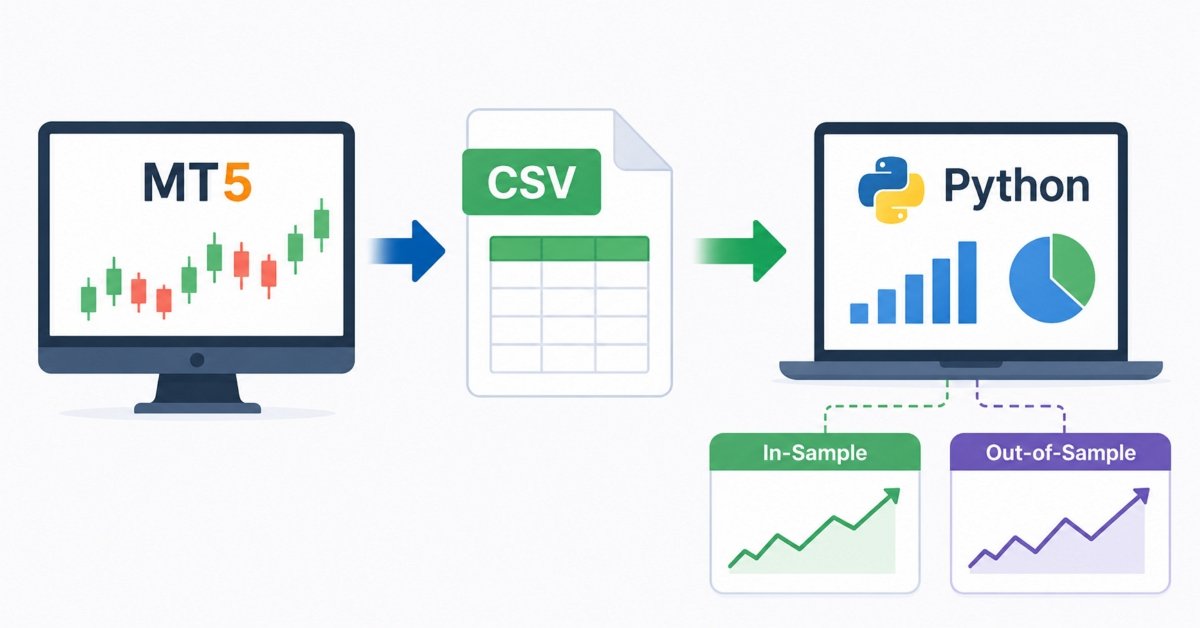
CSV Data Analysis (Part 4): Building an Automated Python-Driven Comparative Analysis Module for MQL5 Strategy Validation
The article presents a reproducible MetaTrader 5 to Python pipeline for large-scale indicator research. An MQL5 export schema captures fixed columns, including custom lag and whipsaw counters. A baseline module performs parameter-matched comparisons across symbols and timeframes, while a walk-forward module locks the InSample optimum and evaluates it on unseen data. Readers gain unbiased robustness measurements and automation that removes manual selection bias.


MQL5 Wizard Techniques you should know (Part 16): Principal Component Analysis with Eigen Vectors
Principal Component Analysis, a dimensionality reducing technique in data analysis, is looked at in this article, with how it could be implemented with Eigen values and vectors. As always, we aim to develop a prototype expert-signal-class usable in the MQL5 wizard.


Sigma Score Indicator for MetaTrader 5: A Simple Statistical Anomaly Detector
Build a practical MetaTrader 5 “Sigma Score” indicator from scratch and learn what it really measures: The z-score of log returns (how many standard deviations the latest move is from the recent average). The article walks through every code block in OnInit(), OnCalculate(), and OnDeinit(), then shows how to interpret thresholds (e.g., ±2) and apply the Sigma Score as a simple “market stress meter” for mean-reversion and momentum trading.


Developing a multi-currency Expert Advisor (Part 8): Load testing and handling a new bar
As we progressed, we used more and more simultaneously running instances of trading strategies in one EA. Let's try to figure out how many instances we can get to before we hit resource limitations.


Quantitative approach to risk management: Applying VaR model to optimize multi-currency portfolio using Python and MetaTrader 5
This article explores the potential of the Value at Risk (VaR) model for multi-currency portfolio optimization. Using the power of Python and the functionality of MetaTrader 5, we demonstrate how to implement VaR analysis for efficient capital allocation and position management. From theoretical foundations to practical implementation, the article covers all aspects of applying one of the most robust risk calculation systems – VaR – in algorithmic trading.


Building a Trading System (Part 5): Managing Gains Through Structured Trade Exits
For many traders, it's a familiar pain point: watching a trade come within a whisker of your profit target, only to reverse and hit your stop-loss. Or worse, seeing a trailing stop close you out at breakeven before the market surges toward your original target. This article focuses on using multiple entries at different Reward-to-Risk Ratios to systematically secure gains and reduce overall risk exposure.


Market Simulation (Part 20): First steps with SQL (III)
Although we can perform operations on a database containing about 10 records, the material is absorbed much better when we work with a file that contains more than 15 thousand records. That is, if we tried to create such a database manually, this task would be enormous. However, it is difficult to find such a database, even for educational purposes, that is available for download. But in reality, we don’t need to resort to that — we can use MetaTrader 5 to create a database for ourselves. In today's article, we will look at how to do this.


Forex arbitrage trading: Analyzing synthetic currencies movements and their mean reversion
In this article, we will examine the movements of synthetic currencies using Python and MQL5 and explore how feasible Forex arbitrage is today. We will also consider ready-made Python code for analyzing synthetic currencies and share more details on what synthetic currencies are in Forex.


Developing a Replay System — Market simulation (Part 09): Custom events
Here we'll see how custom events are triggered and how the indicator reports the state of the replay/simulation service.


Developing a Replay System (Part 26): Expert Advisor project — C_Terminal class
We can now start creating an Expert Advisor for use in the replay/simulation system. However, we need something improved, not a random solution. Despite this, we should not be intimidated by the initial complexity. It's important to start somewhere, otherwise we end up ruminating about the difficulty of a task without even trying to overcome it. That's what programming is all about: overcoming obstacles through learning, testing, and extensive research.


Fibonacci in Forex (Part I): Examining the Price-Time Relationship
How does the market observe Fibonacci-based relationships? This sequence, where each subsequent number is equal to the sum of the two previous ones (1, 1, 2, 3, 5, 8, 13, 21...), not only describes the growth of the rabbit population. We will consider the Pythagorean hypothesis that everything in the world is subject to certain relationships of numbers...

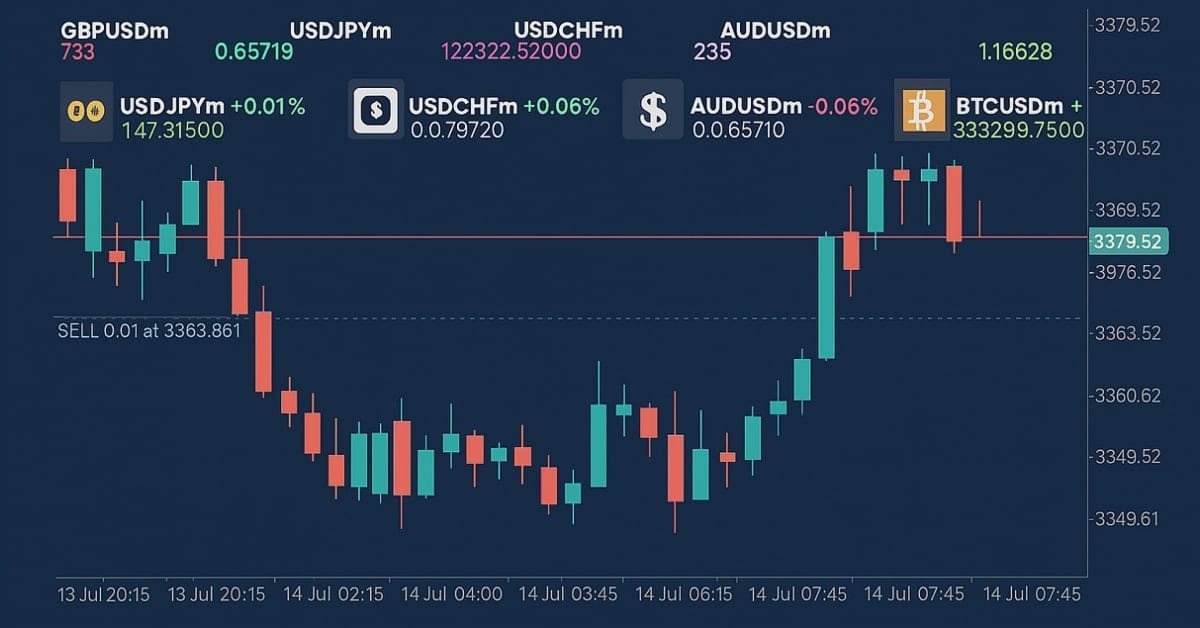
MQL5 Trading Tools (Part 5): Creating a Rolling Ticker Tape for Real-Time Symbol Monitoring
In this article, we develop a rolling ticker tape in MQL5 for real-time monitoring of multiple symbols, displaying bid prices, spreads, and daily percentage changes with scrolling effects. We implement customizable fonts, colors, and scroll speeds to highlight price movements and trends effectively.


Population ADAM (Adaptive Moment Estimation)
The article presents the transformation of the well-known and popular ADAM gradient optimization method into a population algorithm and its modification with the introduction of hybrid individuals. The new approach allows creating agents that combine elements of successful decisions using probability distribution. The key innovation is the formation of hybrid population individuals that adaptively accumulate information from the most promising solutions, increasing the efficiency of search in complex multidimensional spaces.


Markov Chain-Based Matrix Forecasting Model
We are going to create a matrix forecasting model based on a Markov chain. What are Markov chains, and how can we use a Markov chain for Forex trading?


How to Detect and Normalize Chart Objects in MQL5 (Part 1): Building a Chart Object Detection Engine
This article addresses the interpretative gap between visual chart objects and algorithmic execution. You will build a systematic detector that iterates over all chart objects, identifies analytical types, and normalises their geometric data (time and price coordinates) into a structured SChartObjectInfo array. The implementation uses raw MQL5 functions, a filter‑extract‑store pipeline, and a timer‑driven test EA, resulting in a reusable framework for rule‑based trading inputs.


Atomic Orbital Search (AOS) algorithm
The article considers the Atomic Orbital Search (AOS) algorithm, which uses the concepts of the atomic orbital model to simulate the search for solutions. The algorithm is based on probability distributions and the dynamics of interactions in the atom. The article discusses in detail the mathematical aspects of AOS, including updating the positions of candidate solutions and the mechanisms of energy absorption and release. AOS opens new horizons for applying quantum principles to computing problems by offering an innovative approach to optimization.


How to Research a Trading Idea: A Range Breakout Strategy Case Study
This article demonstrates a practical approach to researching trading ideas using a range breakout strategy as an example. We will go through the entire process, from formalizing trading rules and building a baseline model to parameter optimization, forward testing, and evaluating the robustness of the results. The main goal of the article is to develop an understanding of how statistics and testing can be used to identify, validate, and evaluate trading hypotheses.


From Novice to Expert: Animated News Headline Using MQL5 (III) — Indicator Insights
In this article, we’ll advance the News Headline EA by introducing a dedicated indicator insights lane—a compact, on-chart display of key technical signals generated from popular indicators such as RSI, MACD, Stochastic, and CCI. This approach eliminates the need for multiple indicator subwindows on the MetaTrader 5 terminal, keeping your workspace clean and efficient. By leveraging the MQL5 API to access indicator data in the background, we can process and visualize market insights in real-time using custom logic. Join us as we explore how to manipulate indicator data in MQL5 to create an intelligent and space-saving scrolling insights system, all within a single horizontal lane on your trading chart.