Articles on data analysis and statistics in MQL5
Articles on mathematical models and laws of probability are interesting for many traders. Mathematics is the basis of technical indicators, and statistics is required to analyze trading results and develop strategies.
Read about the fuzzy logic, digital filters, market profile, Kohonen maps, neural gas and many other tools that can be used for trading.
Add a new article

You are missing trading opportunities:
- Free trading apps
- Over 8,000 signals for copying
- Economic news for exploring financial markets
Registration
Log in
You agree to website policy and terms of use
If you do not have an account, please register
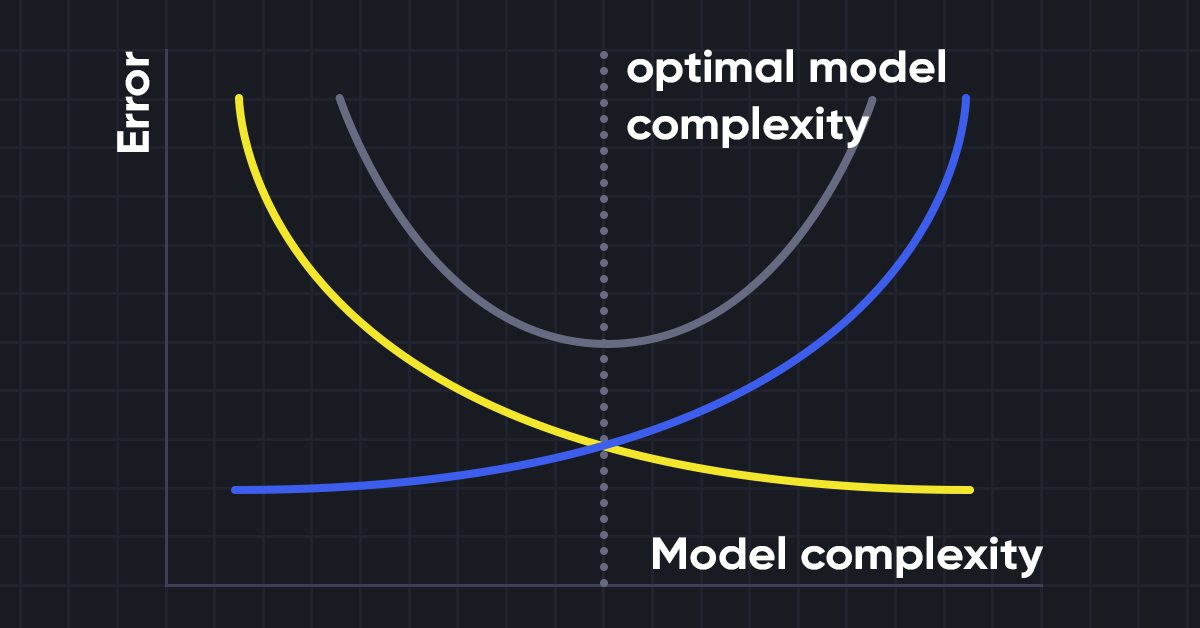
Data Science and Machine Learning (Part 10): Ridge Regression
Ridge regression is a simple technique to reduce model complexity and prevent over-fitting which may result from simple linear regression

Population optimization algorithms: Ant Colony Optimization (ACO)
This time I will analyze the Ant Colony optimization algorithm. The algorithm is very interesting and complex. In the article, I make an attempt to create a new type of ACO.

Developing a Replay System — Market simulation (Part 03): Adjusting the settings (I)
Let's start by clarifying the current situation, because we didn't start in the best way. If we don't do it now, we'll be in trouble soon.
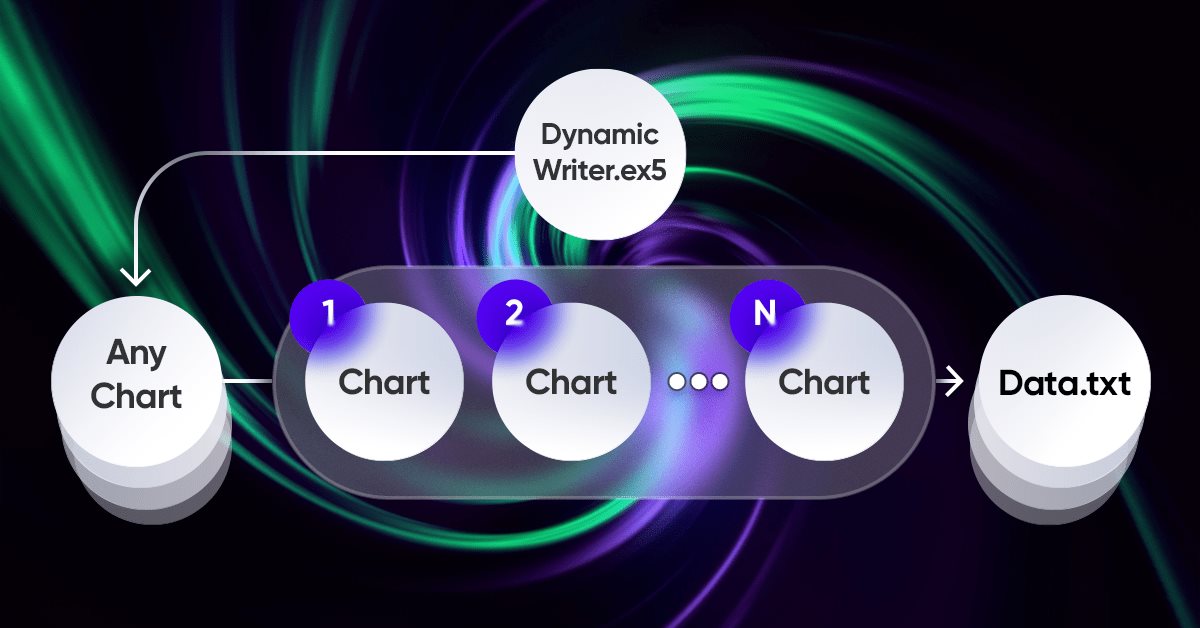
Brute force approach to patterns search (Part VI): Cyclic optimization
In this article I will show the first part of the improvements that allowed me not only to close the entire automation chain for MetaTrader 4 and 5 trading, but also to do something much more interesting. From now on, this solution allows me to fully automate both creating EAs and optimization, as well as to minimize labor costs for finding effective trading configurations.

Data Science and Machine Learning (Part 05): Decision Trees
Decision trees imitate the way humans think to classify data. Let's see how to build trees and use them to classify and predict some data. The main goal of the decision trees algorithm is to separate the data with impurity and into pure or close to nodes.


The Role of Statistical Distributions in Trader's Work
This article is a logical continuation of my article Statistical Probability Distributions in MQL5 which set forth the classes for working with some theoretical statistical distributions. Now that we have a theoretical base, I suggest that we should directly proceed to real data sets and try to make some informational use of this base.

Metamodels in machine learning and trading: Original timing of trading orders
Metamodels in machine learning: Auto creation of trading systems with little or no human intervention — The model decides when and how to trade on its own.

Rebuy algorithm: Multicurrency trading simulation
In this article, we will create a mathematical model for simulating multicurrency pricing and complete the study of the diversification principle as part of the search for mechanisms to increase the trading efficiency, which I started in the previous article with theoretical calculations.

Timeseries in DoEasy library (part 55): Indicator collection class
The article continues developing indicator object classes and their collections. For each indicator object create its description and correct collection class for error-free storage and getting indicator objects from the collection list.

Developing a robot in Python and MQL5 (Part 1): Data preprocessing
Developing a trading robot based on machine learning: A detailed guide. The first article in the series deals with collecting and preparing data and features. The project is implemented using the Python programming language and libraries, as well as the MetaTrader 5 platform.
Other classes in DoEasy library (Part 68): Chart window object class and indicator object classes in the chart window
In this article, I will continue the development of the chart object class. I will add the list of chart window objects featuring the lists of available indicators.

Continuous futures contracts in MetaTrader 5
A short life span of futures contracts complicates their technical analysis. It is difficult to technically analyze short charts. For example, number of bars on the day chart of the UX-9.13 Ukrainian Stock index future is more than 100. Therefore, trader creates synthetic long futures contracts. This article explains how to splice futures contracts with different dates in the MetaTrader 5 terminal.

Building a Trading System (Part 1): A Quantitative Approach
Many traders evaluate strategies based on short-term performance, often abandoning profitable systems too early. Long-term profitability, however, depends on positive expectancy through optimized win rate and risk-reward ratio, along with disciplined position sizing. These principles can be validated using Monte Carlo simulation in Python with back-tested metrics to assess whether a strategy is robust or likely to fail over time.


The price movement model and its main provisions (Part 2): Probabilistic price field evolution equation and the occurrence of the observed random walk
The article considers the probabilistic price field evolution equation and the upcoming price spike criterion. It also reveals the essence of price values on charts and the mechanism for the occurrence of a random walk of these values.
Other classes in DoEasy library (Part 71): Chart object collection events
In this article, I will create the functionality for tracking some chart object events — adding/removing symbol charts and chart subwindows, as well as adding/removing/changing indicators in chart windows.

Price Action Analysis Toolkit Development (Part 13): RSI Sentinel Tool
Price action can be effectively analyzed by identifying divergences, with technical indicators such as the RSI providing crucial confirmation signals. In the article below, we explain how automated RSI divergence analysis can identify trend continuations and reversals, thereby offering valuable insights into market sentiment.

Reimagining Classic Strategies (Part 18): Searching For Candlestick Patterns
This article helps new community members search for and discover their own candlestick patterns. Describing these patterns can be daunting, as it requires manually searching and creatively identifying improvements. Here, we introduce the engulfing candlestick pattern and show how it can be enhanced for more profitable trading applications.
Forecasting with ARIMA models in MQL5
In this article we continue the development of the CArima class for building ARIMA models by adding intuitive methods that enable forecasting.

Developing a trading Expert Advisor from scratch (Part 16): Accessing data on the web (II)
Knowing how to input data from the Web into an Expert Advisor is not so obvious. It is not so easy to do without understanding all the possibilities offered by MetaTrader 5.

Data Science and Machine Learning (Part 23): Why LightGBM and XGBoost outperform a lot of AI models?
These advanced gradient-boosted decision tree techniques offer superior performance and flexibility, making them ideal for financial modeling and algorithmic trading. Learn how to leverage these tools to optimize your trading strategies, improve predictive accuracy, and gain a competitive edge in the financial markets.
Other classes in DoEasy library (Part 69): Chart object collection class
With this article, I start the development of the chart object collection class. The class will store the collection list of chart objects with their subwindows and indicators providing the ability to work with any selected charts and their subwindows or with a list of several charts at once.

Developing a trading Expert Advisor from scratch (Part 15): Accessing data on the web (I)
How to access online data via MetaTrader 5? There are a lot of websites and places on the web, featuring a huge amount information. What you need to know is where to look and how best to use this information.

Timeseries in DoEasy library (part 49): Multi-period multi-symbol multi-buffer standard indicators
In the current article, I will improve the library classes to implement the ability to develop multi-symbol multi-period standard indicators requiring several indicator buffers to display their data.

MetaTrader 5 Machine Learning Blueprint (Part 1): Data Leakage and Timestamp Fixes
Before we can even begin to make use of ML in our trading on MetaTrader 5, it’s crucial to address one of the most overlooked pitfalls—data leakage. This article unpacks how data leakage, particularly the MetaTrader 5 timestamp trap, can distort our model's performance and lead to unreliable trading signals. By diving into the mechanics of this issue and presenting strategies to prevent it, we pave the way for building robust machine learning models that deliver trustworthy predictions in live trading environments.

Mountain or Iceberg charts
How do you like the idea of adding a new chart type to the MetaTrader 5 platform? Some people say it lacks a few things that other platforms offer. But the truth is, MetaTrader 5 is a very practical platform as it allows you to do things that can't be done (or at least can't be done easily) in many other platforms.

The price movement model and its main provisions. (Part 3): Calculating optimal parameters of stock exchange speculations
Within the framework of the engineering approach developed by the author based on the probability theory, the conditions for opening a profitable position are found and the optimal (profit-maximizing) take profit and stop loss values are calculated.
Prices in DoEasy library (part 61): Collection of symbol tick series
Since a program may use different symbols in its work, a separate list should be created for each of them. In this article, I will combine such lists into a tick data collection. In fact, this will be a regular list based on the class of dynamic array of pointers to instances of CObject class and its descendants of the Standard library.

From Novice to Expert: Time Filtered Trading
Just because ticks are constantly flowing in doesn’t mean every moment is an opportunity to trade. Today, we take an in-depth study into the art of timing—focusing on developing a time isolation algorithm to help traders identify and trade within their most favorable market windows. Cultivating this discipline allows retail traders to synchronize more closely with institutional timing, where precision and patience often define success. Join this discussion as we explore the science of timing and selective trading through the analytical capabilities of MQL5.

Forex arbitrage trading: A simple synthetic market maker bot to get started
Today we will take a look at my first arbitrage robot — a liquidity provider (if you can call it that) for synthetic assets. Currently, this bot is successfully operating as a module in a large machine learning system, but I pulled up an old Forex arbitrage robot from the cloud, so let's take a look at it and think about what we can do with it today.

Developing Trend Trading Strategies Using Machine Learning
This study introduces a novel methodology for the development of trend-following trading strategies. This section describes the process of annotating training data and using it to train classifiers. This process yields fully operational trading systems designed to run on MetaTrader 5.

Price Action Analysis Toolkit Development (Part 46): Designing an Interactive Fibonacci Retracement EA with Smart Visualization in MQL5
Fibonacci tools are among the most popular instruments used by technical analysts. In this article, we’ll build an Interactive Fibonacci EA that draws retracement and extension levels that react dynamically to price movement, delivering real‑time alerts, stylish lines, and a scrolling news‑style headline. Another key advantage of this EA is flexibility; you can manually type the high (A) and low (B) swing values directly on the chart, giving you exact control over the market range you want to analyze.
Timeseries in DoEasy library (part 44): Collection class of indicator buffer objects
The article deals with creating a collection class of indicator buffer objects. I am going to test the ability to create and work with any number of buffers for indicators (the maximum number of buffers that can be created in MQL indicators is 512).

Price Action Analysis Toolkit Development (Part 17): TrendLoom EA Tool
As a price action observer and trader, I've noticed that when a trend is confirmed by multiple timeframes, it usually continues in that direction. What may vary is how long the trend lasts, and this depends on the type of trader you are, whether you hold positions for the long term or engage in scalping. The timeframes you choose for confirmation play a crucial role. Check out this article for a quick, automated system that helps you analyze the overall trend across different timeframes with just a button click or regular updates.

Data Science and Machine Learning (Part 24): Forex Time series Forecasting Using Regular AI Models
In the forex markets It is very challenging to predict the future trend without having an idea of the past. Very few machine learning models are capable of making the future predictions by considering past values. In this article, we are going to discuss how we can use classical(Non-time series) Artificial Intelligence models to beat the market
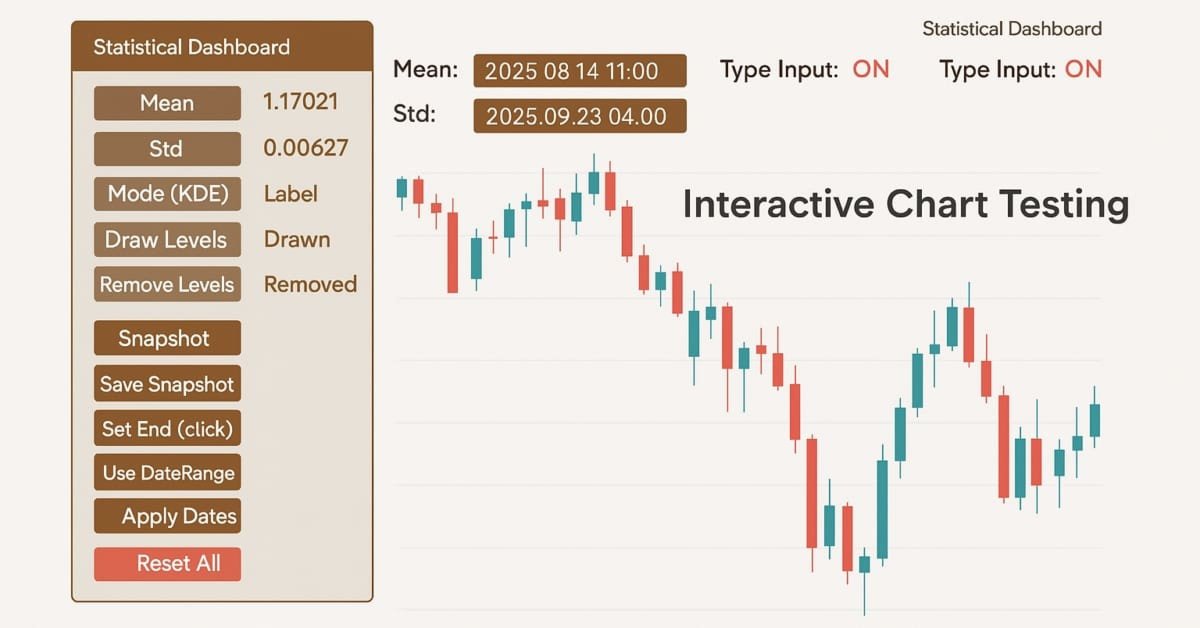
Price Action Analysis Toolkit Development (Part 42): Interactive Chart Testing with Button Logic and Statistical Levels
In a world where speed and precision matter, analysis tools need to be as smart as the markets we trade. This article presents an EA built on button logic—an interactive system that instantly transforms raw price data into meaningful statistical levels. With a single click, it calculates and displays mean, deviation, percentiles, and more, turning advanced analytics into clear on-chart signals. It highlights the zones where price is most likely to bounce, retrace, or break, making analysis both faster and more practical.

High frequency arbitrage trading system in Python using MetaTrader 5
In this article, we will create an arbitration system that remains legal in the eyes of brokers, creates thousands of synthetic prices on the Forex market, analyzes them, and successfully trades for profit.

Pair Trading: Algorithmic Trading with Auto Optimization Based on Z-Score Differences
In this article, we will explore what pair trading is and how correlation trading works. We will also create an EA for automating pair trading and add the ability to automatically optimize this trading algorithm based on historical data. In addition, as part of the project, we will learn how to calculate the differences between two pairs using the z-score.

Neural networks made easy (Part 19): Association rules using MQL5
We continue considering association rules. In the previous article, we have discussed theoretical aspect of this type of problem. In this article, I will show the implementation of the FP Growth method using MQL5. We will also test the implemented solution using real data.

Population optimization algorithms: Bacterial Foraging Optimization (BFO)
E. coli bacterium foraging strategy inspired scientists to create the BFO optimization algorithm. The algorithm contains original ideas and promising approaches to optimization and is worthy of further study.