
Visual evaluation of optimization results

Introduction
A custom optimization criterion provides a very convenient setup for optimizing Expert Advisors. But if we need to check multiple criteria, we should run multiple optimizations, which can be time-intensive. A better solution would be to be able to test multiple custom criteria during one optimization. Furthermore, it would be nice to instantly view balance and equity graphs.
It is always good to have different visualization options. Our brain receives more than eighty percent of information through the eyes. So, in this article we will consider the creation of optimization graphs and the ways of selecting the optimal custom criterion.
We will also see how to create a desired solution with little MQL5 knowledge, using the articles published on the website and forum comments.
Formulating the task
- Collect data of each optimization pass.
- Build balance/equity graphs for each optimization pass.
- Calculate several custom optimization criteria.
- Sort graphs by the custom optimization criterion in the ascending order.
- Show the best results for all custom criteria.
Problem solution steps
Since we anyway have to modify the Expert Advisor code, let's try to minimize these changes.
- Therefore, the whole data collecting code will be implemented in a separate include file SkrShotOpt.mqh, while the custom criterion will be calculated in the CustomCriterion.mqh file.
- The ScreenShotOptimization.mq5 screenshot will plot graphs and save screenshots.
Thus, we will need to add only a few code lines into the Expert Advisor.
1. Collecting data. SkrShotOpt.mqh
The maximum and minimum equity values will be written in the OnTick() function.
   double _Equity = AccountInfoDouble(ACCOUNT_EQUITY);
   if(tempEquityMax < _Equity)
      tempEquityMax = _Equity;
   if(tempEquityMin > _Equity)
      tempEquityMin = _Equity;
To avoid the need to check position changes at every tick, position changes will be tracked in the OnTradeTransaction() function
void IsOnTradeTransaction(const MqlTradeTransaction & trans,
                          const MqlTradeRequest & request,
                          const MqlTradeResult & result)
  {
   if(trans.type == TRADE_TRANSACTION_DEAL_ADD)
      if(HistoryDealSelect(trans.deal))
        {
         if(_deal_entry != DEAL_ENTRY_OUT && _deal_entry != DEAL_ENTRY_OUT_BY)
            _deal_entry = HistoryDealGetInteger(trans.deal, DEAL_ENTRY);
         if(trans.deal_type == DEAL_TYPE_BUY || trans.deal_type == DEAL_TYPE_SELL)
            if(_deal_entry == DEAL_ENTRY_IN || _deal_entry == DEAL_ENTRY_OUT || _deal_entry == DEAL_ENTRY_INOUT || _deal_entry == DEAL_ENTRY_OUT_BY)
               allowed = true;
        }
  }
When the number of open deals changes, fill the balance and equity arrays.
   if(allowed) // if there was a trade
     {
      double accBalance = AccountInfoDouble(ACCOUNT_BALANCE);
      double accEquity = AccountInfoDouble(ACCOUNT_EQUITY);

      ArrayResize(balance, _size + 1);
      ArrayResize(equity, _size + 1);
      balance[_size] = accBalance;

      if(_deal_entry != DEAL_ENTRY_OUT && _deal_entry != DEAL_ENTRY_OUT_BY) // if a new position appeared
         equity[_size] = accEquity;
      else // if position closed
        {
         if(changesB < accBalance)
            equity[_size] = tempEquityMin;
         else
            switch(s_view)
              {
               case  min_max_E:
                  equity[_size] = tempEquityMax;
                  break;
               default:
                  equity[_size] = tempEquityMin;
                  break;
              }
         tempEquityMax = accEquity;
         tempEquityMin = accEquity;
        }

      _size = _size + 1;
      changesPos = PositionsTotal();
      changesB = accBalance;
      _deal_entry = -1;
      allowed = false;
     }
The size of the file with frames is limited. If there are a lot of trades, the file size grows and it becomes hard to process. Therefore, only the most necessary information should be written to it.
When a trade opens, write the balance and equity values:
- upon closure, write the maximum equity value, if the deal has closed with a loss
- write the minimum equity value if the deal has closed with a profit.
Thus, almost any deal has four values written in arrays: balance and equity at opening, balance and max/min equity at closing.
It may happen that one position closes and another one opens at the same tick. In this case only one position will be written. This does not affect the visualization of graphs while considerably reducing the arrays.
Saving collected data to a file
It only makes sense to collect profitable optimization passes. This parameter is implemented in settings, and thus if you need you can additionally register loss-making passes. As for the forward passes, they are all recorded.
Using the FrameAdd() function, the collected data will be written to a file at the end of each single pass, upon the Tester event. In turn, the Tester event is handled by the OnTester() function.
bool  FrameAdd(
   const string  name,        // public name/tag
   long          id,          // public id
   double        value,       // value
   const void&   data[]       // array of any type
   );
A detailed and clear example of how to work with the FrameAdd() function is provided here: https://www.mql5.com/ru/forum/11277/page4#comment_469771
Since FrameAdd() can write only one array and one numeric value 'value', but in addition to balance and equity it's good to pass all the values of the ENUM_STATISTICS enumeration, the data will be written into one array sequentially, while the array size will be written to the passed 'value' numeric value.
   if(id == 1)  // if it is a backward pass
     {
      // if profit % and the number of trades exceed those specified in the settings, the pass is written into the file
      if(TesterStatistics(STAT_PROFIT) / TesterStatistics(STAT_INITIAL_DEPOSIT) * 100 > _profit && TesterStatistics(STAT_TRADES) >= trades)
        {
         double TeSt[42]; // total number of elements in the ENUM_STATISTICS enumeration is 41
         IsRecordStat(TeSt); // writing testing statistics to the array
         IsCorrect(); // adjusting balance and equity arrays

         if(m_sort != none)
           {
            while((sort)size_sort != none)
               size_sort++;
            double LRB[], LRE[], coeff[];
            Coeff = Criterion(balance, equity, LRB, LRE, TeSt, coeff, 3);// calculating custom criterion
            ArrayInsert(balance, equity, _size + 1, 0);     // joining balance and equity arrays into one
            ArrayInsert(balance, TeSt, (_size + 1) * 2, 0); // add to the resulting array the array with the ENUM_STATISTICS data
            FrameAdd(name, id, _size + 1, balance);         // write the frame into the file
           }
         else
           {
            ArrayInsert(balance, equity, _size + 1, 0);     // joining balance and equity arrays into one
            ArrayInsert(balance, TeSt, (_size + 1) * 2, 0); // add to the resulting array the array with the ENUM_STATISTICS data
            FrameAdd(name, id, _size + 1, balance);         // write the frame into the file
           }
        }
     }
Forward passes are handled similarly to backward passes, but actually they are the consequence of the optimization. That is why only balance and equity values will be written for them, without ENUM_STATISTICS values.
If there is an open position by the testing end time, the tester will close it.
It means that we virtually close a deal (write the current balance and equity) if the variable that stores the number of open trades is not equal by the time of testing end.
void IsCorrect()
  {
   if(changesPos > 0) // if there is an open position by the testing end time, it should be virtually closed as the tester will close such a position
     {
      _size++;
      ArrayResize(balance, _size + 1);
      ArrayResize(equity, _size + 1);
      if(balance[_size - 2] > AccountInfoDouble(ACCOUNT_BALANCE))
        {
         balance[_size - 1] = AccountInfoDouble(ACCOUNT_BALANCE);
         switch(s_view)
           {
            case  min_max_E:
               equity[_size - 1] = tempEquityMax;
               break;
            default:
               equity[_size - 1] = tempEquityMin;
               break;
           }
        }
      else
        {
         balance[_size - 1] = AccountInfoDouble(ACCOUNT_BALANCE);
         equity[_size - 1] = tempEquityMin;
        }
      balance[_size] = AccountInfoDouble(ACCOUNT_BALANCE);
      equity[_size] = AccountInfoDouble(ACCOUNT_EQUITY);
     }
   else
     {
      ArrayResize(balance, _size + 1);
      ArrayResize(equity, _size + 1);
      balance[_size] = AccountInfoDouble(ACCOUNT_BALANCE);
      equity[_size] = AccountInfoDouble(ACCOUNT_EQUITY);
     }
  }
Data writing completes here.
Reading data from the file. ScreenShotOptimization.mq5
After optimization, a file with frames is created at the following path: C:\Users\user name\AppData\Roaming\MetaQuotes\Terminal\terminal ID\MQL5\Files\Tester. The file is named as EA_name.symbol.timeframe.mqd. The file cannot be accessed immediately after optimization. But if you restart the terminal, the file can be accessed using regular file functions.
Find the file at C:\Users\user name\AppData\Roaming\MetaQuotes\Terminal\terminal ID\MQL5\Files\Tester.
   int count = 0;
   long search_handle = FileFindFirst("Tester\\*.mqd", FileName);
   do
     {
      if(FileName != "")
         count++;
      FileName = "Tester\\" + FileName;
     }
   while(FileFindNext(search_handle, FileName));
   FileFindClose(search_handle);
The data is first read into the structure.
FRAME Frame = {0};
FileReadStruct(handle, Frame);
struct FRAME
  {
   ulong             Pass;
   long              ID;
   short             String[64];
   double            Value;
   int               SizeOfArray;
   long              Tmp[2];

   void              GetArrayB(int handle, Data & m_FB)
     {
      ArrayFree(m_FB.Balance);
      FileReadArray(handle, m_FB.Balance, 0, (int)Value);
      ArrayFree(m_FB.Equity);
      FileReadArray(handle, m_FB.Equity, 0, (int)Value);
      ArrayFree(m_FB.TeSt);
      FileReadArray(handle, m_FB.TeSt, 0, (SizeOfArray / sizeof(m_FB.TeSt[0]) - (int)Value * 2));
     }
   void              GetArrayF(int handle, Data & m_FB, int size)
     {
      FileReadArray(handle, m_FB.Balance, size, (int)Value);
      FileReadArray(handle, m_FB.Equity, size, (int)Value);
     }
  };
In the FRAME structure functions, Data structure functions are filled, from which further charts are constructed.
struct Data
  {
   ulong             Pass;
   long              id;
   int               size;
   double            Balance[];
   double            Equity[];
   double            LRegressB[];
   double            LRegressE[];
   double            coeff[];
   double            TeSt[];
  };
Data                 m_Data[];
Since drawing of thousands of screenshots is very time-intensive, in script settings specify a parameter to disable saving of screenshots if the profit is less than the specified percentage.
The file with the frames is processed in a loop.
In order to draw a graph, we need one data array. Therefore, all backward passes meeting the minimum profit percent criterion are written first.
Then all Backward passes are iterated, and the relevant forward passes are selected for them, according to the pass number. The Forward pass balance array is added to the Backward pass balance array.
The solution can draw two types of graphs. One of them is similar to the graph in the strategy tester, i.e. the Forward pass starts with the starting deposit.
The second variant of the Forward pass starts with the deposit with which the Backward pass ended. In this case, the Backward pass profit value is added to the Forward pass balance and equity and is written to the end of the Backward pass array.
Of course, this is only done if optimization is performed with a Forward period.
   int handle = FileOpen(FileName, FILE_READ | FILE_SHARE_READ | FILE_SHARE_WRITE | FILE_BIN);
   if(handle != INVALID_HANDLE)
     {
      FileSeek(handle, 260, SEEK_SET);

      while(Res && !IsStopped())
        {
         FRAME Frame = {0};
         // read from the file to the Frame structure
         Res = (FileReadStruct(handle, Frame) == sizeof(Frame));
         if(Res)
            if(Frame.ID == 1) // if it is a Backward pass, write data to the m_Data structure
              {
               ArrayResize(m_Data, size + 1);
               m_Data[size].Pass = Frame.Pass;
               m_Data[size].id = Frame.ID;
               m_Data[size].size = (int)Frame.Value;
               Frame.GetArrayB(handle, m_Data[size]);  // write data to the m_Data structure arrays
               // if profit of this pass corresponds to the input settings, immediately calculate optimization criteria
               if(m_Data[size].TeSt[STAT_PROFIT] / m_Data[size].TeSt[STAT_INITIAL_DEPOSIT] * 100 >= profitPersent)
                 {
                  Criterion(m_Data[size].Balance, m_Data[size].Equity, m_Data[size].LRegressB, m_Data[size].LRegressE, m_Data[size].TeSt, m_Data[size].coeff, m_lineR);
                  size++;
                 }
              }
            else  // if it is a Forward pass, write to the end of the m_Data data structures
               if(m_Forward != BackOnly) // if drawing of only Backward passes is not selected in settings
                  for(int i = 0; i < size; i++)
                    {
                     if(Frame.Pass == m_Data[i].Pass) // if Back and Forward pass numbers match
                       {
                        int m = 0;
                        if(m_Forward == Back_Next_Forward) // if selected drawing of Forward graph as a continuation of Backward
                          {
                           Frame.GetArrayF(handle, m_Data[i], m_Data[i].size - 1); // write data at the end of the the m_Data structure array, with a one-trade shift
                           for(int x = m_Data[i].size - 1; x < m_Data[i].size + (int)Frame.Value - 1; x++)
                             {
                              m_Data[i].Balance[x] = m_Data[i].Balance[x] + m_Data[i].TeSt[STAT_PROFIT]; //  add profit of the Backward test to the Forward pass
                              m_Data[i].Equity[x] = m_Data[i].Equity[x] + m_Data[i].TeSt[STAT_PROFIT];
                             }
                           m = 1;
                          }
                        else
                           Frame.GetArrayF(handle, m_Data[i], m_Data[i].size); // if drawing of a Forward pass from a starting balance is selected

                        m_Data[i].coeff[Forward_Trade] = (int)(Frame.Value / 2); // number of forward trades (not exact))
                        m_Data[i].coeff[Profit_Forward] = m_Data[i].Balance[m_Data[i].size + (int)Frame.Value - m - 1] - m_Data[i].Balance[m_Data[i].size - m];
                        break;
                       }
                     if(i == size - 1) // if no Backward is found for this Forward pass, move the file pointer to the end of writing
                        FileSeek(handle, Frame.SizeOfArray, SEEK_CUR); // of this frame as if we read array data from the file
                    }
        }
      FileClose(handle);
      //---
Constructing Graphs
Graph plotting function.
string _GraphPlot(double& y1[],
                  double& y2[],
                  double& LRegressB[],
                  double& LRegressE[],
                  double& coeff[],
                  double& TeSt[],
                  ulong pass)
  {
   CGraphic graphic;
//--- create graphic
   bool res = false;
   if(ObjectFind(0, "Graphic") >= 0)
      res = graphic.Attach(0, "Graphic");
   else
      res = graphic.Create(0, "Graphic", 0, 0, 0, _width, _height);

   if(!res)
      return(NULL);

   graphic.BackgroundMain(FolderName);  // print the Expert Advisor name
   graphic.BackgroundMainSize(FontSet + 1); // font size for the Expert Advisor name

   graphic.IndentLeft(FontSet);
   graphic.HistoryNameSize(FontSet); // font size for the line names
   graphic.HistorySymbolSize(FontSet);

   graphic.XAxis().Name("pass " + IntegerToString(pass)); // show the pass number along the X axis
   graphic.XAxis().NameSize(FontSet + 1);

   graphic.XAxis().ValuesSize(12); // price font size
   graphic.YAxis().ValuesSize(12);

//--- add curves
   CCurve *curve = graphic.CurveAdd(y1, ColorToARGB(clrBlue), CURVE_POINTS_AND_LINES, "Balance"); // plot the balance graph
   curve.LinesWidth(widthL);  // graph line width
   curve.PointsSize(widthL + 1); // size of dots on the balance graph

   CCurve *curve1 = graphic.CurveAdd(y2, ColorToARGB(clrGreen), CURVE_LINES, "Equity");  // plot the equity graph
   curve1.LinesWidth(widthL);

   int size = 0;
   switch(m_lineR) // plot the regression line
     {
      case  lineR_Balance: // balance regression line
        {
         size = ArraySize(LRegressB);
         CCurve *curve2 = graphic.CurveAdd(LRegressB, ColorToARGB(clrBlue), CURVE_LINES, "LineR_Balance");
         curve2.LinesWidth(widthL);
        }
      break;
      case  lineR_Equity: // equity regression line
        {
         size = ArraySize(LRegressE);
         CCurve *curve2 = graphic.CurveAdd(LRegressE, ColorToARGB(clrRed), CURVE_LINES, "LineR_Equity");
         curve2.LinesWidth(widthL);
        }
      break;
      case  lineR_BalanceEquity: // balance and equity regression line
        {
         size = ArraySize(LRegressB);
         CCurve *curve2 = graphic.CurveAdd(LRegressB, ColorToARGB(clrBlue), CURVE_LINES, "LineR_Balance");
         curve2.LinesWidth(widthL);

         CCurve *curve3 = graphic.CurveAdd(LRegressE, ColorToARGB(clrRed), CURVE_LINES, "LineR_Equity");
         curve2.LinesWidth(widthL);
        }
      break;
      default:
         break;
     }
//--- plot curves
   graphic.CurvePlotAll();

// Important!!!  All lines and captions must be created after creating the graph; otherwise, the graph will override them

   if(size == 0)
     {
      size = ArraySize(LRegressE);
      if(size == 0)
         size = ArraySize(LRegressB);
     }

   int x1 = graphic.ScaleX(size - 1); //Scales the value of the number of trades along the X axis
   graphic.LineAdd(x1, 30, x1, _height - 45, ColorToARGB(clrBlue), LINE_END_BUTT); // construct the vertical line denoting the end of the Backward period

   string txt = "";
   int txt_x = 70;// text indent along the X axis
   int txt_y = 30;// text indent along the Y axis

   graphic.FontSet("Arial", FontSet);// Set current font parameters

   for(int i = 0; i < size_sort; i++)  // Write all coefficients and criteria on the chart
     {
      if(coeff[i] == 0)
         continue;
      if(i == 1 || i == 3)
         txt = StringFormat("%s = %d", EnumToString((sort)i), (int)coeff[i]);
      else
         if(i == 0 || i == 2)
            txt = StringFormat("%s = %.2f", EnumToString((sort)i), coeff[i]);
         else
            txt = StringFormat("%s = %.4f", EnumToString((sort)i), coeff[i]);
      graphic.TextAdd(txt_x, txt_y + FontSet * i, txt, ColorToARGB(clrGreen));
     }

   txt_y = txt_y + FontSet * (size_sort - 1);
   txt = StringFormat("Profitability = %.2f", TeSt[STAT_PROFIT_FACTOR]);
   graphic.TextAdd(txt_x, txt_y + FontSet, txt, ColorToARGB(clrGreen));
   txt = StringFormat("Expected  payoff = %.2f", TeSt[STAT_EXPECTED_PAYOFF]);
   graphic.TextAdd(txt_x, txt_y + FontSet * 2, txt, ColorToARGB(clrGreen));

   graphic.Update();
//--- return resource name
   return graphic.ChartObjectName();
  }
You can find out more about how to work with CGraphic from the following articles:
- Implementing a Scalping Market Depth Using the CGraphic Library
- Visualize this! MQL5 graphics library similar to 'plot' of R language
- Visualizing optimization results using a selected criterion
- Processing optimization results using the graphical interface
- Graphical Interfaces XI: Integrating the Standard Graphics Library (build 16)
Chart screenshots are saved to into a separate folder under the Files directory. The folder name is EA_name.symbol.timeframe.
bool BitmapObjectToFile(const string ObjName, const string _FileName, const bool FullImage = true)
  {
   if(ObjName == "")
      return(true);

   const ENUM_OBJECT Type = (ENUM_OBJECT)ObjectGetInteger(0, ObjName, OBJPROP_TYPE);
   bool Res = (Type == OBJ_BITMAP_LABEL) || (Type == OBJ_BITMAP);

   if(Res)
     {
      const string Name = __FUNCTION__ + (string)MathRand();

      ObjectCreate(0, Name, OBJ_CHART, 0, 0, 0);
      ObjectSetInteger(0, Name, OBJPROP_XDISTANCE, -5e3);

      const long chart = ObjectGetInteger(0, Name, OBJPROP_CHART_ID);

      Res = ChartSetInteger(chart, CHART_SHOW, false) && ObjectCreate(chart, Name, OBJ_BITMAP_LABEL, 0, 0, 0) &&
            ObjectSetString(chart, Name, OBJPROP_BMPFILE, ObjectGetString(0, ObjName, OBJPROP_BMPFILE)) &&
            (FullImage || (ObjectSetInteger(chart, Name, OBJPROP_XSIZE, ObjectGetInteger(0, ObjName, OBJPROP_XSIZE)) &&
                           ObjectSetInteger(chart, Name, OBJPROP_YSIZE, ObjectGetInteger(0, ObjName, OBJPROP_YSIZE)) &&
                           ObjectSetInteger(chart, Name, OBJPROP_XOFFSET, ObjectGetInteger(0, ObjName, OBJPROP_XOFFSET)) &&
                           ObjectSetInteger(chart, Name, OBJPROP_YOFFSET, ObjectGetInteger(0, ObjName, OBJPROP_YOFFSET)))) &&
            ChartScreenShot(chart, FolderName + "\\" + _FileName, (int)ObjectGetInteger(chart, Name, OBJPROP_XSIZE), (int)ObjectGetInteger(chart, Name, OBJPROP_YSIZE));
      ObjectDelete(0, Name);
     }

   return(Res);
  }
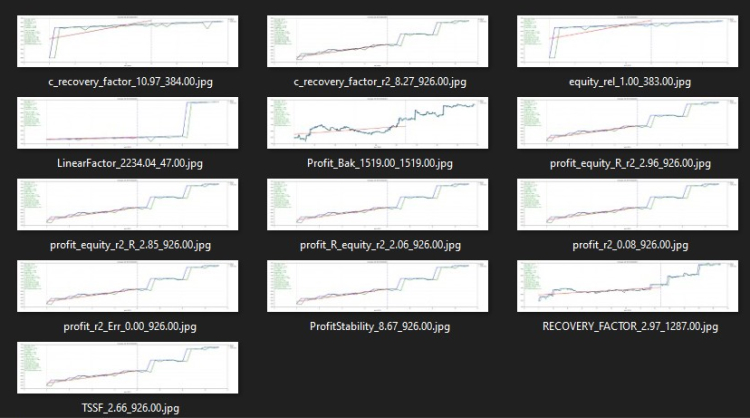
These are the resulting graphs.
The graphs in the folder.
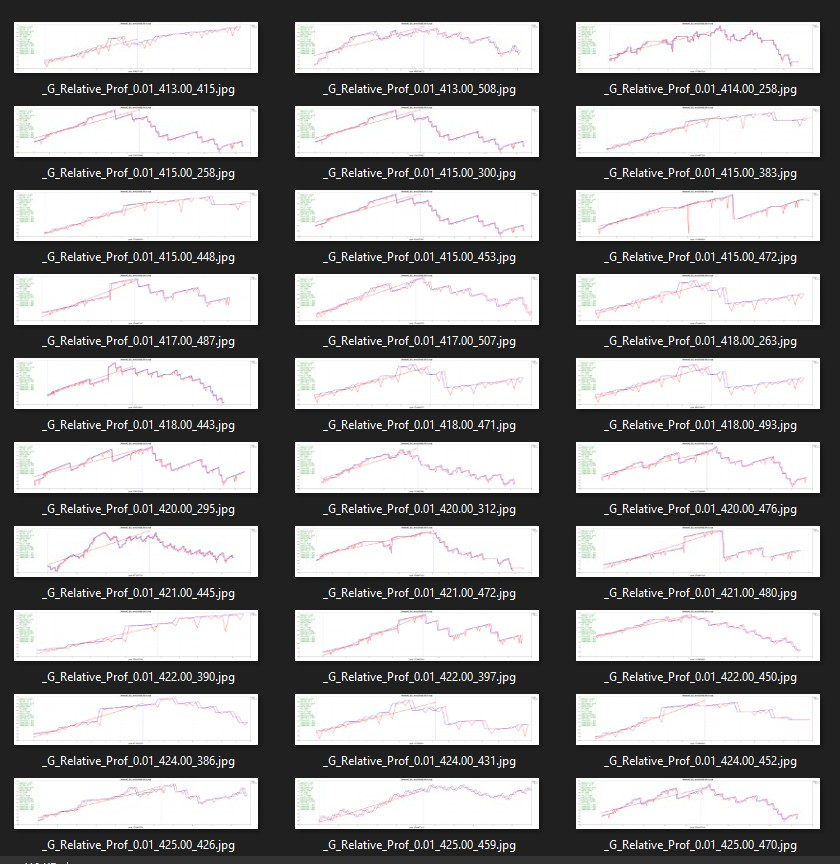
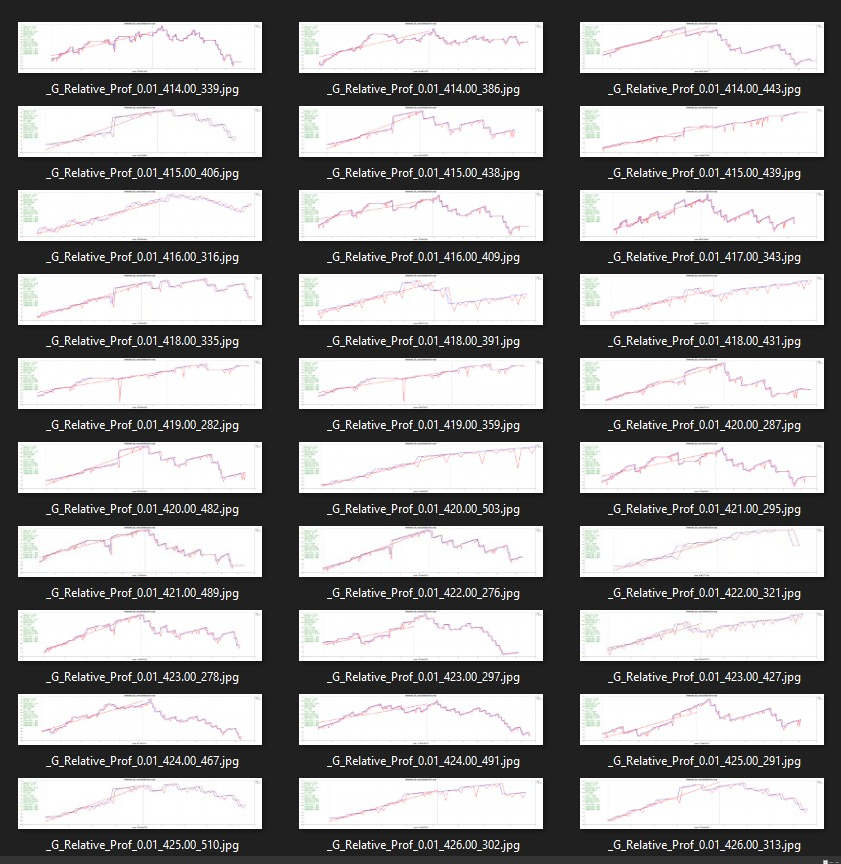
If saving of all screenshots is selected, then the screenshot names consist of the custom criterion, which was selected for sorting + profit + pass number.
If only best passes are selected, the screenshot names consist of the custom criterion + profit.
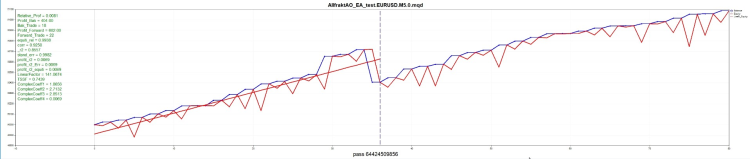
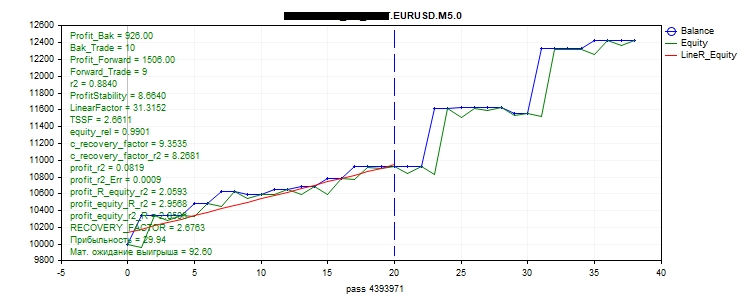
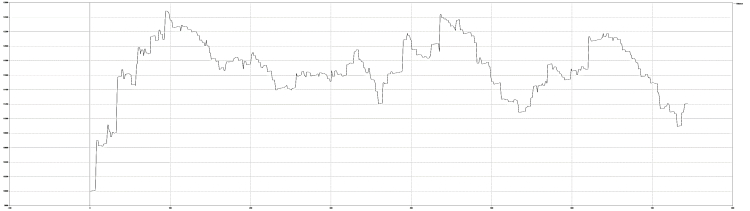
Here is how the graph created by the script looks like.
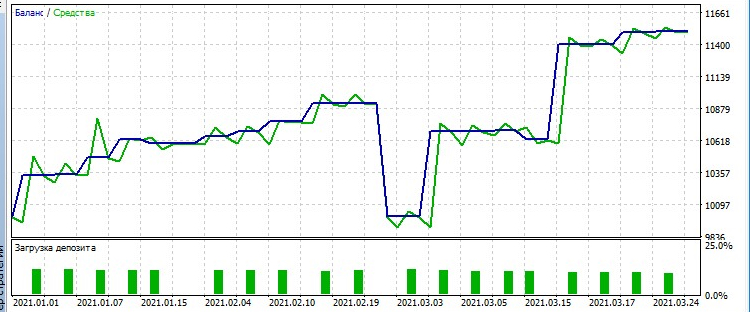
Below is the same graph from the Strategy Tester
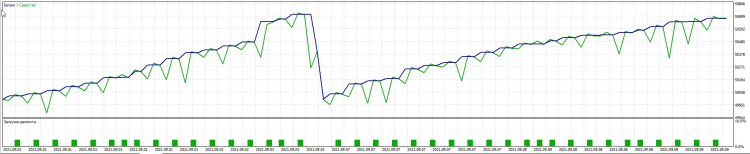
I have shown here very similar graphs, but in most cases they will be different. This is because in the Strategy Tester deals along the X axis are bound to time, while the script plots graphs in which the X axis is bound to the number of trades. Also, because we have to write the minimum information in a frame to keep the file small enough, the equity values are not sufficient for analyzing the graphs created by the script. At the same time, this data is enough to have an initial evaluation of the efficiency of an optimization pass. It is also sufficient for calculating a custom optimization criterion.
After optimization, before running the ScreenShotOptimization, restart the terminal!
Initially, I wanted only to visualize all optimization graphs. But when I implemented the script and saw seven thousand screenshots in the folder, I understood that it is impossible to work with so many graphs. Instead, we need to select the best of them based on certain criteria.
I noticed long ago that algorithmic traders fall into two categories:
- Some of them believe that and EA should be optimized in a very large time period, equal to several years or even dozens of years, after which the EA will work.
- Others think that an EA must be reoptimized regularly, using a small time period, for example one optimization month + one trading week, or three optimization months + one trading month or any other suitable reoptimization schedule.
I am of the second type.
That is why I decided to search for the optimization criteria which will serve as a filter to select the best passes.
Creating custom optimization criteria
All custom optimization criteria will be calculated in a separate include file CustomCriterion.mqh, since these calculations will be used both in the script operation to draw the graphs and in the Expert Advisor which we optimize.
Before creating my own custom optimization criterion, I found a lot of related material.
R-squared as an estimation of quality of the strategy balance curve
The article provides a detailed description of a linear regression and of its calculation using the AlgLib library. It also contains a good description of the R^2 coefficient of determination and its application in testing results. I recommend reading this article.
The function for calculating the linear regression, R^2, and ProfitStability:
void Coeff(double& Array[], double& LR[], double& coeff[], double& TeSt[], int total, int c)
  {
//-- Fill the matrix: Y - Array value, X - ordinal number of the value
   CMatrixDouble xy(total, 2);
   for(int i = 0; i < total; i++)
     {
      xy[i].Set(0, i);
      xy[i].Set(1, Array[i]);
     }

//-- Find coefficients a and b of the linear model y = a*x + b;
   int retcode = 0;
   double a, b;
   CLinReg::LRLine(xy, total, retcode, b, a);

//-- Generate the linear regression values for each X;
   ArrayResize(LR, total);
   for(int x = 0; x < total; x++)
      LR[x] = x * a + b;

   if(m_calc == c)
     {
      //-- Find the coefficient of correlation of values with their linear regression
      corr = CAlglib::PearsonCorr2(Array, LR);

      //-- Find R^2 and its sign
      coeff[r2] = MathPow(corr, 2.0);
      int sign = 1;
      if(Array[0] > Array[total - 1])
         sign = -1;
      coeff[r2] *= sign;

      //-- Find LR Standard Error
      if(total - 2 == 0)
         stand_err = 0;
      else
        {
         for(int i = 0; i < total; i++)
           {
            double delta = MathAbs(Array[i] - LR[i]);
            stand_err =  stand_err + delta * delta;
           }
         stand_err = MathSqrt(stand_err / (total - 2));
        }
     }
//-- Find ProfitStability = Profit_LR/stand_err
   if(stand_err == 0)
      coeff[ProfitStability] = 0;
   else
      coeff[ProfitStability] = (LR[total - 1] - LR[0]) / stand_err;
  }
From this article, I took the calculation of the ProfitStability custom optimization criterion. Its calculation is simple: first, we calculate LR Standard error, i.e. the average deviation of the regression line from the balance or equity line. Then, from the resulting value of the regression line deduct the starting value to obtain TrendProfit.
ProfitStability is calculated as a ratio of TrendProfit to LR Standard error:
The article describes in detail all the advantages and disadvantages of this optimization criterion. It also features a lot of tests to compare ProfitStability with other optimization criteria.
Since linear regression can be calculated both for balance and equity, and ProfitStability is bound to the linear regression calculation, the calculation of ProfitStability is implemented in the linear regression calculation function.
Creating Custom Criteria of optimization of Expert Advisors
It is quite an old article written back in 2011, but it is interesting and is still relevant. I used a formula for calculating the Trading System Safety Factor (TSSF) from this article.
TSSF = Avg.Win / Avg.Loss ((110% - %Win) / (%Win-10%) + 1)
   if(TeSt[STAT_PROFIT_TRADES] == 0 || TeSt[STAT_LOSS_TRADES] == 0 || TeSt[STAT_TRADES] == 0)
      coeff[TSSF] = 0;
   else
     {
      double  avg_win = TeSt[STAT_GROSS_PROFIT] / TeSt[STAT_PROFIT_TRADES];
      double  avg_loss = -TeSt[STAT_GROSS_LOSS] / TeSt[STAT_LOSS_TRADES];
      double  win_perc = 100.0 * TeSt[STAT_PROFIT_TRADES] / TeSt[STAT_TRADES];
      //  Calculate the secure ratio for this percentage of profitable deals:
      if((win_perc - 10.0) + 1.0 == 0)
         coeff[TSSF] = 0;
      else
        {
         double  teor = (110.0 - win_perc) / (win_perc - 10.0) + 1.0;
         //  Calculate the real ratio:
         double  real = avg_win / avg_loss;
         if(teor != 0)
            coeff[TSSF] = real / teor;
         else
            coeff[TSSF] = 0;
        }
     }
Optimal approach to the development and analysis of trading systems
From this article, I used LinearFactor which is calculated as follows:
- LinearFactor = MaxDeviation/EndBalance
- MaxDeviaton = Max(MathAbs(Balance[i]-AverageLine))
- AverageLine=StartBalance+K*i
- K=(EndBalance-StartBalance)/n
- n - number of deals in the test
For details, please see the above-mentioned article. The article is very interesting, and it provides many useful things.
Looking ahead, I will say that I didn't manage to find a universal custom optimization criterion which suits any Expert Advisor. Different criteria give the best results for different Expert Advisor.
In some EAs LinearFactor has wonderful results.
   double MaxDeviaton = 0;
   double K = (Balance[total - 1] - Balance[0]) / total;
   for(int i = 0; i < total; i++)
     {
      if(i == 0)
         MaxDeviaton = MathAbs(Balance[i] - (Balance[0] + K * i));
      else
         if(MathAbs(Balance[i] - (Balance[0] + K * i) > MaxDeviaton))
            MaxDeviaton = MathAbs(Balance[i] - (Balance[0] + K * i));
     }
   if(MaxDeviaton ==0 || Balance[0] == 0)
      coeff[LinearFactor] = 0;
   else
      coeff[LinearFactor] = 1 / (MaxDeviaton / Balance[0]);
In personal correspondence, the author mentioned that this criterion can be further strengthened, and he explained how, but I could not implement these tips in a code.
So, I added four custom optimization criteria into the code.
- R^2 - coefficient of determination.
- ProfitStability.
- TSSF - Trading System Safety Factor
- LinearFactor.
All these optimization criteria are in our project.
It's a pity I could not add "Complex Criterion max" because I could not find how it is calculated.
My optimization criterion
Based on all these articles, we can proceed to creating our own optimization criterion.
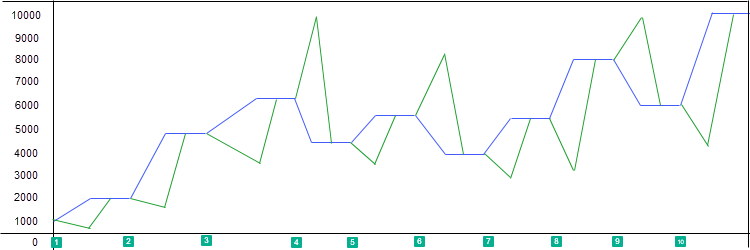
Which balance graph do we want to see? Of course, an ideal one would be a confidently growing straight line.
Let's have a look at a graph having profit.
During optimization, we do not compare the results of several EAs, but these are the results of the same EA, which is why I decided not to take into account the time during which the EA generated profit.
Also, I do not take into account the volumes. But if lot is calculated dynamically, it is necessary to somehow include the volumes in the custom criterion calculation (this is not implemented).
How many trades? I do not care how many trades will generate a thousand for me, one or one hundred trades, which is why I also ignore their number. However, please note that if there are too few deals, the linear regression will be calculated incorrectly.
What is important in this graph? First of all, it is the profit. I decided to evaluate the relative profit, i.e. profit relative to the starting balance.
Relative_Prof = TeSt[STAT_PROFIT] / TeSt[STAT_INITIAL_DEPOSIT];
Another very important parameter is drawdown.
How is drawdown calculated in the tester? The maximum equity on the left is compared with the minimum equity value on the right.
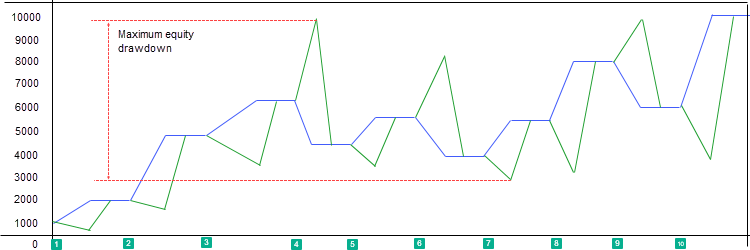
The values above the balance are rather unpleasant - the money we could not earn. But when the values are below the balance, it really hurts.
For me, the maximum drawdown below the balance is the most important. So, trading should not hurt much.
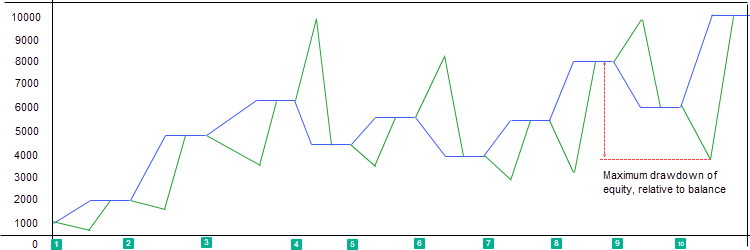
double equityDD(const double & Balance[], const double & Equity[], const double & TeSt[], const double & coeff[], const int total)
  {
   if(TeSt[STAT_INITIAL_DEPOSIT] == 0)
      return(0);

   double Balance_max = Balance[0];
   double Equity_min = Equity[0];
   difference_B_E = 0;
   double Max_Balance = 0;

   switch((int)TeSt[41])
     {
      case  0:
         difference_B_E = TeSt[STAT_EQUITY_DD];
         break;
      default:
         for(int i = 0; i < total - 1; i++)
           {
            if(Balance_max < Balance[i])
               Balance_max = Balance[i];
            if(Balance[i] == 10963)
               Sleep(1);
            if(Balance_max - Equity[i + 1] > difference_B_E)
              {
               Equity_min = Equity[i + 1];
               difference_B_E = Balance_max - Equity_min;
               Max_Balance = Balance_max;
              }
           }
         break;
     }

   return(1 - difference_B_E / TeSt[STAT_INITIAL_DEPOSIT]);
  }
Since the custom criterion values should be considered in the ascending order, I deducted the drawdown from one. So, the higher the value, the lower the drawdown.
I called the resulting value equity_rel, i.e. drawdown relative to the starting balance
It turned out that for the correct calculation of equity_rel, the previously used equity collection method is not suitable. Since some of the minimum equity values are lost, I had to implement two variants to save the equity values. The first option saves maximum value equities when closed with a loss and minimum values when closed with a profit. The second operation saves only the minimum equity values.
To inform the script about the equity collection method used, these options have been written to the array with the tester statistics TeSt[41]. Further, in the EquityDD() function, we calculate equity_rel and difference_B_E in accordance with the equity collection method.
//---
Next, I decided to combine different data and check the result.
//---
Based on equity_rel, it is possible to calculate and alternative recovery factor.
difference_B_E — maximum equity drawdown in monetary terms.
coeff[c_recovery_factor] = coeff[Profit_Bak] / difference_B_E;
To have the graph closer to a straight line, I added R^2 to the second alternative recovery factor
coeff[c_recovery_factor_r2] = coeff[Profit_Bak] / difference_B_E * coeff[r2];
Since the settings allow selecting calculation of correlation based on balance or equity, then if we were recording only minimum equity values, R^2 will correlate with the drawdown.
The formula of 'relative profit * R^2' can generate interesting results of the custom criterion.
coeff[profit_r2] = relative_prof * coeff[r2];
It would also be useful to take into account how big the correlation was. Therefore, the next custom criterion is as follows.
Relative profit *R^2 / Standard Error
   if(stand_err == 0)
      coeff[profit_r2_Err] = 0;
   else
      coeff[profit_r2_Err] = relative_prof * coeff[r2] / stand_err;
Now that we have the relative profit, the equity drawdown relative to the starting balance and R^2, we can create a formula that takes into account the profit, the drawdown and the closeness of the graph to a straight line
relative_prof + equity_rel + r2;
What if we want to make any of these parameters more important? So, I have added the weight variable 'ratio'.
Now we have three more custom optimization criteria.
coeff[profit_R_equity_r2] = relative_prof * ratio + coeff[equity_rel] + coeff[r2];

coeff[profit_equity_R_r2] = relative_prof + coeff[equity_rel] * ratio + coeff[r2];

coeff[profit_equity_r2_R] = relative_prof + coeff[equity_rel] + coeff[r2] * ratio;
In total we have twelve custom optimization criteria.
1. R^2 - coefficient of determination
2. ProfitStability
3. TSSF - the trading system safety factor
4. LinearFactor
5. equity_rel
6. c_recovery_factor
7. c_recovery_factor_r2
8. profit_r2
9. profit_r2_Err
10. profit_R_equity_r2
11. profit_equity_R_r2
12. profit_equity_r2_R
Checking the result
To check the result, we need to create a simple Expert Advisor...
According to the provisional article plan, a simple Expert Advisor code should be here. Unfortunately, two simple EAs did not show the desired results.
Therefore, I had to take one of the EAs created to order and show the results using it (I have hidden the name of the EA).
Suppose it is end of April and we are planning to launch the EA on a real account. How to find out which criterion to optimize by to have it trade with profit?
Let's launch a three-months forward optimization.

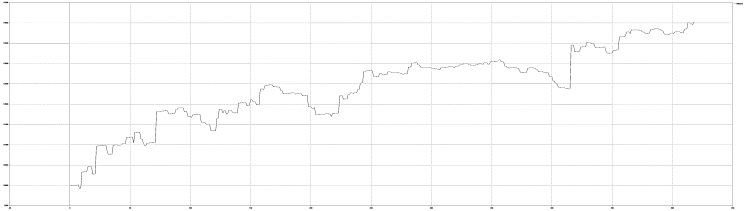
Restart the terminal after optimization.
Run the script, selecting only the best results in the settings. Here are the results in the folder.
Then, I visually select the best forward of all these passes. I had several similar results, so I selected profit_equity_R_r2, since in this optimization priority is given to lower drawdown.
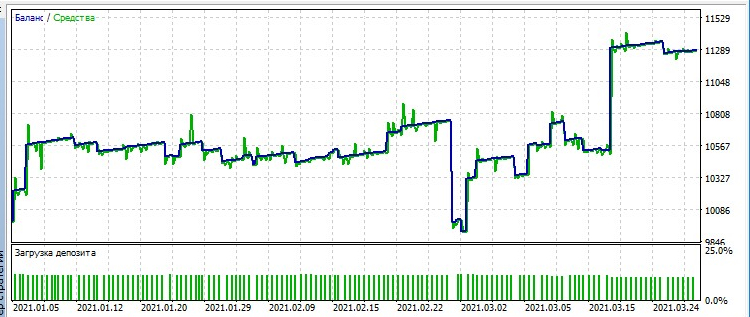
The same period in the strategy tester looks as follows:
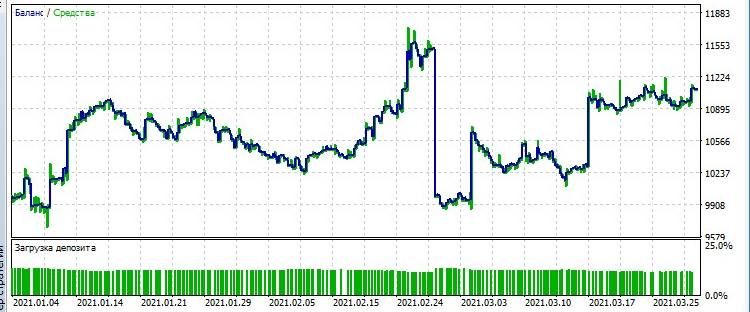
Here is the maximum balance for comparison:
Here is the Complex Criterion max:
As you can see, with the best profit_equity_R_r2 pass, there are much less trades on the chart, than with the maximum balance and maximum complex, the profit is approximately the same, but the chart is much smoother.
So, we have determined the custom criterion: profit_equity_R_r2. Now, let's see what would happen if we ran optimization for the last three months and, having received the best settings during the optimization, decided to trade this setup in May.
Let's run forward optimization and check.
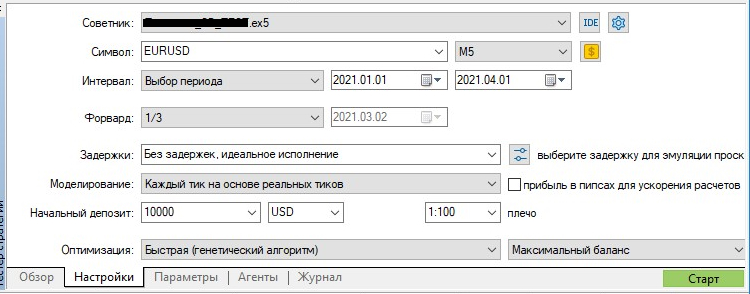
Optimization settings.
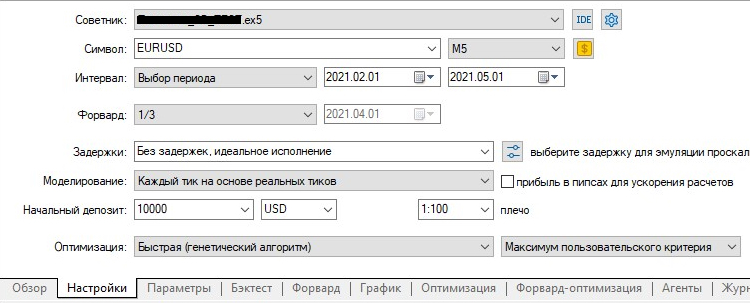
In the EA settings, set the custom criterion for which the optimization will be performed.
So, if we optimized the EA for the last three months with the profit_equity_R_r2 custom criterion,
and then traded with the obtained settings from April 1 to May 1, we would earn 750 units with the equity drawdown of 300 units.

Now, let's check the performance of the Validate EA by fxsaber!
Let's check how the EA would trade for four months. Validate settings: three optimization months and one trading month.
As you can see, the EA survived this stress test!
Let's compare it with the chart that has the same settings but is optimized for Complex Criterion max.
The EA has survived, but...
Conclusion
Advantages:
- You can simultaneously view all graphs of optimization results.
- The possibility to find an optimal custom optimization criterion for your EA.
Disadvantages:
Due to a limit in recorded data, the graphs are less informative than those in the strategy tester.
With a large number of deals, the file with the frames grows enormously and becomes unreadable.
//---
As the experiments have shown, there is no single super-criterion: different criteria give the best results for different Expert Advisor.
But we have a whole set of such criteria. If the readers support the idea, the choice will be even wider.
//---
One of the testers has suggested describing script setting in the article, so the users not willing to study the material could simply use the code without studying the detail.
How to use
To use this code, download the zip attached below, unzip it and copy to the MQL5 folder.
In the terminal, select File -> Open Data Folder -> right mouse click in an empty place in the new folder -> "Insert". If a prompt appears asking you if you want to replace files in the destination folder, select "Replace".
Next, run MetaEditor, open your EA in it and make the following changes:
1. Insert IsOnTick() in the OnTick() function;
2. Add the following code at the bottom of your EA:
  #include <SkrShotOpt.mqh>

  double OnTester() {return(IsOnTester());}

  void OnTradeTransaction(const MqlTradeTransaction & trans, const MqlTradeRequest & request,const MqlTradeResult & result)
    {
      IsOnTradeTransaction(trans, request, result);
     }
If the EA already has the OnTradeTransaction() function, add to it IsOnTradeTransaction(trans, request, result);
3. Press "Compile".
If errors are generated, notifying about matching variable names, you will need to change the names.
Settings
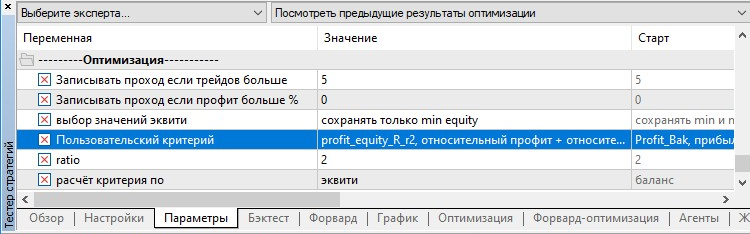
Once you have inserted the code, a few additional lines will appear in the EA settings.
Do not check the boxes to optimize these settings!!! These settings do not affect the optimization results so do not optimize them.
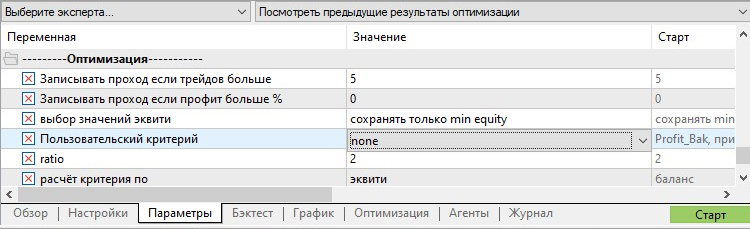
- Write the pass if trades more than: if your EA executes many trades, this parameter can be increased to reduce the amount of data written to the frames files.
- Write the pass if profit exceeds % — loss-making passes are removed by default. You can change it if you do not want to see profit less than a certain percentage of the starting balance.
- Select equity values — set "save only min equity", if you need correct calculation of the following custom criteria: quity_rel, c_recovery_factor, c_recovery_factor_r2, profit_r2, profit_r2_Err, profit_R_equity_r2, profit_equity_R_r2, profit_equity_r2_R
If you want to have graphs similar to those in the strategy tester, select "save min and max equity"
- Custom criterion — if set to "none", frames are recorded to the file, but no custom criterion is calculated (not to increase the optimization time),
But in this case you cannot select optimization by custom criterion. Also, all below parameters will have no effect.
You should select some custom criterion in this parameter if you want to run optimization by custom criterion.
Do not forget that the calculation of a custom criterion depends on the parameters "select equity values" and "calculate criterion by"
- Calculate criterion by - calculate R^2 based on balance or equity; affects all custom criteria in which R^2 is used
//----
Script settings.
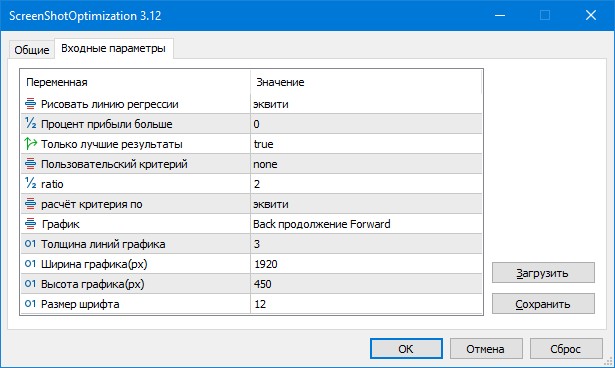
- Draw regression line: select which regression line to draw - balance, equity, balance and equity, none.
- Profit percent more than - printing screenshots is time intensive, so you can choose to print only screenshots with the profit exceeding the parameter.
- Only best results - if true, saves only screenshots with the best result of each custom criterion; otherwise saves all.
- Custom criterion - if all screenshots are selected, this parameter can be used to set the custom criterion according to which the screenshots in the folder will be sorted.
- ratio - the weight for calculating custom criteria profit_R_equity_r2, profit_equity_R_r2, profit_equity_r2_R.
- Calculate criterion by - calculate R^2 based on balance or equity; affects all custom criteria in which R^2 is used
r2, profit_r2, profit_r2_Err, profit_R_equity_r2, profit_equity_R_r2, profit_equity_r2_R.
- Graph - select between graph like in the tester "Back separately from Forward", i.e. forward starts with the starting balance,
or "Back continued by Forward" - forward starts with the last balance value of the Backward pass.
//---
The articles published on this website were very helpful in writing the program.
I would like to thank all authors of the articles mentioned herein!
Translated from Russian by MetaQuotes Ltd.
Original article: https://www.mql5.com/ru/articles/9922
Warning: All rights to these materials are reserved by MetaQuotes Ltd. Copying or reprinting of these materials in whole or in part is prohibited.
This article was written by a user of the site and reflects their personal views. MetaQuotes Ltd is not responsible for the accuracy of the information presented, nor for any consequences resulting from the use of the solutions, strategies or recommendations described.

 Developing a trading Expert Advisor from scratch
 Learn how to design a trading system by Envelopes
- Free trading apps
- Over 8,000 signals for copying
- Economic news for exploring financial markets
You agree to website policy and terms of use
Only if you write your own, some other criteria that will differ in their logic from those that are there.
My imagination is not good, so some of the criteria are very similar to each other, differing not by big nuances.
No, no, no, I'm talking about graphs within a single criterion.
Well, there is no way.
You, when you do optimisation and the tester displays the results, there is a whole bunch of results on the top lines almost identical.
The same thing happens here, just the results are sorted by user criteria.
Well, there's no way.
When you do optimisation and the tester displays the results, there are also a whole bunch of results on the top lines that are almost identical.
The same thing happens here, but the results are sorted by user criteria.
What if we pre-sort the structure and in m_BackBest[x][y].res remember only the value that does not match the previous value? I tried it - I didn't succeed... )))
The thing is that there can't be matching values there.
It's just that when you plot it, the values are rounded and you see them as if they are the same, but they are actually different.
Try rounding the values when sorting, then the results will be what you want to see.
Thank you for a great article!
In my opinion, the title of the article does not reflect much of its main value - working with fitness functions, although everything in this article is great, kudos to the author!