
Mountain or Iceberg charts
Introduction
How do you like the idea of adding a new chart type to the MetaTrader 5 platform? Some people say it lacks a few things that other platforms offer. But the truth is, MetaTrader 5 is a very practical platform as it allows you to do things that can't be done (or at least can't be done easily) in many other platforms.
One of the most frequent complaints is that there are only three chart types in MetaTrader 5: candles, bars and lines. Is it really so? Or is it because someone doesn't know how the platform actually works or which possibilities the MQL5 language offers?
Most often, those who complain the most are the ones who learn the platform the least. Everyone wants to have things ready to use, and if not available right away, they start complaining.
In this article — which will not be very long this time — we will look at how to create a chart in a different yet useful style. It can be especially useful for those who trade using specific styles, such as swing trading, position trading and even portfolio trading.
Today we will look at the Mountain or Iceberg chart. Moreover, we will go a little further to learn a little more about how to work with MQL5. In this article, we will develop a very interesting chart for efficient position tracking: with this chart, you will not need to constantly check whether a trade is profitable or not. You can simply look at the chart to determine whether you are in profit or loss on a given position.
The mountain chart is very similar to the linear representation style, but it has a few differences. With a line chart (which is shown in Figure 01), all we have is a simple indication of whether the price is moving up or down, but nothing more. The mountain chart provides much more capabilities. The mountain chart is shown in figure 02.
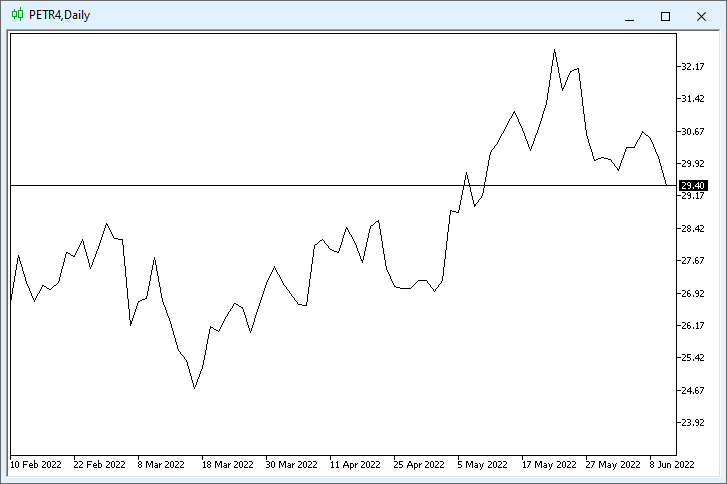
Figure 01 - Typical Line Chart
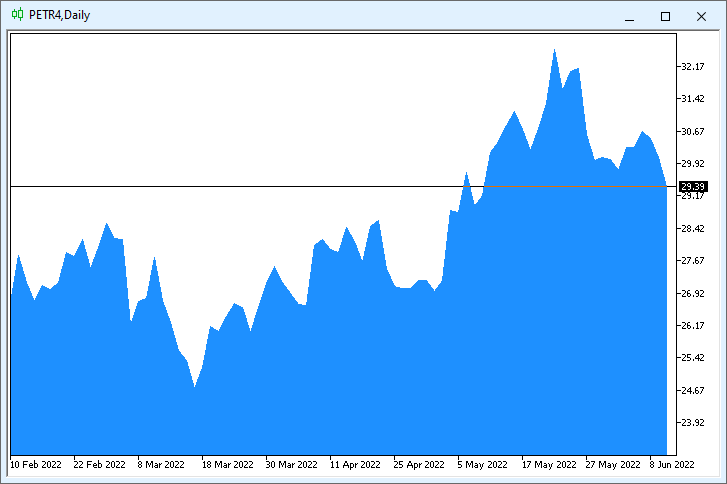
Figure 02 - Typical mountain chart
The chart shown in Figure 02 is the most common type of the Mountain diagram. It has several varieties which may also have different names. One of the basic varieties is shown in Figure 03.
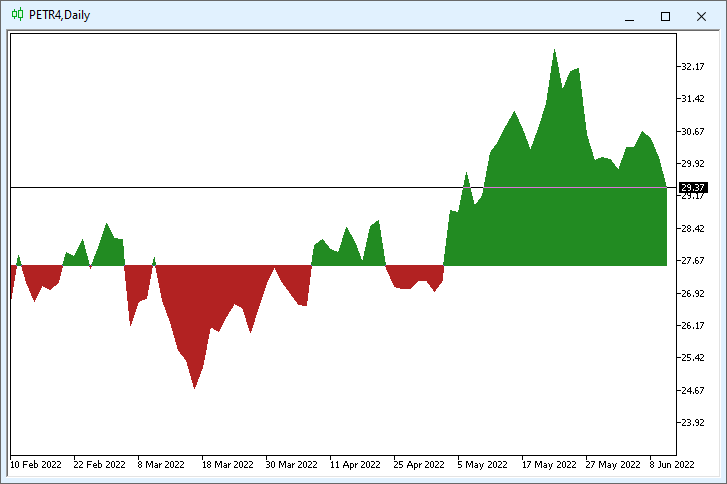
Figure 03 - Iceberg chart for Buy positions
Figure 03 shows chart type which is very easy to read. In this particular case, the chart shown in Figure 03 is for buy positions, but it could be the same for sell positions. Such a chart is shown below in Figure 04.
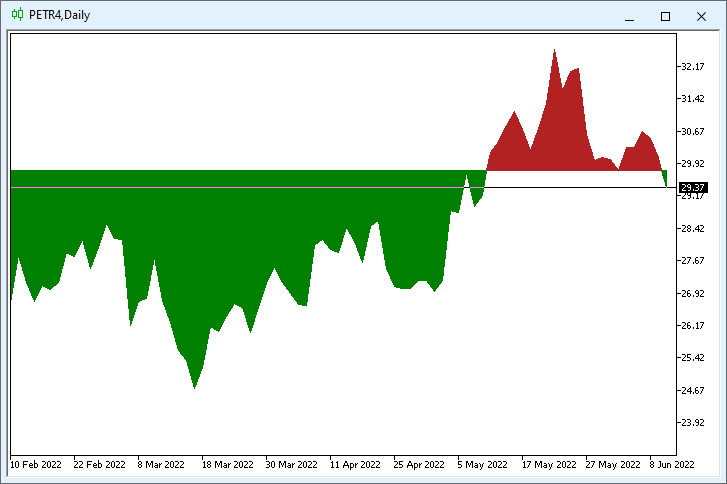
Figure 04 - Iceberg chart for Sell positions
By watching iceberg charts, you can immediately see whether a position is profitable or losing. The chart uses different colors to indicate the trade state (profit/loss). Thus, by simply adding color to a mountain map we can implement a different style which is much easier to read for those who are starting to study the market. It can be especially useful when you need to place a long-term position.
The interesting thing is that the system is so simple and at the same time so adaptable that it allows us to create not only mountain or iceberg charts, but also a more complex line chart, shown in Figure 05.
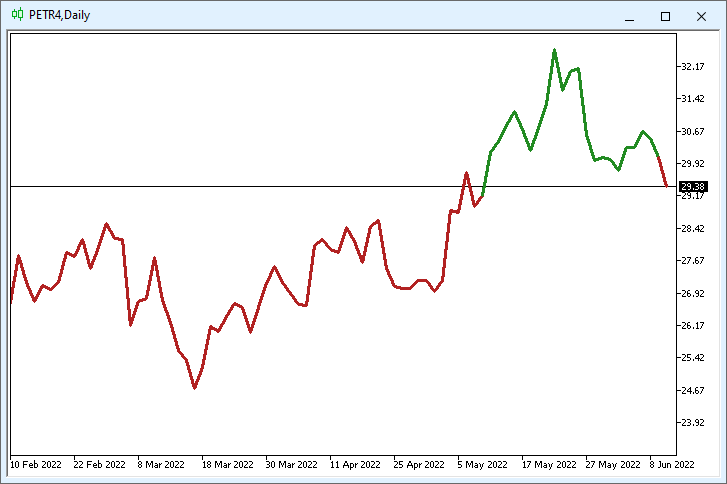
Figure 05 - Line chart for position analysis
The line style can be changes, i.e. it should not necessarily be a solid line. For example, we can create the following chart.
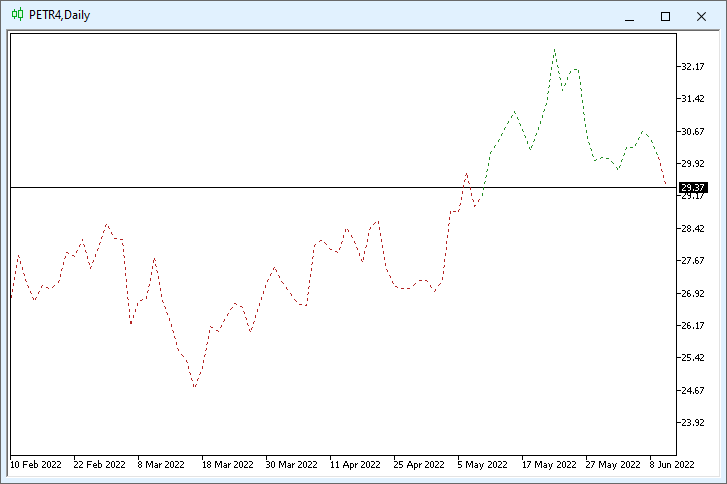
Figure 06 - Line chart for analyzing a buy position
You might think that we will need to create some very complex code that will be extremely difficult to execute or understand. However, the code we are going to create is quite simple, and thus it will be easy to understand even for those who are new to the MQL5 language. Therefore, it can be a good starting point for those who want to learn more about how the platform works, before moving on to creating more difficult things.
What our code does to create a mountain or iceberg chart is very similar to what the Heiken-Ashi indicator does. But unlike Heiken-Ashi, our chart system will create 100% clean charts, similar to those shown above. There will be nothing extra, including the standard default chart displayed in MetaTrader 5.
Furthermore, the creation of a custom chart does not mean we will not be able to apply our favorite indicators on it: with this new chart style, you will be able to use any indicators, Expert Advisors, scripts and anything else, without modifying the code. This is wonderful, given the number of things that can arise over time.
Now, let's move on and see how to implement the new charting system in MetaTrader 5.
Implementation
Look at the above figures. What the creation of the chart can be like, or at least for the part we were talking about (it is shown in figures 05 and 06)? What comes in mind first is the moving average. Both Figure 05 and Figure 06 show the moving average. This is something very similar to Figure 01, but it has different colors for some reason. What about other shapes?
What are the secrets of charts in Figures 02, 03 and 04? Is there any way to implement the same feature without overloading the MetaTrader 5 platform?
In fact, all charts, except Figure 01, which is a default line chart available in the MetaTrader 5 platform, are created in similar ways, by using a moving average. Even iceberg charts are created in the same way.
To understand this, look at the code below. It is very simple and starts with the following lines:
#property copyright "Daniel Jose"
#property icon "\\Images\\Icons\\Mountain Chart.ico"
#property description "This indicator allows you to create a mountain chart"
#property description "Whose average price can be indicated facilitating market analysis"
#property version   "1.00"
#property indicator_chart_window
#property indicator_buffers 2
#property indicator_plots 1
In this line we define the location of the image file which will be used as the icon for our system. We also indicate that we will use an indicator (well, yes, the chart will be an indicator) in the main chart window of the financial instrument.
Now comes the important point: we will use two buffers, BUT (emphasis on that word) they won't be used in the way you might think, so pay attention to that part. We will plot one indicator, and again, everything is not exactly as indicated here.
We have three possible chart types: multi-colored line chart, iceberg chart and mountain chart. Therefore, we do not stick to the information indicated at the beginning.
Next come a few simple and necessary declarations to ensure everything works:
double Buff1[], Buff2[];
//+------------------------------------------------------------------+
enum eType {Fill, Contour};
//+------------------------------------------------------------------+
input double    user01 = 0.0;   //Analysis price
input eType     user02 = Fill; //Type of Mountain
//+------------------------------------------------------------------+
struct st0
{
        long    id;
        color 	CandleBear,
                CandleBull,
                CandleLine,
                LineUp,
                LineDown;
}_memConfig;
Here we declare two buffers that we will use. Then, create an enum to help choose the type for the chart: line chart, iceberg chart, or mountain chart. Now comes the moment, which is connected specifically with the interaction with the user. Let us understand how the chart will be presented and which type we will see on the screen. We have the following combinations:
| Chart type | Value contained in user01 | Value contained in user02 |
|---|---|---|
| Single color line chart | Value is 0 | Value indicating the outline |
| Multicolor line chart | Threshold price value | Value indicating the outline |
| Mountain chart | Value is 0 | Value indicating the filling |
| Iceberg chart | Waterline price value | Value indicating the filling |
This table will help you choose the type of chart that you can display on your screen.
To make everything even clearer, at the end of the article I added a video demonstrating each of the settings and the result. This will give you a better understanding of what's going on, as some things may be difficult to understand by simply watching the code. Be sure to watch the video: it will help you understand all possible combinations. The article text does not provide a description of how to change colors, but the video shows this.
Do not worry about the structure, because it only serves as a memory to store certain information.
So, we are done with this. Let's move on to the first function in our charting system:
int OnInit()
{
        IndicatorSetString(INDICATOR_SHORTNAME, "Mountain Chart");
        Init_MountainChart();

        return INIT_SUCCEEDED;
}
This function is very simple: you specify the name of the indicator and call a function to run the chart. We could put the contents of the called function here, but I like to separate things and keep the code well organized.
Below is the next function:
int OnCalculate(const int rates_total, const int prev_calculated, const int begin, const double &price[])
{
        for (int c0 = (prev_calculated == 0 ? 0 : prev_calculated - 1); c0 < rates_total; c0++)
        {
                Buff1[c0] = price[c0];
                Buff2[c0] = (user02 == Fill ? user01 : (price[c0] > user01 ? 0 : 1));
        }

        return rates_total;
}
This is a very simple function, and it really should be very simple because it will be executed on every price tick or with every price change. MetaTrader 5 will generate an event as a result of which OnCalculate will be called. Therefore, the function must run very quickly.
To avoid the recalculation of the entire data series from the very beginning in each function call, we will use a simple calculation which will adjust the previous value. This will ensure the fastest possible execution. There may be a slight delay at the very beginning, but all other calculations should be very quick.
Now pay attention to the following: we will get only one value type from MetaTrader 5, this value is selected in the indicator message box. Possible values that MetaTrader 5 will transmit to the indicator are shown in Figure 08.
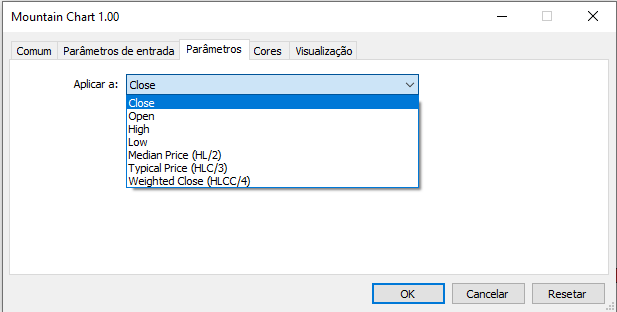
Figure 08 - Types of values transferred from MetaTrader 5 to the indicator
This value will be implemented in buffer01 — this is the buffer that we will use. Buffer02 will get the value depending on what we are creating. Why do we use this implementation?
This is because we will be using two different drawing styles. In one of the styles, buffer02 will receive a value that is the threshold or waterline. When the waterline value is above 0, this happens because no asset can trade below this value, and therefore there is no point in holding an asset with a negative value. By using the fill mode, we will get a mountain chart shown in Figure 02 above.
But if the waterline value is non-zero, we will have an iceberg plot like in Figures 03 and 04. Similarly, if we use outline mode and the waterline is 0, then we will have a line chart, which however will be different from the default line chart in MetaTrader 5.
You can specify the thickness and style for the line and, as a result, get a chart similar to Figures 05 and 06, although the waterline value there is different from zero, and that is why it has different colors in different parts of the line.
Below is another function:
void OnDeinit(const int reason)
{
        ShowBars();
}
It simply terminates the indicator, causing the chart to return to its original state. Let's now look at another function which needs additional explanation.
void Init_MountainChart(void)
{
        _memConfig.id = ChartID();
        PlotIndexSetInteger(0, PLOT_DRAW_TYPE, (user02 == Fill ? DRAW_FILLING : DRAW_COLOR_LINE));
        SetIndexBuffer(0, Buff1, INDICATOR_DATA);
        SetIndexBuffer(1, Buff2, (user02 == Fill ? INDICATOR_DATA : INDICATOR_COLOR_INDEX));
        PlotIndexSetInteger(0, PLOT_COLOR_INDEXES, 2);
        PlotIndexSetString(0, PLOT_LABEL, "MidPoint");
        PlotIndexSetInteger(0, PLOT_LINE_COLOR, 0, clrForestGreen);
        PlotIndexSetInteger(0, PLOT_LINE_COLOR, 1, clrFireBrick);
        PlotIndexSetInteger(0, PLOT_DRAW_BEGIN, 0);
        HideBars();
}
After calling this function, we get the id of the chart to which the indicator will be attached. This part is used by the function that clears and restarts the chart. We will consider these features later. Now pay attention to the following point: when the user chooses to fill the chart, we will use this design model, and when only the outline should be created, we will use a different model.
That is why the code looks a little different than you might think at the beginning. The point is in one detail: both models use two buffers, but the DRAW_FILLING model uses both buffers with data, and the DRAW_COLOR_LINE model uses one buffer with data and another one with color. That is why it is important to correctly calculate in the function that is responsible for displaying the indicator.
The first data buffer buffer01 is always used. Buffer02 depends on what we want to construct: it can contain data or a color index. Note I am not saying that buffer02 will contain the color used. DO NOT specify the color there. This buffer specifies an index which will determine the color to be used. That's why I did not use any color information in the calculation function — only values 0 and 1, since we are going to work with only two colors.
Buff2[c0] = (user02 == Fill ? user01 : (price[c0] > user01 ? 0 : 1));
Now let's move on further. The next thing we will do is define the two-color matrix. The label we are using here will be visible on the waterline on hover and when selecting and defining the color.. I have added this feature to show how you can save information that you might need in the future.
Now, let's define default colors that the user cannot change. You will first have to attach the indicator to the chart and only then change the colors. This is also shown in the video at the end of the article.
Finally, specify from what position the chart will be built. Actually, this there is no need in this feature, I only want to show how you can do it.
After that, we can move on to the last two functions of our micro-charting system. The HideBars function hides the default MetaTrader 5 chart layout. It means we will hide the chart itself in MetaTrader 5. This is very easy to do. But we don't want to make the user angry if something goes wrong, so save the original data to restore it later, when the indicator is removed from the symbol chart. So, later we can easily revert to the original color scheme.
void HideBars(void)
{
        _memConfig.CandleBear   = (color) ChartGetInteger(_memConfig.id, CHART_COLOR_CANDLE_BEAR);
        _memConfig.CandleBull   = (color) ChartGetInteger(_memConfig.id, CHART_COLOR_CANDLE_BULL);
        _memConfig.CandleLine   = (color) ChartGetInteger(_memConfig.id, CHART_COLOR_CHART_LINE);
        _memConfig.LineUp       = (color) ChartGetInteger(_memConfig.id, CHART_COLOR_CHART_UP);
        _memConfig.LineDown     = (color) ChartGetInteger(_memConfig.id, CHART_COLOR_CHART_DOWN);
        ChartSetInteger(_memConfig.id, CHART_COLOR_CANDLE_BEAR, clrNONE);
        ChartSetInteger(_memConfig.id, CHART_COLOR_CANDLE_BULL, clrNONE);
        ChartSetInteger(_memConfig.id, CHART_COLOR_CHART_LINE, clrNONE);
        ChartSetInteger(_memConfig.id, CHART_COLOR_CHART_UP, clrNONE);
        ChartSetInteger(_memConfig.id, CHART_COLOR_CHART_DOWN, clrNONE);
        ChartRedraw();
}
//+------------------------------------------------------------------+
void ShowBars(void)
{
        ChartSetInteger(_memConfig.id, CHART_COLOR_CANDLE_BEAR, _memConfig.CandleBear);
        ChartSetInteger(_memConfig.id, CHART_COLOR_CANDLE_BULL, _memConfig.CandleBull);
        ChartSetInteger(_memConfig.id, CHART_COLOR_CHART_LINE, _memConfig.CandleLine);
        ChartSetInteger(_memConfig.id, CHART_COLOR_CHART_UP, _memConfig.LineUp);
        ChartSetInteger(_memConfig.id, CHART_COLOR_CHART_DOWN, _memConfig.LineDown);
        ChartRedraw();
}
Ultimately, after resetting the data, the user will not even notice that something is wrong. There will be no need to set everything up again, which is always great, because it gives a greater level of convenience when using the system.
And yet, the user may be a little surprised after removing the indicator from, as it will take some time for the chart to be completely rendered again. As a result, the financial instrument chart will look just the same, as before the indicator was launched.
Demonstration (MUST-WATCH)
Conclusion
In this article, I have shown that both MQL5 and the MetaTrader 5 platform itself are able to create much more than many can imagine. We did simple things in the article, which however can assist in understanding more complex things.
The biggest problem is that people can say this or that about the platform or about the MQL5 language, when in fact they don't even explore the capabilities of the platform and don't really know what can or can't be done. They just keep saying what other people say, not understanding the possibilities.
Every time you hear that MetaTrader 5 or MQL5 are limited and that they lack certain features, show this article to those who say so. The only thing really limited is their creativity or knowledge. They keep saying those things because they don't know anything about programming and don't understand the purpose of the MetaTrader 5 platform, which should be functional, secure and fast, but above all it should be a platform. However, this is the platform where the level of customization enables its flexible adaptation to suit all of us.
Translated from Portuguese by MetaQuotes Ltd.
Original article: https://www.mql5.com/pt/articles/11078
Warning: All rights to these materials are reserved by MetaQuotes Ltd. Copying or reprinting of these materials in whole or in part is prohibited.
This article was written by a user of the site and reflects their personal views. MetaQuotes Ltd is not responsible for the accuracy of the information presented, nor for any consequences resulting from the use of the solutions, strategies or recommendations described.
 Learn how to design a trading system by Gator Oscillator
- Free trading apps
- Over 8,000 signals for copying
- Economic news for exploring financial markets
You agree to website policy and terms of use