Price Action Analysis Toolkit Development (Part 32): Python Candlestick Recognition Engine (II) — Detection Using Ta-Lib

Contents
- Introduction
- Building On Our Last Discussion
- Understanding TA-Lib
- System Workflow Breakdown
- Testing and Outcomes
- Conclusion
Introduction
In my previous article, I introduced the use of Python for candlestick pattern detection. We began by employing manual detection techniques, where each candlestick pattern was coded explicitly. In this approach, whenever MQL5 sends data to Python—including open, close, high, low, and timestamp—Python processes this information to identify the pattern through calculations.
In this article, we advance the methodology by integrating the TA-Lib Python library, which can automatically detect over 60 candlestick patterns. We will also combine it with mplfinance and matplotlib for plotting candlestick charts.
Here's an overview of the key libraries used:
from flask import Flask, reque
st, jsonify, send_file
import numpy as np
import pandas as pd
import talib
import json
import matplotlib.pyplot as plt
import mplfinance as mpf
Lets clarify each part below
Flask
from flask import Flask, request, jsonify, send_file
- A lightweight web framework for Python used to build web applications or APIs.
- The main class to create a Flask app instance.
jsonify: Converts Python data structures into JSON format for responses.
send_file: Sends files from the server to the client, useful for downloading generated images or reports.
import numpy as np
- NumPy: A fundamental library for numerical computing in Python.
- np: Common alias used for NumPy.
It handles array operations, mathematical functions, and data manipulation efficiently.
import pandas as pd
- Pandas: A powerful data manipulation library.
- pd: Standard alias.
Used for data structures like DataFrames, which are ideal for handling time series data such as candlestick data.
import talib
- TA-Lib: Technical Analysis Library in Python.
Provides functions to compute a wide range of technical indicators and candlestick pattern recognition algorithms automatically.
import json
- Python’s built-in library for working with JSON data.
Parses JSON data from requests or converts Python objects into JSON for responses.
import matplotlib.pyplot as plt
- Matplotlib: A plotting library.
- pyplot: A module within Matplotlib that provides a MATLAB-like interface.
- plt: Standard alias.
- Used for creating static, animated, or interactive plots and charts, such as candlestick charts.
import mplfinance as mpf
- mplfinance: A specialized library for financial data visualization, especially candlestick and OHLC charts.
- mpf: Alias used for convenience.
- Facilitates easy plotting of financial charts with advanced customization options.
Below are the advantages of using TA-Lib for pattern detection:
| Advantage | Description |
|---|---|
| Automation | Detects over 60 candlestick patterns automatically without manual coding. |
| Efficiency | Faster pattern recognition, suitable for real-time analysis. |
| Accuracy | Utilizes well-tested algorithms for reliable pattern detection. |
| Compatibility | Easily integrates with other Python libraries for analysis and visualization. |
| Ease of Use | Simplifies implementation with straightforward function calls. |
Building On Our Last Discussion
As I mentioned before, the previous system was a manually coded candlestick recognition system in Python. Let's go through an overview of that system.
- MetaTrader 5 Expert Advisor (the “Chart‑Side Orchestrator”)
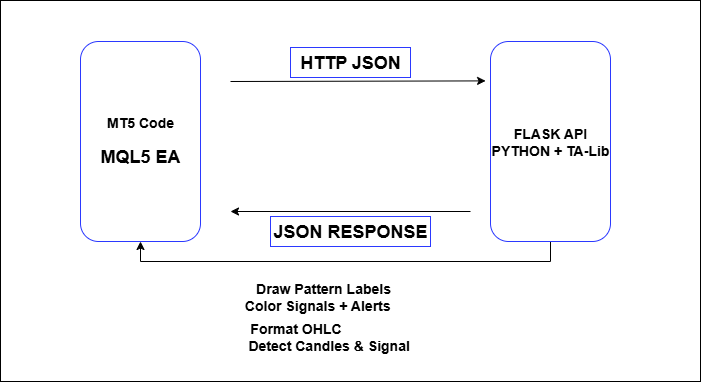
In MetaTrader 5, the EA watches for each new bar, then immediately gathers the last 31 candles’ open, high, low, close and timestamp data. It wraps them up into a compact JSON payload and sends it off via WebRequest to our local pattern‑detection service. When the server responds with an array of candlestick names,
MQL5 EA ➔ (OHLC JSON POST) ➔ Python Server
The EA automatically draws each label at the bar’s high, using your chosen font size and color—and fires an MetaTrader 5 alert for any valid pattern. Every tick also cleans up previous labels to keep the chart pristine, and on remove it tears down all its objects, so nothing lingers.
MQL5 EA draws labels & fires alerts
- Python Flask Server: Pattern‑Detection Engine
On the backend, I crafted a Flask application serving the /patterns endpoint. It ingests the JSON array of OHLC data, converts UNIX timestamps into UTC datetimes, and constructs a pandas DataFrame for reliable indexing. I then apply my suite of classic candlestick rules—Doji, Hammer, Engulfing, Harami, Morning/Evening Star, and more—in pure Python, with clear, testable functions for each pattern.
def detect_patterns(df):
    pats = ["None"]*len(df)
    for i in range(len(df)):
        o,h,l,c = df.iloc[i][["OPEN","HIGH","LOW","CLOSE"]]
        body = abs(c-o); rng = max(h-l,1e-6)
        lower = min(o,c)-l; upper = h-max(o,c)
        # doji
        if body/rng <= 0.1:
            pats[i] = "doji"; continue
        # hammer
        if lower>=2*body and upper<=body:
            pats[i] = "hammer"; continue
        # shooting star
        if upper>=2*body and lower<=body:
            pats[i] = "shootingstar"; continue
        # bullish engulfing
        if i>0:
            po,pc = df.iloc[i-1][["OPEN","CLOSE"]]
            if pc<po and c>o and o<=pc and c>=po:
                pats[i] = "bullishengulfing"; continue
        # bearish engulfing
        if i>0:
            po,pc = df.iloc[i-1][["OPEN","CLOSE"]]
            if pc>po and c<o and o>=pc and c<=po:
                pats[i] = "bearishengulfing"; continue
        # harami
        if i>0:
            po,pc = df.iloc[i-1][["OPEN","CLOSE"]]
            if pc<po and o<c and o>pc and c<po:
                pats[i] = "bullishharami"; continue
            if pc>po and o>c and o<pc and c>po:
                pats[i] = "bearishharami"; continue
        # morning star
        if i>1:
            o1,c1 = df.iloc[i-2][["OPEN","CLOSE"]]
            o2,c2 = df.iloc[i-1][["OPEN","CLOSE"]]
            if c1<o1 and abs(c2-o2)<(df.iloc[i-1]["HIGH"]-df.iloc[i-1]["LOW"])*0.3 \
               and c>o2 and c>(o1+c1)/2:
                pats[i] = "morningstar"; continue
        # evening star
        if i>1:
            o1,c1 = df.iloc[i-2][["OPEN","CLOSE"]]
            o2,c2 = df.iloc[i-1][["OPEN","CLOSE"]]
            if c1>o1 and abs(c2-o2)<(df.iloc[i-1]["HIGH"]-df.iloc[i-1]["LOW"])*0.3 \
               and c<o2 and c<(o1+c1)/2:
                pats[i] = "eveningstar"; continue
    return pats
After tagging every bar, I tally non‑“None” occurrences into a brief log summary and measure the processing time in milliseconds. Finally, I return a JSON object containing both the full list of pattern names (one per bar) and the log. This separation keeps heavy data processing in Python—where it’s easiest to maintain and extend—while MetaTrader 5 remains focused on chart I/O and visualization.
Python Server ➔ (patterns & log JSON) ➔ MQL5 EAUnderstanding Ta-Lib
TA-Lib (Technical Analysis Library) is an open-source library extensively used by traders, investors, and analysts for performing complex technical calculations and developing trading strategies. Originally developed by Mario Fortier, it is written in ANSI C and offers a comprehensive suite of over 200 technical indicators—including ADX, MACD, RSI, Stochastic Oscillator, Bollinger Bands, among others—as well as the capability to recognize more than 60 candlestick patterns. Its C/C++ core provides an API that is also accessible via Python, facilitating seamless integration into various applications. Since its initial release in 2001 under the BSD license, TA-Lib has established itself as a stable and reliable tool, with algorithms that have stood the test of time and continue to be widely used in both open-source and commercial contexts.
In this system, TA-Lib's extensive pattern recognition functions are integrated into a Python-based analysis pipeline to automate candlestick pattern detection. The system dynamically loads all relevant candlestick pattern functions from TA-Lib, enabling it to identify over 60 different patterns within incoming market data. By combining TA-Lib's reliable algorithms with custom filtering logic, it accurately detects bullish and bearish signals, which are then visually overlaid on candlestick charts using mplfinance. The entire process is wrapped in a Flask web service, facilitating real-time data processing, pattern recognition, and visualization. This setup exemplifies how TA-Lib's comprehensive library can be harnessed alongside modern Python tools to create sophisticated, automated trading analysis systems that seamlessly complement MQL5 strategies.
Below is a step-by-step guide on how to install TA-Lib on your computer
Step 1: Download and Install TA-Lib .whl
- For Windows:
Download precompiled binaries from a trusted source. For example, download the appropriate .whl file—such as TA_Lib‑0.4.0‑cp39‑cp39‑win_amd64.whl—which is compatible with Python 3.9 on a 64-bit Windows system. The 'appropriate' .whl means you should select the file that matches both your Python version and your system architecture to ensure compatibility.
Install via pip:
pip install path\to\your\downloaded\file.whl
- For macOS:
Install the TA-Lib C library using Homebrew
brew install ta-lib
- For Linux (Debian/Ubuntu):
Install dependencies via apt
sudo apt-get update
sudo apt-get install libta-lib0-dev
Step 2: Install the Python Wrapper for TA-Lib
Once the C library is installed, install the Python wrapper:
pip install ta-lib
Step 3: Verify the Installation
Open a Python shell and run:
import talib
print(talib.__version__)
If no errors occur and the version prints, the installation was successful.
Let's take a look at the available candles in the TA-Lib library I have installed.
CDL2CROWS
  CDL3BLACKCROWS
  CDL3INSIDE
  CDL3LINESTRIKE
  CDL3OUTSIDE
  CDL3STARSINSOUTH
  CDL3WHITESOLDIERS
  CDLABANDONEDBABY
  CDLADVANCEBLOCK
  CDLBELTHOLD
  CDLBREAKAWAY
  CDLCLOSINGMARUBOZU
  CDLCONCEALBABYSWALL
  CDLCOUNTERATTACK
  CDLDARKCLOUDCOVER
  CDLDOJI
  CDLDOJISTAR
  CDLDRAGONFLYDOJI
  CDLENGULFING
  CDLEVENINGDOJISTAR
  CDLEVENINGSTAR
  CDLGAPSIDESIDEWHITE
  CDLGRAVESTONEDOJI
  CDLHAMMER
  CDLHANGINGMAN
  CDLHARAMI
  CDLHARAMICROSS
  CDLHIGHWAVE
  CDLHIKKAKE
  CDLHIKKAKEMOD
  CDLHOMINGPIGEON
  CDLIDENTICAL3CROWS
  CDLINNECK
  CDLINVERTEDHAMMER
  CDLKICKING
  CDLKICKINGBYLENGTH
  CDLLADDERBOTTOM
  CDLLONGLEGGEDDOJI
  CDLLONGLINE
  CDLMARUBOZU
  CDLMATCHINGLOW
  CDLMATHOLD
  CDLMORNINGDOJISTAR
  CDLMORNINGSTAR
  CDLONNECK
  CDLPIERCING
  CDLRICKSHAWMAN
  CDLRISEFALL3METHODS
  CDLSEPARATINGLINES
  CDLSHOOTINGSTAR
  CDLSHORTLINE
  CDLSPINNINGTOP
  CDLSTALLEDPATTERN
  CDLSTICKSANDWICH
  CDLTAKURI
  CDLTASUKIGAP
  CDLTHRUSTING
  CDLTRISTAR
  CDLUNIQUE3RIVER
  CDLUPSIDEGAP2CROWS
  CDLXSIDEGAP3METHODS
While most traders recognize classics like Doji and Engulfing, several lesser‑known formations can reveal subtle shifts in market psychology. The Abandoned Baby is a rare three‑bar reversal: a Doji gaps away from the preceding candle, then another gap in the opposite direction leaves all bars “abandoned,” often presaging a decisive change in trend. The Stick Sandwich emerges when two strong candles of the same color flank a small opposite‑colored bar, with the final bar closing at—or very near—the first bar’s close; this “sandwich” signals that, despite a brief counter‑trend move, the original momentum remains intact. The Tasuki Gap is a three‑bar continuation pattern in which an initial gap in the trend’s direction is partially—but not fully—filled by the third bar, underscoring the market’s unwillingness to relinquish the gap and confirming the prevailing trend’s strength.
Two more elusive patterns, Hikkake and Belt Hold, add further nuance. The Japanese‑named Hikkake (“trap”) begins with an inside bar, followed by a false breakout that lures traders one way before reversing to close past the opposite boundary, trapping the wrong‑way traders and accelerating the underlying trend. In contrast, the Belt Hold is a single, decisive candle that “holds the belt” against the prior move: a bullish Belt Hold opens at or near the low in a downtrend and then closes strongly higher, while a bearish Belt Hold opens near the high in an uptrend and closes sharply lower. Because Belt Holds reflect abrupt control shifts within one bar-without requiring a preceding bar to be “swallowed”, they can serve as clear, high‑impact reversal signals at key support or resistance levels.
In TA-Lib, each candlestick pattern function begins with the prefix CDL-short for “Candle.” This prefix indicates that the function implements one of the many classic candlestick pattern algorithms (e.g., CDLDOJI, CDLENGULFING, CDLHAMMER, etc.). When you call one of these CDL* functions with your Open-High-Low-Close (OHLC) arrays, it returns an integer series where non-zero values signify the presence of that specific candle formation, with the sign indicating its direction.
System Workflow Breakdown
In this section, I will walk you through how the system works, providing a detailed breakdown of both the MQL5 and Python scripts. At the heart of our setup is a tight request–response loop: each time a new candlestick closes, the MQL5 Expert Advisor pulls the most recent 60 bars’ open, high, low, close, and timestamp values, packages them into a compact JSON payload, and POSTs it to the local Flask service at /patterns.
The EA then waits for the server’s reply—which now includes two parallel arrays of length 60, one for patterns (candlestick names) and one for signals (“bullish” or “bearish”)—and immediately parses that JSON. Back in MetaTrader 5, it first deletes any existing labels, then recreates text objects at each bar’s high where a genuine pattern appeared, coloring them lime for bullish and red for bearish before firing a descriptive Alert().
Meanwhile, the Flask endpoint ingests the JSON, normalizes it into a pandas DataFrame, applies TA‑Lib’s 60+ pattern detectors, tags each bar, determines bullish/bearish bias, and returns both arrays plus a brief log and timing metric. This clear division—MQL5 for chart I/O and alerts, Python for data normalization and pattern logic—keeps both sides focused, efficient, and easy to extend.
- MQL5 Expert Advisor Breakdown
When the EA is first loaded, it immediately logs a startup message reminding you to whitelist the Flask endpoint in MetaTrader 5’s Expert Advisor settings. This one‑time setup step guarantees that subsequent HTTP calls to your local pattern‑detection service are permitted and prevents silent failures at runtime.
int OnInit()
{
   Log("EA started – allow WebRequest to: " + InpURL);
   return INIT_SUCCEEDED;
}
On every incoming tick, the EA checks the timestamp of the current (zero‑index) candle against the last processed bar. If no new bar has closed since the previous check, it simply returns—avoiding redundant work and ensuring that pattern analysis only runs once per completed candle.
void OnTick()
{
   datetime bar = iTime(_Symbol, InpTF, 0);
   if(bar == 0 || bar == g_lastBar)
      return;
   g_lastBar = bar;
   // … (continue processing)
}
As soon as a new bar is confirmed, the EA loops backward through the most recent 60 candles, extracting each bar’s open, high, low, close, and UNIX timestamp. These values are temporarily stored in fixed‑size arrays, then serialized into a compact JSON object that includes the symbol, timeframe, and all 60 sets of OHLC data and times.
double o[BARS], h[BARS], l[BARS], c[BARS];
long   t[BARS];
for(int i = 0; i < BARS; i++)
{
   int sh = i + 1;
   o[i] = iOpen(_Symbol, InpTF, sh);
   h[i] = iHigh(_Symbol, InpTF, sh);
   l[i] = iLow(_Symbol, InpTF, sh);
   c[i] = iClose(_Symbol, InpTF, sh);
   t[i] = (long)iTime(_Symbol, InpTF, sh);
}
string json = StringFormat(
   "{\"symbol\":\"%s\",\"timeframe\":%d,\"time\":[%s],\"open\":[%s],\"high\":[%s],\"low\":[%s],\"close\":[%s]}",
   _Symbol, InpTF, CSVInt(t), CSV(o), CSV(h), CSV(l), CSV(c)
);
Log("JSON-OUT: " + json);
With the JSON payload assembled, the EA makes a POST request to the configured Flask URL and waits up to the specified timeout. It captures any network or permission errors—logging detailed messages if the request fails—and otherwise receives the server’s JSON response as a text string for further processing.
char body[];
StringToCharArray(json, body, 0, StringLen(json));
char reply[];
string hdr = "Content-Type: application/json\r\n", respHdr;
int code = WebRequest("POST", InpURL, hdr, InpTimeout, body, reply, respHdr);
if(code == -1)
{
   Log("WebRequest failed: " + IntegerToString(GetLastError()));
   return;
}
string resp = CharArrayToString(reply, 0, -1, CP_UTF8);
Log("HTTP " + IntegerToString(code) + " RESP: " + resp);
After the HTTP call returns, the EA searches the response for two array entries—one named “patterns” and one named “signals.” It uses simple string‑search and split routines to convert those JSON arrays back into MQL5 string arrays, verifying that each array contains exactly 60 elements before moving on.
string patTxt, sigTxt, patt[], sigs[];
if(!ExtractArray(resp, "patterns", patTxt) ||
   !ExtractArray(resp, "signals", sigTxt) ||
   !ParseArray(patTxt, patt) ||
   !ParseArray(sigTxt, sigs) ||
   ArraySize(patt) != BARS ||
   ArraySize(sigs) != BARS)
{
   Log("Malformed patterns or signals");
   return;
}
For each of the 60 bars, the EA inspects the corresponding pattern and signal entries. Whenever a genuine pattern is flagged (i.e., not “None”), it calculates the correct candle shift, cleans up any old annotations, and creates a new text label at the bar’s high. Labels are color‑coded—lime for bullish signals, red for bearish—and each triggers a descriptive MetaTrader 5 alert with symbol, timeframe, direction, pattern name, and timestamp.
for(int i = 0; i < BARS; i++)
{
   string pat = patt[i], sig = sigs[i];
   if(pat == "" || pat == "None") continue;

   int shift = BARS - i;
   datetime tm = iTime(_Symbol, InpTF, shift);
   double y = iHigh(_Symbol, InpTF, shift);
   string obj = PREFIX + IntegerToString(shift);
   ObjectCreate(0, obj, OBJ_TEXT, 0, tm, y);
   ObjectSetString(0, obj, OBJPROP_TEXT, pat);

   color col = (sig == "bullish" ? clrLime : clrRed);
   ObjectSetInteger(0, obj, OBJPROP_COLOR, col);
   ObjectSetInteger(0, obj, OBJPROP_FONTSIZE, InpFontSize);
   ObjectSetInteger(0, obj, OBJPROP_SELECTABLE, false);

   Alert(StringFormat("%s %s %s pattern '%s' at %s",
                      _Symbol, EnumToString(InpTF), sig, pat,
                      TimeToString(tm, TIME_DATE|TIME_MINUTES)));
}
When the EA is removed or MetaTrader 5 is shut down, the deinitialization routine iterates through all chart objects prefixed with the EA’s label tag and deletes them. This ensures no stale labels linger on the chart once the EA is no longer active, leaving your workspace clean.
void OnDeinit(const int reason)
{
   for(int i = ObjectsTotal(0,0,-1)-1; i >= 0; i--)
   {
      string n = ObjectName(0, i, 0, -1);
      if(StringFind(n, PREFIX) == 0)
         ObjectDelete(0, n);
   }
   Log("EA removed");
}
- Python Flask Server Breakdown
When the Flask service starts, it configures INFO‑level logging to record every incoming request and internal event, both to the console and to a rotating log file. Immediately thereafter, the script inspects the TA‑Lib library and dynamically collects every candlestick‑pattern function (those prefixed with “CDL”) into an in‑memory dictionary. This dynamic discovery means the service automatically supports all existing and future TA‑Lib patterns without manual intervention, ensuring that any new pattern additions in TA‑Lib are available to your system as soon as the library is updated.
app = Flask(__name__)
logging.basicConfig(level=logging.INFO,
                    format='%(asctime)s %(levelname)s %(message)s')
app.logger.setLevel(logging.INFO)

# load all TA‑Lib candlestick functions
CDL_FUNCS = {
    name: getattr(talib, name)
    for name in talib.get_functions() if name.startswith("CDL")
}
Each time the EA sends a POST to the /patterns endpoint, the server reads the raw request payload, strips out any null bytes that MetaTrader 5 may append, and then attempts to decode it as JSON. Should parsing fail or if any of the required arrays (open, high, low, close, time) are missing, the server immediately returns a clear HTTP 400 error with a descriptive message. By validating the payload at the outset, you prevent malformed or incomplete data from propagating through the analysis pipeline and causing obscure downstream errors.
@app.route('/patterns', methods=['POST'])
def patterns():
    app.logger.info("Received /patterns request")
    try:
        raw = request.data
        if b'\x00' in raw:
            raw = raw.split(b'\x00', 1)[0]
        data = json.loads(raw.decode('utf-8'))
    except Exception as e:
        return jsonify(error="Invalid JSON", details=str(e)), 400
Once the JSON passes validation, the server extracts the five key arrays—timestamps and the four price series—and reverses their order so that index 0 corresponds to the oldest bar. It then converts the UNIX‑timestamp list into a pandas DatetimeIndex, ensuring that subsequent operations are time‑aware. If any arrays differ in length or contain non‑numeric entries, the service captures the discrepancy immediately and returns an error, guaranteeing that only perfectly aligned and correctly typed data reaches the detection logic.
try:
    symbol = data.get('symbol', 'Instrument')
    ts     = data.get('time', [])
    open_  = np.array(data['open'][::-1],  dtype=float)
    high   = np.array(data['high'][::-1],  dtype=float)
    low    = np.array(data['low'][::-1],   dtype=float)
    close  = np.array(data['close'][::-1], dtype=float)
    idx    = pd.to_datetime(np.array(ts[::-1], dtype='int64'), unit='s')
    app.logger.info(f"Loaded {len(open_)} bars for {symbol}")
except KeyError as ke:
    return jsonify(error=f"Missing field {ke}"), 400
except Exception as e:
    return jsonify(error="Bad field format", details=str(e)), 400
With clean NumPy arrays in hand, the service iterates through each TA‑Lib candlestick function and applies it across the entire series. Any non‑zero result is recorded as a candidate pattern hit. Two additional helper routines—one to validate Harami patterns and another to refine Engulfing patterns—are applied conditionally based on request flags, enforcing stricter criteria when required. Wrapping each TA‑Lib call in a try/except block means that a single problematic function or unexpected data shape cannot crash the entire service; instead, the routine simply skips that function and continues processing the rest.
n = len(open_)
all_hits = [[] for _ in range(n)]
for name, func in CDL_FUNCS.items():
    try:
        res = func(open_, high, low, close)
    except Exception:
        continue
    for i, v in enumerate(res):
        if v == 0:
            continue
        if name == "CDLHARAMI" and fh and not is_manual_harami(open_, close, i, tol=HARAMI_TOL):
            continue
        if name == "CDLENGULFING" and fe and not is_manual_engulfing(open_, close, i, tol=ENGULF_TOL):
            continue
        all_hits[i].append((name, v))
Since multiple patterns can register on the same bar, the service uses a small, configurable priority list—preferring Engulfing over Harami and Harami over Doji—to select the dominant pattern when conflicts arise. If none of the priority patterns are present, it chooses the one with the largest absolute TA‑Lib output. The numeric sign of that chosen output is then mapped to a “bullish” or “bearish” label. This deterministic, single‑pattern‑per‑bar approach ensures each candle is tagged with one clear signal, simplifying downstream chart overlays and alert logic.
PRIORITY = ["CDLENGULFING", "CDLHARAMI", "CDLDOJI"]
detected = [None] * n
signals  = [None] * n
for i, hits in enumerate(all_hits):
    if not hits:
        continue
    pick = next(((nm, val) for pat in PRIORITY for nm, val in hits if nm == pat), None)
    if pick is None:
        pick = max(hits, key=lambda x: abs(x[1]))
    nm, val = pick
    detected[i] = nm
    signals[i]  = "bullish" if val > 0 else "bearish"
Next, the script builds a pandas DataFrame from the four price arrays and the datetime index, then adds two new columns: one for the detected pattern name and another for its bullish/bearish signal. To prepare for visual annotation, it calculates a small offset based on the overall price range and constructs a list of scatter overlays—placing green upward arrows just below bar lows for bullish signals and red downward arrows just above bar highs for bearish signals. By anchoring marker positions relative to the chart’s dynamic range, you avoid visual clutter and ensure consistency across different instruments and timeframes.
df = pd.DataFrame({"Open": open_, "High": high, "Low": low, "Close": close}, index=idx)
df["Pattern"] = pd.Series(detected, index=idx).fillna("None")
df["Signal"]  = pd.Series(signals,  index=idx).fillna("")

df.sort_index(inplace=True)
adds = []
price_rng = df["High"].max() - df["Low"].min()
for tstamp, row in df.iterrows():
    if row["Pattern"] == "None":
        continue
    if row["Signal"] == "bullish":
        y, marker, color = row["Low"] - price_rng*0.005, "^", "green"
    else:
        y, marker, color = row["High"] + price_rng*0.005, "v", "red"
    adds.append(mpf.make_addplot(
        [y if i == tstamp else np.nan for i in df.index],
        type="scatter", marker=marker, markersize=80, color=color
    ))
Finally, the service defines a custom candle‑color scheme (for example, green for rising bars and red for falling bars) and renders a full candlestick chart with mplfinance, incorporating the previously prepared scatter markers. A legend is added to map both candle direction and pattern markers for easy interpretation. The figure is resized for optimal clarity, saved to a unique PNG file in the server directory, and then closed to free memory. The JSON response delivers the reversed patterns and signals lists—so index 0 once again represents the most recent bar—an optional log summary, and the filename of the saved chart, ready for immediate use by the EA or integration into other analytics tools.
mc = make_marketcolors(up='green', down='red', edge='inherit', wick='inherit')
style = make_mpf_style(marketcolors=mc, base_mpf_style='default')
fig, axes = mpf.plot(df, type="candle", style=style,
                     title=f"{symbol} Patterns", addplot=adds,
                     volume=False, returnfig=True, tight_layout=True)
axes[0].legend(handles=[
    Line2D([0],[0],color='green',lw=4,label='Buy Candle'),
    Line2D([0],[0],color='red',lw=4,label='Sell Candle'),
    Line2D([0],[0],marker='^',linestyle='None',color='green',markersize=12,label='Buy Signal'),
    Line2D([0],[0],marker='v',linestyle='None',color='red',markersize=12,label='Sell Signal')
], loc='upper left', frameon=True)

fname = f"pattern_chart_{uuid.uuid4().hex[:8]}.png"
fig.savefig(path := os.path.join(os.path.dirname(__file__), fname), dpi=100)
plt.close(fig)
app.logger.info(f"Chart saved: {fname}")

return jsonify(
    patterns=[p or "None" for p in detected[::-1]],
    signals =[s or "none" for s in signals [::-1]],
    log=[],
    chart=fname
)
Testing and Outcomes
Below is a presentation of our tested outcomes.
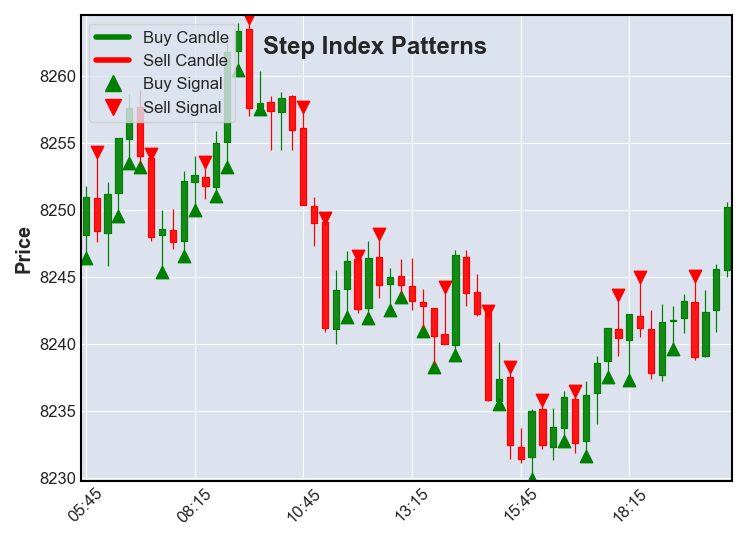
Testing on Step Index
MQL5 Logs
The MQL5 Experts tab displays logs showing the data sent to Python, the patterns received, and the name of each currently detected bar. This information is updated at the close of each new bar, accompanied by an alert.
2025.07.15 22:56:50.294 Candlestick Label 2 (Step Index,M15)    [CSLAB] JSON-OUT: {"symbol":"Step Index","timeframe":0,"time":[1752558300,1752559200,
1752560100,1752561000,1752561900,1752562800,1752563700,1752564600,1752565500,1752566400,1752567300,1752568200,
1752569100,1752570000,1752570900,1752571800,1752572700,1752573600,1752574500,1752575400,1752576300,1752577200,1752578100,1752579000,
1752579900,1752580800,1752581700,1752582600,1752583500,1752584400,1752585300,1752586200,1752587100,1752588000,1752588900,1752589800,
1752590700,1752591600,1752592500,1752593400,17525943
2025.07.15 22:56:50.804 Candlestick Label 2 (Step Index,M15)    [CSLAB] HTTP 200 RESP: {"chart":"pattern_chart_e06f7a61.png","log":[],"patterns":
["CDLENGULFING","CDLHARAMI","None","CDLCLOSINGMARUBOZU","CDLHARAMI","CDLHIKKAKE","CDLENGULFING","CDLHIGHWAVE","None","CDLLONGLINE",
"CDLHIGHWAVE","CDLSHORTLINE","CDLSHORTLINE","CDLHIKKAKE","CDLHARAMI","CDLENGULFING","CDLDOJI","None","None","None","CDLCLOSINGMARUBOZU",
"None","CDLBELTHOLD","None","CDLHARAMI","CDLBELTHOLD","CDLHIKKAKE","CDLENGULFING","CDLHIKKAKE","CDLHIKKAKE","None","CDLDOJI","CDLHAMMER",
"CDLHARAMI","CDLENGULFING"
2025.07.15 22:56:50.804 Candlestick Label 2 (Step Index,M15)
2025.07.15 22:56:50.804 Candlestick Label 2 (Step Index,M15)    Alert: Step Index PERIOD_CURRENT bullish pattern 'CDLENGULFING' at 2025.07.15 05:45
Command Prompt Logs
- POST /patterns: A client (your MQL5 EA) issued an HTTP POST request to the /patterns endpoint.
- HTTP/1.1: The request used the HTTP 1.1 protocol.
- 200: The server responded with status code 200, meaning “OK”—your endpoint processed the request successfully.
2025-07-15 22:54:52,246 INFO Received /patterns request
2025-07-15 22:54:52,250 INFO Loaded 60 bars for Step Index
2025-07-15 22:54:52,808 INFO Chart saved: pattern_chart_a77f2eec.png
2025-07-15 22:54:52,810 INFO 127.0.0.1 - - [15/Jul/2025 22:54:52] "POST /patterns HTTP/1.1" 200 -
2025-07-15 22:55:00,040 INFO Received /patterns request
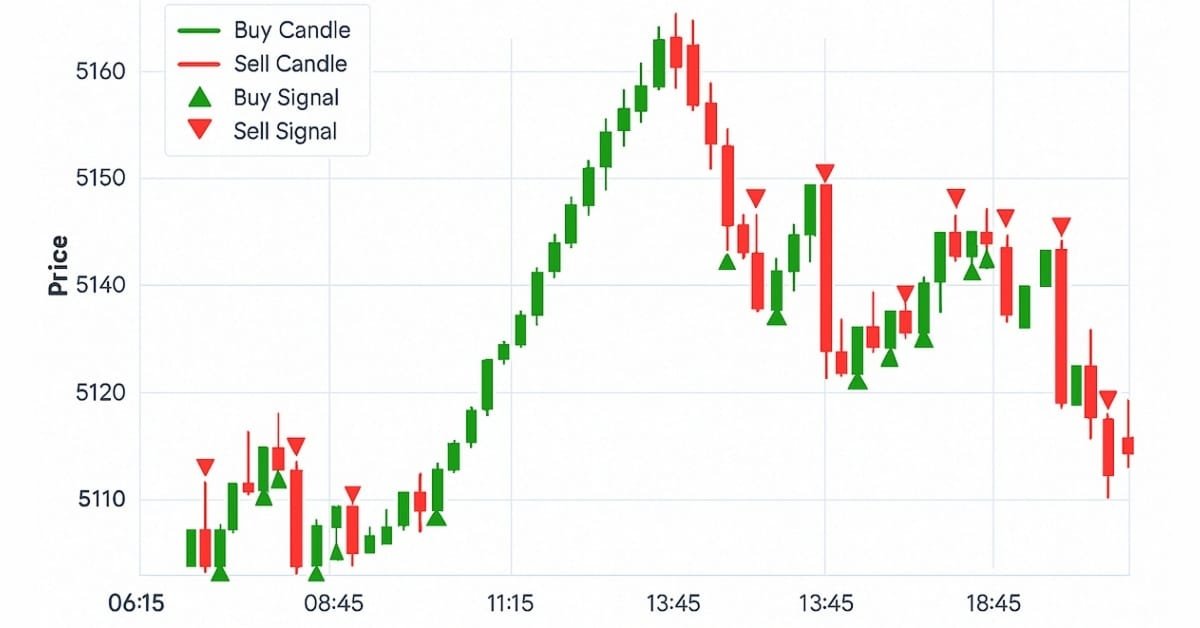
Below are chart plots for the same patterns detected, illustrating the “Step Index” over time. The charts are generated using Matplotlib, TA-Lib, and mplfinance, displaying both price bars and the candlestick signals identified by our system:
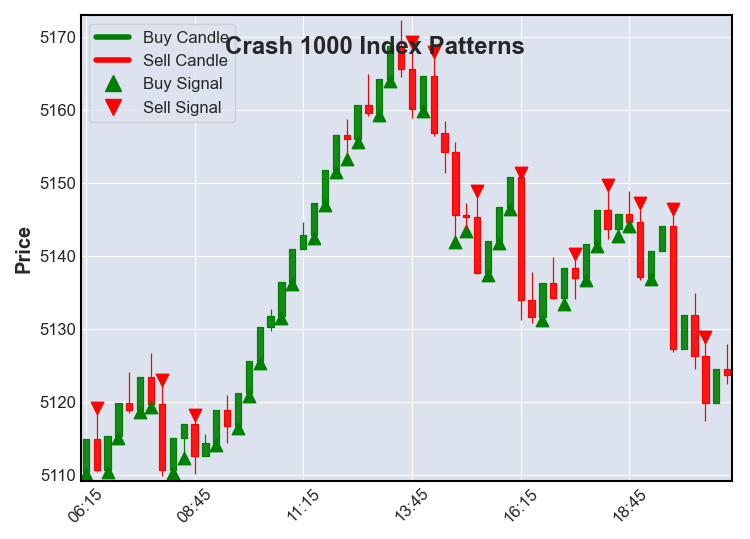
Candles
- Green bodies indicate periods where the close was above the open (bullish candles).
- Red bodies indicate periods where the close was below the open (bearish candles).
Signals
- Green markers beneath the bars represent buy signals (bullish patterns).
- Red markers above the bars denote sell signals (bearish patterns).
Testing on Crash 1000 Index
MQL5 Logs
2025.07.15 23:30:00.299 Candlestick Label 2 (Crash 1000 Index,M15)      [CSLAB] JSON-OUT: {"symbol":"Crash 1000 Index","timeframe":0,"time":[1752561000,1752561900,
1752562800,1752563700,1752564600,1752565500,1752566400,1752567300,1752568200,1752569100,1752570000,1752570900,1752571800,1752572700,1752573600,1752574500,1752575400
,1752576300,1752577200,1752578100,1752579000,1752579900,1752580800,1752581700,1752582600,1752583500,1752584400,1752585300,1752586200,1752587100,1752588000,1752588900,
1752589800,1752590700,1752591600,1752592500,1752593400,1752594300,1752595200,1752596100,17
2025.07.15 23:30:02.749 Candlestick Label 2 (Crash 1000 Index,M15)      [CSLAB] HTTP 200 RESP: {"chart":"pattern_chart_ebd72b47.png","log":[],"patterns":
["CDLCLOSINGMARUBOZU","CDLBELTHOLD","CDLBELTHOLD","None","CDLBELTHOLD","CDLHIKKAKE","CDLENGULFING","CDLBELTHOLD","CDLHARAMI","CDLENGULFING","None","CDLBELTHOLD",
"None","CDLBELTHOLD","CDLBELTHOLD","CDLBELTHOLD","None","CDLBELTHOLD","CDLBELTHOLD","None","CDLBELTHOLD","CDLBELTHOLD","CDLBELTHOLD","CDLDOJI","CDLBELTHOLD","None",
"CDLSHORTLINE","CDLSHORTLINE","None","CDLENGULFING","CDLHARAMI","CDLCLOSINGMARUBOZU","None","CDLMATCHINGL
2025.07.15 23:30:02.749 Candlestick Label 2 (Crash 1000 Index,M15)
2025.07.15 23:30:02.769 Candlestick Label 2 (Crash 1000 Index,M15)      Alert: Crash 1000 Index PERIOD_CURRENT bearish pattern 'CDLCLOSINGMARUBOZU' at 2025.07.15 06:30
Command Prompt Logs
2025-07-15 23:30:02,719 INFO Chart saved: pattern_chart_ebd72b47.png
2025-07-15 23:30:02,735 INFO 127.0.0.1 - - [15/Jul/2025 23:30:02] "POST /patterns HTTP/1.1" 200 -
Python candlestick patterns plot
The plot provides a clear view of how each detected pattern signals and what occurs afterward.
Conclusion
In this architecture, MetaTrader 5 remains dedicated to its strengths—real‑time market data capture, chart object management, and native alerting—while a lightweight Flask service leverages TA‑Lib and mplfinance to perform all candlestick‑pattern computations and generate polished visualizations. By transmitting sixty bars of OHLC and timestamp data as JSON, the EA achieves sub‑second analysis without increasing its own footprint, and the Python backend delivers both granular pattern labels and complete annotated charts ready for review or distribution.
This clear separation of responsibilities yields a truly modular system: you can refine pattern‑detection rules, adjust signal‑filter tolerances, or extend the EA’s alert logic independently, without risk of cross‑contamination. Packaging the Flask service—whether in a Docker container for consistent deployment or behind an authenticated API gateway—further enhances portability and security.
I encourage you to apply this framework to your preferred instruments, experiment with custom indicator overlays, and integrate the generated charts into broader analytics platforms. With this hybrid approach, you harness the full power of both MQL5 and modern Python libraries, transforming manual chart reading into an automated, precision‑driven workflow.
Warning: All rights to these materials are reserved by MetaQuotes Ltd. Copying or reprinting of these materials in whole or in part is prohibited.
This article was written by a user of the site and reflects their personal views. MetaQuotes Ltd is not responsible for the accuracy of the information presented, nor for any consequences resulting from the use of the solutions, strategies or recommendations described.

- Free trading apps
- Over 8,000 signals for copying
- Economic news for exploring financial markets
You agree to website policy and terms of use