Articles on data analysis and statistics in MQL5
Articles on mathematical models and laws of probability are interesting for many traders. Mathematics is the basis of technical indicators, and statistics is required to analyze trading results and develop strategies.
Read about the fuzzy logic, digital filters, market profile, Kohonen maps, neural gas and many other tools that can be used for trading.
Add a new article

You are missing trading opportunities:
- Free trading apps
- Over 8,000 signals for copying
- Economic news for exploring financial markets
Registration
Log in
You agree to website policy and terms of use
If you do not have an account, please register

Data label for time series mining (Part 3):Example for using label data
This series of articles introduces several time series labeling methods, which can create data that meets most artificial intelligence models, and targeted data labeling according to needs can make the trained artificial intelligence model more in line with the expected design, improve the accuracy of our model, and even help the model make a qualitative leap!

Automating Trading Strategies in MQL5 (Part 39): Statistical Mean Reversion with Confidence Intervals and Dashboard
In this article, we develop an MQL5 Expert Advisor for statistical mean reversion trading, calculating moments like mean, variance, skewness, kurtosis, and Jarque-Bera statistics over a specified period to identify non-normal distributions and generate buy/sell signals based on confidence intervals with adaptive thresholds

MQL5 Wizard techniques you should know (Part 04): Linear Discriminant Analysis
Todays trader is a philomath who is almost always looking up new ideas, trying them out, choosing to modify them or discard them; an exploratory process that should cost a fair amount of diligence. These series of articles will proposition that the MQL5 wizard should be a mainstay for traders in this effort.

Data Science and Machine Learning (Part 18): The battle of Mastering Market Complexity, Truncated SVD Versus NMF
Truncated Singular Value Decomposition (SVD) and Non-Negative Matrix Factorization (NMF) are dimensionality reduction techniques. They both play significant roles in shaping data-driven trading strategies. Discover the art of dimensionality reduction, unraveling insights, and optimizing quantitative analyses for an informed approach to navigating the intricacies of financial markets.

Developing a Replay System — Market simulation (Part 15): Birth of the SIMULATOR (V) - RANDOM WALK
In this article we will complete the development of a simulator for our system. The main goal here will be to configure the algorithm discussed in the previous article. This algorithm aims to create a RANDOM WALK movement. Therefore, to understand today's material, it is necessary to understand the content of previous articles. If you have not followed the development of the simulator, I advise you to read this sequence from the very beginning. Otherwise, you may get confused about what will be explained here.

Overcoming ONNX Integration Challenges
ONNX is a great tool for integrating complex AI code between different platforms, it is a great tool that comes with some challenges that one must address to get the most out of it, In this article we discuss the common issues you might face and how to mitigate them.

Neural networks made easy (Part 17): Dimensionality reduction
In this part we continue discussing Artificial Intelligence models. Namely, we study unsupervised learning algorithms. We have already discussed one of the clustering algorithms. In this article, I am sharing a variant of solving problems related to dimensionality reduction.

Data Science and ML (Part 26): The Ultimate Battle in Time Series Forecasting — LSTM vs GRU Neural Networks
In the previous article, we discussed a simple RNN which despite its inability to understand long-term dependencies in the data, was able to make a profitable strategy. In this article, we are discussing both the Long-Short Term Memory(LSTM) and the Gated Recurrent Unit(GRU). These two were introduced to overcome the shortcomings of a simple RNN and to outsmart it.

Discrete Hartley transform
In this article, we will consider one of the methods of spectral analysis and signal processing - the discrete Hartley transform. It allows filtering signals, analyzing their spectrum and much more. The capabilities of DHT are no less than those of the discrete Fourier transform. However, unlike DFT, DHT uses only real numbers, which makes it more convenient for implementation in practice, and the results of its application are more visual.

Population optimization algorithms: Shuffled Frog-Leaping algorithm (SFL)
The article presents a detailed description of the shuffled frog-leaping (SFL) algorithm and its capabilities in solving optimization problems. The SFL algorithm is inspired by the behavior of frogs in their natural environment and offers a new approach to function optimization. The SFL algorithm is an efficient and flexible tool capable of processing a variety of data types and achieving optimal solutions.

Quantitative analysis in MQL5: Implementing a promising algorithm
We will analyze the question of what quantitative analysis is and how it is used by major players. We will create one of the quantitative analysis algorithms in the MQL5 language.

MQL5 Trading Tools (Part 8): Enhanced Informational Dashboard with Draggable and Minimizable Features
In this article, we develop an enhanced informational dashboard that upgrades the previous part by adding draggable and minimizable features for improved user interaction, while maintaining real-time monitoring of multi-symbol positions and account metrics.

Price Action Analysis Toolkit Development (Part 29): Boom and Crash Interceptor EA
Discover how the Boom & Crash Interceptor EA transforms your charts into a proactive alert system-spotting explosive moves with lightning-fast velocity scans, volatility surge checks, trend confirmation, and pivot-zone filters. With crisp green “Boom” and red “Crash” arrows guiding your every decision, this tool cuts through the noise and lets you capitalize on market spikes like never before. Dive in to see how it works and why it can become your next essential edge.

MQL5 Wizard Techniques you should know (Part 25): Multi-Timeframe Testing and Trading
Strategies that are based on multiple time frames cannot be tested in wizard assembled Expert Advisors by default because of the MQL5 code architecture used in the assembly classes. We explore a possible work around this limitation for strategies that look to use multiple time frames in a case study with the quadratic moving average.

Price Action Analysis Toolkit Development (Part 50): Developing the RVGI, CCI and SMA Confluence Engine in MQL5
Many traders struggle to identify genuine reversals. This article presents an EA that combines RVGI, CCI (±100), and an SMA trend filter to produce a single clear reversal signal. The EA includes an on-chart panel, configurable alerts, and the full source file for immediate download and testing.

Population optimization algorithms: ElectroMagnetism-like algorithm (ЕМ)
The article describes the principles, methods and possibilities of using the Electromagnetic Algorithm in various optimization problems. The EM algorithm is an efficient optimization tool capable of working with large amounts of data and multidimensional functions.

Analyzing all price movement options on the IBM quantum computer
We will use a quantum computer from IBM to discover all price movement options. Sounds like science fiction? Welcome to the world of quantum computing for trading!

William Gann methods (Part III): Does Astrology Work?
Do the positions of planets and stars affect financial markets? Let's arm ourselves with statistics and big data, and embark on an exciting journey into the world where stars and stock charts intersect.

Expert Advisor based on the universal MLP approximator
The article presents a simple and accessible way to use a neural network in a trading EA that does not require deep knowledge of machine learning. The method eliminates the target function normalization, as well as overcomes "weight explosion" and "network stall" issues offering intuitive training and visual control of the results.

MQL5 Trading Tools (Part 21): Adding Cyberpunk Theme to Regression Graphs
In this article, we enhance the regression graphing tool in MQL5 by adding a cyberpunk theme mode with neon glows, animations, and holographic effects for immersive visualization. We integrate theme toggling, dynamic backgrounds with stars, glowing borders, and neon points/lines, while maintaining standard mode compatibility. This dual-theme system elevates pair analysis with futuristic aesthetics, supporting real-time updates and interactions for engaging trading insights.

Non-linear regression models on the stock exchange
Non-linear regression models on the stock exchange: Is it possible to predict financial markets? Let's consider creating a model for forecasting prices for EURUSD, and make two robots based on it - in Python and MQL5.
MQL5 Trading Tools (Part 21): Adding Cyberpunk Theme to Regression Graphs
In this article, we enhance the regression graphing tool in MQL5 by adding a cyberpunk theme mode with neon glows, animations, and holographic effects for immersive visualization. We integrate theme toggling, dynamic backgrounds with stars, glowing borders, and neon points/lines, while maintaining standard mode compatibility. This dual-theme system elevates pair analysis with futuristic aesthetics, supporting real-time updates and interactions for engaging trading insights.

Price Action Analysis Toolkit Development Part (4): Analytics Forecaster EA
We are moving beyond simply viewing analyzed metrics on charts to a broader perspective that includes Telegram integration. This enhancement allows important results to be delivered directly to your mobile device via the Telegram app. Join us as we explore this journey together in this article.

Creating 3D bars based on time, price and volume
The article dwells on multivariate 3D price charts and their creation. We will also consider how 3D bars predict price reversals, and how Python and MetaTrader 5 allow us to plot these volume bars in real time.

Category Theory in MQL5 (Part 8): Monoids
This article continues the series on category theory implementation in MQL5. Here we introduce monoids as domain (set) that sets category theory apart from other data classification methods by including rules and an identity element.

Developing a Replay System — Market simulation (Part 05): Adding Previews
We have managed to develop a way to implement the market replay system in a realistic and accessible way. Now let's continue our project and add data to improve the replay behavior.

MQL5 Trading Tools (Part 6): Dynamic Holographic Dashboard with Pulse Animations and Controls
In this article, we create a dynamic holographic dashboard in MQL5 for monitoring symbols and timeframes with RSI, volatility alerts, and sorting options. We add pulse animations, interactive buttons, and holographic effects to make the tool visually engaging and responsive.

MQL5 Trading Tools (Part 7): Informational Dashboard for Multi-Symbol Position and Account Monitoring
In this article, we develop an informational dashboard in MQL5 for monitoring multi-symbol positions and account metrics like balance, equity, and free margin. We implement a sortable grid with real-time updates, CSV export, and a glowing header effect to enhance usability and visual appeal.

Developing a Replay System (Part 53): Things Get Complicated (V)
In this article, we'll cover an important topic that few people understand: Custom Events. Dangers. Advantages and disadvantages of these elements. This topic is key for those who want to become a professional programmer in MQL5 or any other language. Here we will focus on MQL5 and MetaTrader 5.

Price Action Analysis Toolkit Development (Part 2): Analytical Comment Script
Aligned with our vision of simplifying price action, we are pleased to introduce another tool that can significantly enhance your market analysis and help you make well-informed decisions. This tool displays key technical indicators such as previous day's prices, significant support and resistance levels, and trading volume, while automatically generating visual cues on the chart.

Neuro-symbolic systems in algorithmic trading: Combining symbolic rules and neural networks
The article describes the experience of developing a hybrid trading system that combines classical technical analysis with neural networks. The author provides a detailed analysis of the system architecture from basic pattern analysis and neural network structure to the mechanisms behind trading decisions, and shares real code and practical observations.
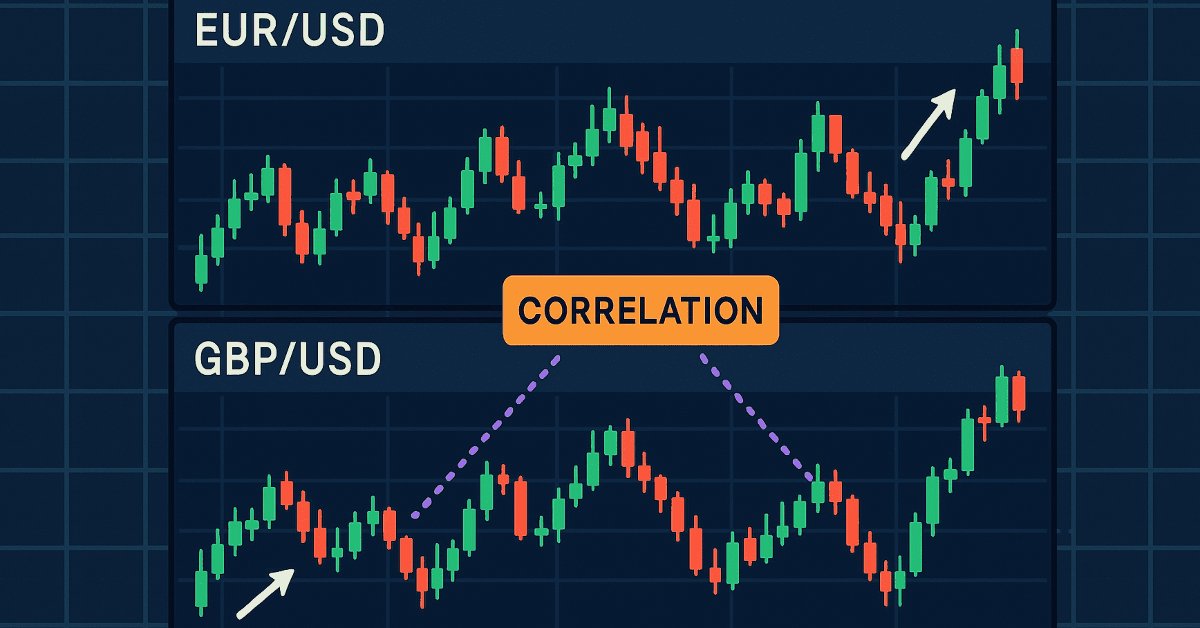
Price Action Analysis Toolkit Development (Part 20): External Flow (IV) — Correlation Pathfinder
Correlation Pathfinder offers a fresh approach to understanding currency pair dynamics as part of the Price Action Analysis Toolkit Development Series. This tool automates data collection and analysis, providing insight into how pairs like EUR/USD and GBP/USD interact. Enhance your trading strategy with practical, real-time information that helps you manage risk and spot opportunities more effectively.

MetaTrader 5 and the MQL5 Economic Calendar: How to Turn News into a Reproducible Trading System
The article presents a systematic approach to news trading in MetaTrader 5 using the built-in economic calendar: data structure, API functions, time synchronization rules, and event filtering. Methods of caching and incremental updating without overloading the server are described. The article also provides a working mechanism for exporting history to an .EX5 resource for deterministic testing using the same algorithm.

Data Science and Machine Learning (Part 25): Forex Timeseries Forecasting Using a Recurrent Neural Network (RNN)
Recurrent neural networks (RNNs) excel at leveraging past information to predict future events. Their remarkable predictive capabilities have been applied across various domains with great success. In this article, we will deploy RNN models to predict trends in the forex market, demonstrating their potential to enhance forecasting accuracy in forex trading.

From Novice to Expert: Statistical Validation of Supply and Demand Zones
Today, we uncover the often overlooked statistical foundation behind supply and demand trading strategies. By combining MQL5 with Python through a Jupyter Notebook workflow, we conduct a structured, data-driven investigation aimed at transforming visual market assumptions into measurable insights. This article covers the complete research process, including data collection, Python-based statistical analysis, algorithm design, testing, and final conclusions. To explore the methodology and findings in detail, read the full article.

MetaTrader Meets Google Sheets with Pythonanywhere: A Guide to Secure Data Flow
This article demonstrates a secure way to export MetaTrader data to Google Sheets. Google Sheet is the most valuable solution as it is cloud based and the data saved in there can be accessed anytime and from anywhere. So traders can access trading and related data exported to google sheet and do further analysis for future trading anytime and wherever they are at the moment.

From Novice to Expert: Collaborative Debugging in MQL5
Problem-solving can establish a concise routine for mastering complex skills, such as programming in MQL5. This approach allows you to concentrate on solving problems while simultaneously developing your skills. The more problems you tackle, the more advanced expertise is transferred to your brain. Personally, I believe that debugging is the most effective way to master programming. Today, we will walk through the code-cleaning process and discuss the best techniques for transforming a messy program into a clean, functional one. Read through this article and uncover valuable insights.

Data Science and ML(Part 30): The Power Couple for Predicting the Stock Market, Convolutional Neural Networks(CNNs) and Recurrent Neural Networks(RNNs)
In this article, We explore the dynamic integration of Convolutional Neural Networks (CNNs) and Recurrent Neural Networks (RNNs) in stock market prediction. By leveraging CNNs' ability to extract patterns and RNNs' proficiency in handling sequential data. Let us see how this powerful combination can enhance the accuracy and efficiency of trading algorithms.

Data label for timeseries mining (Part 2):Make datasets with trend markers using Python
This series of articles introduces several time series labeling methods, which can create data that meets most artificial intelligence models, and targeted data labeling according to needs can make the trained artificial intelligence model more in line with the expected design, improve the accuracy of our model, and even help the model make a qualitative leap!

Statistical Arbitrage Through Cointegrated Stocks (Part 1): Engle-Granger and Johansen Cointegration Tests
This article aims to provide a trader-friendly, gentle introduction to the most common cointegration tests, along with a simple guide to understanding their results. The Engle-Granger and Johansen cointegration tests can reveal statistically significant pairs or groups of assets that share long-term dynamics. The Johansen test is especially useful for portfolios with three or more assets, as it calculates the strength of cointegrating vectors all at once.