
MQL5 Wizard techniques you should know (Part 06): Fourier Transform
Introduction
Fourier transform is a method of decomposing a wave of data points into possible constituent parts that was introduced by Joseph Fourier. Integrating over all possible frequencies in the Fourier transform gives us a spectrum of components because it breaks down the original function into its constituents, each corresponding to a different frequency component.
The Fourier transform, by definition, ranges from minus infinity to plus infinity:
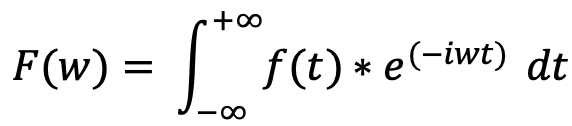
where F(w) is the Fourier transform of the function f(t), i is the imaginary unit, w is the angular frequency, and e is the exponential function.
In practice though when using the transform the number of epicycles is predetermined to a small manageable number. The more epicycles (component frequencies) one uses the more accurately he can describe the original curve however at a certain point it becomes inefficient as more epicycles do not produce any meaningful difference in the curve that is being described into parts.
So, this leads to users of the transform settling for a discrete finite number n of epicycles. And this slightly modifies our formula above to this.
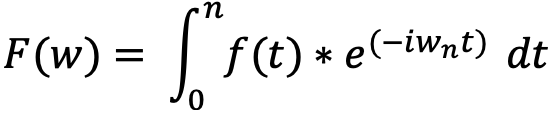
When we add all the possible frequencies, we are summing up the contribution of each to the original function. Each frequency component is represented by a complex number that includes both magnitude and phase information. The magnitude represents the amplitude of the wave, while the phase represents the shift in time of the wave. So, our modified equation above sums over n components and each of those n parts have a wave with various values at times t.
In solving for the constituent parts the key is to find the f(t) of each component which constitutes both a real and imaginary part. The Fourier system re-writes any function f(t) for the interval 0 to 2 pi with complex numbers as this ‘infinite sum’. It is ‘infinite’ in quotes because it adds up to zero.
![]()
With our equation above, in solving for say the coefficient: C 2 ,
We would multiply both sides of the equation with: e-2it
On integration this simplifies our equation to:
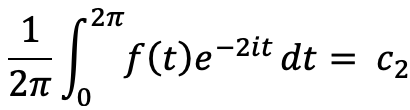
So, the 2 (and not the 2 in 2 pi !) can be replaced by n to get any other coefficient in the f(t) equation above. All these calculations are handled by the class ‘CFastFourierTransform’ that is listed in the file: ‘Math\Alglib\fasttransforms.mqh’ so all we have to do is use this library.
Applications
Before we do so with very specific examples, it may be useful to first take a wider view on how traders can benefit from this ability to have a wave of data points broken into constituent parts. There are very many applications. Here is a possible short list:
- Analyzing stock price movements: If we collect stock price data and arrange it in a time series format we could apply the Fourier Transform to the series data to obtain its frequency components Analysis of these separate frequency components to identify patterns and trends in the data can help to make better informed trading decisions. For example, a trader may notice that a certain stock has a recurring peak in its frequency spectrum at a certain frequency, indicating a repeating pattern in the stock's price movements. This observation can be used to buy the stock when it is at a low price and sell it when it is at a high price, based on the expectation that the price will follow this observed pattern. However, over time this needs to be monitored often and ensure that the patterns remain applicable.
- Analyzing long-term cycles: We would need to choose between a business cycle or a market cycle. If we choose a business cycle our possible data sources could include:
- Gross Domestic Product (GDP): One of the most important indicators of economic growth that measures the total value of goods and services produced in a country during a given period that is typically a year.
- Employment Data: Such as the unemployment rate and or job creation numbers, can provide insights into the health of the labor market. Rising unemployment or stagnant job growth can signal a weakening economy.
- Industrial Production Data: Which could include the Industrial Production Index, which measures the output of the manufacturing, mining, and utility sectors, can indicate the overall health of the economy, Purchasing Manager’s Index, Capacity Utilization, Durable goods orders, Manufacturing employment, and many others .
- Consumer Confidence Data: This would include Consumer Confidence Index, University of Michigan Consumer Sentiment Index, Conference Board Consumer Confidence Index, Retail Sales, Consumer Credit, to name but a few.
- Interest Rates Data: Interest rates can impact business investment and consumer spending, both of which may affect the economy’s performance. Rising interest rates tend to dampen investment and spending, while falling interest rates can encourage investment and spending factors which tend to eventually affect the price of publicly listed company stocks.
- Inflation Data: This measures the rate of increase in prices for goods and services, and thus can provide some clarity into the state of an economy. High inflation can indicate an overheated economy, while low inflation can signal a weak economy. This is also another dataset that can influence trader’s decisions in buying various stocks and therefore is a key data source.
- Housing Data: This could cover home sales and construction starts, and can shed light on the health of the housing market, which is an important component of the economy and could be relevant to a particular stock a trader has in his portfolio.
Conversely some market cycle data sources could include:
- Price/Earnings (P/E) Ratio: This common metric compares a company's stock price to its earnings per share (EPS), and can be used to gauge whether the market is overvaluing a stock (on a high reading), or if market is undervaluing the stock when the reading is typically below 15 or even 10 depending on the geography of the market.
- Dividend Yields: These measure the amount of dividend paid out for each share per share price. Low dividend yields may suggest an overvalued stock, while high dividend yields could indicate undervaluation.
- Technical Indicators: A list that includes moving averages, momentum indicators, and relative strength indicators, can help summarize current price action for a stock. For example, when a stock price is trading above its 200-day moving average, it can indicate a bullish trend, while trading below the 200-day moving average can signal a bearish trend so in this case our data could be the spread between the price and its 200-day moving average.
- Market Breadth: Here we measure the number of stocks that are advancing versus those that are declining in a given market. When a high number of stocks are advancing, it can suggest that the market is healthy, while declining breadth can indicate weakness. Such data could be sourced from 3rd parties that usually bundle it with other data streams for a one-time fee or in some cases a subscription.
- Volatility: This is measured by indicators like the VIX and helps in assessing market risk and investor sentiment. It is often positively correlated with market-risk and negative sentiment.
Once we gather our relevant financial data from the above possible sources we would sequence it into a time series then apply the Fourier Transform to break it into its frequency components. Analyzing these constituent parts by say looking for repeating cycles in the data could improve our trading decisions. For instance, a trader may use this to spot a recurring cycle in interest rate data that tends to last for several years and has a lagging positive correlation with his traded stock or ETF. Armed with this knowledge he may invest in long-term positions when the market is at a low point and hold drawdown positions over extended periods and only exit them when the interest data correlation turns negative or foretells a downturn.
- Signal processing: In looking at signals we could consider price wave patterns that are before major break-outs whether to the upside or downside. For instance, a more specific data source here could look at only gartley pattern in the price history of a particular stock while omitting the other data. This wave price data would be logged as a time series (even though considerable gaps would exist since the pattern is rare). A Fourier Transform would be applied to each wave in this series. We then could set a frequency threshold for the component Fourier waves (based on our observations with correlation to the eventual breakouts) and omit those that do not meet the threshold. We would then use these filtered few waves to make our projections going forward. This price buffer could be for a stock, forex-pair, or even a commodity. The principle would be the same.
- Risk management: If we dwell on credit risk since other kinds of risk, like market risk, could overlap with what we’ve already covered above, these could be our data sources:
- Default rates: Quarterly or annual default rates for a particular Banking market, say the US, can be used to analyze credit risk for the US and therefore the performance of the S&P 500.
- Credit spreads: Daily or weekly data on credit spreads between corporate bonds and treasury bonds can help assess credit risk associated with changes in market perceptions of creditworthiness.
- Loan delinquencies: Which are not the same thing as default rates can be sourced Monthly or quarterly for a particular bank or lender and used to look into the credit risk associated with this bank’s loan portfolio if a trader is considering buying this particular bank stock.
- Credit ratings: This data though not as serialized like most data, it can still be gathered over a reasonable historic period quarterly or annually for a specific company and used to evaluate the worthiness of a company’s commercial paper or even its long-term bonds.
- Credit default swaps (CDS): Which typically amount to a lender’s insurance for his loan(s) can be sourced Daily or weekly on the prices of its contracts and used to analyze credit risk associated with changes in market perceptions of creditworthiness.
The data from any one of these sources would be composed into a time series and then the Fourier Transform would be applied to the time series data to obtain the frequency components. Analysis of which component best correlates with eventual financial shocks or more specific stock price swings, could help in developing effective risk management strategies.
- Option pricing: Historical data on underlying price, strike price, time until expiration, volatility, interest rates and dividends for options can be got from a number of sources for example the Bloomberg terminal. Notice how each of these data sets are a ‘frequency component’ for the option’s price. With these multiple data sets, there are many ways one could go about his analysis. Keep in mind there is no consensus per se on what the price of an option is at any given time what we do have are ‘best-practice’ pricing models like Black-Scholes. But these are not always reliable. One approach there could be could be to simply decompose the underlying price at a fixed period before expiration and look at which frequency component best correlates with the difference between the underlying and the strike price at expiration. This analysis could be useful for European options but the American type since they can be exercised before expiration do present more complex challenges.
- Sentiment analysis: We have come a long way as far as scraping the web for data goes and today Social Media Management Software is a big deal. Names like Zoho Social, Hootsuite, Khoros Marketing to name but a few are quickly gaining a foothold as power houses. Gone are the days of counting, like, dislikes and calling it a day; today text analysis (and coupled with AI) is allowing businesses to better quantify their customer engagement and satisfaction with their products/ services. So, a lot of data can be gathered. As a trader interested in two rival companies, you may want to know whether there is any correlation between length of engagement in reviewing a product and eventual sales of the product 3 months or 6 months down the line. Converting the engagement data into a time series and decomposing it into constituent parts allows to identify which component best correlates to our target (in this case future sales) and this system then guides our decision to buy the stock and in what quantity.
- Machine learning: The Fourier transform for this application (and there are multiple others) could help vectorize input data by breaking it into constituent frequencies. If we just had different close price waves as input data each of these waves could be decomposed into n waves where each new wave is now part of a vector of waves of the old unsplit wave. This provides us more identifying information for any new data point we need to evaluate and it allows more accurate comparison with already trained data in evaluating an unknown wave than just the original single wave. So, training this vectorized data and comparing it to the test data by using the Euclidean distance, for instance, could help in sharpening one’s forecasts for the model.
Implementation
To illustrate the Fourier Transform implementation in MQL5 we will look at decomposing a time series of range pricing (highs minus lows). We will then examine these constituent frequencies and see if any particular one of them when identified by index, has a useful correlation with the next changes in the price ranges. We will the use this information to guide our adjustment of open position stop-losses in a custom implementation of the ‘CExpertTrailing’ class. We will use a simple inbuilt signal listed in ‘SignalRSI.mqh’ and money management will use fixed margin.
If we list our custom trailing class as below. In retrieving the real and imaginary coefficients for the ‘function f(t)’ we use an instance of the struct ‘a1_complex’ to store this information after processing through the function ‘FFTR1D’. In order to use these coefficients, we need to ‘integrate’ them and for that I improvised a matrix ‘_output’. This matrix has coefficients for each epicycle at each data point. We are using 6 data points and 5 epicycles. Also our forecast data point index ‘m_points-1’ is used because Fourier cycles are repetitive so the next leg would be the oldest in the cycle.
//+------------------------------------------------------------------+
//|                                                   TrailingCT.mqh |
//|                   Copyright 2009-2013, MetaQuotes Software Corp. |
//|                                              http://www.mql5.com |
//+------------------------------------------------------------------+
#include <Math\Alglib\fasttransforms.mqh>
#include <Expert\ExpertTrailing.mqh>
// wizard description start
//+------------------------------------------------------------------+
//| Description of the class                                         |
//| Title=Trailing Stop based on 'Fourier Transform' v3              |
//| Type=Trailing                                                    |
//| Name=CategoryTheory                                              |
//| ShortName=CT                                                     |
//| Class=CTrailingFT                                                |
//| Page=trailing_ct                                                 |
//| Parameter=Step,double,0.5,Trailing Step                          |
//| Parameter=Index,int,0,FT-Index                                   |
//+------------------------------------------------------------------+
// wizard description end
//+------------------------------------------------------------------+
//| Class CTrailingFT.                                               |
//| Appointment: Class traling stops with 'Fourier Transform' v3     |
//|               relative-sets concepts.                            |
//| Derives from class CExpertTrailing.                              |
//+------------------------------------------------------------------+
#define     __PI 245850922/78256779

//+------------------------------------------------------------------+
//|                                                                  |
//+------------------------------------------------------------------+
class CTrailingFT : public CExpertTrailing
  {
protected:
   CFastFourierTransform   FFT;

   //--- adjusted parameters

   double            m_step;                    // trailing step

   int               m_index;                    // the epicycle index

public:
   //--- methods of setting adjustable parameters


   //--- method of verification of settings
   virtual bool      ValidationSettings(void);
   //--- method of creating the indicator and timeseries
   virtual bool      InitIndicators(CIndicators *indicators);
   //--- methods of checking if the market models are formed
   virtual bool      CheckTrailingStopLong(CPositionInfo *position,double &sl,double &tp);
   virtual bool      CheckTrailingStopShort(CPositionInfo *position,double &sl,double &tp);
   //---
                     CTrailingFT(void);
                    ~CTrailingFT(void);
   //--- methods of setting adjustable parameters
   void              Step(double value)                  { m_step=value;      }
   void              Index(int value)                    { m_index=value;     }

protected:

   double            ProcessFT(int Index);

  };
//+------------------------------------------------------------------+
//| Constructor                                                      |
//+------------------------------------------------------------------+
CTrailingFT::CTrailingFT(void)
  {
//--- initialization of protected data
   m_used_series=USE_SERIES_TIME+USE_SERIES_SPREAD+USE_SERIES_OPEN+USE_SERIES_HIGH+USE_SERIES_LOW+USE_SERIES_CLOSE;
  }
//+------------------------------------------------------------------+
//| Destructor                                                       |
//+------------------------------------------------------------------+
CTrailingFT::~CTrailingFT(void)
  {
  }
//+------------------------------------------------------------------+
//| Validation settings protected data.                              |
//+------------------------------------------------------------------+
bool CTrailingFT::ValidationSettings(void)
  {
//--- validation settings of additional filters
   if(!CExpertTrailing::ValidationSettings())
      return(false);
//--- initial data checks
   if(m_index<0 || m_index>=5)
     {
      printf(__FUNCTION__+": index must be greater than 0 and less than epicycles");
      return(false);
     }

//--- ok
   return(true);
  }
//+------------------------------------------------------------------+
//| Create indicators.                                               |
//+------------------------------------------------------------------+
bool CTrailingFT::InitIndicators(CIndicators *indicators)
  {
//--- check pointer
   if(indicators==NULL)
      return(false);
//--- initialization of indicators and timeseries of additional filters
   if(!CExpertTrailing::InitIndicators(indicators))
      return(false);
//---
//--- ok
   return(true);
  }
//+------------------------------------------------------------------+
//| Checking trailing stop and/or profit for long position.          |
//+------------------------------------------------------------------+
bool CTrailingFT::CheckTrailingStopLong(CPositionInfo *position,double &sl,double &tp)
  {
//--- check
      if(position==NULL)
         return(false);

      m_high.Refresh(-1);
      m_low.Refresh(-1);

      int _x=StartIndex();

      double _ft=ProcessFT(_x);
      double _type=_ft/100.0;

      double _atr=fmax(2.0*m_spread.GetData(_x)*m_symbol.Point(),m_high.GetData(_x)-m_low.GetData(_x))*(_type);

      double _sl=m_low.GetData(_x)-(m_step*_atr);

      double level =NormalizeDouble(m_symbol.Bid()-m_symbol.StopsLevel()*m_symbol.Point(),m_symbol.Digits());
      double new_sl=NormalizeDouble(_sl,m_symbol.Digits());
      double pos_sl=position.StopLoss();
      double base  =(pos_sl==0.0) ? position.PriceOpen() : pos_sl;

      sl=EMPTY_VALUE;
      tp=EMPTY_VALUE;
      if(new_sl>base && new_sl<level)
         sl=new_sl;
//---
   return(sl!=EMPTY_VALUE);
  }
//+------------------------------------------------------------------+
//| Checking trailing stop and/or profit for short position.         |
//+------------------------------------------------------------------+
bool CTrailingFT::CheckTrailingStopShort(CPositionInfo *position,double &sl,double &tp)
  {
//--- check
      if(position==NULL)
         return(false);

      m_high.Refresh(-1);
      m_low.Refresh(-1);

      int _x=StartIndex();

      double _ft=ProcessFT(_x);
      double _type=_ft/100.0;

      double _atr=fmax(2.0*m_spread.GetData(_x)*m_symbol.Point(),m_high.GetData(_x)-m_low.GetData(_x))*(_type);

      double _sl=m_high.GetData(_x)+(m_step*_atr);

      double level =NormalizeDouble(m_symbol.Ask()+m_symbol.StopsLevel()*m_symbol.Point(),m_symbol.Digits());
      double new_sl=NormalizeDouble(_sl,m_symbol.Digits());
      double pos_sl=position.StopLoss();
      double base  =(pos_sl==0.0) ? position.PriceOpen() : pos_sl;

      sl=EMPTY_VALUE;
      tp=EMPTY_VALUE;
      if(new_sl<base && new_sl>level)
         sl=new_sl;
//---
      return(sl!=EMPTY_VALUE);
  }
//+------------------------------------------------------------------+
//| Fourier Transform                                                |
//| INPUT PARAMETERS                                                 |
//|     Index   -   int, read index within price buffer.             |
//| OUTPUT                                                           |
//|     double  -   forecast change in price                         |
//+------------------------------------------------------------------+
double CTrailingFT::ProcessFT(int Index)
   {
      double _ft=0.0;

      int _index=Index;//+StartIndex();

      m_close.Refresh(-1);

      double _a[];
      matrix _output;
      al_complex _f[];

      //6 data points, 5 epicycles

      ArrayResize(_a,6);ArrayInitialize(_a,0.0);
      _output.Init(6,5);_output.Fill(0.0);

      for(int p=0;p<6;p++)
      {
         _a[p]=m_close.GetData(_index+p)-m_close.GetData(_index+p+1);
      }

      FFT.FFTR1D(_a,5,_f);

      for(int p=0;p<6;p++)
      {
         for(int s=0;s<5;s++)
         {
            double _divisor=(1.0/5),_angle=(p);_angle/=6;
            _output[p][s]=(_divisor*_a[p]*MathExp(-2.0*__PI*(_f[s].im/_f[s].re)*_angle));
         }
      }

      double _close=m_close.GetData(_index)>m_close.GetData(_index+1);

      _ft=(_output[5][m_index]/fmax(m_symbol.Point(),fabs(_output[5][m_index])+fabs(_close)))*100.0;

      return(_ft);
   }
//+------------------------------------------------------------------+
On compilation with the inbuilt RSI signal class and inbuilt fixed-margin money management, we do get these results for: EURJPY over the period: 2022.01.01 to 2023.01.01 on the timeframe: 4-hours. In running this test, we do not set profit targets nor use the default stop loss setting, therefore both inputs for these are zero. We want exits to be entirely determined by reversal of signal or triggering of the stop loss set by our trailing stop.

For a second/ comparative implementation, we will consider correlating the constituent frequency with the highest amplitude to changes in price ranges as above.
This implementation is listed below:
//+------------------------------------------------------------------+
//|                                                   TrailingCT.mqh |
//|                   Copyright 2009-2013, MetaQuotes Software Corp. |
//|                                              http://www.mql5.com |
//+------------------------------------------------------------------+
#include <Math\Alglib\fasttransforms.mqh>
#include <Expert\ExpertTrailing.mqh>
// wizard description start
//+------------------------------------------------------------------+
//| Description of the class                                         |
//| Title=Trailing Stop based on 'Fourier Transform' v3              |
//| Type=Trailing                                                    |
//| Name=CategoryTheory                                              |
//| ShortName=CT                                                     |
//| Class=CTrailingFT                                                |
//| Page=trailing_ct                                                 |
//| Parameter=Points,int,6,FT-Points                                 |
//| Parameter=Epicycles,int,5,FT-Epicycles                           |
//| Parameter=Step,double,0.5,Trailing Step                          |
//+------------------------------------------------------------------+
// wizard description end
//+------------------------------------------------------------------+
//| Class CTrailingFT.                                               |
//| Appointment: Class traling stops with 'Fourier Transform' v3     |
//|               relative-sets concepts.                            |
//| Derives from class CExpertTrailing.                              |
//+------------------------------------------------------------------+
#define     __PI 245850922/78256779

//+------------------------------------------------------------------+
//|                                                                  |
//+------------------------------------------------------------------+
class CTrailingFT : public CExpertTrailing
  {
protected:
   CFastFourierTransform   FFT;

   //--- adjusted parameters

   double            m_step;                    // trailing step

public:
   //--- methods of setting adjustable parameters


   //--- method of verification of settings
   virtual bool      ValidationSettings(void);
   //--- method of creating the indicator and timeseries
   virtual bool      InitIndicators(CIndicators *indicators);
   //--- methods of checking if the market models are formed
   virtual bool      CheckTrailingStopLong(CPositionInfo *position,double &sl,double &tp);
   virtual bool      CheckTrailingStopShort(CPositionInfo *position,double &sl,double &tp);
   //---
                     CTrailingFT(void);
                    ~CTrailingFT(void);
   //--- methods of setting adjustable parameters
   void              Step(double value)                  { m_step=value;      }

protected:

   double            ProcessFT(int Index);

  };
//+------------------------------------------------------------------+
//| Constructor                                                      |
//+------------------------------------------------------------------+
CTrailingFT::CTrailingFT(void)
  {
//--- initialization of protected data
   m_used_series=USE_SERIES_TIME+USE_SERIES_SPREAD+USE_SERIES_OPEN+USE_SERIES_HIGH+USE_SERIES_LOW+USE_SERIES_CLOSE;
  }
//+------------------------------------------------------------------+
//| Destructor                                                       |
//+------------------------------------------------------------------+
CTrailingFT::~CTrailingFT(void)
  {
  }
//+------------------------------------------------------------------+
//| Validation settings protected data.                              |
//+------------------------------------------------------------------+
bool CTrailingFT::ValidationSettings(void)
  {
//--- validation settings of additional filters
   if(!CExpertTrailing::ValidationSettings())
      return(false);
//--- initial data checks

//--- ok
   return(true);
  }
//+------------------------------------------------------------------+
//| Create indicators.                                               |
//+------------------------------------------------------------------+
bool CTrailingFT::InitIndicators(CIndicators *indicators)
  {
//--- check pointer
   if(indicators==NULL)
      return(false);
//--- initialization of indicators and timeseries of additional filters
   if(!CExpertTrailing::InitIndicators(indicators))
      return(false);
//---
//--- ok
   return(true);
  }
//+------------------------------------------------------------------+
//| Checking trailing stop and/or profit for long position.          |
//+------------------------------------------------------------------+
bool CTrailingFT::CheckTrailingStopLong(CPositionInfo *position,double &sl,double &tp)
  {
//--- check
      if(position==NULL)
         return(false);

      m_high.Refresh(-1);
      m_low.Refresh(-1);

      int _x=StartIndex();

      double _ft=ProcessFT(_x);
      double _type=_ft/100.0;

      double _atr=fmax(2.0*m_spread.GetData(_x)*m_symbol.Point(),m_high.GetData(_x)-m_low.GetData(_x))*(_type);

      double _sl=m_low.GetData(_x)-(m_step*_atr);

      double level =NormalizeDouble(m_symbol.Bid()-m_symbol.StopsLevel()*m_symbol.Point(),m_symbol.Digits());
      double new_sl=NormalizeDouble(_sl,m_symbol.Digits());
      double pos_sl=position.StopLoss();
      double base  =(pos_sl==0.0) ? position.PriceOpen() : pos_sl;

      sl=EMPTY_VALUE;
      tp=EMPTY_VALUE;
      if(new_sl>base && new_sl<level)
         sl=new_sl;
//---
   return(sl!=EMPTY_VALUE);
  }
//+------------------------------------------------------------------+
//| Checking trailing stop and/or profit for short position.         |
//+------------------------------------------------------------------+
bool CTrailingFT::CheckTrailingStopShort(CPositionInfo *position,double &sl,double &tp)
  {
//--- check
      if(position==NULL)
         return(false);

      m_high.Refresh(-1);
      m_low.Refresh(-1);

      int _x=StartIndex();

      double _ft=ProcessFT(_x);
      double _type=_ft/100.0;

      double _atr=fmax(2.0*m_spread.GetData(_x)*m_symbol.Point(),m_high.GetData(_x)-m_low.GetData(_x))*(_type);

      double _sl=m_high.GetData(_x)+(m_step*_atr);

      double level =NormalizeDouble(m_symbol.Ask()+m_symbol.StopsLevel()*m_symbol.Point(),m_symbol.Digits());
      double new_sl=NormalizeDouble(_sl,m_symbol.Digits());
      double pos_sl=position.StopLoss();
      double base  =(pos_sl==0.0) ? position.PriceOpen() : pos_sl;

      sl=EMPTY_VALUE;
      tp=EMPTY_VALUE;
      if(new_sl<base && new_sl>level)
         sl=new_sl;
//---
      return(sl!=EMPTY_VALUE);
  }
//+------------------------------------------------------------------+
//| Fourier Transform                                                |
//| INPUT PARAMETERS                                                 |
//|     Index   -   int, read index within price buffer.             |
//| OUTPUT                                                           |
//|     double  -   forecast change in price                         |
//+------------------------------------------------------------------+
double CTrailingFT::ProcessFT(int Index)
   {
      double _ft=0.0;

      int _index=Index;//+StartIndex();

      m_close.Refresh(-1);

      double _a[];
      matrix _output;
      al_complex _f[];

      //6 data points, 5 epicycles

      ArrayResize(_a,6);ArrayInitialize(_a,0.0);
      _output.Init(6,5);_output.Fill(0.0);

      for(int p=0;p<6;p++)
      {
         _a[p]=m_close.GetData(_index+p)-m_close.GetData(_index+p+1);
      }

      FFT.FFTR1D(_a,5,_f);

      for(int p=0;p<6;p++)
      {
         for(int s=0;s<5;s++)
         {
            double _divisor=(1.0/5),_angle=(p);_angle/=6;
            _output[p][s]=(_divisor*_a[p]*MathExp(-2.0*__PI*(_f[s].im/_f[s].re)*_angle));
         }
      }

      double _close=m_close.GetData(_index)>m_close.GetData(_index+1);

      int _max_index=0;
      double _max=fabs(_output[5][_max_index]);
      for(int s=0;s<5;s++)
      {
         if(_max<fabs(_output[5][s]))
         {
            _max_index=s;
            _max=fabs(_output[5][s]);
         }
      }

      _ft=(_output[5][_max_index]/fmax(m_symbol.Point(),fabs(_output[5][_max_index])+fabs(_close)))*100.0;

      return(_ft);
   }
//+------------------------------------------------------------------+
On compilation with the same signal and money management files above test run yields the following report:

A final implementation where we use the minimum amplitude component and not the maximum, whose code is also attached to this article, gives us the report below:

From our three sample reports it is clear slightly changing our trailing stop system with identical entry signals, is significant to the results in the reports.
Conclusion
In conclusion we have looked at what the Fourier Transform is from a layman trader’s perspective. We have highlighted some of the vast possible applications of this transform to traders. We have then gone on to demonstrate a few simple implementations of this transform in MQL5 while focusing on using volatility forecasts to manage stop loss exits of open positions. This transform has many other applications that I have not listed here so the reader is invited to do some research in exploring these. Also, the code shared here is not a grail or any ‘live-account ready’ code for an expert advisor but once again the reader is encouraged to undertake some independent diligence and find out what works for him/ her.
Warning: All rights to these materials are reserved by MetaQuotes Ltd. Copying or reprinting of these materials in whole or in part is prohibited.
This article was written by a user of the site and reflects their personal views. MetaQuotes Ltd is not responsible for the accuracy of the information presented, nor for any consequences resulting from the use of the solutions, strategies or recommendations described.
- Free trading apps
- Over 8,000 signals for copying
- Economic news for exploring financial markets
You agree to website policy and terms of use
Hi Stephen,
very interesting article!
One hint to that: The parameters "Points" and "Epicycles" have to be deleted in the "Description of the class", they are not used in the code and the compiler complains after compiling the generated EA.
My Question: The EA is running smooth, but I can not reproduce your results in any way, maybe I did something wrong. Would you post the *.set file or even the EA source you generated?
Did you make a forward test?
Anyway it is a good lesson in using the FFT. Thank you!
I understand that the author did not even study the Fast Fourier Transform :) That's right, why bother, FT and FFT are empty and do not give anything in trading. I used to do these transformations 15 years ago in Matlab, and then I did the inverse transformation into time form - complete nonsense. FFTs are good in other fields, for example radar.
But wavelets are much more interesting. If you cut out all the high-frequency bands and do the inverse transformation to time domain, you will get an excellent low-pass filter without delays. However, it can be done much easier - through 2-pass filters.....
Hi,
it give me 12 errors
Replace Alglib with Custom FFT:
Alglib’s FFT may be slower for small datasets. Implement a lightweight FFT tailored to your window size (6 points).
Precompute MathExp(-2.0*M_PI*...) terms to avoid recalculating them on every tick.
Error Handling:
Add checks to prevent division by zero in _f[s].im / _f[s].re.Avoid matrix operations in ProcessFT() . Directly compute the required value for _ft using dominant frequencies.
Error Handling:
Add checks to prevent division by zero in _f[s].im / _f[s].re .
There are already much more efficient methods that use an elementary structure (M-shape). A change in its parameters gives a complete picture of changes in price dynamics (this is the impulse equilibrium theory).
As for the Fourier transform, in my opinion, it is a "drawn-out" method for financial markets, since the price movement of financial instruments is a non-stationary process, and analysing such processes with the help of Fourier methods is inefficient.
As for wavelet analysis, it is indeed more interesting, as various wave-like structures are used. However, this is only a kind of subjective selection of standards instead of using a single elementary structure, which is revealed in the theory of impulse equilibrium.