Articles on data analysis and statistics in MQL5
Articles on mathematical models and laws of probability are interesting for many traders. Mathematics is the basis of technical indicators, and statistics is required to analyze trading results and develop strategies.
Read about the fuzzy logic, digital filters, market profile, Kohonen maps, neural gas and many other tools that can be used for trading.
Add a new article

You are missing trading opportunities:
- Free trading apps
- Over 8,000 signals for copying
- Economic news for exploring financial markets
Registration
Log in
You agree to website policy and terms of use
If you do not have an account, please register

Price Action Analysis Toolkit Development (Part 21): Market Structure Flip Detector Tool
The Market Structure Flip Detector Expert Advisor (EA) acts as your vigilant partner, constantly observing shifts in market sentiment. By utilizing Average True Range (ATR)-based thresholds, it effectively detects structure flips and labels each Higher Low and Lower High with clear indicators. Thanks to MQL5’s swift execution and flexible API, this tool offers real-time analysis that adjusts the display for optimal readability and provides a live dashboard to monitor flip counts and timings. Furthermore, customizable sound and push notifications guarantee that you stay informed of critical signals, allowing you to see how straightforward inputs and helper routines can transform price movements into actionable strategies.

Cycles and Forex
Cycles are of great importance in our lives. Day and night, seasons, days of the week and many other cycles of different nature are present in the life of any person. In this article, we will consider cycles in financial markets.


MQL4 as a Trader's Tool, or The Advanced Technical Analysis
Trading is, first of all, a calculus of probabilities. The proverb about idleness being an engine for progress reveals us the reason why all those indicators and trading systems have been developed. It comes that the major of newcomers in trading study "ready-made" trading theories. But, as luck would have it, there are some more undiscovered market secrets, and tools used in analyzing of price movements exist, basically, as those unrealized technical indicators or math and stat packages. Thanks awfully to Bill Williams for his contribution to the market movements theory. Though, perhaps, it's too early to rest on oars.
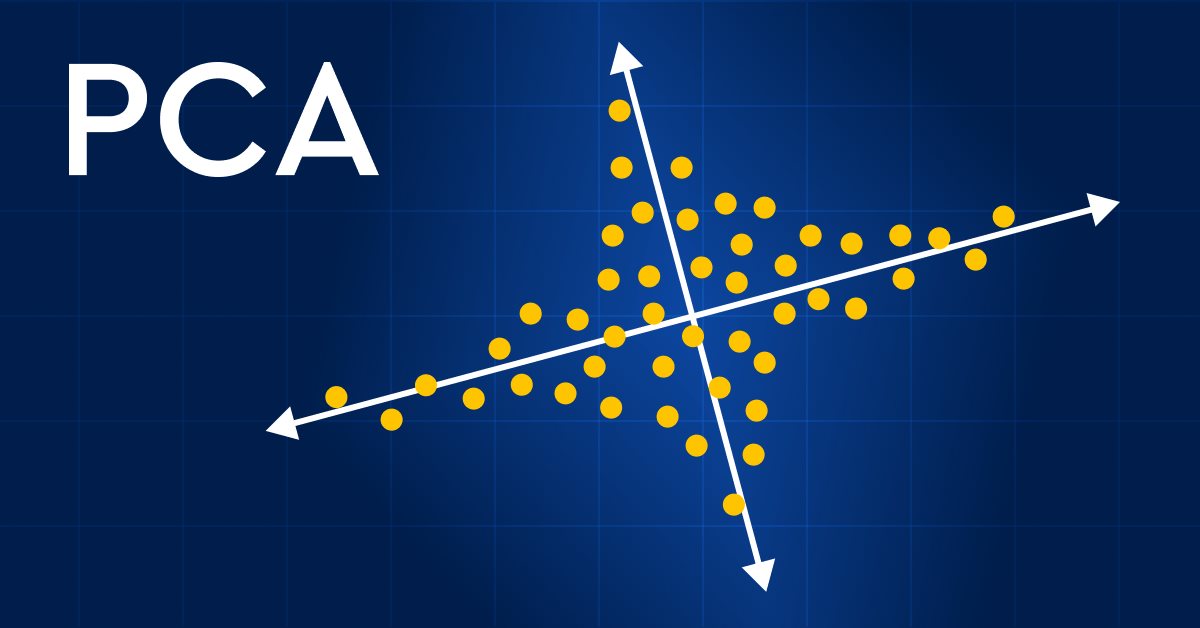
Data Science and Machine Learning (Part 13): Improve your financial market analysis with Principal Component Analysis (PCA)
Revolutionize your financial market analysis with Principal Component Analysis (PCA)! Discover how this powerful technique can unlock hidden patterns in your data, uncover latent market trends, and optimize your investment strategies. In this article, we explore how PCA can provide a new lens for analyzing complex financial data, revealing insights that would be missed by traditional approaches. Find out how applying PCA to financial market data can give you a competitive edge and help you stay ahead of the curve

Automating Trading Strategies in MQL5 (Part 27): Creating a Price Action Crab Harmonic Pattern with Visual Feedback
In this article, we develop a Crab Harmonic Pattern system in MQL5 that identifies bullish and bearish Crab harmonic patterns using pivot points and Fibonacci ratios, triggering trades with precise entry, stop loss, and take-profit levels. We incorporate visual feedback through chart objects like triangles and trendlines to display the XABCD pattern structure and trade levels.

Category Theory (Part 9): Monoid-Actions
This article continues the series on category theory implementation in MQL5. Here we continue monoid-actions as a means of transforming monoids, covered in the previous article, leading to increased applications.

Data Science and ML (Part 40): Using Fibonacci Retracements in Machine Learning data
Fibonacci retracements are a popular tool in technical analysis, helping traders identify potential reversal zones. In this article, we’ll explore how these retracement levels can be transformed into target variables for machine learning models to help them understand the market better using this powerful tool.

Population optimization algorithms: Gravitational Search Algorithm (GSA)
GSA is a population optimization algorithm inspired by inanimate nature. Thanks to Newton's law of gravity implemented in the algorithm, the high reliability of modeling the interaction of physical bodies allows us to observe the enchanting dance of planetary systems and galactic clusters. In this article, I will consider one of the most interesting and original optimization algorithms. The simulator of the space objects movement is provided as well.

MQL5 Wizard Techniques you should know (Part 09): Pairing K-Means Clustering with Fractal Waves
K-Means clustering takes the approach to grouping data points as a process that’s initially focused on the macro view of a data set that uses random generated cluster centroids before zooming in and adjusting these centroids to accurately represent the data set. We will look at this and exploit a few of its use cases.

Data Science and Machine Learning (Part 21): Unlocking Neural Networks, Optimization algorithms demystified
Dive into the heart of neural networks as we demystify the optimization algorithms used inside the neural network. In this article, discover the key techniques that unlock the full potential of neural networks, propelling your models to new heights of accuracy and efficiency.

Currency pair strength indicator in pure MQL5
We are going to develop a professional indicator for currency strength analysis in MQL5. This step-by-step guide will show you how to develop a powerful trading tool with a visual dashboard for MetaTrader 5. You will learn how to calculate the strength of currency pairs across multiple timeframes (H1, H4, D1), implement dynamic data updates, and create a user-friendly interface.

Implementing the Janus factor in MQL5
Gary Anderson developed a method of market analysis based on a theory he dubbed the Janus Factor. The theory describes a set of indicators that can be used to reveal trends and assess market risk. In this article we will implement these tools in mql5.
Price Action Analysis Toolkit Development (Part 35): Training and Deploying Predictive Models
Historical data is far from “trash”—it’s the foundation of any robust market analysis. In this article, we’ll take you step‑by‑step from collecting that history to using it to train a predictive model, and finally deploying that model for live price forecasts. Read on to learn how!
Timeseries in DoEasy library (part 47): Multi-period multi-symbol standard indicators
In this article, I will start developing the methods of working with standard indicators, which will ultimately allow creating multi-symbol multi-period standard indicators based on library classes. Besides, I will add the "Skipped bars" event to the timeseries classes and eliminate excessive load from the main program code by moving the library preparation functions to CEngine class.

Population optimization algorithms: Fish School Search (FSS)
Fish School Search (FSS) is a new optimization algorithm inspired by the behavior of fish in a school, most of which (up to 80%) swim in an organized community of relatives. It has been proven that fish aggregations play an important role in the efficiency of foraging and protection from predators.

Creating a Trading Administrator Panel in MQL5 (Part I): Building a Messaging Interface
This article discusses the creation of a Messaging Interface for MetaTrader 5, aimed at System Administrators, to facilitate communication with other traders directly within the platform. Recent integrations of social platforms with MQL5 allow for quick signal broadcasting across different channels. Imagine being able to validate sent signals with just a click—either "YES" or "NO." Read on to learn more.

From Novice to Expert: Auto-Geometric Analysis System
Geometric patterns offer traders a concise way to interpret price action. Many analysts draw trend lines, rectangles, and other shapes by hand, and then base trading decisions on the formations they see. In this article, we explore an automated alternative: harnessing MQL5 to detect and analyze the most popular geometric patterns. We’ll break down the methodology, discuss implementation details, and highlight how automated pattern recognition can sharpen a trader's market insights.

Algorithmic Trading Without the Routine: Quick Trade Analysis in MetaTrader 5 with SQLite
The article presents a minimal working set for maintaining a trading journal in MQL5 using SQLite: a table structure for trades, signals, and events, indices, prepared statements and trades, as well as standard analytical SQL queries. Integration with the statistics dashboard in MetaTrader 5 and working with the database via MetaEditor are demonstrated. The approach allows automating the journal, accelerating calculations, and performing analysis without complicating the EA code.

Сode Lock Algorithm (CLA)
In this article, we will rethink code locks, transforming them from security mechanisms into tools for solving complex optimization problems. Discover the world of code locks viewed not as simple security devices, but as inspiration for a new approach to optimization. We will create a whole population of "locks", where each lock represents a unique solution to the problem. We will then develop an algorithm that will "pick" these locks and find optimal solutions in a variety of areas, from machine learning to trading systems development.

Price Action Analysis Toolkit Development (Part 31): Python Candlestick Recognition Engine (I) — Manual Detection
Candlestick patterns are fundamental to price-action trading, offering valuable insights into potential market reversals or continuations. Envision a reliable tool that continuously monitors each new price bar, identifies key formations such as engulfing patterns, hammers, dojis, and stars, and promptly notifies you when a significant trading setup is detected. This is precisely the functionality we have developed. Whether you are new to trading or an experienced professional, this system provides real-time alerts for candlestick patterns, enabling you to focus on executing trades with greater confidence and efficiency. Continue reading to learn how it operates and how it can enhance your trading strategy.

MQL5 Market Results for Q2 2013
Successfully operating for 1.5 years, MQL5 Market has become the largest traders' store of trading strategies and technical indicators. It offers around 800 trading applications provided by 350 developers from around the world. Over 100.000 trading programs have already been purchased and downloaded by traders to their MetaTrader 5 terminals.

Building a Research-Grounded Grid EA in MQL5: Why Most Grid EAs Fail and What Taranto Proved
This article implements a regime-adaptive grid trading EA based on the PhD research of Aldo Taranto. It presents a regime‑adaptive grid trading EA that constrains risk through restartable cycles and equity‑based safeguards. We explain why naive grids fail (variance growth and almost‑sure ruin), derive the loss formula for real‑time exposure, and implement regime‑aware gating, ATR‑dynamic spacing, and a live kill switch. Readers get the mathematical tools and production patterns needed to build, test, and operate a constrained grid safely.

From Novice to Expert: Enhancing Liquidity Strategies with Multi-Timeframe Structural Confirmation in MQL5
The alignment of higher-timeframe liquidity structures with lower-timeframe reversal patterns can greatly influence both the likelihood and direction of the next price movement. By integrating structural liquidity zones from higher timeframes with precise reversal confirmations on lower timeframes, traders can improve entry timing and overall trade quality. This article demonstrates how to reinforce liquidity-based trading strategies through higher-timeframe structural confirmation—and how to implement this approach effectively using MQL5.

Developing a Replay System — Market simulation (Part 21): FOREX (II)
We will continue to build a system for working in the FOREX market. In order to solve this problem, we must first declare the loading of ticks before loading the previous bars. This solves the problem, but at the same time forces the user to follow some structure in the configuration file, which, personally, does not make much sense to me. The reason is that by designing a program that is responsible for analyzing and executing what is in the configuration file, we can allow the user to declare the elements he needs in any order.
MQL5 Market Turns One Year Old
One year has passed since the launch of sales in MQL5 Market. It was a year of hard work, which turned the new service into the largest store of trading robots and technical indicators for MetaTrader 5 platform.

Building a Trading System (Part 4): How Random Exits Influence Trading Expectancy
Many traders have experienced this situation, often stick to their entry criteria but struggle with trade management. Even with the right setups, emotional decision-making—such as panic exits before trades reach their take-profit or stop-loss levels—can lead to a declining equity curve. How can traders overcome this issue and improve their results? This article will address these questions by examining random win-rates and demonstrating, through Monte Carlo simulation, how traders can refine their strategies by taking profits at reasonable levels before the original target is reached.

Reimagining Classic Strategies (Part 21): Bollinger Bands And RSI Ensemble Strategy Discovery
This article explores the development of an ensemble algorithmic trading strategy for the EURUSD market that combines the Bollinger Bands and the Relative Strength Indicator (RSI). Initial rule-based strategies produced high-quality signals but suffered from low trade frequency and limited profitability. Multiple iterations of the strategy were evaluated, revealing flaws in our understanding of the market, increased noise, and degraded performance. By appropriately employing statistical learning algorithms, shifting the modeling target to technical indicators, applying proper scaling, and combining machine learning forecasts with classical trading rules, the final strategy achieved significantly improved profitability and trade frequency while maintaining acceptable signal quality.

Price Action Analysis Toolkit Development (Part 23): Currency Strength Meter
Do you know what really drives a currency pair’s direction? It’s the strength of each individual currency. In this article, we’ll measure a currency’s strength by looping through every pair it appears in. That insight lets us predict how those pairs may move based on their relative strengths. Read on to learn more.
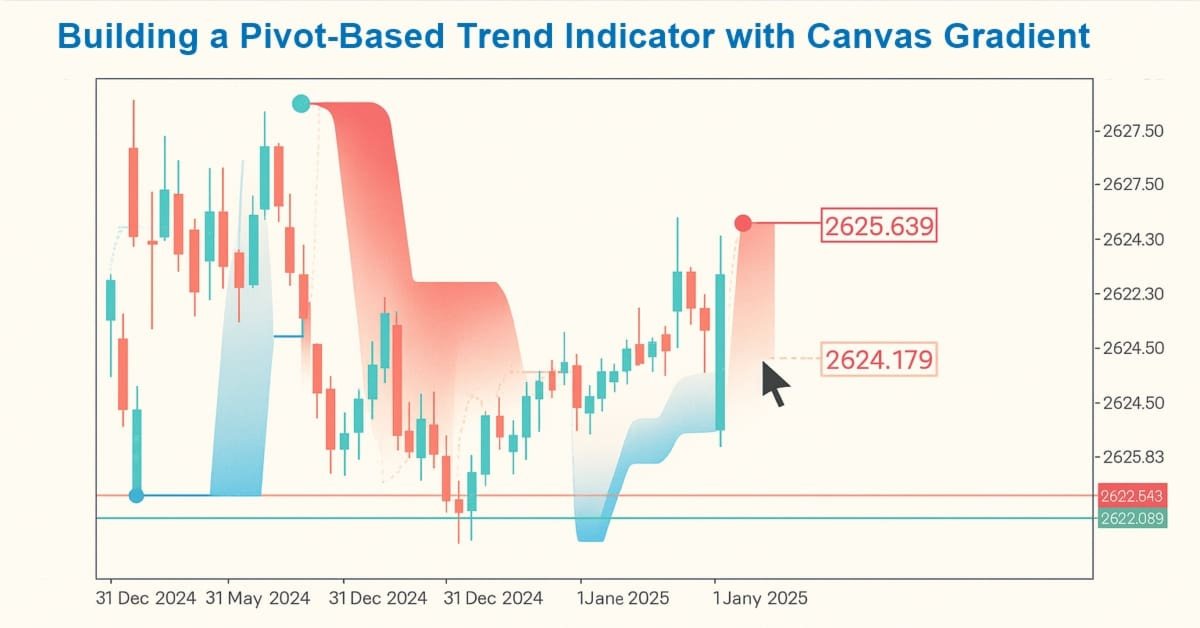
Creating Custom Indicators in MQL5 (Part 1): Building a Pivot-Based Trend Indicator with Canvas Gradient
In this article, we create a Pivot-Based Trend Indicator in MQL5 that calculates fast and slow pivot lines over user-defined periods, detects trend directions based on price relative to these lines, and signals trend starts with arrows while optionally extending lines beyond the current bar. The indicator supports dynamic visualization with separate up/down lines in customizable colors, dotted fast lines that change color on trend shifts, and optional gradient filling between lines, using a canvas object for enhanced trend-area highlighting.

Trader's Statistical Cookbook: Hypotheses
This article considers hypothesis - one of the basic ideas of mathematical statistics. Various hypotheses are examined and verified through examples using methods of mathematical statistics. The actual data is generalized using nonparametric methods. The Statistica package and the ported ALGLIB MQL5 numerical analysis library are used for processing data.

Integrating Hidden Markov Models in MetaTrader 5
In this article we demonstrate how Hidden Markov Models trained using Python can be integrated into MetaTrader 5 applications. Hidden Markov Models are a powerful statistical tool used for modeling time series data, where the system being modeled is characterized by unobservable (hidden) states. A fundamental premise of HMMs is that the probability of being in a given state at a particular time depends on the process's state at the previous time slot.
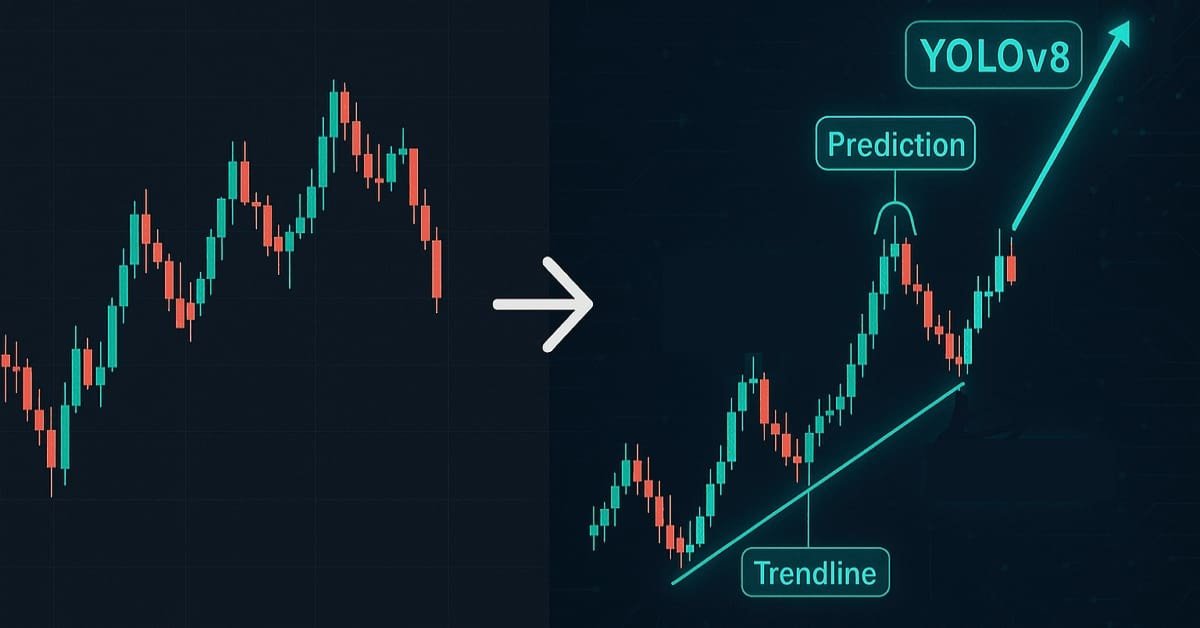
Data Science and ML (Part 41): Forex and Stock Markets Pattern Detection using YOLOv8
Detecting patterns in financial markets is challenging because it involves seeing what's on the chart, something that's difficult to undertake in MQL5 due to image limitations. In this article, we are going to discuss a decent model made in Python that helps us detect patterns present on the chart with minimal effort.

Self Optimizing Expert Advisors in MQL5 (Part 11): A Gentle Introduction to the Fundamentals of Linear Algebra
In this discussion, we will set the foundation for using powerful linear, algebra tools that are implemented in the MQL5 matrix and vector API. For us to make proficient use of this API, we need to have a firm understanding of the principles in linear algebra that govern intelligent use of these methods. This article aims to get the reader an intuitive level of understanding of some of the most important rules of linear algebra that we, as algorithmic traders in MQL5 need,to get started, taking advantage of this powerful library.

Price Action Analysis Toolkit Development (Part 16): Introducing Quarters Theory (II) — Intrusion Detector EA
In our previous article, we introduced a simple script called "The Quarters Drawer." Building on that foundation, we are now taking the next step by creating a monitor Expert Advisor (EA) to track these quarters and provide oversight regarding potential market reactions at these levels. Join us as we explore the process of developing a zone detection tool in this article.

Timeseries in DoEasy library (part 53): Abstract base indicator class
The article considers creation of an abstract indicator which further will be used as the base class to create objects of library’s standard and custom indicators.

Developing a Replay System — Market simulation (Part 06): First improvements (I)
In this article, we will begin to stabilize the entire system, without which we might not be able to proceed to the next steps.

Data Science and Machine Learning (Part 15): SVM, A Must-Have Tool in Every Trader's Toolbox
Discover the indispensable role of Support Vector Machines (SVM) in shaping the future of trading. This comprehensive guide explores how SVM can elevate your trading strategies, enhance decision-making, and unlock new opportunities in the financial markets. Dive into the world of SVM with real-world applications, step-by-step tutorials, and expert insights. Equip yourself with the essential tool that can help you navigate the complexities of modern trading. Elevate your trading game with SVM—a must-have for every trader's toolbox.

Price Action Analysis Toolkit Development (Part 30): Commodity Channel Index (CCI), Zero Line EA
Automating price action analysis is the way forward. In this article, we utilize the Dual CCI indicator, the Zero Line Crossover strategy, EMA, and price action to develop a tool that generates trade signals and sets stop-loss (SL) and take-profit (TP) levels using ATR. Please read this article to learn how we approach the development of the CCI Zero Line EA.

Modified Grid-Hedge EA in MQL5 (Part III): Optimizing Simple Hedge Strategy (I)
In this third part, we revisit the Simple Hedge and Simple Grid Expert Advisors (EAs) developed earlier. Our focus shifts to refining the Simple Hedge EA through mathematical analysis and a brute force approach, aiming for optimal strategy usage. This article delves deep into the mathematical optimization of the strategy, setting the stage for future exploration of coding-based optimization in later installments.

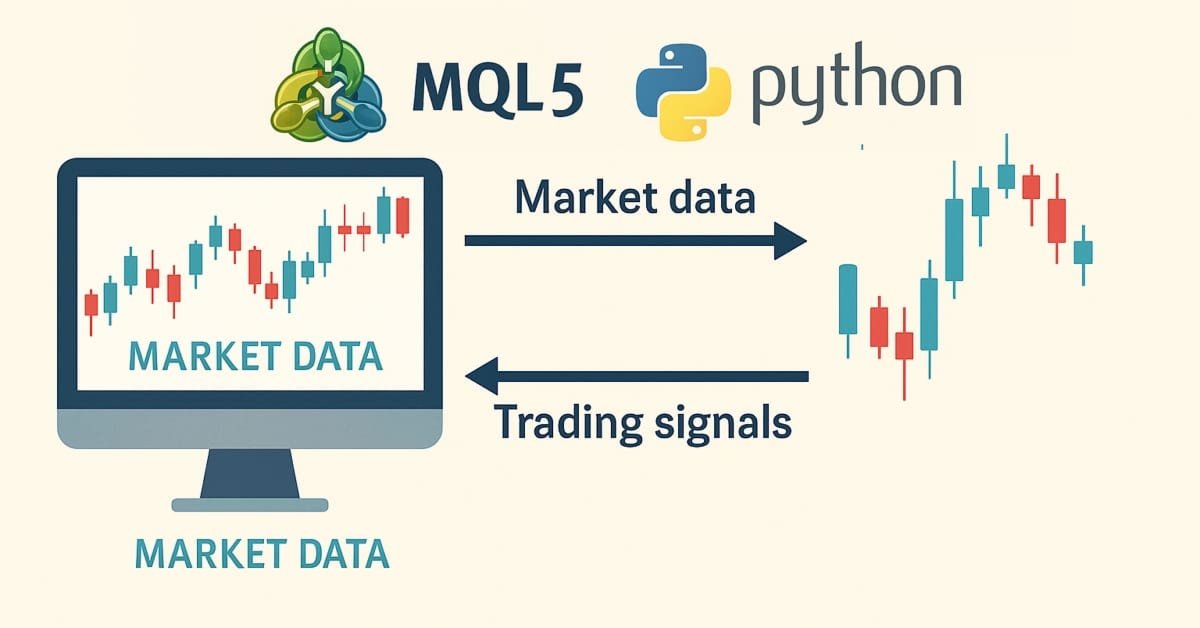
Integrating MQL5 with data processing packages (Part 5): Adaptive Learning and Flexibility
This part focuses on building a flexible, adaptive trading model trained on historical XAUUSD data, preparing it for ONNX export and potential integration into live trading systems.