
Implementing Practical Modules from Other Languages in MQL5 (Part 06): Python-Like File IO operations in MQL5
This article shows how to simplify complex MQL5 file operations by building a Python-style interface for effortless reading and writing. It explains how to recreate Python’s intuitive file-handling patterns through custom functions and classes. The result is a cleaner, more reliable approach to MQL5 file I/O.

Data Science and ML (Part 47): Forecasting the Market Using the DeepAR model in Python
In this article, we will attempt to predict the market with a decent model for time series forecasting named DeepAR. A model that is a combination of deep neural networks and autoregressive properties found in models like ARIMA and Vector Autoregressive (VAR).
Creating a mean-reversion strategy based on machine learning
This article proposes another original approach to creating trading systems based on machine learning, using clustering and trade labeling for mean reversion strategies.

Billiards Optimization Algorithm (BOA)
The BOA method is inspired by the classic game of billiards and simulates the search for optimal solutions as a game with balls trying to fall into pockets representing the best results. In this article, we will consider the basics of BOA, its mathematical model, and its efficiency in solving various optimization problems.

Creating Custom Indicators in MQL5 (Part 2): Building a Gauge-Style RSI Display with Canvas and Needle Mechanics
In this article, we develop a gauge-style RSI indicator in MQL5 that visualizes Relative Strength Index values on a circular scale with a dynamic needle, color-coded ranges for overbought and oversold levels, and customizable legends. We utilize the Canvas class to draw elements like arcs, ticks, and pies, ensuring smooth updates on new RSI data.

Statistical Arbitrage Through Cointegrated Stocks (Part 9): Backtesting Portfolio Weights Updates
This article describes the use of CSV files for backtesting portfolio weights updates in a mean-reversion-based strategy that uses statistical arbitrage through cointegrated stocks. It goes from feeding the database with the results of a Rolling Windows Eigenvector Comparison (RWEC) to comparing the backtest reports. In the meantime, the article details the role of each RWEC parameter and its impact in the overall backtest result, showing how the comparison of the relative drawdown can help us to further improve those parameters.

Creating Custom Indicators in MQL5 (Part 1): Building a Pivot-Based Trend Indicator with Canvas Gradient
In this article, we create a Pivot-Based Trend Indicator in MQL5 that calculates fast and slow pivot lines over user-defined periods, detects trend directions based on price relative to these lines, and signals trend starts with arrows while optionally extending lines beyond the current bar. The indicator supports dynamic visualization with separate up/down lines in customizable colors, dotted fast lines that change color on trend shifts, and optional gradient filling between lines, using a canvas object for enhanced trend-area highlighting.
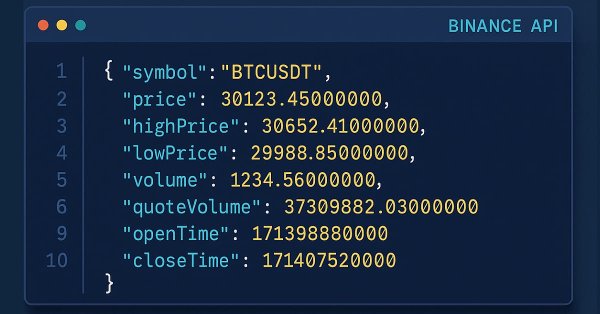
Introduction to MQL5 (Part 31): Mastering API and WebRequest Function in MQL5 (V)
Learn how to use WebRequest and external API calls to retrieve recent candle data, convert each value into a usable type, and save the information neatly in a table format. This step lays the groundwork for building an indicator that visualizes the data in candle format.

Chaos Game Optimization (CGO)
The article presents a new metaheuristic algorithm, Chaos Game Optimization (CGO), which demonstrates a unique ability to maintain high efficiency when dealing with high-dimensional problems. Unlike most optimization algorithms, CGO not only does not lose, but sometimes even increases performance when scaling a problem, which is its key feature.

Statistical Arbitrage Through Cointegrated Stocks (Part 8): Rolling Windows Eigenvector Comparison for Portfolio Rebalancing
This article proposes using Rolling Windows Eigenvector Comparison for early imbalance diagnostics and portfolio rebalancing in a mean-reversion statistical arbitrage strategy based on cointegrated stocks. It contrasts this technique with traditional In-Sample/Out-of-Sample ADF validation, showing that eigenvector shifts can signal the need for rebalancing even when IS/OOS ADF still indicates a stationary spread. While the method is intended mainly for live trading monitoring, the article concludes that eigenvector comparison could also be integrated into the scoring system—though its actual contribution to performance remains to be tested.

Currency pair strength indicator in pure MQL5
We are going to develop a professional indicator for currency strength analysis in MQL5. This step-by-step guide will show you how to develop a powerful trading tool with a visual dashboard for MetaTrader 5. You will learn how to calculate the strength of currency pairs across multiple timeframes (H1, H4, D1), implement dynamic data updates, and create a user-friendly interface.

Implementing Practical Modules from Other Languages in MQL5 (Part 05): The Logging module from Python, Log Like a Pro
Integrating Python's logging module with MQL5 empowers traders with a systematic logging approach, simplifying the process of monitoring, debugging, and documenting trading activities. This article explains the adaptation process, offering traders a powerful tool for maintaining clarity and organization in trading software development.

Capital management in trading and the trader's home accounting program with a database
How can a trader manage capital? How can a trader and investor keep track of expenses, income, assets, and liabilities? I am not just going to introduce you to accounting software; I am going to show you a tool that might become your reliable financial navigator in the stormy sea of trading.

Automating Trading Strategies in MQL5 (Part 44): Change of Character (CHoCH) Detection with Swing High/Low Breaks
In this article, we develop a Change of Character (CHoCH) detection system in MQL5 that identifies swing highs and lows over a user-defined bar length, labels them as HH/LH for highs or LL/HL for lows to determine trend direction, and triggers trades on breaks of these swing points, indicating a potential reversal, and trades the breaks when the structure changes.

Automating Trading Strategies in MQL5 (Part 43): Adaptive Linear Regression Channel Strategy
In this article, we implement an adaptive Linear Regression Channel system in MQL5 that automatically calculates the regression line and standard deviation channel over a user-defined period, only activates when the slope exceeds a minimum threshold to confirm a clear trend, and dynamically recreates or extends the channel when the price breaks out by a configurable percentage of channel width.

Price Action Analysis Toolkit Development (Part 53): Pattern Density Heatmap for Support and Resistance Zone Discovery
This article introduces the Pattern Density Heatmap, a price‑action mapping tool that transforms repeated candlestick pattern detections into statistically significant support and resistance zones. Rather than treating each signal in isolation, the EA aggregates detections into fixed price bins, scores their density with optional recency weighting, and confirms levels against higher‑timeframe data. The resulting heatmap reveals where the market has historically reacted—levels that can be used proactively for trade timing, risk management, and strategy confidence across any trading style.

Market Positioning Codex for VGT with Kendall's Tau and Distance Correlation
In this article, we look to explore how a complimentary indicator pairing can be used to analyze the recent 5-year history of Vanguard Information Technology Index Fund ETF. By considering two options of algorithms, Kendall’s Tau and Distance-Correlation, we look to select not just an ideal indicator pair for trading the VGT, but also suitable signal-pattern pairings of these two indicators.

Market Simulation (Part 07): Sockets (I)
Sockets. Do you know what they are for or how to use them in MetaTrader 5? If the answer is no, let's start by studying them. In today's article, we'll cover the basics. Since there are several ways to do the same thing, and we are always interested in the result, I want to show that there is indeed a simple way to transfer data from MetaTrader 5 to other programs, such as Excel. However, the main idea is not to transfer data from MetaTrader 5 to Excel, but the opposite, that is, to transfer data from Excel or any other program to MetaTrader 5.

Price Action Analysis Toolkit Development (Part 52): Master Market Structure with Multi-Timeframe Visual Analysis
This article presents the Multi‑Timeframe Visual Analyzer, an MQL5 Expert Advisor that reconstructs and overlays higher‑timeframe candles directly onto your active chart. It explains the implementation, key inputs, and practical outcomes, supported by an animated demo and chart examples showing instant toggling, multi‑timeframe confirmation, and configurable alerts. Read on to see how this tool can make chart analysis faster, clearer, and more efficient.

Implementing Practical Modules from Other Languages in MQL5 (Part 04): time, date, and datetime modules from Python
Unlike MQL5, Python programming language offers control and flexibility when it comes to dealing with and manipulating time. In this article, we will implement similar modules for better handling of dates and time in MQL5 as in Python.

Price Action Analysis Toolkit Development (Part 51): Revolutionary Chart Search Technology for Candlestick Pattern Discovery
This article is intended for algorithmic traders, quantitative analysts, and MQL5 developers interested in enhancing their understanding of candlestick pattern recognition through practical implementation. It provides an in‑depth exploration of the CandlePatternSearch.mq5 Expert Advisor—a complete framework for detecting, visualizing, and monitoring classical candlestick formations in MetaTrader 5. Beyond a line‑by‑line review of the code, the article discusses architectural design, pattern detection logic, GUI integration, and alert mechanisms, illustrating how traditional price‑action analysis can be automated efficiently.
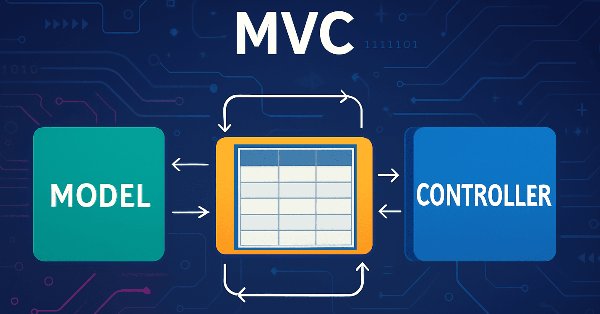
Implementation of a table model in MQL5: Applying the MVC concept
In this article, we look at the process of developing a table model in MQL5 using the MVC (Model-View-Controller) architectural pattern to separate data logic, presentation, and control, enabling structured, flexible, and scalable code. We consider implementation of classes for building a table model, including the use of linked lists for storing data.

Price Action Analysis Toolkit Development (Part 50): Developing the RVGI, CCI and SMA Confluence Engine in MQL5
Many traders struggle to identify genuine reversals. This article presents an EA that combines RVGI, CCI (±100), and an SMA trend filter to produce a single clear reversal signal. The EA includes an on-chart panel, configurable alerts, and the full source file for immediate download and testing.

Market Simulation (Part 06): Transferring Information from MetaTrader 5 to Excel
Many people, especially non=programmers, find it very difficult to transfer information between MetaTrader 5 and other programs. One such program is Excel. Many use Excel as a way to manage and maintain their risk control. It is an excellent program and easy to learn, even for those who are not VBA programmers. Here we will look at how to establish a connection between MetaTrader 5 and Excel (a very simple method).

Integrating MQL5 with Data Processing Packages (Part 6): Merging Market Feedback with Model Adaptation
In this part, we focus on how to merge real-time market feedback—such as live trade outcomes, volatility changes, and liquidity shifts—with adaptive model learning to maintain a responsive and self-improving trading system.

Blood inheritance optimization (BIO)
I present to you my new population optimization algorithm - Blood Inheritance Optimization (BIO), inspired by the human blood group inheritance system. In this algorithm, each solution has its own "blood type" that determines the way it evolves. Just as in nature where a child's blood type is inherited according to specific rules, in BIO new solutions acquire their characteristics through a system of inheritance and mutations.
From Novice to Expert: Time Filtered Trading
Just because ticks are constantly flowing in doesn’t mean every moment is an opportunity to trade. Today, we take an in-depth study into the art of timing—focusing on developing a time isolation algorithm to help traders identify and trade within their most favorable market windows. Cultivating this discipline allows retail traders to synchronize more closely with institutional timing, where precision and patience often define success. Join this discussion as we explore the science of timing and selective trading through the analytical capabilities of MQL5.

Analyzing all price movement options on the IBM quantum computer
We will use a quantum computer from IBM to discover all price movement options. Sounds like science fiction? Welcome to the world of quantum computing for trading!
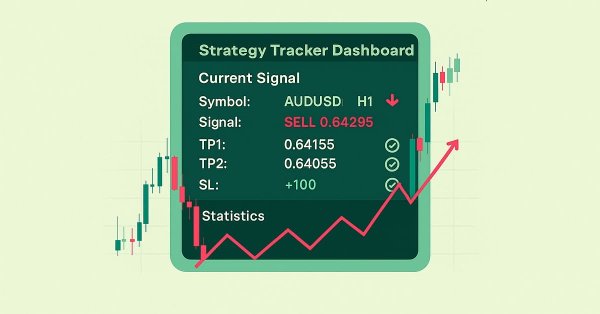
MQL5 Trading Tools (Part 10): Building a Strategy Tracker System with Visual Levels and Success Metrics
In this article, we develop an MQL5 strategy tracker system that detects moving average crossover signals filtered by a long-term MA, simulates or executes trades with configurable TP levels and SL in points, and monitors outcomes like TP/SL hits for performance analysis.
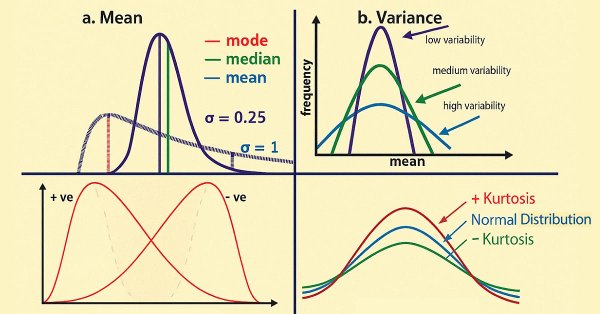
Automating Trading Strategies in MQL5 (Part 39): Statistical Mean Reversion with Confidence Intervals and Dashboard
In this article, we develop an MQL5 Expert Advisor for statistical mean reversion trading, calculating moments like mean, variance, skewness, kurtosis, and Jarque-Bera statistics over a specified period to identify non-normal distributions and generate buy/sell signals based on confidence intervals with adaptive thresholds
Reimagining Classic Strategies (Part 18): Searching For Candlestick Patterns
This article helps new community members search for and discover their own candlestick patterns. Describing these patterns can be daunting, as it requires manually searching and creatively identifying improvements. Here, we introduce the engulfing candlestick pattern and show how it can be enhanced for more profitable trading applications.

From Novice to Expert: Forex Market Periods
Every market period has a beginning and an end, each closing with a price that defines its sentiment—much like any candlestick session. Understanding these reference points allows us to gauge the prevailing market mood, revealing whether bullish or bearish forces are in control. In this discussion, we take an important step forward by developing a new feature within the Market Periods Synchronizer—one that visualizes Forex market sessions to support more informed trading decisions. This tool can be especially powerful for identifying, in real time, which side—bulls or bears—dominates the session. Let’s explore this concept and uncover the insights it offers.
Bivariate Copulae in MQL5 (Part 2): Implementing Archimedean copulae in MQL5
In the second installment of the series, we discuss the properties of bivariate Archimedean copulae and their implementation in MQL5. We also explore applying copulae to the development of a simple pairs trading strategy.

Statistical Arbitrage Through Cointegrated Stocks (Part 7): Scoring System 2
This article describes two additional scoring criteria used for selection of baskets of stocks to be traded in mean-reversion strategies, more specifically, in cointegration based statistical arbitrage. It complements a previous article where liquidity and strength of the cointegration vectors were presented, along with the strategic criteria of timeframe and lookback period, by including the stability of the cointegration vectors and the time to mean reversion (half-time). The article includes the commented results of a backtest with the new filters applied and the files required for its reproduction are also provided.

Circle Search Algorithm (CSA)
The article presents a new metaheuristic optimization Circle Search Algorithm (CSA) based on the geometric properties of a circle. The algorithm uses the principle of moving points along tangents to find the optimal solution, combining the phases of global exploration and local exploitation.

MetaTrader 5 Machine Learning Blueprint (Part 5): Sequential Bootstrapping—Debiasing Labels, Improving Returns
Sequential bootstrapping reshapes bootstrap sampling for financial machine learning by actively avoiding temporally overlapping labels, producing more independent training samples, sharper uncertainty estimates, and more robust trading models. This practical guide explains the intuition, shows the algorithm step‑by‑step, provides optimized code patterns for large datasets, and demonstrates measurable performance gains through simulations and real backtests.

Market Simulation (Part 05): Creating the C_Orders Class (II)
In this article, I will explain how Chart Trade, together with the Expert Advisor, will process a request to close all of the users' open positions. This may sound simple, but there are a few complications that you need to know how to manage.
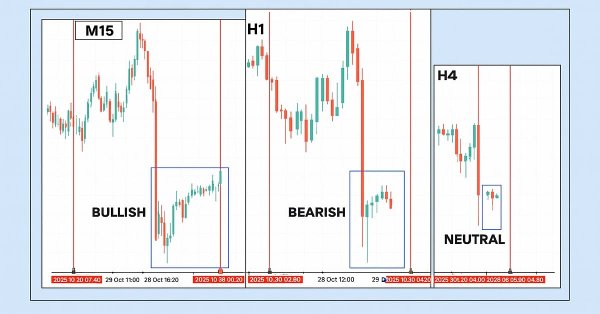
Price Action Analysis Toolkit Development (Part 48): Multi-Timeframe Harmony Index with Weighted Bias Dashboard
This article introduces the “Multi-Timeframe Harmony Index”—an advanced Expert Advisor for MetaTrader 5 that calculates a weighted bias from multiple timeframes, smooths the readings using EMA, and displays the results in a clean chart panel dashboard. It includes customizable alerts and automatic buy/sell signal plotting when strong bias thresholds are crossed. Suitable for traders who use multi-timeframe analysis to align entries with overall market structure.
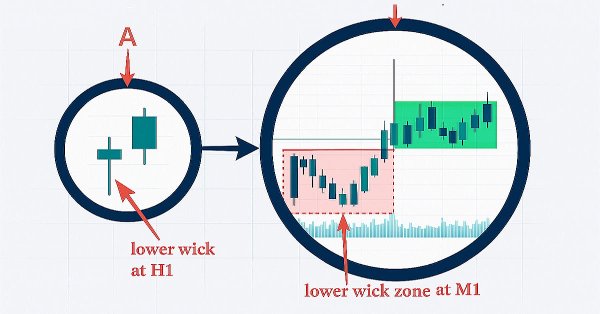
From Novice to Expert: Revealing the Candlestick Shadows (Wicks)
In this discussion, we take a step forward to uncover the underlying price action hidden within candlestick wicks. By integrating a wick visualization feature into the Market Periods Synchronizer, we enhance the tool with greater analytical depth and interactivity. This upgraded system allows traders to visualize higher-timeframe price rejections directly on lower-timeframe charts, revealing detailed structures that were once concealed within the shadows.
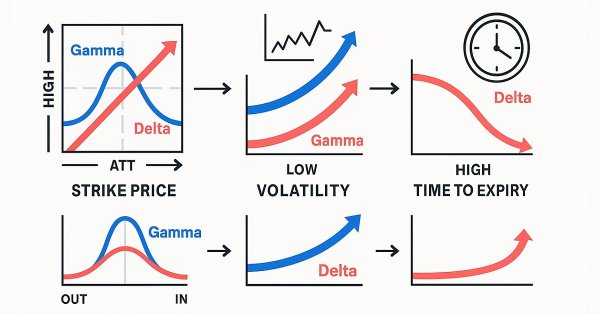
Black-Scholes Greeks: Gamma and Delta
Gamma and Delta measure how an option’s value reacts to changes in the underlying asset’s price. Delta represents the rate of change of the option’s price relative to the underlying, while Gamma measures how Delta itself changes as price moves. Together, they describe an option’s directional sensitivity and convexity—critical for dynamic hedging and volatility-based trading strategies.