Automatização de estratégias de negociação em MQL5 (Parte 29): Desenvolvimento de um sistema de negociação baseado no padrão harmônico de Gartley e em Price Action
 23
 1

Introdução
No artigo anterior (Parte 28), desenvolvemos um sistema baseado no padrão "Morcego" em MetaQuotes Language 5 (MQL5), capaz de identificar suas formações de alta e de baixa por meio de níveis precisos de Fibonacci. Nesta Parte 29, criaremos um programa para identificar padrões harmônicos de Gartley de alta e de baixa, utilizando pontos de reversão e níveis específicos de retração de Fibonacci. O sistema abrirá operações com pontos de entrada determinados dinamicamente e alvos de lucro em múltiplos níveis. Também incluirá triângulos, linhas de tendência e rótulos para representar visualmente os padrões com clareza. Abordaremos os seguintes tópicos:
- Análise da estrutura do padrão harmônico de Gartley
- Implementação em MQL5
- Testes com dados históricos
- Conclusão
Ao final, você terá uma estratégia de negociação em MQL5 cuidadosamente desenvolvida, baseada no padrão harmônico de Gartley e pronta para ser ajustada conforme suas necessidades. Vamos à implementação!
Análise da estrutura do padrão harmônico de Gartley
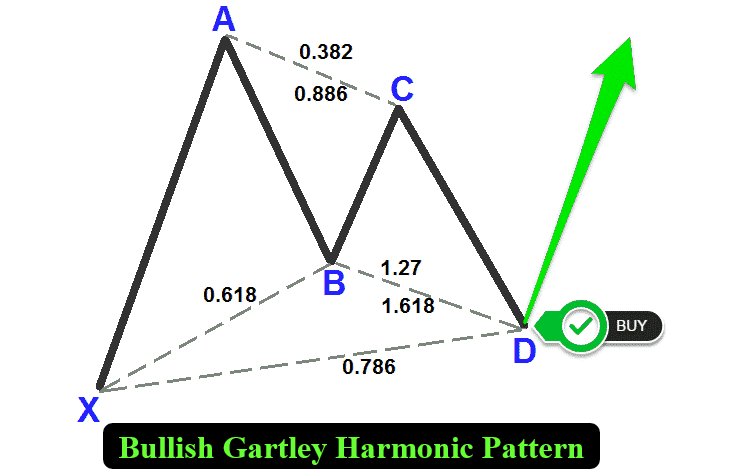
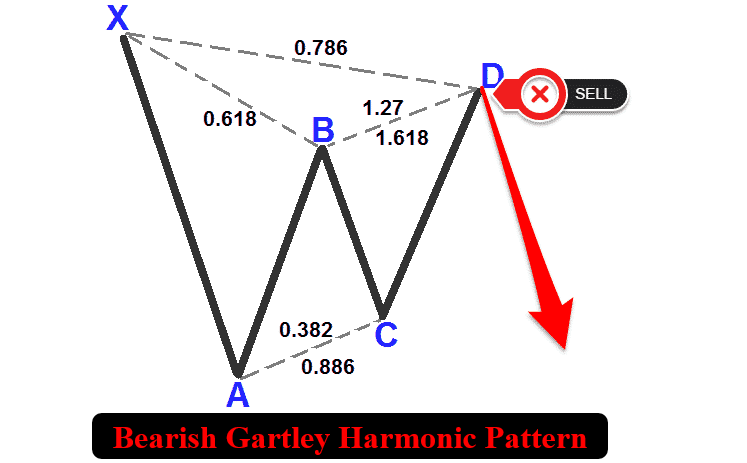
O padrão de Gartley é um padrão harmônico formado por cinco pontos extremos principais, identificados pelas letras X, A, B, C e D. Ele apresenta duas configurações: uma de alta e outra de baixa. Ambas buscam identificar zonas com alta probabilidade de reversão por meio de níveis precisos de Fibonacci. Na configuração de alta, o padrão de Gartley segue a sequência "fundo-topo-fundo-topo-fundo", em que X representa um fundo (swing low), A representa um topo (swing high), B corresponde a um fundo (swing low), com retração de aproximadamente 0,618 do movimento XA, C representa um topo (swing high), com extensão entre 0,382 e 0,886 do movimento AB, e D corresponde a um fundo (swing low), situado acima de X, no nível de retração de 0,786 de XA. Já na configuração de baixa, o padrão de Gartley segue a sequência "topo-fundo-topo-fundo-topo", em que X representa um topo (swing high), A representa um fundo (swing low), B corresponde a um topo (swing high), C representa um fundo (swing low) e D corresponde a um topo (swing high), situado abaixo de X, no nível de retração de 0,786 de XA. A seguir, apresentamos as representações visuais das duas configurações.
Padrão harmônico de Gartley de alta:
Padrão harmônico de Gartley de baixa:
Para identificar esses padrões, adotaremos a seguinte abordagem:
- Definição da onda XA: O movimento inicial do ponto X até o ponto A estabelece a direção do padrão (ascendente para o padrão de alta e descendente para o de baixa) e serve de referência para os cálculos posteriores dos níveis de Fibonacci.
- Formação da onda AB: O ponto B deve apresentar uma retração de aproximadamente 0,618 do comprimento de XA, indicando uma correção significativa, porém controlada, do impulso inicial.
- Análise da onda BC: Esse segmento deve corresponder a um valor entre 0,382 e 0,886 do comprimento de AB, formando um contramovimento que antecede a zona final de reversão.
- Configuração da onda CD: O segmento final deve atingir o nível de retração de 0,786 do comprimento de XA, indicando uma possível zona de reversão no ponto D, onde o padrão se completa e gera um sinal de negociação.
Com base nesses critérios geométricos e nas proporções de Fibonacci, nosso sistema de negociação identificará sistematicamente padrões de Gartley válidos nos dados de preços. Após a confirmação de um padrão, o sistema representará sua formação no gráfico por meio de triângulos, linhas de tendência e rótulos que identificam os pontos X, A, B, C e D, além dos níveis de entrada e take profit das operações. Isso permitirá abrir operações automaticamente no ponto D, com um stop loss calculado e zonas de take profit em múltiplos níveis, aproveitando a capacidade preditiva do padrão para identificar reversões do mercado. Vamos à implementação!
Implementação em MQL5
Para criar o programa em MQL5, abra o MetaEditor, acesse o Navegador, localize a pasta "Indicadores" (Indicators), selecione "Novo" (New) e siga as instruções para criar o arquivo. Após concluir essa etapa, precisaremos declarar algumas variáveis globais no ambiente de desenvolvimento, que serão utilizadas em todo o programa.
//+------------------------------------------------------------------+
//|                                       Gartley Pattern EA.mq5     |
//|                        Copyright 2025, Forex Algo-Trader, Allan. |
//|                                 "https://t.me/Forex_Algo_Trader" |
//+------------------------------------------------------------------+
#property copyright "Forex Algo-Trader, Allan"
#property link      "https://t.me/Forex_Algo_Trader"
#property version   "1.00"
#property description "This EA trades based on Gartley Strategy"
#property strict

//--- Include the trading library for order functions
#include <Trade\Trade.mqh>  //--- Include Trade library
CTrade obj_Trade;  //--- Instantiate a obj_Trade object

//--- Input parameters for user configuration
input int    PivotLeft    = 5;      // Number of bars to the left for pivot check
input int    PivotRight   = 5;      // Number of bars to the right for pivot check
input double Tolerance    = 0.10;   // Allowed deviation (10% of XA move)
input double LotSize      = 0.01;   // Lot size for new orders
input bool   AllowTrading = true;   // Enable or disable trading

//---------------------------------------------------------------------------
//--- Gartley pattern definition:
//
//--- Bullish Gartley:
//---   Pivots (X-A-B-C-D): X swing low, A swing high, B swing low, C swing high, D swing low.
//---   Normally XA > 0; Ideal B = A - 0.618*(A-X); Legs within specified ranges; D at 0.786 retracement.
//
//--- Bearish Gartley:
//---   Pivots (X-A-B-C-D): X swing high, A swing low, B swing high, C swing low, D swing high.
//---   Normally XA > 0; Ideal B = A + 0.618*(X-A); Legs within specified ranges; D at 0.786 retracement.
//---------------------------------------------------------------------------

//--- Structure for a pivot point
struct Pivot {
   datetime time;   //--- Bar time of the pivot
   double   price;  //--- Pivot price (High for swing high, low for swing low)
   bool     isHigh; //--- True if swing high; false if swing low
};

//--- Global dynamic array for storing pivots in chronological order
Pivot pivots[];     //--- Declare a dynamic array to hold identified pivot points

//--- Global variables to lock in a pattern (avoid trading on repaint)
int      g_patternFormationBar = -1;  //--- Bar index where the pattern was formed (-1 means none)
datetime g_lockedPatternX      = 0;   //--- The key X pivot time for the locked pattern
Para estabelecer a base do sistema de negociação com o padrão de Gartley, começaremos incluindo a biblioteca "<Trade\Trade.mqh>" e criando uma instância da classe CTrade chamada "obj_Trade", responsável por gerenciar operações de negociação, como a abertura de posições de compra e venda. Em seguida, definiremos cinco parâmetros de entrada para permitir a personalização do sistema: "PivotLeft" e "PivotRight", ambos com valor 5, estabelecem uma janela de análise de cinco barras de cada lado para identificar pontos de pivô; "Tolerance" recebe o valor 0,10, permitindo uma tolerância de 10% nos níveis de Fibonacci; "LotSize" é definido como 0,01 para determinar o volume das operações; e "AllowTrading" recebe o valor true para habilitar a negociação automática.
Na sequência, definiremos a estrutura "Pivot", com os campos "time" (datetime), "price" (double) e "isHigh" (bool), para armazenar os pontos de reversão dos preços. Declararemos também "pivots" como um array dinâmico para armazenar esses pontos e inicializaremos duas variáveis globais: "g_patternFormationBar" com o valor -1, para acompanhar a barra em que o padrão se forma, e "g_lockedPatternX" com o valor 0, para armazenar a data e a hora do pivô X, utilizadas na confirmação do padrão. Com isso, teremos a estrutura básica necessária para identificar padrões de Gartley e executar operações com base neles. Para a representação visual, poderemos utilizar funções que desenham linhas, rótulos e triângulos no gráfico.
//+------------------------------------------------------------------+
//| Helper: Draw a filled triangle                                   |
//+------------------------------------------------------------------+
void DrawTriangle(string name, datetime t1, double p1, datetime t2, double p2, datetime t3, double p3, color cl, int width, bool fill, bool back) {
   //--- Attempt to create a triangle object with three coordinate points
   if(ObjectCreate(0, name, OBJ_TRIANGLE, 0, t1, p1, t2, p2, t3, p3)) {
      //--- Set the triangle's color
      ObjectSetInteger(0, name, OBJPROP_COLOR, cl);
      //--- Set the triangle's line style to solid
      ObjectSetInteger(0, name, OBJPROP_STYLE, STYLE_SOLID);
      //--- Set the line width of the triangle
      ObjectSetInteger(0, name, OBJPROP_WIDTH, width);
      //--- Determine if the triangle should be filled
      ObjectSetInteger(0, name, OBJPROP_FILL, fill);
      //--- Set whether the object is drawn in the background
      ObjectSetInteger(0, name, OBJPROP_BACK, back);
   }
}

//+------------------------------------------------------------------+
//| Helper: Draw a trend line                                        |
//+------------------------------------------------------------------+
void DrawTrendLine(string name, datetime t1, double p1, datetime t2, double p2, color cl, int width, int style) {
   //--- Create a trend line object connecting two points
   if(ObjectCreate(0, name, OBJ_TREND, 0, t1, p1, t2, p2)) {
      //--- Set the trend line's color
      ObjectSetInteger(0, name, OBJPROP_COLOR, cl);
      //--- Set the trend line's style (solid, dotted, etc.)
      ObjectSetInteger(0, name, OBJPROP_STYLE, style);
      //--- Set the width of the trend line
      ObjectSetInteger(0, name, OBJPROP_WIDTH, width);
   }
}

//+------------------------------------------------------------------+
//| Helper: Draw a dotted trend line                                 |
//+------------------------------------------------------------------+
void DrawDottedLine(string name, datetime t1, double p, datetime t2, color lineColor) {
   //--- Create a horizontal trend line at a fixed price level with dotted style
   if(ObjectCreate(0, name, OBJ_TREND, 0, t1, p, t2, p)) {
      //--- Set the dotted line's color
      ObjectSetInteger(0, name, OBJPROP_COLOR, lineColor);
      //--- Set the line style to dotted
      ObjectSetInteger(0, name, OBJPROP_STYLE, STYLE_DOT);
      //--- Set the line width to 1
      ObjectSetInteger(0, name, OBJPROP_WIDTH, 1);
   }
}

//+------------------------------------------------------------------+
//| Helper: Draw anchored text label (for pivots)                    |
//| If isHigh is true, anchor at the bottom (label appears above);   |
//| if false, anchor at the top (label appears below).               |
//+------------------------------------------------------------------+
void DrawTextEx(string name, string text, datetime t, double p, color cl, int fontsize, bool isHigh) {
   //--- Create a text label object at the specified time and price
   if(ObjectCreate(0, name, OBJ_TEXT, 0, t, p)) {
      //--- Set the text of the label
      ObjectSetString(0, name, OBJPROP_TEXT, text);
      //--- Set the color of the text
      ObjectSetInteger(0, name, OBJPROP_COLOR, cl);
      //--- Set the font size for the text
      ObjectSetInteger(0, name, OBJPROP_FONTSIZE, fontsize);
      //--- Set the font type and style
      ObjectSetString(0, name, OBJPROP_FONT, "Arial Bold");
      //--- Anchor the text depending on whether it's a swing high or low
      if(isHigh)
         ObjectSetInteger(0, name, OBJPROP_ANCHOR, ANCHOR_BOTTOM);
      else
         ObjectSetInteger(0, name, OBJPROP_ANCHOR, ANCHOR_TOP);
      //--- Center-align the text
      ObjectSetInteger(0, name, OBJPROP_ALIGN, ALIGN_CENTER);
   }
}
Vamos implementar as funções de visualização do sistema para representar claramente o padrão e seus níveis de negociação no gráfico. Primeiro, criaremos a função "DrawTriangle", que utiliza ObjectCreate para desenhar um triângulo preenchido (OBJ_TRIANGLE) definido por três pontos, com coordenadas de tempo ("t1", "t2", "t3") e preço ("p1", "p2", "p3"). Usaremos ObjectSetInteger para configurar "OBJPROP_COLOR" com a cor especificada, "OBJPROP_STYLE" como STYLE_SOLID, "OBJPROP_WIDTH" com a espessura definida, "OBJPROP_FILL" para ativar ou desativar o preenchimento e "OBJPROP_BACK" para determinar se o objeto será exibido em primeiro ou segundo plano.
Em seguida, implementaremos a função "DrawTrendLine", que cria uma linha de tendência (OBJ_TREND) entre dois pontos. Depois, desenvolveremos a função "DrawDottedLine", que desenha uma linha horizontal pontilhada usando "OBJ_TREND", no preço especificado, entre "t1" e "t2". Por fim, criaremos a função "DrawTextEx", responsável por inserir um rótulo de texto (OBJ_TEXT) nas coordenadas ("t", "p"). Com ObjectSetString e ObjectSetInteger, definiremos "OBJPROP_TEXT" com o texto especificado, configuraremos "OBJPROP_COLOR" e "OBJPROP_FONTSIZE" e ajustaremos "OBJPROP_FONT" para "Arial Bold". Usaremos "OBJPROP_ANCHOR" para posicionar o texto acima dos topos (swing highs) ou abaixo dos fundos (swing lows), conforme o valor de "isHigh", e "OBJPROP_ALIGN" para centralizá-lo. Dessa forma, garantiremos que o padrão de Gartley e seus níveis de negociação sejam exibidos com clareza no gráfico. Agora, podemos passar ao manipulador OnTick e começar a identificar os pontos de reversão que utilizaremos posteriormente para reconhecer o padrão. Veja a lógica que adotaremos para isso.
//+------------------------------------------------------------------+
//| Expert tick function                                             |
//+------------------------------------------------------------------+
void OnTick() {
   //--- Declare a static variable to store the time of the last processed bar
   static datetime lastBarTime = 0;
   //--- Get the time of the current confirmed bar
   datetime currentBarTime = iTime(_Symbol, _Period, 1);
   //--- If the current bar time is the same as the last processed, exit
   if(currentBarTime == lastBarTime)
      return;
   //--- Update the last processed bar time
   lastBarTime = currentBarTime;

   //--- Clear the pivot array for fresh analysis
   ArrayResize(pivots, 0);
   //--- Get the total number of bars available on the chart
   int barsCount = Bars(_Symbol, _Period);
   //--- Define the starting index for pivot detection (ensuring enough left bars)
   int start = PivotLeft;
   //--- Define the ending index for pivot detection (ensuring enough right bars)
   int end = barsCount - PivotRight;

   //--- Loop through bars from 'end-1' down to 'start' to find pivot points
   for(int i = end - 1; i >= start; i--) {
      //--- Assume current bar is both a potential swing high and swing low
      bool isPivotHigh = true;
      bool isPivotLow = true;
      //--- Get the high and low of the current bar
      double currentHigh = iHigh(_Symbol, _Period, i);
      double currentLow = iLow(_Symbol, _Period, i);
      //--- Loop through the window of bars around the current bar
      for(int j = i - PivotLeft; j <= i + PivotRight; j++) {
         //--- Skip if the index is out of bounds
         if(j < 0 || j >= barsCount)
            continue;
         //--- Skip comparing the bar with itself
         if(j == i)
            continue;
         //--- If any bar in the window has a higher high, it's not a swing high
         if(iHigh(_Symbol, _Period, j) > currentHigh)
            isPivotHigh = false;
         //--- If any bar in the window has a lower low, it's not a swing low
         if(iLow(_Symbol, _Period, j) < currentLow)
            isPivotLow = false;
      }
      //--- If the current bar qualifies as either a swing high or swing low
      if(isPivotHigh || isPivotLow) {
         //--- Create a new pivot structure
         Pivot p;
         //--- Set the pivot's time
         p.time = iTime(_Symbol, _Period, i);
         //--- Set the pivot's price depending on whether it is a high or low
         p.price = isPivotHigh ? currentHigh : currentLow;
         //--- Set the pivot type (true for swing high, false for swing low)
         p.isHigh = isPivotHigh;
         //--- Get the current size of the pivots array
         int size = ArraySize(pivots);
         //--- Increase the size of the pivots array by one
         ArrayResize(pivots, size + 1);
         //--- Add the new pivot to the array
         pivots[size] = p;
      }
   }
}
Nesta etapa, implementaremos a lógica inicial da função OnTick para detectar pontos de reversão, estabelecendo a base para a identificação dos padrões harmônicos de Gartley. Primeiro, declararemos uma variável estática chamada "lastBarTime", inicializada com 0, para registrar a última barra processada. Compararemos seu valor com "currentBarTime", obtido pela função iTime com deslocamento 1 para o símbolo e o período gráfico atuais. Para evitar processamento desnecessário, encerraremos a execução caso o valor não tenha mudado. Quando uma nova barra for detectada, atualizaremos "lastBarTime". Em seguida, limparemos o array "pivots" usando ArrayResize para iniciar uma nova análise.
Depois, obteremos o número total de barras com Bars e definiremos o intervalo de busca dos pontos de pivô, atribuindo a "start" o valor de "PivotLeft" e a "end" o número total de barras menos "PivotRight". Percorreremos as barras de "end - 1" até "start". Para cada barra, consideraremos inicialmente que ela pode representar tanto um topo (swing high), definindo "isPivotHigh" como true, quanto um fundo (swing low), definindo "isPivotLow" como true. Obteremos então seus preços máximo e mínimo por meio de iHigh e "iLow". Em seguida, verificaremos as barras vizinhas dentro dos intervalos definidos por "PivotLeft" e "PivotRight", utilizando "iHigh" e "iLow" para confirmar os pivôs. Descartaremos a possibilidade de um pivô de máxima caso alguma barra vizinha apresente uma máxima superior, ou de um pivô de mínima caso apresente uma mínima inferior. Por fim, se a barra atender aos critérios de um pivô, criaremos uma estrutura "Pivot", preencheremos o campo "time" com o valor retornado por "iTime", definiremos "price" com o preço máximo ou mínimo, conforme "isPivotHigh", e definiremos o valor do sinalizador booleano "isHigh". Depois, ampliaremos o array "pivots" com ArrayResize e armazenaremos a estrutura. Ao exibir os dados dos pivôs, obteremos o seguinte array:
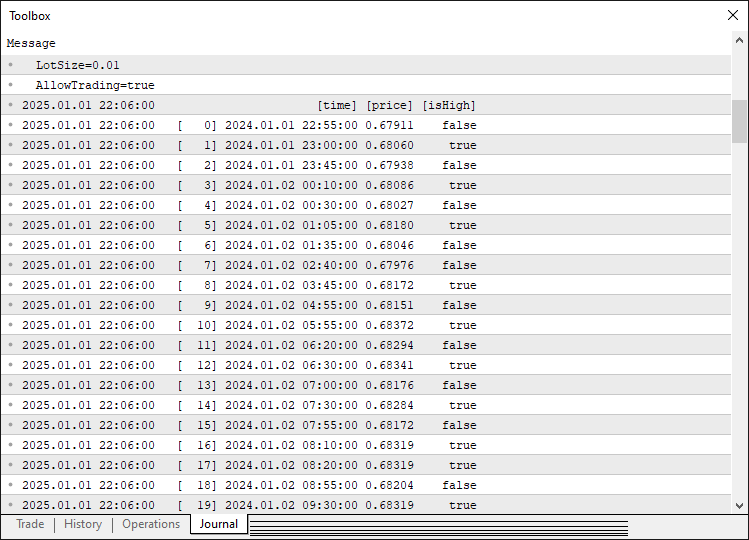
Com esses dados, podemos identificar os pontos de pivô e, se houver pivôs em número suficiente, conseguiremos analisá-los para detectar padrões. A seguir, apresentamos a lógica que implementaremos para isso.
//--- Determine the total number of pivots found
int pivotCount = ArraySize(pivots);
//--- If fewer than five pivots are found, the pattern cannot be formed
if(pivotCount < 5) {
   //--- Reset pattern lock variables
   g_patternFormationBar = -1;
   g_lockedPatternX = 0;
   //--- Exit the OnTick function
   return;
}

//--- Extract the last five pivots as X, A, B, C, and D
Pivot X = pivots[pivotCount - 5];
Pivot A = pivots[pivotCount - 4];
Pivot B = pivots[pivotCount - 3];
Pivot C = pivots[pivotCount - 2];
Pivot D = pivots[pivotCount - 1];

//--- Initialize a flag to indicate if a valid Gartley pattern is found
bool patternFound = false;
//--- Initialize pattern type
string patternType = "";
//--- Check for the high-low-high-low-high (Bearish reversal) structure
if(X.isHigh && (!A.isHigh) && B.isHigh && (!C.isHigh) && D.isHigh) {
   //--- Calculate the difference between pivot X and A
   double diff = X.price - A.price;
   //--- Ensure the difference is positive
   if(diff > 0) {
      //--- Calculate the ideal position for pivot B based on Fibonacci ratio
      double idealB = A.price + 0.618 * diff;
      //--- Check if actual B is within tolerance of the ideal position
      if(MathAbs(B.price - idealB) <= Tolerance * diff) {
         //--- Calculate the AB leg length
         double AB = B.price - A.price;
         //--- Calculate the BC leg length
         double BC = B.price - C.price;
         //--- Verify that BC is within the acceptable Fibonacci range
         if((BC >= 0.382 * AB) && (BC <= 0.886 * AB)) {
            //--- Calculate the retracement
            double retrace = D.price - A.price;
            //--- Verify that the retracement is within tolerance of 0.786 and that D is below X
            if(MathAbs(retrace - 0.786 * diff) <= Tolerance * diff && (D.price < X.price)) {
               patternFound = true;
               patternType = "Bearish";
            }
         }
      }
   }
}
//--- Check for the low-high-low-high-low (Bullish reversal) structure
if((!X.isHigh) && A.isHigh && (!B.isHigh) && C.isHigh && (!D.isHigh)) {
   //--- Calculate the difference between pivot A and X
   double diff = A.price - X.price;
   //--- Ensure the difference is positive
   if(diff > 0) {
      //--- Calculate the ideal position for pivot B based on Fibonacci ratio
      double idealB = A.price - 0.618 * diff;
      //--- Check if actual B is within tolerance of the ideal position
      if(MathAbs(B.price - idealB) <= Tolerance * diff) {
         //--- Calculate the AB leg length
         double AB = A.price - B.price;
         //--- Calculate the BC leg length
         double BC = C.price - B.price;
         //--- Verify that BC is within the acceptable Fibonacci range
         if((BC >= 0.382 * AB) && (BC <= 0.886 * AB)) {
            //--- Calculate the retracement
            double retrace = A.price - D.price;
            //--- Verify that the retracement is within tolerance of 0.786 and that D is above X
            if(MathAbs(retrace - 0.786 * diff) <= Tolerance * diff && (D.price > X.price)) {
               patternFound = true;
               patternType = "Bullish";
            }
         }
      }
   }
}
Primeiro, determinaremos o número total de pivôs com "ArraySize(pivots)", armazenando esse valor em "pivotCount". Se forem encontrados menos de 5 pivôs, encerraremos a execução e redefiniremos "g_patternFormationBar" para -1 e "g_lockedPatternX" para 0, já que o padrão de Gartley exige os pontos X, A, B, C e D. Em seguida, extrairemos do array "pivots" os cinco pivôs mais recentes e os atribuiremos a "X" (o mais antigo), "A", "B", "C" e "D" (o mais recente), formando assim a estrutura do padrão.
Depois, verificaremos a presença de um padrão de Gartley de baixa (X no topo, A no fundo, B no topo, C no fundo e D no topo), calculando a amplitude de XA como "X.price - A.price". Confirmaremos que esse valor é positivo e calcularemos o ponto B ideal como "A.price + 0.618 * diff", verificando com MathAbs se B está dentro da tolerância definida por "Tolerance * diff". Em seguida, validaremos BC dentro da faixa de 0,382 a 0,886 do segmento AB e confirmaremos que AD corresponde a uma retração de 0,786 do segmento XA, com D situado abaixo de X. Se o padrão for válido, definiremos "patternFound" como true e atribuiremos "Bearish" a "patternType". Por fim, verificaremos a presença de um padrão de Gartley de alta (X no fundo, A no topo, B no fundo, C no topo e D no fundo), calculando XA como "A.price - X.price" e confirmando que o valor é positivo. Verificaremos se B está no nível de retração de 0,618, se BC está dentro da faixa de 0,382 a 0,886 de AB e se AD corresponde a 0,786 do comprimento de XA, com D posicionado acima de X. Se o padrão for válido, definiremos "patternFound" como true e atribuiremos "Bullish" a "patternType". Se um padrão for detectado, poderemos passar à sua visualização no gráfico.
//--- If a valid Gartley pattern is detected
if(patternFound) {
   //--- Print a message indicating the pattern type and detection time
   Print(patternType, " Gartley pattern detected at ", TimeToString(D.time, TIME_DATE|TIME_MINUTES|TIME_SECONDS));

   //--- Create a unique prefix for all graphical objects related to this pattern
   string signalPrefix = "GA_" + IntegerToString(X.time);

   //--- Choose triangle color based on the pattern type
   color triangleColor = (patternType=="Bullish") ? clrBlue : clrRed;

   //--- Draw the first triangle connecting pivots X, A, and B
   DrawTriangle(signalPrefix+"_Triangle1", X.time, X.price, A.time, A.price, B.time, B.price,
                triangleColor, 2, true, true);
   //--- Draw the second triangle connecting pivots B, C, and D
   DrawTriangle(signalPrefix+"_Triangle2", B.time, B.price, C.time, C.price, D.time, D.price,
                triangleColor, 2, true, true);
}
Se um padrão válido for detectado ("patternFound" igual a true), registraremos essa detecção com a função Print, exibindo "patternType" ("Bullish" ou "Bearish") e a data e a hora do pivô D, formatadas com TimeToString, incluindo data, minutos e segundos. Em seguida, criaremos o identificador exclusivo "signalPrefix", concatenando "GA_" com "X.time", convertido em string pela função IntegerToString. Depois, definiremos "triangleColor" como azul para padrões de alta e vermelho para padrões de baixa. Por fim, chamaremos "DrawTriangle" duas vezes para visualizar o padrão: primeiro, para desenhar o triângulo XAB, conectando X, A e B; depois, para desenhar o triângulo BCD, conectando B, C e D. Usaremos "signalPrefix" com os sufixos "_Triangle1" e "_Triangle2", os valores correspondentes de tempo e preço dos pivôs, "triangleColor" e largura 2. Também habilitaremos o preenchimento e a exibição em segundo plano por meio de sinalizadores definidos como true. Obteremos o seguinte resultado.
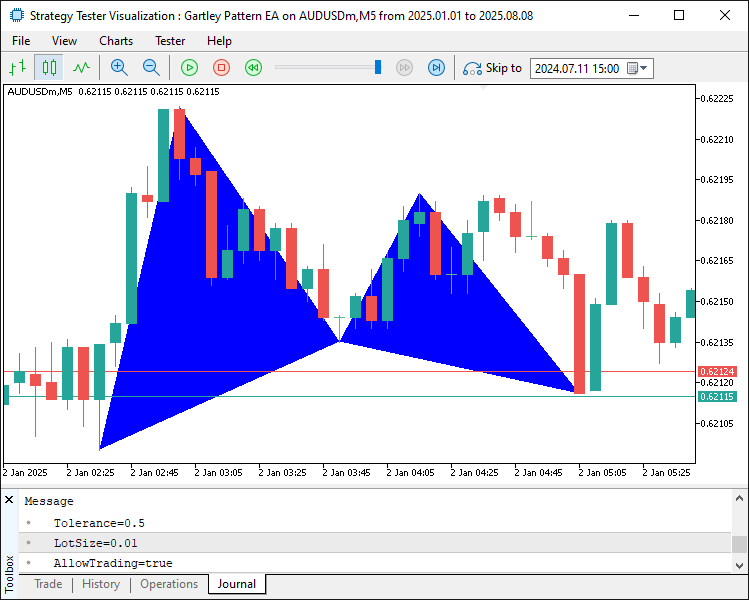
A imagem mostra que o padrão detectado foi representado corretamente no gráfico. Agora, vamos adicionar linhas de tendência para mostrar completamente seu contorno, além de incluir rótulos para facilitar a identificação dos níveis.
//--- Draw boundary trend lines connecting the pivots for clarity
DrawTrendLine(signalPrefix+"_TL_XA", X.time, X.price, A.time, A.price, clrBlack, 2, STYLE_SOLID);
DrawTrendLine(signalPrefix+"_TL_AB", A.time, A.price, B.time, B.price, clrBlack, 2, STYLE_SOLID);
DrawTrendLine(signalPrefix+"_TL_BC", B.time, B.price, C.time, C.price, clrBlack, 2, STYLE_SOLID);
DrawTrendLine(signalPrefix+"_TL_CD", C.time, C.price, D.time, D.price, clrBlack, 2, STYLE_SOLID);
DrawTrendLine(signalPrefix+"_TL_XB", X.time, X.price, B.time, B.price, clrBlack, 2, STYLE_SOLID);
DrawTrendLine(signalPrefix+"_TL_BD", B.time, B.price, D.time, D.price, clrBlack, 2, STYLE_SOLID);

//--- Retrieve the symbol's point size to calculate offsets for text positioning
double point = SymbolInfoDouble(_Symbol, SYMBOL_POINT);
//--- Calculate an offset (15 points) for positioning text above or below pivots
double offset = 15 * point;

//--- Determine the Y coordinate for each pivot label based on its type
double textY_X = (X.isHigh ? X.price + offset : X.price - offset);
double textY_A = (A.isHigh ? A.price + offset : A.price - offset);
double textY_B = (B.isHigh ? B.price + offset : B.price - offset);
double textY_C = (C.isHigh ? C.price + offset : C.price - offset);
double textY_D = (D.isHigh ? D.price + offset : D.price - offset);

//--- Draw text labels for each pivot with appropriate anchoring
DrawTextEx(signalPrefix+"_Text_X", "X", X.time, textY_X, clrBlack, 11, X.isHigh);
DrawTextEx(signalPrefix+"_Text_A", "A", A.time, textY_A, clrBlack, 11, A.isHigh);
DrawTextEx(signalPrefix+"_Text_B", "B", B.time, textY_B, clrBlack, 11, B.isHigh);
DrawTextEx(signalPrefix+"_Text_C", "C", C.time, textY_C, clrBlack, 11, C.isHigh);
DrawTextEx(signalPrefix+"_Text_D", "D", D.time, textY_D, clrBlack, 11, D.isHigh);

//--- Calculate the central label's time as the midpoint between pivots X and B
datetime centralTime = (X.time + B.time) / 2;
//--- Set the central label's price at pivot D's price
double centralPrice = D.price;
//--- Create the central text label indicating the pattern type
if(ObjectCreate(0, signalPrefix+"_Text_Center", OBJ_TEXT, 0, centralTime, centralPrice)) {
   ObjectSetString(0, signalPrefix+"_Text_Center", OBJPROP_TEXT,
      (patternType=="Bullish") ? "Bullish Gartley" : "Bearish Gartley");
   ObjectSetInteger(0, signalPrefix+"_Text_Center", OBJPROP_COLOR, clrBlack);
   ObjectSetInteger(0, signalPrefix+"_Text_Center", OBJPROP_FONTSIZE, 11);
   ObjectSetString(0, signalPrefix+"_Text_Center", OBJPROP_FONT, "Arial Bold");
   ObjectSetInteger(0, signalPrefix+"_Text_Center", OBJPROP_ALIGN, ALIGN_CENTER);
}
Em seguida, aprimoramos a visualização dos padrões detectados, adicionando objetos gráficos detalhados para representar sua estrutura. Primeiro, desenharemos seis linhas de tendência contínuas com "DrawTrendLine", usando um "signalPrefix" exclusivo para conectar os principais pontos de pivô: XA, AB, BC, CD, XB e BD. Essas linhas ligarão os pivôs por seus respectivos valores de tempo e preço, como "X.time" e "X.price". Para destacar os segmentos do padrão, definiremos "OBJPROP_COLOR" como black, "OBJPROP_WIDTH" como 2 e "OBJPROP_STYLE" como "STYLE_SOLID" por meio de ObjectSetInteger. Em seguida, obteremos o tamanho do ponto do símbolo com a função "SymbolInfoDouble(_Symbol, SYMBOL_POINT)" e calcularemos um deslocamento de 15 pontos para posicionar os rótulos. Depois, definiremos as coordenadas Y ("textY_X", "textY_A", "textY_B", "textY_C", "textY_D") somando ou subtraindo esse deslocamento, conforme cada pivô seja um topo ("isHigh" igual a true) ou um fundo, para posicionar os rótulos acima dos topos e abaixo dos fundos.
Na sequência, usaremos "DrawTextEx" para criar rótulos de texto para os pivôs X, A, B, C e D, com "signalPrefix" e sufixos como "_Text_X", exibindo a letra correspondente no instante de tempo do pivô e com a coordenada Y ajustada. Para configurar os rótulos, usaremos a cor "clrBlack" e o tamanho de fonte 11; o sinalizador booleano "isHigh" determinará a ancoragem do texto. Por fim, calcularemos a posição central do rótulo em "centralTime" como o ponto médio entre "X.time" e "B.time", e definiremos "centralPrice" com o valor de "D.price", criando um objeto de texto com ObjectCreate e o nome "signalPrefix + '_Text_Center'". Configuraremos "OBJPROP_TEXT" como "Bullish Gartley" ou "Bearish Gartley", de acordo com "patternType", e ajustaremos "OBJPROP_COLOR" para "clrBlack", "OBJPROP_FONTSIZE" para 11, "OBJPROP_FONT" para "Arial Bold" e "OBJPROP_ALIGN" para "ALIGN_CENTER" usando ObjectSetString e ObjectSetInteger. Essa lógica garante uma representação visual completa da estrutura e do tipo de padrão no gráfico. Ao executar o programa, obteremos o seguinte resultado.
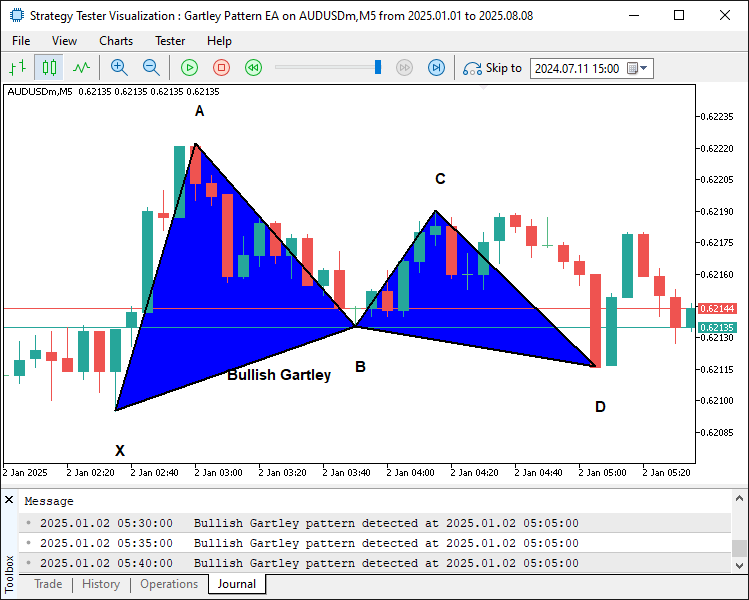
A imagem mostra que adicionamos as linhas de contorno e os rótulos ao padrão, tornando sua visualização mais clara. O próximo passo é definir os níveis de negociação do padrão.
//--- Define start and end times for drawing horizontal dotted lines for trade levels
datetime lineStart = D.time;
datetime lineEnd = D.time + PeriodSeconds(_Period)*2;

//--- Declare variables for entry price and take profit levels
double entryPriceLevel, TP1Level, TP2Level, TP3Level, tradeDiff;
//--- Calculate trade levels based on whether the pattern is Bullish or Bearish
if(patternType=="Bullish") { //--- Bullish → BUY signal
   //--- Use the current ASK price as the entry
   entryPriceLevel = SymbolInfoDouble(_Symbol, SYMBOL_ASK);
   //--- Set TP3 at pivot C's price
   TP3Level = C.price;
   //--- Calculate the total distance to be covered by the trade
   tradeDiff = TP3Level - entryPriceLevel;
   //--- Set TP1 at one-third of the total move
   TP1Level = entryPriceLevel + tradeDiff/3;
   //--- Set TP2 at two-thirds of the total move
   TP2Level = entryPriceLevel + 2*tradeDiff/3;
} else { //--- Bearish → SELL signal
   //--- Use the current BID price as the entry
   entryPriceLevel = SymbolInfoDouble(_Symbol, SYMBOL_BID);
   //--- Set TP3 at pivot C's price
   TP3Level = C.price;
   //--- Calculate the total distance to be covered by the trade
   tradeDiff = entryPriceLevel - TP3Level;
   //--- Set TP1 at one-third of the total move
   TP1Level = entryPriceLevel - tradeDiff/3;
   //--- Set TP2 at two-thirds of the total move
   TP2Level = entryPriceLevel - 2*tradeDiff/3;
}

//--- Draw dotted horizontal lines to represent the entry and TP levels
DrawDottedLine(signalPrefix+"_EntryLine", lineStart, entryPriceLevel, lineEnd, clrMagenta);
DrawDottedLine(signalPrefix+"_TP1Line", lineStart, TP1Level, lineEnd, clrForestGreen);
DrawDottedLine(signalPrefix+"_TP2Line", lineStart, TP2Level, lineEnd, clrGreen);
DrawDottedLine(signalPrefix+"_TP3Line", lineStart, TP3Level, lineEnd, clrDarkGreen);

//--- Define a label time coordinate positioned just to the right of the dotted lines
datetime labelTime = lineEnd + PeriodSeconds(_Period)/2;

//--- Construct the entry label text with the price
string entryLabel = (patternType=="Bullish") ? "BUY (" : "SELL (";
entryLabel += DoubleToString(entryPriceLevel, _Digits) + ")";
//--- Draw the entry label on the chart
DrawTextEx(signalPrefix+"_EntryLabel", entryLabel, labelTime, entryPriceLevel, clrMagenta, 11, true);

//--- Construct and draw the TP1 label
string tp1Label = "TP1 (" + DoubleToString(TP1Level, _Digits) + ")";
DrawTextEx(signalPrefix+"_TP1Label", tp1Label, labelTime, TP1Level, clrForestGreen, 11, true);

//--- Construct and draw the TP2 label
string tp2Label = "TP2 (" + DoubleToString(TP2Level, _Digits) + ")";
DrawTextEx(signalPrefix+"_TP2Label", tp2Label, labelTime, TP2Level, clrGreen, 11, true);

//--- Construct and draw the TP3 label
string tp3Label = "TP3 (" + DoubleToString(TP3Level, _Digits) + ")";
DrawTextEx(signalPrefix+"_TP3Label", tp3Label, labelTime, TP3Level, clrDarkGreen, 11, true);
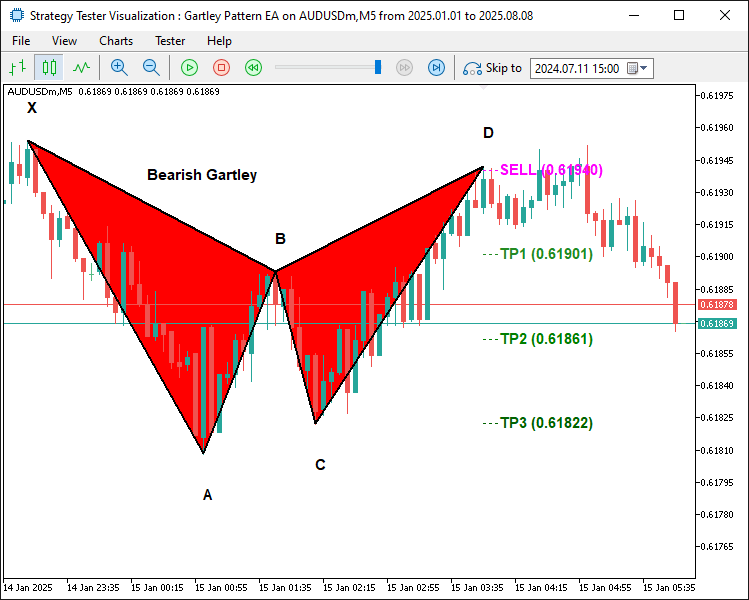
Para definir e visualizar os níveis de negociação do padrão detectado, atribuiremos a "lineStart" a data e a hora do pivô D ("D.time") e definiremos "lineEnd" como dois períodos após esse instante, usando "PeriodSeconds(_Period) * 2". Declararemos as variáveis "entryPriceLevel", "TP1Level", "TP2Level", "TP3Level" e "tradeDiff" para os cálculos das operações. Em seguida, para o padrão de alta ("patternType == 'Bullish'"), definiremos "entryPriceLevel" com o preço atual Ask por meio de SymbolInfoDouble, atribuiremos "TP3Level" ao preço do pivô C, calcularemos "tradeDiff" como "TP3Level - entryPriceLevel" e determinaremos "TP1Level" e "TP2Level" como um terço e dois terços de "tradeDiff", somados a "entryPriceLevel". Para o padrão de baixa, usaremos o preço Bid, atribuiremos "TP3Level" ao preço do ponto C, calcularemos "tradeDiff" como "entryPriceLevel - TP3Level" e obteremos "TP1Level" e "TP2Level" subtraindo um terço e dois terços da diferença entre os preços da operação.
Em seguida, utilizaremos a função "DrawDottedLine" para desenhar quatro linhas horizontais pontilhadas, desde "lineStart" até "lineEnd": uma linha de entrada no nível "entryPriceLevel", na cor magenta, e três linhas de take profit nos níveis "TP1Level" (verde-floresta em tom profundo), "TP2Level" (verde) e "TP3Level" (verde-escuro). Por fim, definiremos "labelTime" como "lineEnd" mais metade da duração de um período e criaremos rótulos de texto com os preços formatados pela função DoubleToString, como "BUY (price)" ou "SELL (price)" para a entrada, "TP1 (price)" e assim por diante. Usaremos "DrawTextEx" para posicionar esses rótulos em "labelTime", com as cores correspondentes, tamanho de fonte 11 e ancoragem acima dos respectivos níveis de preço. Dessa forma, os níveis de entrada e take profit das operações baseadas no padrão de Gartley ficarão claramente identificados no gráfico. Após compilar o programa, obteremos o seguinte resultado.
Padrão de baixa:
Padrão de alta:
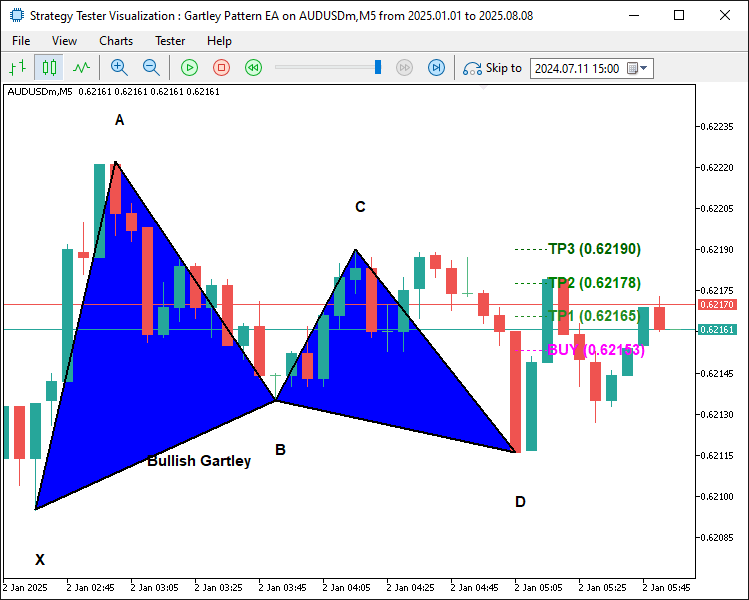
As imagens mostram que os níveis de negociação foram representados corretamente no gráfico. Agora, resta implementar a abertura efetiva das posições.
//--- Retrieve the index of the current bar
int currentBarIndex = Bars(_Symbol, _Period) - 1;
//--- If no pattern has been previously locked, lock the current pattern formation
if(g_patternFormationBar == -1) {
   g_patternFormationBar = currentBarIndex;
   g_lockedPatternX = X.time;
   //--- Print a message that the pattern is detected and waiting for confirmation
   Print("Pattern detected on bar ", currentBarIndex, ". Waiting for confirmation on next bar.");
   return;
}
//--- If still on the same formation bar, the pattern is considered to be repainting
if(currentBarIndex == g_patternFormationBar) {
   Print("Pattern is repainting; still on locked formation bar ", currentBarIndex, ". No trade yet.");
   return;
}
//--- If we are on a new bar compared to the locked formation
if(currentBarIndex > g_patternFormationBar) {
   //--- Check if the locked pattern still corresponds to the same X pivot
   if(g_lockedPatternX == X.time) {
      Print("Confirmed pattern (locked on bar ", g_patternFormationBar, "). Opening trade on bar ", currentBarIndex, ".");
      //--- Update the pattern formation bar to the current bar
      g_patternFormationBar = currentBarIndex;
      //--- Only proceed with trading if allowed and if there is no existing position
      if(AllowTrading && !PositionSelect(_Symbol)) {
         double entryPriceTrade = 0, stopLoss = 0, takeProfit = 0;
         point = SymbolInfoDouble(_Symbol, SYMBOL_POINT);
         bool tradeResult = false;
         //--- For a Bullish pattern, execute a BUY trade
         if(patternType=="Bullish") {  //--- BUY signal
            entryPriceTrade = SymbolInfoDouble(_Symbol, SYMBOL_ASK);
            double diffTrade = TP2Level - entryPriceTrade;
            stopLoss = entryPriceTrade - diffTrade * 3;
            takeProfit = TP2Level;
            tradeResult = obj_Trade.Buy(LotSize, _Symbol, entryPriceTrade, stopLoss, takeProfit, "Gartley Signal");
            if(tradeResult)
               Print("Buy order opened successfully.");
            else
               Print("Buy order failed: ", obj_Trade.ResultRetcodeDescription());
         }
         //--- For a Bearish pattern, execute a SELL trade
         else if(patternType=="Bearish") {  //--- SELL signal
            entryPriceTrade = SymbolInfoDouble(_Symbol, SYMBOL_BID);
            double diffTrade = entryPriceTrade - TP2Level;
            stopLoss = entryPriceTrade + diffTrade * 3;
            takeProfit = TP2Level;
            tradeResult = obj_Trade.Sell(LotSize, _Symbol, entryPriceTrade, stopLoss, takeProfit, "Gartley Signal");
            if(tradeResult)
               Print("Sell order opened successfully.");
            else
               Print("Sell order failed: ", obj_Trade.ResultRetcodeDescription());
         }
      }
      else {
         //--- If a position is already open, do not execute a new trade
         Print("A position is already open for ", _Symbol, ". No new trade executed.");
      }
   }
   else {
      //--- If the pattern has changed, update the lock with the new formation bar and X pivot
      g_patternFormationBar = currentBarIndex;
      g_lockedPatternX = X.time;
      Print("Pattern has changed; updating lock on bar ", currentBarIndex, ". Waiting for confirmation.");
      return;
   }
}
}
else {
   //--- If no valid Gartley pattern is detected, reset the pattern lock variables
   g_patternFormationBar = -1;
   g_lockedPatternX = 0;
}
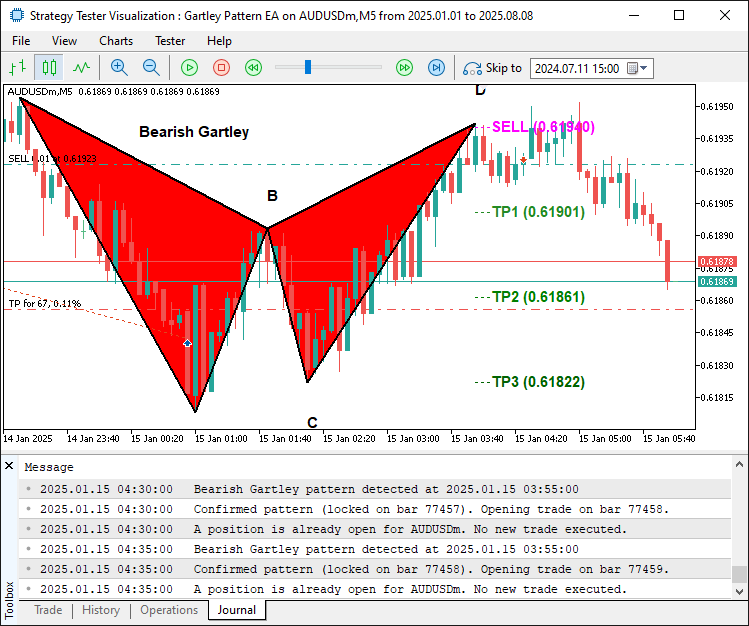
Nesta etapa, concluiremos a lógica do manipulador OnTick, implementando a abertura de operações e a confirmação dos padrões detectados. Primeiro, obteremos o índice da barra atual por meio da expressão "Bars(_Symbol, _Period) - 1" e armazenaremos o resultado em "currentBarIndex". Em seguida, se não houver nenhum padrão com a formação registrada ("g_patternFormationBar == -1"), atribuiremos "currentBarIndex" a "g_patternFormationBar", armazenaremos a data e a hora do pivô X ("X.time") em "g_lockedPatternX" e registraremos no log que um padrão foi detectado e aguarda confirmação. Depois, encerraremos a execução. Se o padrão ainda estiver na mesma barra em que sua formação foi registrada ("currentBarIndex == g_patternFormationBar"), consideraremos que a formação do padrão ainda pode mudar (repainting) e encerraremos a execução para evitar a abertura prematura de operações.
Por fim, se uma nova barra tiver se formado ("currentBarIndex > g_patternFormationBar") e o pivô X corresponder ao valor armazenado em "g_lockedPatternX", confirmaremos o padrão, registraremos a confirmação no log, atualizaremos "g_patternFormationBar" e verificaremos se a negociação está habilitada e, usando PositionSelect, se não há posição aberta para o símbolo consultado. Para um padrão de alta, definiremos "entryPriceTrade" com o preço Ask, calcularemos "diffTrade" como "TP2Level - entryPriceTrade" e posicionaremos "stopLoss" abaixo do preço de entrada, a uma distância equivalente a três vezes "diffTrade". Definiremos "takeProfit" como "TP2Level" e abriremos uma operação de compra com "obj_Trade.Buy", utilizando "LotSize" e o comentário "Gartley Signal", registrando no log se a operação foi executada com sucesso ou se houve falha. Para um padrão de baixa, utilizaremos o preço Bid, posicionaremos "stopLoss" acima do preço de entrada, a uma distância equivalente a três vezes a diferença calculada, e abriremos uma operação de venda com "obj_Trade.Sell". Se a negociação estiver desabilitada ou já existir uma posição aberta para o símbolo consultado, registraremos no log que nenhuma nova operação será executada. Se o padrão mudar, atualizaremos os dados armazenados e aguardaremos uma nova confirmação. Caso nenhum padrão seja encontrado, redefiniremos as variáveis globais. Após compilar o programa, obteremos o seguinte resultado.
Sinal de baixa:
Sinal de alta:
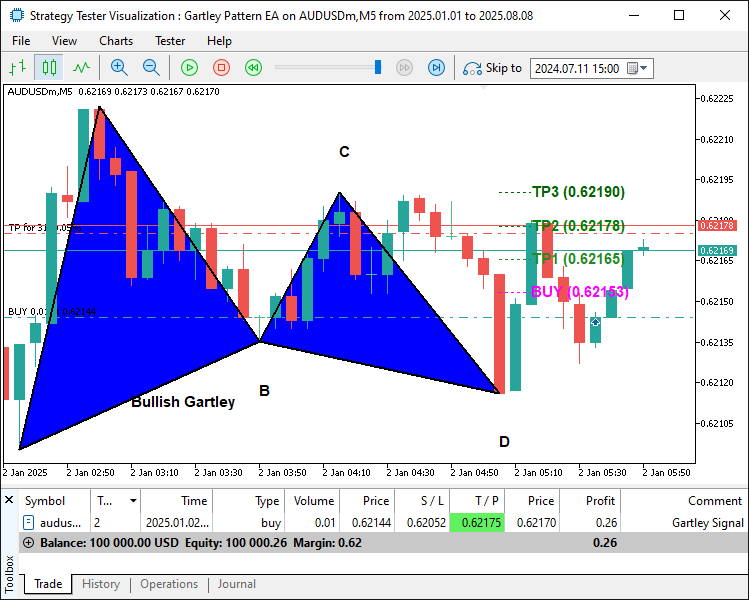
As imagens mostram que conseguimos representar graficamente o padrão harmônico e executar operações com base nele assim que sua formação for confirmada. Com isso, atingimos nosso objetivo de identificar, visualizar e negociar o padrão de Gartley. Agora, resta testar o programa com dados históricos, como veremos na próxima seção.
Testes com dados históricos
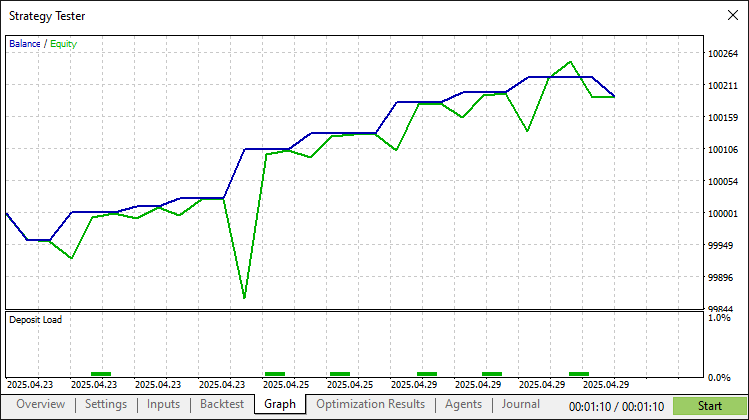
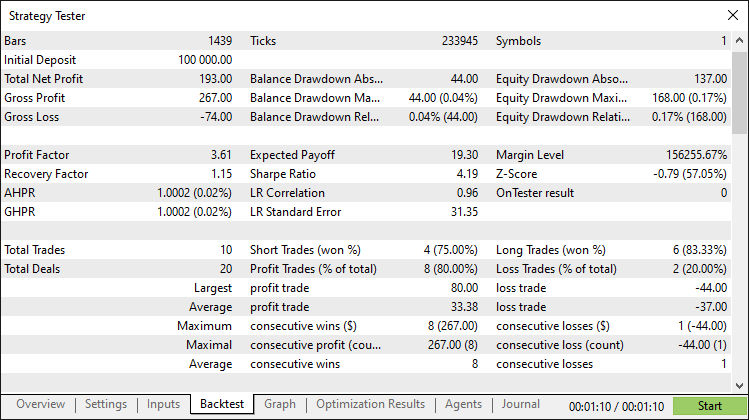
Após realizar testes históricos detalhados, obtivemos os seguintes resultados.
Gráfico dos testes históricos:
Relatório dos testes históricos:
Conclusão
Neste artigo, desenvolvemos um sistema de negociação em MQL5 baseado no padrão de Gartley. O sistema utiliza a ação do preço (Price Action) para identificar padrões harmônicos de Gartley de alta e de baixa com níveis precisos de Fibonacci, automatiza a execução de operações com pontos de entrada e níveis de stop loss calculados, além de alvos de take profit em múltiplos níveis. Também representa visualmente os padrões por meio de objetos gráficos, como triângulos e linhas de tendência.
Isenção de responsabilidade: O conteúdo deste artigo destina-se exclusivamente a fins educacionais. A negociação nos mercados financeiros envolve riscos significativos, e a volatilidade do mercado pode resultar em perdas. Antes de utilizar este programa em condições reais de mercado, é fundamental realizar testes históricos rigorosos e adotar práticas adequadas de gerenciamento de riscos.
Com os conceitos e métodos de implementação apresentados, você poderá adaptar este sistema baseado no padrão de Gartley ao seu estilo de negociação e aprimorar suas estratégias algorítmicas. Boas negociações!
Traduzido do Inglês pela MetaQuotes Ltd.
Artigo original: https://www.mql5.com/en/articles/19111
Aviso: Todos os direitos sobre esses materiais pertencem à MetaQuotes Ltd. É proibida a reimpressão total ou parcial.
Esse artigo foi escrito por um usuário do site e reflete seu ponto de vista pessoal. A MetaQuotes Ltd. não se responsabiliza pela precisão das informações apresentadas nem pelas possíveis consequências decorrentes do uso das soluções, estratégias ou recomendações descritas.