
Como criar um painel de informações para exibir dados em indicadores e Expert Advisors

Conteúdo
- Introdução
- Classes para obter dados tabulares
- Classe de painel
- Indicador com painel de informações
- Conclusão
Introdução
Hoje vamos começar criando um painel que pode exibir os dados especificados pelo desenvolvedor. Esse painel será útil para a apresentação visual dos dados no gráfico e durante a depuração visual, quando for mais prático observar os dados no painel do que localizá-los no depurador. Por exemplo, nos casos em que a depuração da estratégia depende dos valores de alguns valores de dados, mas não da depuração do código no depurador.
Faremos o painel como um protótipo da janela de dados no terminal e o preencheremos com os mesmos dados:
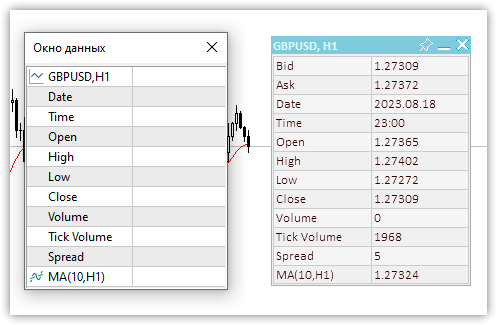
Figura 1- Janela de dados e painel de informações
Nosso painel personalizado nos permitirá adicionar a ele qualquer quantidade de dados necessária, rotulá-los (por um título) e exibir/atualizar as leituras do código do nosso programa.
O painel pode ser: movido pelo gráfico com o mouse, fixado no local necessário do gráfico e recolhido/expandido. Quanto à colocação dos dados no painel, será possível exibir uma tabela com um número especificado de linhas e colunas. Os dados dessa tabela podem ser impressos no log (coordenadas X e Y de cada célula da tabela) e obtidos via programação - para especificar o número de linhas e colunas onde esses dados devem estar - ou simplesmente imprimir as coordenadas no log e, a partir delas, escrever as necessárias em seu código. Esse primeiro método é mais conveniente por causa de sua total automação. O painel também terá um botão de fechamento ativo, mas delegamos seu processamento ao programa de controle, pois somente o desenvolvedor do programa deve decidir como reagir ao pressionar o botão de fechamento. Quando o botão for clicado, um evento personalizado será enviado ao manipulador de eventos do programa, que o desenvolvedor poderá manipular como achar adequado e pretender.
Classes para obter dados tabulares
Visto que é prático ordenar os dados no painel de acordo com coordenadas predefinidas (visual ou virtualmente), primeiramente criaremos classes para a organização de dados tabulares. A tabela pode ser representada como uma grade simples, cujas interseções de linhas serão as coordenadas das células da tabela. Por essas coordenadas, podemos colocar qualquer dado visual. Uma tabela tem um determinado número de linhas (linhas horizontais) e cada linha tem um determinado número de células (linhas verticais). Em uma tabela de grade simples, todas as linhas têm o mesmo número de células.
Com base nisso, precisamos de três classes:
- Classe de célula de tabela,
- Classe de linha de tabela,
- Classe de tabela.
A classe de célula da tabela inclui: o número da linha, o número da coluna na tabela, bem como as coordenadas da localização visual da célula da tabela no painel, assim como as coordenadas X e Y em relação à origem das coordenadas da tabela no canto superior esquerdo do painel.
A classe de linha da tabela inclui a classe de célula da tabela. Com ela é possível criar o número necessário de células em uma mesma linha.
A classe table inclui uma lista das linhas da tabela. As linhas da tabela podem ser criadas e adicionadas tanto quantas forem necessárias.
Vamos dar uma breve olhada nas três classes.
Classe de célula de tabela
//+------------------------------------------------------------------+
//| Table cell class                                                 |
//+------------------------------------------------------------------+
class CTableCell : public CObject
  {
private:
   int               m_row;                     // Row
   int               m_col;                     // Column
   int               m_x;                       // X coordinate
   int               m_y;                       // Y coordinate
public:
//--- Methods of setting values
   void              SetRow(const uint row)     { this.m_row=(int)row;  }
   void              SetColumn(const uint col)  { this.m_col=(int)col;  }
   void              SetX(const uint x)         { this.m_x=(int)x;      }
   void              SetY(const uint y)         { this.m_y=(int)y;      }
   void              SetXY(const uint x,const uint y)
                       {
                        this.m_x=(int)x;
                        this.m_y=(int)y;
                       }
//--- Methods of obtaining values
   int               Row(void)            const { return this.m_row;    }
   int               Column(void)         const { return this.m_col;    }
   int               X(void)              const { return this.m_x;      }
   int               Y(void)              const { return this.m_y;      }
//--- Virtual method for comparing two objects
   virtual int       Compare(const CObject *node,const int mode=0) const
                       {
                        const CTableCell *compared=node;
                        return(this.Column()>compared.Column() ? 1 : this.Column()<compared.Column() ? -1 : 0);
                       }
//--- Constructor/destructor
                     CTableCell(const int row,const int column) : m_row(row),m_col(column){}
                    ~CTableCell(void){}
  };
A classe é herdada da classe base para construir a Biblioteca Padrão MQL5, pois será colocada nas listas CarrayObj da Biblioteca Padrão MQL5, que pode acomodar apenas objetos CObject ou objetos herdados do CObject base.
O objetivo de todas as variáveis e métodos é bastante transparente e claro. As variáveis são usadas para armazenar valores de linha (Row) e coluna (Column) da tabela, e as coordenadas são coordenadas relativas do canto superior esquerdo da célula da tabela no painel. Com essas coordenadas, é possível desenhar ou colocar algo no painel.
O método virtual Compare é necessário para localizar e comparar dois objetos-células da tabela. O método é declarado na classe do objeto base CObject:
   //--- method of comparing the objects
   virtual int       Compare(const CObject *node,const int mode=0) const { return(0);      }
Ele retorna zero e deve ser substituído em classes herdadas.
Como as células da tabela são adicionadas à linha da tabela, ou seja, visualmente na horizontal, a pesquisa e a comparação devem ser realizadas por números de células horizontais, ou seja, pelo valor da coluna. É exatamente isso que o método virtual substituído Compare faz aqui:
//--- Virtual method for comparing two objects
   virtual int       Compare(const CObject *node,const int mode=0) const
                       {
                        const CTableCell *compared=node;
                        return(this.Column()>compared.Column() ? 1 : this.Column()<compared.Column() ? -1 : 0);
                       }
Se o valor da coluna do objeto atual for maior do que o que está sendo comparado (cujo ponteiro é passado para o método), ele retornará 1, Se o valor da coluna do objeto atual for menor do que o que está sendo comparado, ele retornará -1. Caso contrário, é retornado zero. Assim, o valor nulo retornado pelo método indica que os valores dos objetos comparados são iguais.
Classe de linha de tabela
A linha da tabela receberá objetos-células. Enquanto as células em uma linha são ordenadas uma após a outra, horizontalmente, as linhas em uma tabela são ordenadas uma abaixo da outra, verticalmente.
Aqui só precisamos saber o número da linha e sua coordenada Y no painel:
//+------------------------------------------------------------------+
//| Table row class                                                  |
//+------------------------------------------------------------------+
class CTableRow : public CObject
  {
private:
  CArrayObj          m_list_cell;               // Cell list
  int                m_row;                     // Row index
  int                m_y;                       // Y coordinate
public:
//--- Return the list of table cells in a row
   CArrayObj        *GetListCell(void)       { return &this.m_list_cell;         }
//--- Return (1) the number of table cells in a row (2) the row index in the table
   int               CellsTotal(void)  const { return this.m_list_cell.Total();  }
   int               Row(void)         const { return this.m_row;                }
//--- (1) Set and (2) return the Y row coordinate
   void              SetY(const int y)       { this.m_y=y;                       }
   int               Y(void)           const { return this.m_y;                  }
//--- Add a new table cell to the row
   bool              AddCell(CTableCell *cell)
                       {
                        this.m_list_cell.Sort();
                        if(this.m_list_cell.Search(cell)!=WRONG_VALUE)
                          {
                           ::PrintFormat("%s: Table cell with index %lu is already in the list",__FUNCTION__,cell.Column());
                           return false;
                          }
                        if(!this.m_list_cell.InsertSort(cell))
                          {
                           ::PrintFormat("%s: Failed to add table cell with index %lu to list",__FUNCTION__,cell.Column());
                           return false;
                          }
                        return true;
                       }
//--- Return the pointer to the specified cell in the row
   CTableCell       *GetCell(const int column)
                       {
                        const CTableCell *obj=new CTableCell(this.m_row,column);
                        int index=this.m_list_cell.Search(obj);
                        delete obj;
                        return this.m_list_cell.At(index);
                       }
//--- Virtual method for comparing two objects
   virtual int       Compare(const CObject *node,const int mode=0) const
                       {
                        const CTableRow *compared=node;
                        return(this.Row()>compared.Row() ? 1 : this.Row()<compared.Row() ? -1 : 0);
                       }
//--- Constructor/destructor
                     CTableRow(const int row) : m_row(row)  { this.m_list_cell.Clear();   }
                    ~CTableRow(void)                        { this.m_list_cell.Clear();   }
  };
Na classe, é declarada a lista CArrayObj, que conterá os objetos-células recém-criados.
No método virtual Compare, comparamos os objetos pelo valor do número da linha, porque, ao adicionar uma nova linha, precisaremos fazer a pesquisa apenas com base no número da linha. Se não houver nenhuma linha com esse número, o método de pesquisa (Search) retornará -1; caso contrário, se o objeto existir, a pesquisa retornará o índice da posição do objeto encontrado na lista. O método Search é declarado e implementado na classe CArrayObj:
//+------------------------------------------------------------------+
//| Search of position of element in a sorted array                  |
//+------------------------------------------------------------------+
int CArrayObj::Search(const CObject *element) const
  {
   int pos;
//--- check
   if(m_data_total==0 || !CheckPointer(element) || m_sort_mode==-1)
      return(-1);
//--- search
   pos=QuickSearch(element);
   if(m_data[pos].Compare(element,m_sort_mode)==0)
      return(pos);
//--- not found
   return(-1);
  }
Como podemos ver, ele usa o método virtual de comparação de dois objetos Compare para determinar se os objetos são iguais.
Método que adiciona uma nova célula à lista:
//--- Add a new table cell to the row
   bool              AddCell(CTableCell *cell)
                       {
                        this.m_list_cell.Sort();
                        if(this.m_list_cell.Search(cell)!=WRONG_VALUE)
                          {
                           ::PrintFormat("%s: Table cell with index %lu is already in the list",__FUNCTION__,cell.Column());
                           return false;
                          }
                        if(!this.m_list_cell.InsertSort(cell))
                          {
                           ::PrintFormat("%s: Failed to add table cell with index %lu to list",__FUNCTION__,cell.Column());
                           return false;
                          }
                        return true;
                       }
Como as células são ordenadas na lista estritamente uma após a outra por números de coluna, e nós as adicionamos em ordem de classificação, a lista deve ter um sinalizador de lista classificada, que é definido primeiro. Se a busca por um objeto na lista retornar um valor diferente de -1, isso significa que esse objeto já está na lista, e uma mensagem é impressa no log e retorna false. Da mesma forma, se não conseguirmos adicionar um ponteiro a um objeto na lista, também informaremos isso e retornaremos false. Se tudo estiver OK, retornamos true.
Método que retorna um ponteiro para a célula especificada em uma linha:
//--- Return the pointer to the specified cell in the row
   CTableCell       *GetCell(const int column)
                       {
                        const CTableCell *obj=new CTableCell(this.m_row,column);
                        int index=this.m_list_cell.Search(obj);
                        delete obj;
                        return this.m_list_cell.At(index);
                       }
O método Search da classe CArrayObj da Biblioteca Padrão procura na lista se há uma instância do objeto cujo ponteiro é passado para o método. Dessa forma, aqui nós criamos um novo objeto temporário, especificamos em seu construtor o número da coluna passada para o método, recebemos o índice do objeto na lista, ou -1 se o objeto com esses parâmetros não for encontrado na lista, necessariamente excluímos o objeto temporário e retornamos o ponteiro para o objeto encontrado na lista.
Caso o objeto não seja encontrado e o índice seja -1, então o método At da classe CArrayObj retornará NULL.
Classe de tabela
Uma tabela consiste em uma lista de linhas, que, por sua vez, consistem em listas de células. Ou seja, a classe de dados da tabela tem essencialmente apenas um objeto CArrayObj no qual as linhas a serem criadas são colocadas e métodos para adicionar e recuperar linhas e células da tabela:
//+------------------------------------------------------------------+
//| Table data class                                                 |
//+------------------------------------------------------------------+
class CTableData : public CObject
  {
private:
   CArrayObj         m_list_rows;               // List of rows
public:
//--- Return the list of table rows
   CArrayObj        *GetListRows(void)       { return &this.m_list_rows;   }
//--- Add a new row to the table
   bool              AddRow(CTableRow *row)
                       {
                        //--- Set the sorted list flag
                        this.m_list_rows.Sort();
                        //--- If such an object is already in the list (the search returns the object index, not -1),
                        //--- inform of that in the journal and return 'false'
                        if(this.m_list_rows.Search(row)!=WRONG_VALUE)
                          {
                           ::PrintFormat("%s: Table row with index %lu is already in the list",__FUNCTION__,row.Row());
                           return false;
                          }
                        //--- If failed to add the pointer to the sorted list, inform of that and return 'false'
                        if(!this.m_list_rows.InsertSort(row))
                          {
                           ::PrintFormat("%s: Failed to add table cell with index %lu to list",__FUNCTION__,row.Row());
                           return false;
                          }
                        //--- Successful - return 'true'
                        return true;
                       }
//--- Return the pointer to the (1) specified row and (2) specified cell in the specified table row
   CTableRow        *GetRow(const int index) { return this.m_list_rows.At(index);   }
   CTableCell       *GetCell(const int row,const int column)
                       {
                        //--- Get a pointer to a string object in a list of strings
                        CTableRow *row_obj=this.GetRow(row);
                        //--- If failed to get the object, return NULL
                        if(row_obj==NULL)
                           .return NULL;
                        //--- Get the pointer to the cell object in the row by a column number and
                        CTableCell *cell=row_obj.GetCell(column);
                        //--- return the result (object pointer or NULL)
                        return cell;
                       }
//--- Write the X and Y coordinates of the specified table cell into the variables passed to the method
   void              CellXY(const uint row,const uint column, int &x, int &y)
                       {
                        x=WRONG_VALUE;
                        y=WRONG_VALUE;
                        CTableCell *cell=this.GetCell(row,column);
                        if(cell==NULL)
                           return;
                        x=cell.X();
                        y=cell.Y();
                       }
//--- Return the X coordinate of the specified table cell
   int               CellX(const uint row,const uint column)
                       {
                        CTableCell *cell=this.GetCell(row,column);
                        return(cell!=NULL ? cell.X() : WRONG_VALUE);
                       }
//--- Return the Y coordinate of the specified table cell
   int               CellY(const uint row,const uint column)
                       {
                        CTableCell *cell=this.GetCell(row,column);
                        return(cell!=NULL ? cell.Y() : WRONG_VALUE);
                       }
//--- Return the number of table (1) rows and (2) columns
   int               RowsTotal(void)            { return this.m_list_rows.Total();  }
   int               ColumnsTotal(void)
                       {
                        //--- If there is no row in the list, return 0
                        if(this.RowsTotal()==0)
                           return 0;
                        //--- Get a pointer to the first row and return the number of cells in it
                        CTableRow *row=this.GetRow(0);
                        return(row!=NULL ? row.CellsTotal() : 0);
                       }
//--- Return the total number of cells in the table
   int               CellsTotal(void){ return this.RowsTotal()*this.ColumnsTotal(); }
//--- Clear lists of rows and table cells
   void              Clear(void)
                       {
                        //--- In the loop by the number of rows in the list of table rows,
                        for(int i=0;i<this.m_list_rows.Total();i++)
                          {
                           //--- get the pointer to the next line
                           CTableRow *row=this.m_list_rows.At(i);
                           if(row==NULL)
                              continue;
                           //--- get cell list from the obtained row object,
                           CArrayObj *list_cell=row.GetListCell();
                           //--- clear cell list
                           if(list_cell!=NULL)
                              list_cell.Clear();
                          }
                        //--- Clear cell list
                        this.m_list_rows.Clear();
                       }
//--- Print the table cell data in the journal
   void              Print(const uint indent=0)
                       {
                        //--- Print the header in the journal
                        ::PrintFormat("Table: Rows: %lu, Columns: %lu",this.RowsTotal(),this.ColumnsTotal());
                        //--- In the loop by table rows
                        for(int r=0;r<this.RowsTotal();r++)
                           //--- in the loop by the next row cells,
                           for(int c=0;c<this.ColumnsTotal();c++)
                             {
                              //--- get the pointer to the next cell and display its data in the journal
                              CTableCell *cell=this.GetCell(r,c);
                              if(cell!=NULL)
                                 ::PrintFormat("%*s%-5s %-4lu %-8s %-6lu %-8s %-6lu %-8s %-4lu",indent,"","Row",r,"Column",c,"Cell X:",cell.X(),"Cell Y:",cell.Y());
                             }
                       }
//--- Constructor/destructor
                     CTableData(void)  { this.m_list_rows.Clear();   }
                    ~CTableData(void)  { this.m_list_rows.Clear();   }
  };
Quase todos os métodos aqui estão comentados no código. Mencionarei apenas os métodos que retornam o número de linhas e colunas na tabela e o número total de células na tabela.
O número de linhas é o tamanho da lista de linhas, ou seja, quantas linhas há na tabela, que é o número retornado:
int RowsTotal(void) { return this.m_list_rows.Total(); }
Mas o número de colunas é retornado aqui apenas com a suposição de que seu número é o mesmo em cada linha, e somente o número de células na primeira linha (linha com índice zero na lista) é retornado:
   int               ColumnsTotal(void)
                       {
                        //--- If there is no row in the list, return 0
                        if(this.RowsTotal()==0)
                           return 0;
                        //--- Get a pointer to the first row and return the number of cells in it
                        CTableRow *row=this.GetRow(0);
                        return(row!=NULL ? row.CellsTotal() : 0);
                       }
Ao estender e refinar essa classe, será possível adicionar métodos que retornem o número de células na linha especificada e, consequentemente, não retornem o número total de células na tabela multiplicando o número (exato) de linhas na tabela pelo número de células na primeira linha (aqui com a premissa mencionada acima):
int CellsTotal(void){ return this.RowsTotal()*this.ColumnsTotal(); }
Mas para esta versão da classe de dados tabulares, isso é suficiente para um cálculo preciso, e não devemos complicar ainda, porque essas são apenas classes auxiliares para a classe de painel de informações, onde usaremos a marcação de tabela (grade) para colocar os dados no painel.
Classe de painel
Para acompanhar os estados do mouse e de seus botões em relação ao painel e seus controles, vamos definir todos os estados que podem ocorrer:
- Nenhum dos botões (esquerdo, direito) do mouse está pressionado;
- Botão do mouse pressionado fora da janela do painel;
- Botão do mouse pressionado dentro da janela do painel;
- Botão do mouse pressionado dentro da barra de título da janela do painel;
- Botão do mouse pressionado sobre o controle "fechar";
- Botão do mouse pressionado no controle "recolher/expandir";
- Botão do mouse pressionado no controle "fixar";
- Cursor do mouse fora da janela do painel;
- Cursor do mouse dentro da janela do painel;
- Cursor do mouse dentro da barra de título da janela do painel;
- Cursor do mouse dentro do controle "fechar";
- Cursor do mouse dentro do controle "recolher/expandir";
- Cursor do mouse dentro do controle "fixar".
Vejamos como criar a enumeração correspondente:
enum ENUM_MOUSE_STATE
  {
   MOUSE_STATE_NOT_PRESSED,
   MOUSE_STATE_PRESSED_OUTSIDE_WINDOW,
   MOUSE_STATE_PRESSED_INSIDE_WINDOW,
   MOUSE_STATE_PRESSED_INSIDE_HEADER,
   MOUSE_STATE_PRESSED_INSIDE_CLOSE,
   MOUSE_STATE_PRESSED_INSIDE_MINIMIZE,
   MOUSE_STATE_PRESSED_INSIDE_PIN,
   MOUSE_STATE_OUTSIDE_WINDOW,
   MOUSE_STATE_INSIDE_WINDOW,
   MOUSE_STATE_INSIDE_HEADER,
   MOUSE_STATE_INSIDE_CLOSE,
   MOUSE_STATE_INSIDE_MINIMIZE,
   MOUSE_STATE_INSIDE_PIN
  };
Nesse ponto, está implementado o rastreamento da retenção do botão do mouse ou do clique nos controles do painel. Isso significa que o primeiro pressionamento é um acionador para fixar o estado. No entanto, nos aplicativos do Windows, esse acionador é a liberação de um botão depois que ele é pressionado, ou seja, um clique. O ato de clicar e manter pressionado é usado para arrastar objetos. Mas, por enquanto, precisamos apenas de uma solução simples: o primeiro toque será considerado um clique ou uma retenção. Caso o painel seja desenvolvido posteriormente, será possível complicar o manuseio dos botões do mouse para corresponder ao comportamento descrito acima.
A classe CDashboard consistirá em dois elementos: a tela (underlay), onde o design do painel e os elementos de controle serão desenhados, e a área de trabalho, onde os dados colocados no painel serão desenhados. A área de trabalho sempre será totalmente transparente, enquanto a tela terá valores de transparência separados para o título e todo o resto:
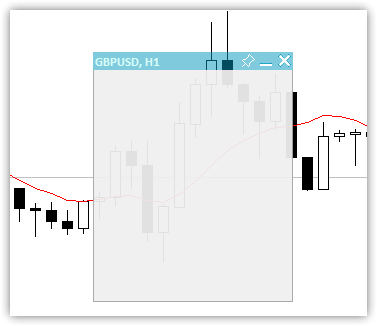
Figura 2 - Tela somente com transparência diferente para o título e a caixa com uma borda
A área abaixo do título, contornada com uma borda, é usada para colocar a área de trabalho - totalmente transparente - na qual são colocados os textos de dados. Além disso, a área de tela abaixo do título pode servir para design visual, em cujo caso as tabelas passam a ser desenhadas nela:
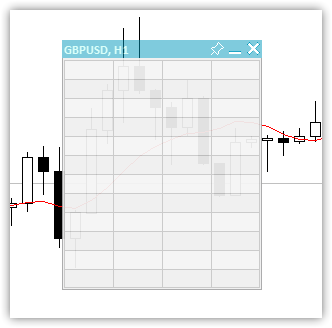
Figura 3 - Tabela de 12 linhas com 4 colunas
E a área de trabalho com dados é sobreposta na parte superior da tela formatada. Como resultado, obtemos um painel formatado:
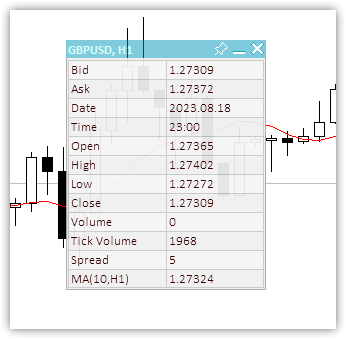
Figura 4 - Aspecto do painel com uma tabela de fundo 12x2 e dados sobre ela
Os valores de alguns parâmetros do painel serão salvos em variáveis globais do terminal para que o painel se lembre de seus estados e os restaure na reinicialização: coordenadas X e Y, estado recolhido e o sinalizador de mobilidade do painel. Quando o painel for fixado no gráfico no estado recolhido, essa posição fixa será memorizada e, na próxima vez que o painel fixo for recolhido, ele ficará na posição memorizada.
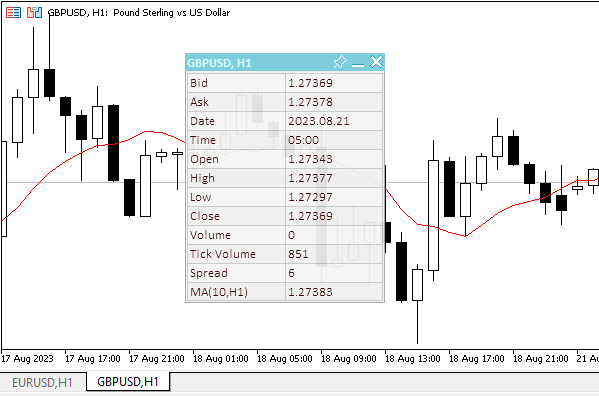
Figura 5 - Um painel "lembra" sua posição de âncora quando é fixado na forma recolhida
A figura acima mostra que, para lembrar o ponto de ancoragem de um painel recolhido, ele deve ser recolhido, movido para o ponto de ancoragem e fixado. Sempre que o painel é fixado quando expandido, sua posição é memorizada. Assim, ele pode ser expandido, solto e movido. Para retornar o painel ao local de ancoragem memorizado, ele deve ser preso e recolhido. Sem ancoragem, o painel será recolhido em seu local atual.
Corpo da classe:
//+------------------------------------------------------------------+
//| Dashboard class                                                  |
//+------------------------------------------------------------------+
class CDashboard : public CObject
  {
private:
   CCanvas           m_canvas;                  // Canvas
   CCanvas           m_workspace;               // Work space
   CTableData        m_table_data;              // Table cell array
   ENUM_PROGRAM_TYPE m_program_type;            // Program type
   ENUM_MOUSE_STATE  m_mouse_state;             // Mouse button status
   uint              m_id;                      // Object ID
   long              m_chart_id;                // ChartID
   int               m_chart_w;                 // Chart width
   int               m_chart_h;                 // Chart height
   int               m_x;                       // X coordinate
   int               m_y;                       // Y coordinate
   int               m_w;                       // Width
   int               m_h;                       // Height
   int               m_x_dock;                  // X coordinate of the pinned collapsed panel
   int               m_y_dock;                  // Y coordinate of the pinned collapsed panel

   bool              m_header;                  // Header presence flag
   bool              m_butt_close;              // Close button presence flag
   bool              m_butt_minimize;           // Collapse/expand button presence flag
   bool              m_butt_pin;                // Pin button presence flag
   bool              m_wider_wnd;               // Flag for exceeding the horizontal size of the window width panel
   bool              m_higher_wnd;              // Flag for exceeding the vertical size of the window height panel
   bool              m_movable;                 // Panel movability flag
   int               m_header_h;                // Header height
   int               m_wnd;                     // Chart subwindow index

   uchar             m_header_alpha;            // Header transparency
   uchar             m_header_alpha_c;          // Current header transparency
   color             m_header_back_color;       // Header background color
   color             m_header_back_color_c;     // Current header background color
   color             m_header_fore_color;       // Header text color
   color             m_header_fore_color_c;     // Current header text color
   color             m_header_border_color;     // Header border color
   color             m_header_border_color_c;   // Current header border color

   color             m_butt_close_back_color;   // Close button background color
   color             m_butt_close_back_color_c; // Current close button background color
   color             m_butt_close_fore_color;   // Close button icon color
   color             m_butt_close_fore_color_c; // Current close button color

   color             m_butt_min_back_color;     // Expand/collapse button background color
   color             m_butt_min_back_color_c;   // Current expand/collapse button background color
   color             m_butt_min_fore_color;     // Expand/collapse button icon color
   color             m_butt_min_fore_color_c;   // Current expand/collapse button icon color

   color             m_butt_pin_back_color;     // Pin button background color
   color             m_butt_pin_back_color_c;   // Current pin button background color
   color             m_butt_pin_fore_color;     // Pin button icon color
   color             m_butt_pin_fore_color_c;   // Current pin button icon color

   uchar             m_alpha;                   // Panel transparency
   uchar             m_alpha_c;                 // Current panel transparency
   uchar             m_fore_alpha;              // Text transparency
   uchar             m_fore_alpha_c;            // Current text transparency
   color             m_back_color;              // Background color

   color             m_back_color_c;            // Current background color

   color             m_fore_color;              // Text color
   color             m_fore_color_c;            // Current text color
   color             m_border_color;            // Border color
   color             m_border_color_c;          // Current border color

   string            m_title;                   // Title text
   string            m_title_font;              // Title font
   int               m_title_font_size;         // Title font size
   string            m_font;                    // Font
   int               m_font_size;               // Font size

   bool              m_minimized;               // Collapsed panel window flag
   string            m_program_name;            // Program name
   string            m_name_gv_x;               // Name of the global terminal variable storing the X coordinate
   string            m_name_gv_y;               // Name of the global terminal variable storing the Y coordinate
   string            m_name_gv_m;               // Name of the global terminal variable storing the collapsed panel flag

   string            m_name_gv_u;               // Name of the global terminal variable storing the flag of the pinned panel

   uint              m_array_wpx[];             // Array of pixels to save/restore the workspace
   uint              m_array_ppx[];             // Array of pixels to save/restore the panel background

//--- Return the flag that the panel exceeds (1) the height and (2) the width of the corresponding chart size
   bool              HigherWnd(void)      const { return(this.m_h+2>this.m_chart_h);   }
   bool              WiderWnd(void)       const { return(this.m_w+2>this.m_chart_w);   }
//--- Enable/disable modes of working with the chart
   void              SetChartsTool(const bool flag);

//--- Save (1) the working space and (2) the panel background to the pixel array
   void              SaveWorkspace(void);
   void              SaveBackground(void);
//--- Restore (1) the working space and (2) the panel background from the pixel array
   void              RestoreWorkspace(void);
   void              RestoreBackground(void);

//--- Save the pixel array (1) of the working space and the (2) panel background to the file
   bool              FileSaveWorkspace(void);
   bool              FileSaveBackground(void);
//--- Load the pixel array of the (1) working space and (2) the panel background from the file
   bool              FileLoadWorkspace(void);
   bool              FileLoadBackground(void);

//--- Return the subwindow index
   int               GetSubWindow(void) const
                       {
                        return(this.m_program_type==PROGRAM_EXPERT || this.m_program_type==PROGRAM_SCRIPT ? 0 : ::ChartWindowFind());
                       }

protected:
//--- (1) Hide, (2) show and (3) bring the panel to the foreground
   void              Hide(const bool redraw=false);
   void              Show(const bool redraw=false);
   void              BringToTop(void);
//--- Return the chart ID
   long              ChartID(void)        const { return this.m_chart_id;              }
//--- Draw the header area
   void              DrawHeaderArea(const string title);
//--- Redraw the header area using a new color and text values
   void              RedrawHeaderArea(const color new_color=clrNONE,const string title="",const color title_new_color=clrNONE,const ushort new_alpha=USHORT_MAX);
//--- Draw the panel frame
   void              DrawFrame(void);
//--- (1) Draw and (2) redraw the panel closing button
   void              DrawButtonClose(void);
   void              RedrawButtonClose(const color new_back_color=clrNONE,const color new_fore_color=clrNONE,const ushort new_alpha=USHORT_MAX);
//--- (1) Draw and (2) redraw the panel collapse/expand button
   void              DrawButtonMinimize(void);
   void              RedrawButtonMinimize(const color new_back_color=clrNONE,const color new_fore_color=clrNONE,const ushort new_alpha=USHORT_MAX);
//--- (1) Draw and (2) redraw the panel pin button
   void              DrawButtonPin(void);
   void              RedrawButtonPin(const color new_back_color=clrNONE,const color new_fore_color=clrNONE,const ushort new_alpha=USHORT_MAX);

//--- Return the flag for working in the visual tester
   bool              IsVisualMode(void) const
                       { return (bool)::MQLInfoInteger(MQL_VISUAL_MODE);               }
//--- Return the timeframe description
   string            TimeframeDescription(const ENUM_TIMEFRAMES timeframe) const
                       { return ::StringSubstr(EnumToString(timeframe),7);             }

//--- Return the state of mouse buttons
   ENUM_MOUSE_STATE  MouseButtonState(const int x,const int y,bool pressed);
//--- Shift the panel to new coordinates
   void              Move(int x,int y);

//--- Convert RGB to color
   color             RGBToColor(const double r,const double g,const double b) const;
//--- Write RGB component values to variables
   void              ColorToRGB(const color clr,double &r,double &g,double &b);
//--- Return (1) Red, (2) Green, (3) Blue color components
   double            GetR(const color clr)      { return clr&0xff ;                    }
   double            GetG(const color clr)      { return(clr>>8)&0xff;                 }
   double            GetB(const color clr)      { return(clr>>16)&0xff;                }
//--- Return a new color
   color             NewColor(color base_color, int shift_red, int shift_green, int shift_blue);

//--- Draw a panel
   void              Draw(const string title);
//--- (1) Collapse and (2) expand the panel
   void              Collapse(void);
   void              Expand(void);

//--- Set the (1) X and (2) Y panel coordinates
   bool              SetCoordX(const int coord_x);
   bool              SetCoordY(const int coord_y);
//--- Set the panel (1) width and (2) height
   bool              SetWidth(const int width,const bool redraw=false);
   bool              SetHeight(const int height,const bool redraw=false);

public:
//--- Display the panel
   void              View(const string title)   { this.Draw(title);                    }
//--- Return the (1) CCanvas object, (2) working space, (3) object ID
   CCanvas          *Canvas(void)               { return &this.m_canvas;               }
   CCanvas          *Workspace(void)            { return &this.m_workspace;            }
   uint              ID(void)                   { return this.m_id;                    }

//--- Return the panel (1) X and (2) Y coordinates
   int               CoordX(void)         const { return this.m_x;                     }
   int               CoordY(void)         const { return this.m_y;                     }
//--- Return the panel (1) width and (2) height
   int               Width(void)          const { return this.m_w;                     }
   int               Height(void)         const { return this.m_h;                     }

//--- Return the (1) width, (2) height and (3) size of the specified text
   int               TextWidth(const string text)
                       { return this.m_workspace.TextWidth(text);                      }
   int               TextHeight(const string text)
                       { return this.m_workspace.TextHeight(text);                     }
   void              TextSize(const string text,int &width,int &height)
                       { this.m_workspace.TextSize(text,width,height);                 }

//--- Set the close button (1) presence, (2) absence flag
   void              SetButtonCloseOn(void);
   void              SetButtonCloseOff(void);
//--- Set the collapse/expand button (1) presence, (2) absence flag
   void              SetButtonMinimizeOn(void);
   void              SetButtonMinimizeOff(void);

//--- Set the panel coordinates
   bool              SetCoords(const int x,const int y);
//--- Set the panel size
   bool              SetSizes(const int w,const int h,const bool update=false);
//--- Set panel coordinates and size
   bool              SetParams(const int x,const int y,const int w,const int h,const bool update=false);

//--- Set the transparency of the panel (1) header and (2) working space
   void              SetHeaderTransparency(const uchar value);
   void              SetTransparency(const uchar value);
//--- Set default panel font parameters
   void              SetFontParams(const string name,const int size,const uint flags=0,const uint angle=0);
//--- Display a text message at the specified coordinates
   void              DrawText(const string text,const int x,const int y,const int width=WRONG_VALUE,const int height=WRONG_VALUE);
//--- Draw a (1) background grid (2) with automatic cell size
   void              DrawGrid(const uint x,const uint y,const uint rows,const uint columns,const uint row_size,const uint col_size,const color line_color=clrNONE,bool alternating_color=true);
   void              DrawGridAutoFill(const uint border,const uint rows,const uint columns,const color line_color=clrNONE,bool alternating_color=true);
//--- Print grid data (line intersection coordinates)
   void              GridPrint(const uint indent=0)   { this.m_table_data.Print(indent);  }
//--- Write the X and Y coordinate values of the specified table cell to variables
   void              CellXY(const uint row,const uint column, int &x, int &y) { this.m_table_data.CellXY(row,column,x,y);  }
//--- Return the (1) X and (2) Y coordinate of the specified table cell
   int               CellX(const uint row,const uint column)         { return this.m_table_data.CellX(row,column);         }
   int               CellY(const uint row,const uint column)         { return this.m_table_data.CellY(row,column);         }

//--- Event handler
   void              OnChartEvent(const int id,const long &lparam,const double &dparam,const string &sparam);
//--- Constructor/destructor
                     CDashboard(const uint id,const int x,const int y, const int w,const int h,const int wnd=-1);
                    ~CDashboard();
  };
As variáveis e os métodos declarados da classe são comentados detalhadamente no código. Vamos dar uma olhada na implementação de alguns dos métodos.
Construtor da classe:
//+------------------------------------------------------------------+
//| Constructor                                                      |
//+------------------------------------------------------------------+
CDashboard::CDashboard(const uint id,const int x,const int y, const int w,const int h,const int wnd=-1) :
                        m_id(id),
                        m_chart_id(::ChartID()),
                        m_program_type((ENUM_PROGRAM_TYPE)::MQLInfoInteger(MQL_PROGRAM_TYPE)),
                        m_program_name(::MQLInfoString(MQL_PROGRAM_NAME)),
                        m_wnd(wnd==-1 ? GetSubWindow() : wnd),
                        m_chart_w((int)::ChartGetInteger(m_chart_id,CHART_WIDTH_IN_PIXELS,m_wnd)),
                        m_chart_h((int)::ChartGetInteger(m_chart_id,CHART_HEIGHT_IN_PIXELS,m_wnd)),
                        m_mouse_state(MOUSE_STATE_NOT_PRESSED),
                        m_x(x),
                        m_y(::ChartGetInteger(m_chart_id,CHART_SHOW_ONE_CLICK) ? (y<79 ? 79 : y) : y),
                        m_w(w),
                        m_h(h),
                        m_x_dock(m_x),
                        m_y_dock(m_y),
                        m_header(true),
                        m_butt_close(true),
                        m_butt_minimize(true),
                        m_butt_pin(true),
                        m_header_h(18),

                        //--- Panel header implementation
                        m_header_alpha(128),
                        m_header_alpha_c(m_header_alpha),
                        m_header_back_color(C'0,153,188'),
                        m_header_back_color_c(m_header_back_color),
                        m_header_fore_color(C'182,255,244'),
                        m_header_fore_color_c(m_header_fore_color),
                        m_header_border_color(C'167,167,168'),
                        m_header_border_color_c(m_header_border_color),
                        m_title("Dashboard"),
                        m_title_font("Calibri"),
                        m_title_font_size(-100),

                        //--- close button
                        m_butt_close_back_color(C'0,153,188'),
                        m_butt_close_back_color_c(m_butt_close_back_color),
                        m_butt_close_fore_color(clrWhite),
                        m_butt_close_fore_color_c(m_butt_close_fore_color),

                        //--- collapse/expand button
                        m_butt_min_back_color(C'0,153,188'),
                        m_butt_min_back_color_c(m_butt_min_back_color),
                        m_butt_min_fore_color(clrWhite),
                        m_butt_min_fore_color_c(m_butt_min_fore_color),

                        //--- pin button
                        m_butt_pin_back_color(C'0,153,188'),
                        m_butt_pin_back_color_c(m_butt_min_back_color),
                        m_butt_pin_fore_color(clrWhite),
                        m_butt_pin_fore_color_c(m_butt_min_fore_color),

                        //--- Panel implementation
                        m_alpha(240),
                        m_alpha_c(m_alpha),
                        m_fore_alpha(255),
                        m_fore_alpha_c(m_fore_alpha),
                        m_back_color(C'240,240,240'),
                        m_back_color_c(m_back_color),
                        m_fore_color(C'53,0,0'),
                        m_fore_color_c(m_fore_color),
                        m_border_color(C'167,167,168'),
                        m_border_color_c(m_border_color),
                        m_font("Calibri"),
                        m_font_size(-100),

                        m_minimized(false),
                        m_movable(true)
  {
//--- Set the permission for the chart to send messages about events of moving and pressing mouse buttons,
//--- mouse scroll events, as well as graphical object creation/deletion
   ::ChartSetInteger(this.m_chart_id,CHART_EVENT_MOUSE_MOVE,true);
   ::ChartSetInteger(this.m_chart_id,CHART_EVENT_MOUSE_WHEEL,true);
   ::ChartSetInteger(this.m_chart_id,CHART_EVENT_OBJECT_CREATE,true);
   ::ChartSetInteger(this.m_chart_id,CHART_EVENT_OBJECT_DELETE,true);

//--- Set the names of global terminal variables to store panel coordinates, collapsed/expanded state and pinning
   this.m_name_gv_x=this.m_program_name+"_id_"+(string)this.m_id+"_"+(string)this.m_chart_id+"_X";
   this.m_name_gv_y=this.m_program_name+"_id_"+(string)this.m_id+"_"+(string)this.m_chart_id+"_Y";
   this.m_name_gv_m=this.m_program_name+"_id_"+(string)this.m_id+"_"+(string)this.m_chart_id+"_Minimize";
   this.m_name_gv_u=this.m_program_name+"_id_"+(string)this.m_id+"_"+(string)this.m_chart_id+"_Unpin";

//--- If a global variable does not exist, create it and write the current value,
//--- otherwise - read the value from the terminal global variable into it
//--- X coordinate
   if(!::GlobalVariableCheck(this.m_name_gv_x))
      ::GlobalVariableSet(this.m_name_gv_x,this.m_x);
   else
      this.m_x=(int)::GlobalVariableGet(this.m_name_gv_x);
//--- Y coordinate
   if(!::GlobalVariableCheck(this.m_name_gv_y))
      ::GlobalVariableSet(this.m_name_gv_y,this.m_y);
   else
      this.m_y=(int)::GlobalVariableGet(this.m_name_gv_y);
//--- Collapsed/expanded
   if(!::GlobalVariableCheck(this.m_name_gv_m))
      ::GlobalVariableSet(this.m_name_gv_m,this.m_minimized);
   else
      this.m_minimized=(int)::GlobalVariableGet(this.m_name_gv_m);
//--- Collapsed/not collapsed
   if(!::GlobalVariableCheck(this.m_name_gv_u))
      ::GlobalVariableSet(this.m_name_gv_u,this.m_movable);
   else
      this.m_movable=(int)::GlobalVariableGet(this.m_name_gv_u);

//--- Set the flags for the size of the panel exceeding the size of the chart window
   this.m_higher_wnd=this.HigherWnd();
   this.m_wider_wnd=this.WiderWnd();

//--- If the panel graphical resource is created,
   if(this.m_canvas.CreateBitmapLabel(this.m_chart_id,this.m_wnd,"P"+(string)this.m_id,this.m_x,this.m_y,this.m_w,this.m_h,COLOR_FORMAT_ARGB_NORMALIZE))
     {
      //--- set the canvas font and fill the canvas with the transparent color
      this.m_canvas.FontSet(this.m_title_font,this.m_title_font_size,FW_BOLD);
      this.m_canvas.Erase(0x00FFFFFF);
     }
//--- otherwise - report unsuccessful object creation to the journal
   else
      ::PrintFormat("%s: Error. CreateBitmapLabel for canvas failed",(string)__FUNCTION__);

//--- If a working space of a graphical resource is created,
   if(this.m_workspace.CreateBitmapLabel(this.m_chart_id,this.m_wnd,"W"+(string)this.m_id,this.m_x+1,this.m_y+this.m_header_h,this.m_w-2,this.m_h-this.m_header_h-1,COLOR_FORMAT_ARGB_NORMALIZE))
     {
      //--- set the font for the working area and fill it with the transparent color
      this.m_workspace.FontSet(this.m_font,this.m_font_size);
      this.m_workspace.Erase(0x00FFFFFF);
     }
//--- otherwise - report unsuccessful object creation to the journal
   else
      ::PrintFormat("%s: Error. CreateBitmapLabel for workspace failed",(string)__FUNCTION__);
  }
A classe tem um construtor paramétrico e um que é criado por padrão. Obviamente, estamos interessados apenas no paramétrico, que será usado ao criar um objeto da classe. O identificador exclusivo do objeto, as coordenadas iniciais do painel, sua largura e altura, e o número da subjanela onde o painel será colocado são passados para o construtor por meio de parâmetros formais.
O identificador exclusivo do painel é necessário para que a classe crie objetos com nomes exclusivos. Caso sejam usados vários indicadores com painéis em um gráfico, esse número exclusivo adicionado ao nome do objeto do painel durante sua criação é necessário para evitar o conflito de nomes de objetos. Ao mesmo tempo, a exclusividade do identificador deve ser repetível, o que significa que, a cada nova execução, o número deve ser o mesmo da execução anterior. Em outras palavras, você não pode usar, por exemplo, GetTickCount() para o identificador.
É que se o número da subjanela for especificado por padrão (-1), ele será pesquisado programaticamente; caso contrário, será usado o número especificado no parâmetro.
Os parâmetros padrão são definidos na lista de inicialização do construtor. Para alguns parâmetros responsáveis pela aparência, são criadas duas variáveis: o valor padrão e o valor atual da propriedade. Isso é necessário para a alteração interativa, por exemplo, da cor ao passar o mouse sobre a área do painel pela qual esses parâmetros são responsáveis.
No corpo do construtor, os valores das variáveis globais do terminal são definidos e dois objetos gráficos são criados: a tela e a área de trabalho do painel.
Todo o código do construtor é comentado em detalhes.
Destrutor da classe:
//+------------------------------------------------------------------+
//| Destructor                                                       |
//+------------------------------------------------------------------+
CDashboard::~CDashboard()
  {
//--- Write the current values to global terminal variables
   ::GlobalVariableSet(this.m_name_gv_x,this.m_x);
   ::GlobalVariableSet(this.m_name_gv_y,this.m_y);
   ::GlobalVariableSet(this.m_name_gv_m,this.m_minimized);
   ::GlobalVariableSet(this.m_name_gv_u,this.m_movable);
//--- Delete panel objects
   this.m_canvas.Destroy();
   this.m_workspace.Destroy();
  }
Aqui, primeiro redefinimos os valores de coordenadas e sinalizadores para as variáveis globais do terminal e, em seguida, excluímos os objetos tela e área de trabalho.
Para interagir com o painel usando o cursor e os botões do mouse, precisamos saber o local do cursor em relação ao painel e seus controles. Ao mover o cursor, podemos rastrear suas coordenadas e os estados dos botões no manipulador de eventos da classe. O manipulador de eventos de classe tem os mesmos parâmetros que o manipulador de eventos padrão OnChartEvent:
void  OnChartEvent()
   const int       id,       // event ID
   const long&     lparam,   // long type event parameter
   const double&   dparam,   // double type event parameter
   const string&   sparam    // string type event parameter
   );
Parâmetros
id
[in] Identificador de evento da enumeração ENUM_CHART_EVENT.
lparam
[in] Parâmetro de evento do tipo long
dparam
[in] Parâmetro de evento do tipo double
sparam
[in] Parâmetro de evento do tipo string
Valor retornado
Sem valor de retorno
Observação
Há 11 tipos de eventos que podem ser tratados com a função predefinida OnChartEvent(). Há 65535 identificadores para eventos personalizados no intervalo de CHARTEVENT_CUSTOM a CHARTEVENT_CUSTOM_LAST, inclusive. Para gerar um evento personalizado, você deve usar a função EventChartChartCustom().
Breve descrição dos eventos na enumeração ENUM_CHART_EVENT:
- CHARTEVENT_KEYDOWN — pressionamento de teclado quando a janela do gráfico está em foco;
- CHARTEVENT_MOUSE_MOVE — movimentação do mouse e cliques nos botões do mouse (se a propriedade CHART_EVENT_MOUSE_MOVE=true estiver configurada para o gráfico);
- CHARTEVENT_OBJECT_CREATE — criação de objeto gráfico (se a propriedade CHART_EVENT_OBJECT_CREATE=true estiver configurada para o gráfico);
- CHARTEVENT_OBJECT_CHANGE — alteração das propriedades de um objeto através do diálogo de propriedades;
- CHARTEVENT_OBJECT_DELETE — exclusão de objeto gráfico (se a propriedade CHART_EVENT_OBJECT_DELETE=true estiver configurada para o gráfico);
- CHARTEVENT_CLICK — clique do mouse no gráfico;
- CHARTEVENT_OBJECT_CLICK — clique do mouse em um objeto gráfico pertencente ao gráfico;
- CHARTEVENT_OBJECT_DRAG — arrastamento de um objeto gráfico com o mouse;
- CHARTEVENT_OBJECT_ENDEDIT — término da edição de texto em um campo de entrada de objeto gráfico Edit (OBJ_EDIT);
- CHARTEVENT_CHART_CHANGE — alterações no gráfico;
- CHARTEVENT_CUSTOM+n — identificador de evento personalizado, onde n está no intervalo de 0 a 65535. CHARTEVENT_CUSTOM_LAST contém o último identificador de evento de usuário válido (CHARTEVENT_CUSTOM+65535).
O parâmetro lparam contém a coordenada X, dparam mantém a coordenada Y e sparam tem uma combinação de valores de sinalizador para determinar o estado dos botões do mouse. Todos esses parâmetros devem ser recebidos e processados em relação às coordenadas do painel e de seus elementos, determinar o estado e enviá-lo ao manipulador de eventos da classe, onde a reação a todos esses estados será escrita.
Método que retorna o estado do cursor e do botão do mouse em relação ao painel:
//+------------------------------------------------------------------+
//| Returns the state of the mouse cursor and button                 |
//+------------------------------------------------------------------+
ENUM_MOUSE_STATE CDashboard::MouseButtonState(const int x,const int y,bool pressed)
  {
//--- If the button is pressed
   if(pressed)
     {
      //--- If the state has already been saved, exit
      if(this.m_mouse_state!=MOUSE_STATE_NOT_PRESSED)
         return this.m_mouse_state;
      //--- If the button is pressed inside the window
      if(x>this.m_x && x<this.m_x+this.m_w && y>this.m_y && y<this.m_y+this.m_h)
        {
         //--- If the button is pressed inside the header
         if(y>this.m_y && y<=this.m_y+this.m_header_h)
           {
            //--- Bring the panel to the foreground
            this.BringToTop();
            //--- Coordinates of the close, collapse/expand and pin buttons
            int wc=(this.m_butt_close ? this.m_header_h : 0);
            int wm=(this.m_butt_minimize ? this.m_header_h : 0);
            int wp=(this.m_butt_pin ? this.m_header_h : 0);
            //--- If the close button is pressed, return this state
            if(x>this.m_x+this.m_w-wc)
               return MOUSE_STATE_PRESSED_INSIDE_CLOSE;
            //--- If the collapse/expand button is pressed, return this state
            if(x>this.m_x+this.m_w-wc-wm)
               return MOUSE_STATE_PRESSED_INSIDE_MINIMIZE;
            //--- If the pin button is pressed, return this state
            if(x>this.m_x+this.m_w-wc-wm-wp)
               return MOUSE_STATE_PRESSED_INSIDE_PIN;
            //--- If the button is not pressed on the control buttons of the panel, record and return the state of the button press inside the header
            this.m_mouse_state=MOUSE_STATE_PRESSED_INSIDE_HEADER;
            return this.m_mouse_state;
           }
         //--- If a button inside the window is pressed, write the state to a variable and return it
         else if(y>this.m_y+this.m_header_h && y<this.m_y+this.m_h)
           {
            this.m_mouse_state=MOUSE_STATE_PRESSED_INSIDE_WINDOW;
            return this.m_mouse_state;
           }
        }
      //--- The button is pressed outside the window - write the state to a variable and return it
      else
        {
         this.m_mouse_state=MOUSE_STATE_PRESSED_OUTSIDE_WINDOW;
         return this.m_mouse_state;
        }
     }
//--- If the button is not pressed
   else
     {
      //--- Write the state of the unpressed button to the variable
      this.m_mouse_state=MOUSE_STATE_NOT_PRESSED;
      //--- If the cursor is inside the panel
      if(x>this.m_x && x<this.m_x+this.m_w && y>this.m_y && y<this.m_y+this.m_h)
        {
         //--- If the cursor is inside the header
         if(y>this.m_y && y<=this.m_y+this.m_header_h)
           {
            //--- Specify the width of the close, collapse/expand and pin buttons
            int wc=(this.m_butt_close ? this.m_header_h : 0);
            int wm=(this.m_butt_minimize ? this.m_header_h : 0);
            int wp=(this.m_butt_pin ? this.m_header_h : 0);
            //--- If the cursor is inside the close button, return this state
            if(x>this.m_x+this.m_w-wc)
               return MOUSE_STATE_INSIDE_CLOSE;
            //--- If the cursor is inside the minimize/expand button, return this state
            if(x>this.m_x+this.m_w-wc-wm)
               return MOUSE_STATE_INSIDE_MINIMIZE;
            //--- If the cursor is inside the pin button, return this state
            if(x>this.m_x+this.m_w-wc-wm-wp)
               return MOUSE_STATE_INSIDE_PIN;
            //--- If the cursor is outside the buttons inside the header area, return this state
            return MOUSE_STATE_INSIDE_HEADER;
           }
         //--- Otherwise, the cursor is inside the working space. Return this state
         else
            return MOUSE_STATE_INSIDE_WINDOW;
        }
     }
//--- In any other case, return the state of the unpressed mouse button
   return MOUSE_STATE_NOT_PRESSED;
  }
A lógica do método está detalhada nos comentários do código. Simplesmente determinamos as coordenadas mútuas do cursor e do painel e seus elementos, e retornamos o estado. Com isso, o sinalizador do botão do mouse pressionado ou liberado é enviado para o método de uma só vez. Para cada um desses estados, há um bloco de código que define os estados quando o botão é pressionado ou liberado. É muito fácil e rápido usar a lógica dessa forma. Mas ela tem suas desvantagens: não é possível detectar um clique do mouse em um controle, mas apenas um clique nele. Normalmente, o clique é capturado quando o botão do mouse é liberado, enquanto o facto de clicar e manter pressionado é capturado quando o botão do mouse é pressionado. Com a lógica usada aqui, apenas o pressionamento do botão do mouse é considerado clicar e pressionar e manter pressionado.
Os estados recebidos nesse método devem ser enviados para o manipulador de eventos, em que cada evento tem seu próprio manipulador que altera o comportamento e a aparência do painel:
//+------------------------------------------------------------------+
//| Event handler                                                    |
//+------------------------------------------------------------------+
void CDashboard::OnChartEvent(const int id,const long &lparam,const double &dparam,const string &sparam)
  {
//--- If a graphical object is created
   if(id==CHARTEVENT_OBJECT_CREATE)
     {
      this.BringToTop();
      ::ObjectSetInteger(this.m_chart_id,sparam,OBJPROP_SELECTED,true);
     }
//--- If the chart is changed
   if(id==CHARTEVENT_CHART_CHANGE)
     {
      //--- Get the chart subwindow index (it may change when removing the window of any indicator)
      this.m_wnd=this.GetSubWindow();
      //--- Get the new chart size
      int w=(int)::ChartGetInteger(this.m_chart_id,CHART_WIDTH_IN_PIXELS,this.m_wnd);
      int h=(int)::ChartGetInteger(this.m_chart_id,CHART_HEIGHT_IN_PIXELS,this.m_wnd);
      //--- Determine whether the panel dimensions extend beyond the chart window
      this.m_higher_wnd=this.HigherWnd();
      this.m_wider_wnd=this.WiderWnd();
      //--- If the chart height has changed, adjust the panel vertical position
      if(this.m_chart_h!=h)
        {
         this.m_chart_h=h;
         int y=this.m_y;
         if(this.m_y+this.m_h>h-1)
            y=h-this.m_h-1;
         if(y<1)
            y=1;
         this.Move(this.m_x,y);
        }
      //--- If the chart weight has changed, adjust the panel horizontal position
      if(this.m_chart_w!=w)
        {
         this.m_chart_w=w;
         int x=this.m_x;
         if(this.m_x+this.m_w>w-1)
            x=w-this.m_w-1;
         if(x<1)
            x=1;
         this.Move(x,this.m_y);
        }
     }

//--- Declare variables to store the current cursor shift relative to the initial coordinates of the panel
   static int diff_x=0;
   static int diff_y=0;

//--- Get the flag of the held mouse button. We also take into account the right button for the visual tester (sparam=="2")
   bool pressed=(!this.IsVisualMode() ? (sparam=="1" || sparam=="" ? true : false) : sparam=="1" || sparam=="2" ? true : false);
//--- Get the cursor X and Y coordinates. Take into account the shift for the Y coordinate when working in the chart subwindow
   int  mouse_x=(int)lparam;
   int  mouse_y=(int)dparam-(int)::ChartGetInteger(this.m_chart_id,CHART_WINDOW_YDISTANCE,this.m_wnd);
//--- Get the state of the cursor and mouse buttons relative to the panel
   ENUM_MOUSE_STATE state=this.MouseButtonState(mouse_x,mouse_y,pressed);
//--- If the cursor moves
   if(id==CHARTEVENT_MOUSE_MOVE)
     {
      //--- If a button is pressed inside the working area of the panel
      if(state==MOUSE_STATE_PRESSED_INSIDE_WINDOW)
        {
         //--- Disable chart scrolling, right-click menu and crosshair
         this.SetChartsTool(false);
         //--- Redraw the header area with the default background color
         if(this.m_header_back_color_c!=this.m_header_back_color)
           {
            this.RedrawHeaderArea(this.m_header_back_color);
            this.m_canvas.Update();
           }
         return;
        }
      //--- If a button is pressed inside the panel header area
      else if(state==MOUSE_STATE_PRESSED_INSIDE_HEADER)
        {
         //--- Disable chart scrolling, right-click menu and crosshair
         this.SetChartsTool(false);
         //--- Redraw the header area with a new background color
         color new_color=this.NewColor(this.m_header_back_color,-10,-10,-10);
         if(this.m_header_back_color_c!=new_color)
           {
            this.RedrawHeaderArea(new_color);
            this.m_canvas.Update();
           }
         //--- Shift the panel following the cursor taking into account the amount of cursor displacement relative to the initial coordinates of the panel
         if(this.m_movable)
            this.Move(mouse_x-diff_x,mouse_y-diff_y);
         return;
        }

      //--- If the close button is pressed
      else if(state==MOUSE_STATE_PRESSED_INSIDE_CLOSE)
        {
         //--- Disable chart scrolling, right-click menu and crosshair
         this.SetChartsTool(false);
         //--- Redraw the close button with a new background color
         color new_color=this.NewColor(clrRed,0,40,40);
         if(this.m_butt_close_back_color_c!=new_color)
           {
            this.RedrawButtonClose(new_color);
            this.m_canvas.Update();
           }
         //--- Close button press handling should be defined in the program.
         //--- Send the click event of this button to its OnChartEvent handler.
         //--- Event ID 1001,
         //--- lparam=panel ID (m_id),
         //--- dparam=0
         //--- sparam="Close button pressed"
         ushort event=CHARTEVENT_CUSTOM+1;
         ::EventChartCustom(this.m_chart_id,ushort(event-CHARTEVENT_CUSTOM),this.m_id,0,"Close button pressed");
        }
      //--- If the panel collapse/expand button is pressed
      else if(state==MOUSE_STATE_PRESSED_INSIDE_MINIMIZE)
        {
         //--- Disable chart scrolling, right-click menu and crosshair
         this.SetChartsTool(false);
         //--- "flip" the panel collapse flag,
         this.m_minimized=!this.m_minimized;
         //--- redraw the panel taking into account the new state of the flag,
         this.Draw(this.m_title);
         //--- redraw the panel header area
         this.RedrawHeaderArea();
         //--- If the panel is pinned and expanded, move it to the stored location coordinates
         if(this.m_minimized && !this.m_movable)
            this.Move(this.m_x_dock,this.m_y_dock);
         //--- Update the canvas with chart redrawing and
         this.m_canvas.Update();
         //--- write the state of the panel expand flag to the global terminal variable
         ::GlobalVariableSet(this.m_name_gv_m,this.m_minimized);
        }
      //--- If the panel pin button is pressed
      else if(state==MOUSE_STATE_PRESSED_INSIDE_PIN)
        {
         //--- Disable chart scrolling, right-click menu and crosshair
         this.SetChartsTool(false);
         //--- "flip" the panel collapse flag,
         this.m_movable=!this.m_movable;
         //--- Redraw the pin button with a new background color
         color new_color=this.NewColor(this.m_butt_pin_back_color,30,30,30);
         if(this.m_butt_pin_back_color_c!=new_color)
            this.RedrawButtonPin(new_color);
         //--- If the panel is collapsed and pinned, save its coordinates
         //--- When expanded and collapsed again, the panel returns to these coordinates
         //--- Relevant for pinning a collapsed panel at the bottom of the screen
         if(this.m_minimized && !this.m_movable)
           {
            this.m_x_dock=this.m_x;
            this.m_y_dock=this.m_y;
           }
         //--- Update the canvas with chart redrawing and
         this.m_canvas.Update();
         //--- write the state of the panel movability flag to the global terminal variable
         ::GlobalVariableSet(this.m_name_gv_u,this.m_movable);
        }

      //--- If the cursor is inside the panel header area
      else if(state==MOUSE_STATE_INSIDE_HEADER)
        {
         //--- Disable chart scrolling, right-click menu and crosshair
         this.SetChartsTool(false);
         //--- Redraw the header area with a new background color
         color new_color=this.NewColor(this.m_header_back_color,20,20,20);
         if(this.m_header_back_color_c!=new_color)
           {
            this.RedrawHeaderArea(new_color);
            this.m_canvas.Update();
           }
        }

      //--- If the cursor is inside the close button
      else if(state==MOUSE_STATE_INSIDE_CLOSE)
        {
         //--- Disable chart scrolling, right-click menu and crosshair
         this.SetChartsTool(false);
         //--- Redraw the header area with a minimal change in the background color
         color new_color=this.NewColor(this.m_header_back_color,0,0,1);
         if(this.m_header_back_color_c!=new_color)
            this.RedrawHeaderArea(new_color);
         //--- Redraw the collapse/expand button with the default background color
         if(this.m_butt_min_back_color_c!=this.m_butt_min_back_color)
            this.RedrawButtonMinimize(this.m_butt_min_back_color);
         //--- Redraw the pin button with the default background color
         if(this.m_butt_pin_back_color_c!=this.m_butt_pin_back_color)
            this.RedrawButtonPin(this.m_butt_pin_back_color);
         //--- Redraw the close button with the red background color
         if(this.m_butt_close_back_color_c!=clrRed)
           {
            this.RedrawButtonClose(clrRed);
            this.m_canvas.Update();
           }
        }

      //--- If the cursor is inside the collapse/expand button
      else if(state==MOUSE_STATE_INSIDE_MINIMIZE)
        {
         //--- Disable chart scrolling, right-click menu and crosshair
         this.SetChartsTool(false);
         //--- Redraw the header area with a minimal change in the background color
         color new_color=this.NewColor(this.m_header_back_color,0,0,1);
         if(this.m_header_back_color_c!=new_color)
            this.RedrawHeaderArea(new_color);
         //--- Redraw the close button with the default background color
         if(this.m_butt_close_back_color_c!=this.m_butt_close_back_color)
            this.RedrawButtonClose(this.m_butt_close_back_color);
         //--- Redraw the pin button with the default background color
         if(this.m_butt_pin_back_color_c!=this.m_butt_pin_back_color)
            this.RedrawButtonPin(this.m_butt_pin_back_color);
         //--- Redraw the collapse/expand button with a new background color
         new_color=this.NewColor(this.m_butt_min_back_color,20,20,20);
         if(this.m_butt_min_back_color_c!=new_color)
           {
            this.RedrawButtonMinimize(new_color);
            this.m_canvas.Update();
           }
        }

      //--- If the cursor is inside the pin button
      else if(state==MOUSE_STATE_INSIDE_PIN)
        {
         //--- Disable chart scrolling, right-click menu and crosshair
         this.SetChartsTool(false);
         //--- Redraw the header area with a minimal change in the background color
         color new_color=this.NewColor(this.m_header_back_color,0,0,1);
         if(this.m_header_back_color_c!=new_color)
            this.RedrawHeaderArea(new_color);
         //--- Redraw the close button with the default background color
         if(this.m_butt_close_back_color_c!=this.m_butt_close_back_color)
            this.RedrawButtonClose(this.m_butt_close_back_color);
         //--- Redraw the collapse/expand button with the default background color
         if(this.m_butt_min_back_color_c!=this.m_butt_min_back_color)
            this.RedrawButtonMinimize(this.m_butt_min_back_color);
         //--- Redraw the pin button with a new background color
         new_color=this.NewColor(this.m_butt_pin_back_color,20,20,20);
         if(this.m_butt_pin_back_color_c!=new_color)
           {
            this.RedrawButtonPin(new_color);
            this.m_canvas.Update();
           }
        }

      //--- If the cursor is inside the working space
      else if(state==MOUSE_STATE_INSIDE_WINDOW)
        {
         //--- Disable chart scrolling, right-click menu and crosshair
         this.SetChartsTool(false);
         //--- Redraw the header area with the default background color
         if(this.m_header_back_color_c!=this.m_header_back_color)
           {
            this.RedrawHeaderArea(this.m_header_back_color);
            this.m_canvas.Update();
           }
        }
      //--- Otherwise (the cursor is outside the panel, and we need to restore the chart parameters)
      else
        {
         //--- Enable chart scrolling, right-click menu and crosshair
         this.SetChartsTool(true);
         //--- Redraw the header area with the default background color
         if(this.m_header_back_color_c!=this.m_header_back_color)
           {
            this.RedrawHeaderArea(this.m_header_back_color);
            this.m_canvas.Update();
           }
        }
      //--- Write the cursor shift by X and Y relative to the panel initial coordinates
      diff_x=mouse_x-this.m_x;
      diff_y=mouse_y-this.m_y;
     }
  }
A lógica do manipulador de eventos é comentada detalhadamente no código. Gostaria de destacar alguns pontos.
Logo no início, é descrito o processamento do evento de criação de um novo objeto gráfico:
//--- If a graphical object is created
   if(id==CHARTEVENT_OBJECT_CREATE)
     {
      this.BringToTop();
      ::ObjectSetInteger(this.m_chart_id,sparam,OBJPROP_SELECTED,true);
     }
Para que é e o que faz? Se você criar um novo objeto gráfico, ele será colocado acima dos outros objetos gráficos no gráfico e, portanto, será sobreposto na parte superior do painel. Assim, quando esse evento é definido, o painel é movido imediatamente para o primeiro plano. E o novo objeto gráfico é destacado. Por quê? Se isso não for feito, os objetos gráficos que precisam de vários pontos para serem desenhados, por exemplo, uma linha de tendência, não serão criados normalmente, isto é, todos os seus pontos de referência estarão em uma coordenada e o objeto em si não será visível. Isso acontece pela perda de controle sobre o objeto gráfico durante sua criação, quando o painel é movido para o primeiro plano. Por isso é que o novo objeto gráfico deve ser selecionado à força depois que o painel for movido para o primeiro plano.
Com isso, o comportamento mútuo do painel e dos objetos gráficos ao criá-los será o seguinte:
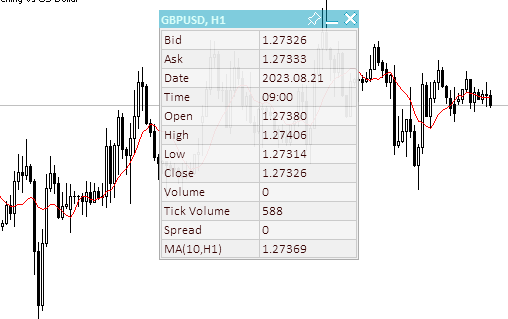
Figura 6 - O novo objeto gráfico é construído "sob" o painel e não perde o foco quando criado.
O manipulador de eventos tem seu próprio bloco de processamento para cada estado. A lógica de todos esses blocos é idêntica. Por exemplo, veja o processamento resultante de pressionar e manter pressionado o botão do mouse no título do painel:
      //--- If a button is pressed inside the panel header area
      else if(state==MOUSE_STATE_PRESSED_INSIDE_HEADER)
        {
         //--- Disable chart scrolling, right-click menu and crosshair
         this.SetChartsTool(false);
         //--- Redraw the header area with a new background color
         color new_color=this.NewColor(this.m_header_back_color,-10,-10,-10);
         if(this.m_header_back_color_c!=new_color)
           {
            this.RedrawHeaderArea(new_color);
            this.m_canvas.Update();
           }
         //--- Shift the panel following the cursor taking into account the amount of cursor displacement relative to the initial coordinates of the panel
         if(this.m_movable)
            this.Move(mouse_x-diff_x,mouse_y-diff_y);
         return;
        }
Para evitar que o gráfico se mova com o painel, os eventos de rolagem do gráfico com o mouse, o menu do botão direito do mouse e a mira são desativados para o gráfico. Como o título precisa reagir visualmente à captura do mouse, sua cor fica mais escura. Antes de alterar a cor para uma nova, é necessário verificar se ela já foi alterada, pois por que alterá-la para a mesma cor o tempo todo, consumindo recursos do processador? E se o movimento não for proibido (o painel não é fixo), nós o moveremos para as novas coordenadas calculadas com base nas coordenadas do mouse, menos o deslocamento do local do cursor em relação ao canto superior esquerdo do painel. Se o deslocamento for ignorado, o painel ficará exatamente nas coordenadas do cursor com o canto superior esquerdo.
Método para mover o painel para as coordenadas especificadas:
//+------------------------------------------------------------------+
//| Move the panel                                                   |
//+------------------------------------------------------------------+
void CDashboard::Move(int x,int y)
  {
   int h=this.m_canvas.Height();
   int w=this.m_canvas.Width();
   if(!this.m_wider_wnd)
     {
      if(x+w>this.m_chart_w-1)
         x=this.m_chart_w-w-1;
      if(x<1)
         x=1;
     }
   else
     {
      if(x>1)
         x=1;
      if(x<this.m_chart_w-w-1)
         x=this.m_chart_w-w-1;
     }
   if(!this.m_higher_wnd)
     {
      if(y+h>this.m_chart_h-2)
         y=this.m_chart_h-h-2;
      if(y<1)
         y=1;
     }
   else
     {
      if(y>1)
         y=1;
      if(y<this.m_chart_h-h-2)
         y=this.m_chart_h-h-2;
     }
   if(this.SetCoords(x,y))
      this.m_canvas.Update();
  }
O método recebe as coordenadas para as que se deseja mover o painel. Se o painel se mover para fora do gráfico quando as coordenadas forem alteradas, as coordenadas serão ajustadas de modo que o painel esteja sempre dentro da janela do gráfico com uma margem de 1 pixel em relação a qualquer borda. Assim que todas as verificações e correções das coordenadas do painel forem concluídas, as novas coordenadas de sua localização no gráfico serão definidas.
Métodos que definem as coordenadas do painel:
//+------------------------------------------------------------------+
//| Set the panel X coordinate                                       |
//+------------------------------------------------------------------+
bool CDashboard::SetCoordX(const int coord_x)
  {
   int x=(int)::ObjectGetInteger(this.m_chart_id,this.m_canvas.ChartObjectName(),OBJPROP_XDISTANCE);
   if(x==coord_x)
      return true;
   if(!::ObjectSetInteger(this.m_chart_id,this.m_canvas.ChartObjectName(),OBJPROP_XDISTANCE,coord_x))
      return false;
   if(!::ObjectSetInteger(this.m_chart_id,this.m_workspace.ChartObjectName(),OBJPROP_XDISTANCE,coord_x+1))
      return false;
   this.m_x=coord_x;
   return true;
  }
//+------------------------------------------------------------------+
//| Set the panel Y coordinate                                       |
//+------------------------------------------------------------------+
bool CDashboard::SetCoordY(const int coord_y)
  {
   int y=(int)::ObjectGetInteger(this.m_chart_id,this.m_canvas.ChartObjectName(),OBJPROP_YDISTANCE);
   if(y==coord_y)
      return true;
   if(!::ObjectSetInteger(this.m_chart_id,this.m_canvas.ChartObjectName(),OBJPROP_YDISTANCE,coord_y))
      return false;
   if(!::ObjectSetInteger(this.m_chart_id,this.m_workspace.ChartObjectName(),OBJPROP_YDISTANCE,coord_y+this.m_header_h))
      return false;
   this.m_y=coord_y;
   return true;
  }
Se uma coordenada igual à coordenada do painel for passada para o método, não há necessidade de defini-la novamente, uma vez que basta retornar se o método foi bem-sucedido. Primeiro, a tela é deslocada e, em seguida, a área de trabalho é deslocada. A área de trabalho é deslocada levando-se em conta sua posição relativa na tela: à esquerda, um pixel dentro do painel e, na parte superior, um pixel na altura do título.
Métodos que definem as dimensões do painel:
//+------------------------------------------------------------------+
//| Set the panel width                                              |
//+------------------------------------------------------------------+
bool CDashboard::SetWidth(const int width,const bool redraw=false)
  {
   if(width<4)
     {
      ::PrintFormat("%s: Error. Width cannot be less than 4px",(string)__FUNCTION__);
      return false;
     }
   if(width==this.m_canvas.Width())
      return true;
   if(!this.m_canvas.Resize(width,this.m_canvas.Height()))
      return false;
   if(width-2<1)
      ::ObjectSetInteger(this.m_chart_id,this.m_workspace.ChartObjectName(),OBJPROP_TIMEFRAMES,OBJ_NO_PERIODS);
   else
     {
      ::ObjectSetInteger(this.m_chart_id,this.m_workspace.ChartObjectName(),OBJPROP_TIMEFRAMES,OBJ_ALL_PERIODS);
      if(!this.m_workspace.Resize(width-2,this.m_workspace.Height()))
         return false;
     }
   this.m_w=width;
   return true;
  }
//+------------------------------------------------------------------+
//| Set the panel height                                             |
//+------------------------------------------------------------------+
bool CDashboard::SetHeight(const int height,const bool redraw=false)
  {
   if(height<::fmax(this.m_header_h,1))
     {
      ::PrintFormat("%s: Error. Width cannot be less than %lupx",(string)__FUNCTION__,::fmax(this.m_header_h,1));
      return false;
     }
   if(height==this.m_canvas.Height())
      return true;
   if(!this.m_canvas.Resize(this.m_canvas.Width(),height))
      return false;
   if(height-this.m_header_h-2<1)
      ::ObjectSetInteger(this.m_chart_id,this.m_workspace.ChartObjectName(),OBJPROP_TIMEFRAMES,OBJ_NO_PERIODS);
   else
     {
      ::ObjectSetInteger(this.m_chart_id,this.m_workspace.ChartObjectName(),OBJPROP_TIMEFRAMES,OBJ_ALL_PERIODS);
      if(!this.m_workspace.Resize(this.m_workspace.Width(),height-this.m_header_h-2))
         return false;
     }
   this.m_h=height;
   return true;
  }
Aqui é exatamente o mesmo que definir coordenadas, quer dizer, se o tamanho passado para o método for o mesmo tamanho que o painel já tem, os métodos simplesmente retornam true. Um detalhe que vale a pena mencionar é que a área de trabalho é sempre menor que a tela. Se, ao redimensionar a área de trabalho, o tamanho for menor que 1, para evitar erros de redimensionamento, a área de trabalho será simplesmente ocultada sem ser redimensionada.
Métodos auxiliares que definem duas coordenadas de uma vez, todas as dimensões de uma vez e as coordenadas e dimensões do painel:
//+------------------------------------------------------------------+
//| Set the panel coordinates                                        |
//+------------------------------------------------------------------+
bool CDashboard::SetCoords(const int x,const int y)
  {
   bool res=true;
   res &=this.SetCoordX(x);
   res &=this.SetCoordY(y);
   return res;
  }
//+------------------------------------------------------------------+
//| Set the panel size                                               |
//+------------------------------------------------------------------+
bool CDashboard::SetSizes(const int w,const int h,const bool update=false)
  {
   bool res=true;
   res &=this.SetWidth(w);
   res &=this.SetHeight(h);
   if(res && update)
      this.Expand();
   return res;
  }
//+------------------------------------------------------------------+
//| Set panel coordinates and size                                   |
//+------------------------------------------------------------------+
bool CDashboard::SetParams(const int x,const int y,const int w,const int h,const bool update=false)
  {
   bool res=true;
   res &=this.SetCoords(x,y);
   res &=this.SetSizes(w,h);
   if(res && update)
      this.Expand();
   return res;
  }
Esses métodos recebem os parâmetros e um sinalizador de atualização. Depois que os parâmetros são definidos com sucesso e, se o sinalizador de atualização estiver definido, o método de expansão do painel é chamado, o que redesenha todos os elementos do painel.
Método que desenha a área do título:
//+------------------------------------------------------------------+
//| Draw the header area                                             |
//+------------------------------------------------------------------+
void CDashboard::DrawHeaderArea(const string title)
  {
//--- Exit if the header is not used
   if(!this.m_header)
      return;
//--- Set the title text
   this.m_title=title;
//--- The Y coordinate of the text is located vertically in the center of the header area
   int y=this.m_header_h/2;
//--- Fill the area with color
   this.m_canvas.FillRectangle(0,0,this.m_w-1,this.m_header_h-1,::ColorToARGB(this.m_header_back_color,this.m_header_alpha));
//--- Display the header text
   this.m_canvas.TextOut(2,y,this.m_title,::ColorToARGB(this.m_header_fore_color,this.m_header_alpha),TA_LEFT|TA_VCENTER);
//--- Save the current header background color
   this.m_header_back_color_c=this.m_header_back_color;
//--- Draw control elements (close, collapse/expand and pin buttons) and
   this.DrawButtonClose();
   this.DrawButtonMinimize();
   this.DrawButtonPin();
//--- update the canvas without redrawing the screen
   this.m_canvas.Update(false);
  }
O método que desenha a área do título aplica uma área retangular nas coordenadas do título e desenha os controles, especificamente os botões Fechar, Recolher/Expandir e Fixar. São usadas as cores padrão e a transparência definidas para a área do título.
Método que redesenha a área do título:
//+------------------------------------------------------------------+
//| Redraw header area                                               |
//+------------------------------------------------------------------+
void CDashboard::RedrawHeaderArea(const color new_color=clrNONE,const string title="",const color title_new_color=clrNONE,const ushort new_alpha=USHORT_MAX)
  {
//--- Exit if the header is not used or all passed parameters have default values
   if(!this.m_header || (new_color==clrNONE && title=="" && title_new_color==clrNONE && new_alpha==USHORT_MAX))
      return;
//--- Exit if all passed parameters are equal to those already set
   if(new_color==this.m_header_back_color && title==this.m_title && title_new_color==this.m_header_fore_color && new_alpha==this.m_header_alpha)
      return;
//--- If the title is not equal to the default value, set a new title
   if(title!="")
      this.m_title=title;
//--- Define new background and text colors, and transparency
   color back_clr=(new_color!=clrNONE ? new_color : this.m_header_back_color);
   color fore_clr=(title_new_color!=clrNONE ? title_new_color : this.m_header_fore_color);
   uchar alpha=uchar(new_alpha==USHORT_MAX ? this.m_header_alpha : new_alpha>255 ? 255 : new_alpha);
//--- The Y coordinate of the text is located vertically in the center of the header area
   int y=this.m_header_h/2;
//--- Fill the area with color
   this.m_canvas.FillRectangle(0,0,this.m_w-1,this.m_header_h-1,::ColorToARGB(back_clr,alpha));
//--- Display the header text
   this.m_canvas.TextOut(2,y,this.m_title,::ColorToARGB(fore_clr,alpha),TA_LEFT|TA_VCENTER);
//--- Save the current header background color, text and transparency
   this.m_header_back_color_c=back_clr;
   this.m_header_fore_color_c=fore_clr;
   this.m_header_alpha_c=alpha;
//--- Draw control elements (close, collapse/expand and pin buttons) and
   this.RedrawButtonClose(back_clr,clrNONE,alpha);
   this.RedrawButtonMinimize(back_clr,clrNONE,alpha);
   this.RedrawButtonPin(back_clr,clrNONE,alpha);
//--- update the canvas without redrawing the screen
   this.m_canvas.Update(true);
  }
O método recebe uma nova cor de fundo, um novo texto de título, uma nova cor de texto de título e uma nova transparência. Caso os parâmetros passados sejam idênticos aos já definidos, o método será encerrado. Com isso, a cor do título, seu texto e transparência são atualizados.
Método que desenha o quadro do painel:
//+------------------------------------------------------------------+
//| Draw the panel frame                                             |
//+------------------------------------------------------------------+
void CDashboard::DrawFrame(void)
  {
   this.m_canvas.Rectangle(0,0,this.m_w-1,this.m_h-1,::ColorToARGB(this.m_border_color,this.m_alpha));
   this.m_border_color_c=this.m_border_color;
   this.m_canvas.Update(false);
  }
Desenha um quadro ao redor do perímetro da tela e lembra a cor definida como a cor atual.
Método que desenha o botão de fechamento do painel:
//+------------------------------------------------------------------+
//| Draws the panel close button                                     |
//+------------------------------------------------------------------+
void CDashboard::DrawButtonClose(void)
  {
//--- Exit if the button is not used
   if(!this.m_butt_close)
      return;
//--- The button width is equal to the height of the header area
   int w=this.m_header_h;
//--- Button coordinates and size
   int x1=this.m_w-w;
   int x2=this.m_w-1;
   int y1=0;
   int y2=w-1;
//--- Shift of the upper left corner of the rectangular area of the image from the upper left corner of the button
   int shift=4;
//--- Draw the button background
   this.m_canvas.FillRectangle(x1,y1,x2,y2,::ColorToARGB(this.m_butt_close_back_color,this.m_header_alpha));
//--- Draw the close button
   this.m_canvas.LineThick(x1+shift+1,y1+shift+1,x2-shift,y2-shift,::ColorToARGB(this.m_butt_close_fore_color,255),3,STYLE_SOLID,LINE_END_ROUND);
   this.m_canvas.LineThick(x1+shift+1,y2-shift-1,x2-shift,y1+shift,::ColorToARGB(this.m_butt_close_fore_color,255),3,STYLE_SOLID,LINE_END_ROUND);
//--- Remember the current background color and button design
   this.m_butt_close_back_color_c=this.m_butt_close_back_color;
   this.m_butt_close_fore_color_c=this.m_butt_close_fore_color;
//--- update the canvas without redrawing the screen
   this.m_canvas.Update(false);
  }
Toda a lógica é explicada nos comentários do código: desenha um plano de fundo e, sobre o plano de fundo, uma imagem do ícone de fechamento (cruz).
Método que redesenha o botão de fechamento do painel:
//+------------------------------------------------------------------+
//| Redraw the panel close button                                    |
//+------------------------------------------------------------------+
void CDashboard::RedrawButtonClose(const color new_back_color=clrNONE,const color new_fore_color=clrNONE,const ushort new_alpha=USHORT_MAX)
  {
//--- Exit if the button is not used or all passed parameters have default values
   if(!this.m_butt_close || (new_back_color==clrNONE && new_fore_color==clrNONE && new_alpha==USHORT_MAX))
      return;
//--- The button width is equal to the height of the header area
   int w=this.m_header_h;
//--- Button coordinates and size
   int x1=this.m_w-w;
   int x2=this.m_w-1;
   int y1=0;
   int y2=w-1;
//--- Shift of the upper left corner of the rectangular area of the image from the upper left corner of the button
   int shift=4;
//--- Define new background and text colors, and transparency
   color back_color=(new_back_color!=clrNONE ? new_back_color : this.m_butt_close_back_color);
   color fore_color=(new_fore_color!=clrNONE ? new_fore_color : this.m_butt_close_fore_color);
   uchar alpha=uchar(new_alpha==USHORT_MAX ? this.m_header_alpha : new_alpha>255 ? 255 : new_alpha);
//--- Draw the button background
   this.m_canvas.FillRectangle(x1,y1,x2,y2,::ColorToARGB(back_color,alpha));
//--- Draw the close button
   this.m_canvas.LineThick(x1+shift+1,y1+shift+1,x2-shift,y2-shift,::ColorToARGB(fore_color,255),3,STYLE_SOLID,LINE_END_ROUND);
   this.m_canvas.LineThick(x1+shift+1,y2-shift-1,x2-shift,y1+shift,::ColorToARGB(fore_color,255),3,STYLE_SOLID,LINE_END_ROUND);
//--- Remember the current background color and button design
   this.m_butt_close_back_color_c=back_color;
   this.m_butt_close_fore_color_c=fore_color;
//--- update the canvas without redrawing the screen
   this.m_canvas.Update(false);
  }
Para redesenhar, pelo menos um dos parâmetros passados deve ser diferente do atual. Todo o resto é idêntico com o método de desenho do botão, exceto para selecionar e definir novos parâmetros de desenho.
Outros métodos de desenho e redesenho de botões de recolha/expansão e de âncora:
//+------------------------------------------------------------------+
//| Draw the panel collapse/expand button                            |
//+------------------------------------------------------------------+
void CDashboard::DrawButtonMinimize(void)
  {
//--- Exit if the button is not used
   if(!this.m_butt_minimize)
      return;
//--- The button width is equal to the height of the header area
   int w=this.m_header_h;
//--- The width of the close button is zero if the button is not used
   int wc=(this.m_butt_close ? w : 0);
//--- Button coordinates and size
   int x1=this.m_w-wc-w;
   int x2=this.m_w-wc-1;
   int y1=0;
   int y2=w-1;
//--- Shift of the upper left corner of the rectangular area of the image from the upper left corner of the button
   int shift=4;
//--- Draw the button background
   this.m_canvas.FillRectangle(x1,y1,x2,y2,::ColorToARGB(this.m_butt_min_back_color,this.m_header_alpha));
//--- If the panel is collapsed, draw a rectangle
   if(this.m_minimized)
      this.m_canvas.Rectangle(x1+shift,y1+shift,x2-shift,y2-shift,::ColorToARGB(this.m_butt_min_fore_color,255));
//--- Otherwise, the panel is expanded. Draw a line segment
   else
      this.m_canvas.LineThick(x1+shift,y2-shift,x2-shift,y2-shift,::ColorToARGB(this.m_butt_min_fore_color,255),3,STYLE_SOLID,LINE_END_ROUND);
//--- Remember the current background color and button design
   this.m_butt_min_back_color_c=this.m_butt_min_back_color;
   this.m_butt_min_fore_color_c=this.m_butt_min_fore_color;
//--- update the canvas without redrawing the screen
   this.m_canvas.Update(false);
  }
//+------------------------------------------------------------------+
//| Redraw the panel collapse/expand button                          |
//+------------------------------------------------------------------+
void CDashboard::RedrawButtonMinimize(const color new_back_color=clrNONE,const color new_fore_color=clrNONE,const ushort new_alpha=USHORT_MAX)
  {
//--- Exit if the button is not used or all passed parameters have default values
   if(!this.m_butt_minimize || (new_back_color==clrNONE && new_fore_color==clrNONE && new_alpha==USHORT_MAX))
      return;
//--- The button width is equal to the height of the header area
   int w=this.m_header_h;
//--- The width of the close button is zero if the button is not used
   int wc=(this.m_butt_close ? w : 0);
//--- Button coordinates and size
   int x1=this.m_w-wc-w;
   int x2=this.m_w-wc-1;
   int y1=0;
   int y2=w-1;
//--- Shift of the upper left corner of the rectangular area of the image from the upper left corner of the button
   int shift=4;
//--- Define new background and text colors, and transparency
   color back_color=(new_back_color!=clrNONE ? new_back_color : this.m_butt_min_back_color);
   color fore_color=(new_fore_color!=clrNONE ? new_fore_color : this.m_butt_min_fore_color);
   uchar alpha=uchar(new_alpha==USHORT_MAX ? this.m_header_alpha : new_alpha>255 ? 255 : new_alpha);
//--- Draw the button background
   this.m_canvas.FillRectangle(x1,y1,x2,y2,::ColorToARGB(back_color,alpha));
//--- If the panel is collapsed, draw a rectangle
   if(this.m_minimized)
      this.m_canvas.Rectangle(x1+shift,y1+shift,x2-shift,y2-shift,::ColorToARGB(fore_color,255));
//--- Otherwise, the panel is expanded. Draw a line segment
   else
      this.m_canvas.LineThick(x1+shift,y2-shift,x2-shift,y2-shift,::ColorToARGB(fore_color,255),3,STYLE_SOLID,LINE_END_ROUND);
//--- Remember the current background color and button design
   this.m_butt_min_back_color_c=back_color;
   this.m_butt_min_fore_color_c=fore_color;
//--- update the canvas without redrawing the screen
   this.m_canvas.Update(false);
  }
//+------------------------------------------------------------------+
//| Draw the panel pin button                                        |
//+------------------------------------------------------------------+
void CDashboard::DrawButtonPin(void)
  {
//--- Exit if the button is not used
   if(!this.m_butt_pin)
      return;
//--- The button width is equal to the height of the header area
   int w=this.m_header_h;
//--- The width of the close and collapse buttons is zero if the button is not used
   int wc=(this.m_butt_close ? w : 0);
   int wm=(this.m_butt_minimize ? w : 0);
//--- Button coordinates and size
   int x1=this.m_w-wc-wm-w;
   int x2=this.m_w-wc-wm-1;
   int y1=0;
   int y2=w-1;
//--- Draw the button background
   this.m_canvas.FillRectangle(x1,y1,x2,y2,::ColorToARGB(this.m_butt_pin_back_color,this.m_header_alpha));
//--- Coordinates of the broken line points
   int x[]={x1+3, x1+6, x1+3,x1+4,x1+6,x1+9,x1+9,x1+10,x1+15,x1+14,x1+13,x1+10,x1+10,x1+9,x1+6};
   int y[]={y1+14,y1+11,y1+8,y1+7,y1+7,y1+4,y1+3,y1+2, y1+7, y1+8, y1+8, y1+11,y1+13,y1+14,y1+11};
//--- Draw the "button" shape
   this.m_canvas.Polygon(x,y,::ColorToARGB(this.m_butt_pin_fore_color,255));
//--- If the movability flag is reset (pinned) - cross out the drawn button
   if(!this.m_movable)
      this.m_canvas.Line(x1+3,y1+2,x1+15,y1+14,::ColorToARGB(this.m_butt_pin_fore_color,255));
//--- Remember the current background color and button design
   this.m_butt_pin_back_color_c=this.m_butt_pin_back_color;
   this.m_butt_pin_fore_color_c=this.m_butt_pin_fore_color;
//--- update the canvas without redrawing the screen
   this.m_canvas.Update(false);
  }
//+------------------------------------------------------------------+
//| Redraw the panel pin button                                      |
//+------------------------------------------------------------------+
void CDashboard::RedrawButtonPin(const color new_back_color=clrNONE,const color new_fore_color=clrNONE,const ushort new_alpha=USHORT_MAX)
  {
//--- Exit if the button is not used or all passed parameters have default values
   if(!this.m_butt_pin || (new_back_color==clrNONE && new_fore_color==clrNONE && new_alpha==USHORT_MAX))
      return;
//--- The button width is equal to the height of the header area
   int w=this.m_header_h;
//--- The width of the close and collapse buttons is zero if the button is not used
   int wc=(this.m_butt_close ? w : 0);
   int wm=(this.m_butt_minimize ? w : 0);
//--- Button coordinates and size
   int x1=this.m_w-wc-wm-w;
   int x2=this.m_w-wc-wm-1;
   int y1=0;
   int y2=w-1;
//--- Define new background and text colors, and transparency
   color back_color=(new_back_color!=clrNONE ? new_back_color : this.m_butt_pin_back_color);
   color fore_color=(new_fore_color!=clrNONE ? new_fore_color : this.m_butt_pin_fore_color);
   uchar alpha=uchar(new_alpha==USHORT_MAX ? this.m_header_alpha : new_alpha>255 ? 255 : new_alpha);
//--- Draw the button background
   this.m_canvas.FillRectangle(x1,y1,x2,y2,::ColorToARGB(back_color,alpha));
//--- Coordinates of the broken line points
   int x[]={x1+3, x1+6, x1+3,x1+4,x1+6,x1+9,x1+9,x1+10,x1+15,x1+14,x1+13,x1+10,x1+10,x1+9,x1+6};
   int y[]={y1+14,y1+11,y1+8,y1+7,y1+7,y1+4,y1+3,y1+2, y1+7, y1+8, y1+8, y1+11,y1+13,y1+14,y1+11};
//--- Draw the "button" shape
   this.m_canvas.Polygon(x,y,::ColorToARGB(this.m_butt_pin_fore_color,255));
//--- If the movability flag is reset (pinned) - cross out the drawn button
   if(!this.m_movable)
      this.m_canvas.Line(x1+3,y1+2,x1+15,y1+14,::ColorToARGB(this.m_butt_pin_fore_color,255));
//--- Remember the current background color and button design
   this.m_butt_pin_back_color_c=back_color;
   this.m_butt_pin_fore_color_c=fore_color;
//--- update the canvas without redrawing the screen
   this.m_canvas.Update(false);
  }
Os métodos são idênticos aos métodos para desenhar e redesenhar o botão Fechar. A lógica é exatamente a mesma e está explicitada nos comentários do código.
Método para desenhar o painel:
//+------------------------------------------------------------------+
//| Draw the panel                                                   |
//+------------------------------------------------------------------+
void CDashboard::Draw(const string title)
  {
//--- Set the title text
   this.m_title=title;
//--- If the collapse flag is not set, expand the panel
   if(!this.m_minimized)
      this.Expand();
//--- Otherwise, collapse the panel
   else
      this.Collapse();
//--- Update the canvas without redrawing the chart
   this.m_canvas.Update(false);
//--- Update the working space and redraw the chart
   this.m_workspace.Update();
  }
Se o sinalizador que determina o recolhimento não estiver definido, expandimos o painel, ou seja, o desenhamos expandido. Se o sinalizador de recolhimento estiver definido, minimizaremos o painel: desenharemos o painel recolhido - somente o título.
Método para recolher o painel:
//+------------------------------------------------------------------+
//| Collapse the panel                                               |
//+------------------------------------------------------------------+
void CDashboard::Collapse(void)
  {
//--- Save the pixels of the working space and the panel background into arrays
   this.SaveWorkspace();
   this.SaveBackground();
//--- Remember the current height of the panel
   int h=this.m_h;
//--- Change the dimensions (height) of the canvas and working space
   if(!this.SetSizes(this.m_canvas.Width(),this.m_header_h))
      return;
//--- Draw the header area
   this.DrawHeaderArea(this.m_title);
//--- Return the saved panel height to the variable
   this.m_h=h;
  }
Antes de recolher o painel do estado expandido, você precisa salvar todos os pixels do plano de fundo e da área de trabalho em arrays. Isso é necessário para expandir rapidamente o painel, de modo que você não precise desenhá-lo novamente, mas apenas restaurar as imagens do painel e do espaço de trabalho a partir dos arrays de pixels. Além disso, algo pode ter sido desenhado no plano de fundo do painel como uma decoração adicional - nesse caso, pode ser um sinal. Ele também será salvo junto com o plano de fundo e, em seguida, será restaurado.
Método que expande o painel:
//+------------------------------------------------------------------+
//| Expand the panel                                                 |
//+------------------------------------------------------------------+
void CDashboard::Expand(void)
  {
//--- Resize the panel
   if(!this.SetSizes(this.m_canvas.Width(),this.m_h))
      return;
//--- If the panel background pixels have never been saved into an array
   if(this.m_array_ppx.Size()==0)
     {
      //--- Draw the panel and
      this.m_canvas.Erase(::ColorToARGB(this.m_back_color,this.m_alpha));
      this.DrawFrame();
      this.DrawHeaderArea(this.m_title);
      //--- save the background pixels of the panel and working space into arrays
      this.SaveWorkspace();
      this.SaveBackground();
     }
//--- If the background pixels of the panel and working space were previously saved,
   else
     {
      //--- restore the background pixels of the panel and working space from arrays
      this.RestoreBackground();
      if(this.m_array_wpx.Size()>0)
         this.RestoreWorkspace();
     }
//--- If, after expanding, the panel goes beyond the chart window, adjust the panel location
   if(this.m_y+this.m_canvas.Height()>this.m_chart_h-1)
      this.Move(this.m_x,this.m_chart_h-1-this.m_canvas.Height());
  }
Se os arrays nos quais os pixels do plano de fundo e da área de trabalho são salvos estiverem vazios, desenharemos o painel inteiro usando os métodos de desenho. Se os arrays já estiverem preenchidos, basta reconstruir o plano de fundo e o espaço de trabalho do painel a partir dos arrays.
Métodos auxiliares para trabalhar com cores:
//+------------------------------------------------------------------+
//| Returns color with a new color component                         |
//+------------------------------------------------------------------+
color CDashboard::NewColor(color base_color, int shift_red, int shift_green, int shift_blue)
  {
   double clR=0, clG=0, clB=0;
   this.ColorToRGB(base_color,clR,clG,clB);
   double clRn=(clR+shift_red  < 0 ? 0 : clR+shift_red  > 255 ? 255 : clR+shift_red);
   double clGn=(clG+shift_green< 0 ? 0 : clG+shift_green> 255 ? 255 : clG+shift_green);
   double clBn=(clB+shift_blue < 0 ? 0 : clB+shift_blue > 255 ? 255 : clB+shift_blue);
   return this.RGBToColor(clRn,clGn,clBn);
  }
//+------------------------------------------------------------------+
//| Convert RGB to color                                             |
//+------------------------------------------------------------------+
color CDashboard::RGBToColor(const double r,const double g,const double b) const
  {
   int int_r=(int)::round(r);
   int int_g=(int)::round(g);
   int int_b=(int)::round(b);
   int clr=0;
   clr=int_b;
   clr<<=8;
   clr|=int_g;
   clr<<=8;
   clr|=int_r;
//---
   return (color)clr;
  }
//+------------------------------------------------------------------+
//| Getting values of the RGB components                             |
//+------------------------------------------------------------------+
void CDashboard::ColorToRGB(const color clr,double &r,double &g,double &b)
  {
   r=GetR(clr);
   g=GetG(clr);
   b=GetB(clr);
  }
Os métodos são necessários para alterar a cor quando o cursor interage com os controles no painel.
Método que define a transparência do título:
//+------------------------------------------------------------------+
//| Set the header transparency                                      |
//+------------------------------------------------------------------+
void CDashboard::SetHeaderTransparency(const uchar value)
  {
   this.m_header_alpha=value;
   if(this.m_header_alpha_c!=this.m_header_alpha)
      this.RedrawHeaderArea(clrNONE,NULL,clrNONE,value);
   this.m_header_alpha_c=value;
  }
Primeiro, o valor de transparência passado ao método é gravado em uma variável que armazena a transparência padrão, em seguida, o novo valor é comparado com o atual. Se os valores não forem iguais, então a área do título é completamente redesenhada. No final, a transparência atual é atualizada para o valor definido.
Método que define a transparência do painel:
//+------------------------------------------------------------------+
//| Set the panel transparency                                       |
//+------------------------------------------------------------------+
void CDashboard::SetTransparency(const uchar value)
  {
   this.m_alpha=value;
   if(this.m_alpha_c!=this.m_alpha)
     {
      this.m_canvas.Erase(::ColorToARGB(this.m_back_color,value));
      this.DrawFrame();
      this.RedrawHeaderArea(clrNONE,NULL,clrNONE,value);
      this.m_canvas.Update(false);
     }
   this.m_alpha_c=value;
  }
A lógica é semelhante ao método discutido anteriormente. Se a transparência passada ao método for diferente da atual, então o painel é completamente redesenhado com a nova transparência.
Método que define os parâmetros de fonte padrão da área de trabalho:
//+------------------------------------------------------------------+
//| Set the default font parameters of the working space             |
//+------------------------------------------------------------------+
void CDashboard::SetFontParams(const string name,const int size,const uint flags=0,const uint angle=0)
  {
   if(!this.m_workspace.FontSet(name,size*-10,flags,angle))
     {
      ::PrintFormat("%s: Failed to set font options. Error %lu",(string)__FUNCTION__,::GetLastError());
      return;
     }
   this.m_font=name;
   this.m_font_size=size*-10;
  }
Os parâmetros de fonte passados ao método (nome da fonte, seu tamanho, sinalizadores e ângulo) são definidos no objeto CCanvas da área de trabalho e salvos nas variáveis.
O tamanho da fonte passado ao método é multiplicado por -10 devido a uma razão descrita na nota da função TextSetFont:
O tamanho da fonte é especificado como valores positivos ou negativos; o sinal determina a dependência do tamanho do texto das configurações do sistema operacional (escala da fonte).
- Se o tamanho for definido como um número positivo, quando uma fonte lógica for mapeada para uma fonte física, o tamanho será convertido em unidades físicas do dispositivo (pixels) e esse tamanho corresponderá à altura das células de caracteres das fontes disponíveis. Isso não é recomendado nos casos em que se pretende usar textos gerados pela função TextOut() e textos exibidos com a ajuda do objeto gráfico OBJ_LABEL ("Rótulo de texto") juntos no gráfico.
- Se o tamanho for especificado como um número negativo, será assumido que o tamanho especificado foi especificado em décimos de um ponto lógico (um valor de -350 equivale a 35 pontos lógicos) e dividido por 10, e o valor resultante será convertido em unidades físicas do dispositivo (pixels) e corresponderá ao valor absoluto da altura do caractere das fontes disponíveis. Para obter o mesmo tamanho de texto na tela que no objeto OBJ_LABEL, pegue o tamanho da fonte especificado nas propriedades do objeto e multiplique por -10.
Método para ativar/desativar modos de trabalho com o gráfico:
//+------------------------------------------------------------------+
//| Enable/disable modes of working with the chart                   |
//+------------------------------------------------------------------+
void CDashboard::SetChartsTool(const bool flag)
  {
//--- If the 'true' flag is passed and if chart scrolling is disabled
   if(flag && !::ChartGetInteger(this.m_chart_id,CHART_MOUSE_SCROLL))
     {
      //--- enable chart scrolling, right-click menu and crosshair
      ::ChartSetInteger(0,CHART_MOUSE_SCROLL,true);
      ::ChartSetInteger(0,CHART_CONTEXT_MENU,true);
      ::ChartSetInteger(0,CHART_CROSSHAIR_TOOL,true);
     }
//--- otherwise, if the 'false' flag is passed and if chart scrolling is enabled
   else if(!flag && ::ChartGetInteger(this.m_chart_id,CHART_MOUSE_SCROLL))
     {
      //--- disable chart scrolling, right-click menu and crosshair
      ::ChartSetInteger(0,CHART_MOUSE_SCROLL,false);
      ::ChartSetInteger(0,CHART_CONTEXT_MENU,false);
      ::ChartSetInteger(0,CHART_CROSSHAIR_TOOL,false);
     }
  }
Dependendo do sinalizador passado, o método verifica o estado de rolagem do gráfico com o mouse e ativa ou desativa todos os modos do gráfico. A verificação do modo de rolagem é necessária para que não seja necessário enviar constantemente o comando para definir os modos quando o cursor estiver dentro ou fora da janela do painel. Os modos são alternados somente quando o cursor está dentro do painel ou quando o cursor está fora do painel.
Método que gera uma mensagem de texto nas coordenadas especificadas:
//+------------------------------------------------------------------+
//| Display a text message at the specified coordinates              |
//+------------------------------------------------------------------+
void CDashboard::DrawText(const string text,const int x,const int y,const int width=WRONG_VALUE,const int height=WRONG_VALUE)
  {
//--- Declare variables to record the text width and height in them
   int w=width;
   int h=height;
//--- If the width and height of the text passed to the method have zero values,
//--- then the entire working space is completely cleared using the transparent color
   if(width==0 && height==0)
      this.m_workspace.Erase(0x00FFFFFF);
//--- Otherwise
   else
     {
      //--- If the passed width and height have default values (-1), we get its width and height from the text
      if(width==WRONG_VALUE && height==WRONG_VALUE)
         this.m_workspace.TextSize(text,w,h);
      //--- otherwise,
      else
        {
         //--- if the width passed to the method has the default value (-1) - get the width from the text, or
         //--- if the width passed to the method has a value greater than zero, use the width passed to the method, or
         //--- if the width passed to the method has a zero value, use the value 1 for the width
         w=(width ==WRONG_VALUE ? this.m_workspace.TextWidth(text)  : width>0  ? width  : 1);
         //--- if the height passed to the method has a default value (-1), get the height from the text, or
         //--- if the height passed to the method has a value greater than zero, use the height passed to the method, or
         //--- if the height passed to the method has a zero value, use value 1 for the height
         h=(height==WRONG_VALUE ? this.m_workspace.TextHeight(text) : height>0 ? height : 1);
        }
      //--- Fill the space according to the specified coordinates and the resulting width and height with a transparent color (erase the previous entry)
      this.m_workspace.FillRectangle(x,y,x+w,y+h,0x00FFFFFF);
     }
//--- Display the text to the space cleared of previous text and update the working space without redrawing the screen
   this.m_workspace.TextOut(x,y,text,::ColorToARGB(this.m_fore_color));
   this.m_workspace.Update(false);
  }
Trabalhar com a tela no caso de saída de gráficos nela equivale a desenhar esses gráficos na tela como um pincel em uma tela. Assim, uma imagem desenhada na tela fica em cima de outra imagem desenhada antes. Para substituir a imagem, precisamos redesenhar completamente toda a tela ou calcular as dimensões da imagem anterior, apagar essa área e desenhar outra imagem na área apagada.
No caso de textos, podemos obter as dimensões do texto já desenhado na tela para apagar essa área antes de renderizar o próximo texto. Mas armazenar todos os textos e formas desenhados anteriormente em algum lugar do objeto não é o ideal. Então, aqui escolhemos entre precisão e simplicidade com qualidade. Aqui, obteremos as dimensões do texto atual (que pode não corresponder à largura do texto desenhado anteriormente nesse local) e usaremos essas dimensões para apagar o texto desenhado anteriormente antes de gerar o próximo.
Se o texto anterior não tiver a mesma largura que o texto atual, ou for maior, ele não será apagado em sua totalidade. Para esses casos, o método fornece parâmetros de passagem que especificam a altura e a largura necessárias da área apagada:
- Se os valores de largura e altura passados para o método forem -1 (padrão), a área igual à largura e à altura do texto atual será apagada,
- Se forem passados zeros para o método, toda a área de trabalho será apagada,
- Se um valor de largura ou altura maior que zero for passado, esses valores serão usados para largura e altura, respectivamente.
A classe de painel está projetada para gerar dados em formato de tabela. Para facilitar o cálculo das coordenadas dos dados exibidos no painel e o design visual do painel, são fornecidos dois métodos que calculam as coordenadas das células da tabela e desenham tabelas (se necessário) no plano de fundo do painel.
- O primeiro método calcula as coordenadas das células da tabela de acordo com os dados passados a ele: coordenadas X e Y iniciais da tabela no painel, número de linhas, colunas, altura da linha e largura da coluna. Você também pode especificar sua própria cor das linhas de grade da tabela e o sinal das linhas "alternadas".
- O segundo método calcula os tamanhos das linhas e colunas automaticamente, dependendo do número delas e da largura do recuo da tabela em relação às bordas do painel. Também é possível especificar sua própria cor para as linhas de grade da tabela e para o recurso de linhas "alternadas".
Método que desenha a grade de fundo de acordo com os parâmetros especificados:
//+------------------------------------------------------------------+
//| Draw the background grid                                         |
//+------------------------------------------------------------------+
void CDashboard::DrawGrid(const uint x,const uint y,const uint rows,const uint columns,const uint row_size,const uint col_size,
                          const color line_color=clrNONE,bool alternating_color=true)
  {
//--- If the panel is collapsed, leave
   if(this.m_minimized)
      return;
//--- Clear all lists of the tabular data object (remove cells from rows and all rows)
   this.m_table_data.Clear();
//--- Line height cannot be less than 2
   int row_h=int(row_size<2 ? 2 : row_size);
//--- Column width cannot be less than 2
   int col_w=int(col_size<2 ? 2 : col_size);

//--- The X1 (left) coordinate of the table cannot be less than 1 (to leave one pixel around the perimeter of the panel for the frame)
   int x1=int(x<1 ? 1 : x);
//--- Calculate the X2 coordinate (right) depending on the number of columns and their width
   int x2=x1+col_w*int(columns>0 ? columns : 1);
//--- The Y1 coordinate is located under the panel title area
   int y1=this.m_header_h+(int)y;
//--- Calculate the Y2 coordinate (bottom) depending on the number of lines and their height
   int y2=y1+row_h*int(rows>0 ? rows : 1);

//--- Get the color of the table grid lines, either by default or passed to the method
   color clr=(line_color==clrNONE ? C'200,200,200' : line_color);
//--- If the initial X coordinate is greater than 1, draw a table frame
//--- (in case of the coordinate 1, the table frame is the panel frame)
   if(x1>1)
      this.m_canvas.Rectangle(x1,y1,x2,y2,::ColorToARGB(clr,this.m_alpha));
//--- In the loop by table rows,
   for(int i=0;i<(int)rows;i++)
     {
      //--- calculate the Y coordinate of the next horizontal grid line (Y coordinate of the next table row)
      int row_y=y1+row_h*i;
      //--- if the flag of "alternating" line colors is passed and the line is even
      if(alternating_color && i%2==0)
        {
         //--- lighten the table background color and draw a background rectangle
         color new_color=this.NewColor(clr,45,45,45);
         this.m_canvas.FillRectangle(x1+1,row_y+1,x2-1,row_y+row_h-1,::ColorToARGB(new_color,this.m_alpha));
        }
      //--- Draw a table grid horizontal line
      this.m_canvas.Line(x1,row_y,x2,row_y,::ColorToARGB(clr,this.m_alpha));

      //--- Create a new table row object
      CTableRow *row_obj=new CTableRow(i);
      if(row_obj==NULL)
        {
         ::PrintFormat("%s: Failed to create table row object at index %lu",(string)__FUNCTION__,i);
         continue;
        }
      //--- Add it to the list of rows of the tabular data object
      //--- (if adding an object failed, delete the created object)
      if(!this.m_table_data.AddRow(row_obj))
         delete row_obj;
      //--- Set its Y coordinate in the created row object taking into account the offset from the panel title
      row_obj.SetY(row_y-this.m_header_h);
     }
//--- In the loop by table columns,
   for(int i=0;i<(int)columns;i++)
     {
      //--- calculate the X coordinate of the next vertical grid line (X coordinate of the next table row)
      int col_x=x1+col_w*i;
      //--- If the grid line goes beyond the panel, interrupt the loop
      if(x1==1 && col_x>=x1+m_canvas.Width()-2)
         break;
      //--- Draw a vertical line of the table grid
      this.m_canvas.Line(col_x,y1,col_x,y2,::ColorToARGB(clr,this.m_alpha));

      //--- Get the number of created rows from the table data object
      int total=this.m_table_data.RowsTotal();
      //--- In the loop by table rows
      for(int j=0;j<total;j++)
        {
         //--- get the next row
         CTableRow *row=m_table_data.GetRow(j);
         if(row==NULL)
            continue;
         //--- Create a new table cell
         CTableCell *cell=new CTableCell(row.Row(),i);
         if(cell==NULL)
           {
            ::PrintFormat("%s: Failed to create table cell object at index %lu",(string)__FUNCTION__,i);
            continue;
           }
         //--- Add the created cell to the row
         //--- (if adding an object failed, delete the created object)
         if(!row.AddCell(cell))
           {
            delete cell;
            continue;
           }
         //--- In the created cell object, set its X coordinate and the Y coordinate from the row object
         cell.SetXY(col_x,row.Y());
        }
     }
//--- Update the canvas without redrawing the chart
   this.m_canvas.Update(false);
  }
A lógica do método e a sequência relacionada ao desenho da tabela e à criação de sua instância no objeto de dados da tabela estão descritas em detalhes no código, em quase todas as linhas. Os dados que são gravados na instância da tabela desenhada no objeto de dados tabulares serão necessários para obter as coordenadas de cada célula, de modo que será útil especificar as coordenadas necessárias ao exibir os dados no painel. Basta especificar o número da célula de acordo com sua localização na tabela (Row e Column) e obter as coordenadas do canto superior esquerdo dessa célula no painel.
Método que desenha a grade de fundo com tamanho de célula automático:
//+------------------------------------------------------------------+
//| Draws the background grid with automatic cell sizing             |
//+------------------------------------------------------------------+
void CDashboard::DrawGridAutoFill(const uint border,const uint rows,const uint columns,const color line_color=clrNONE,bool alternating_color=true)
  {
//--- If the panel is collapsed, leave
   if(this.m_minimized)
      return;
//--- X1 (left) table coordinate
   int x1=(int)border;
//--- X2 (right) table coordinate
   int x2=this.m_canvas.Width()-(int)border-1;
//--- Y1 (upper) table coordinate
   int y1=this.m_header_h+(int)border;
//--- Y2 (lower) table coordinate
   int y2=this.m_canvas.Height()-(int)border-1;

//--- Get the color of the table grid lines, either by default or passed to the method
   color clr=(line_color==clrNONE ? C'200,200,200' : line_color);
//--- If the offset from the edge of the panel is greater than zero, draw a table border,
//--- otherwise, the panel border is used as the table border
   if(border>0)
      this.m_canvas.Rectangle(x1,y1,x2,y2,::ColorToARGB(clr,this.m_alpha));

//--- Height of the entire table grid
   int greed_h=y2-y1;
//--- Calculate the row height depending on the table height and the number of rows
   int row_h=(int)::round((double)greed_h/(double)rows);
//--- In the loop based on the number of rows
   for(int i=0;i<(int)rows;i++)
     {
      //--- calculate the Y coordinate of the next horizontal grid line (Y coordinate of the next table row)
      int row_y=y1+row_h*i;
      //--- if the flag of "alternating" line colors is passed and the line is even
      if(alternating_color && i%2==0)
        {
         //--- lighten the table background color and draw a background rectangle
         color new_color=this.NewColor(clr,45,45,45);
         this.m_canvas.FillRectangle(x1+1,row_y+1,x2-1,row_y+row_h-1,::ColorToARGB(new_color,this.m_alpha));
        }
      //--- Draw a table grid horizontal line
      this.m_canvas.Line(x1,row_y,x2,row_y,::ColorToARGB(clr,this.m_alpha));

      //--- Create a new table row object
      CTableRow *row_obj=new CTableRow(i);
      if(row_obj==NULL)
        {
         ::PrintFormat("%s: Failed to create table row object at index %lu",(string)__FUNCTION__,i);
         continue;
        }
      //--- Add it to the list of rows of the tabular data object
      //--- (if adding an object failed, delete the created object)
      if(!this.m_table_data.AddRow(row_obj))
         delete row_obj;
      //--- Set its Y coordinate in the created row object taking into account the offset from the panel title
      row_obj.SetY(row_y-this.m_header_h);
     }

//--- Table grid width
   int greed_w=x2-x1;
//--- Calculate the column width depending on the table width and the number of columns
   int col_w=(int)::round((double)greed_w/(double)columns);
//--- In the loop by table columns,
   for(int i=0;i<(int)columns;i++)
     {
      //--- calculate the X coordinate of the next vertical grid line (X coordinate of the next table row)
      int col_x=x1+col_w*i;
      //--- If this is not the very first vertical line, draw it
      //--- (the first vertical line is either the table frame or the panel frame)
      if(i>0)
         this.m_canvas.Line(col_x,y1,col_x,y2,::ColorToARGB(clr,this.m_alpha));

      //--- Get the number of created rows from the table data object
      int total=this.m_table_data.RowsTotal();
      //--- In the loop by table rows
      for(int j=0;j<total;j++)
        {
         //--- get the next row
         CTableRow *row=this.m_table_data.GetRow(j);
         if(row==NULL)
            continue;
         //--- Create a new table cell
         CTableCell *cell=new CTableCell(row.Row(),i);
         if(cell==NULL)
           {
            ::PrintFormat("%s: Failed to create table cell object at index %lu",(string)__FUNCTION__,i);
            continue;
           }
         //--- Add the created cell to the row
         //--- (if adding an object failed, delete the created object)
         if(!row.AddCell(cell))
           {
            delete cell;
            continue;
           }
         //--- In the created cell object, set its X coordinate and the Y coordinate from the row object
         cell.SetXY(col_x,row.Y());
        }
     }
//--- Update the canvas without redrawing the chart
   this.m_canvas.Update(false);
  }
Esse método difere do método acima apenas porque calcula automaticamente a largura e a altura da tabela, dependendo do recuo da tabela em relação à borda do painel, da altura da linha (altura da tabela / número de linhas) e da largura da coluna (largura da tabela / número de colunas). Além disso, ele é totalmente comentado diretamente no código.
Essas tabelas devem ser criadas (desenhadas no painel) depois que o painel for criado e desenhado no gráfico. Caso contrário, mesmo que a tabela não seja desenhada, os dados tabulares serão todos calculados e poderão ser usados. Isso significa que desenhar a tabela depois de exibir o painel no gráfico é necessário apenas nos casos em que a tabela deve ser desenhada no painel.
Para restaurar rapidamente o plano de fundo do painel e da área de trabalho, são fornecidos arrays para os quais são copiados os pixels da imagem da área de trabalho e do painel antes de, por exemplo, minimizar o painel. Quando o painel é expandido, em vez de redesenhar tudo o que foi desenhado anteriormente nele, os planos de fundo do painel e da área de trabalho são simplesmente restaurados a partir dos arrays de pixels. Isso é muito mais prático do que ter de lembrar quê e com que parâmetros foi desenhado na tela para redesenhá-lo mais tarde.
Há dois métodos para o painel e o espaço de trabalho: um para salvar a imagem no array de pixels e outro para restaurar a imagem a partir do array de pixels.
Método que salva o espaço de trabalho em um array de pixels:
//+------------------------------------------------------------------+
//| Save the working space to the array of pixels                    |
//+------------------------------------------------------------------+
void CDashboard::SaveWorkspace(void)
  {
//--- Calculate the required size of the array (width * height of the working space)
   uint size=this.m_workspace.Width()*this.m_workspace.Height();
//--- If the size of the array is not equal to the calculated one, change it
   if(this.m_array_wpx.Size()!=size)
     {
      ::ResetLastError();
      if(::ArrayResize(this.m_array_wpx,size)!=size)
        {
         ::PrintFormat("%s: ArrayResize failed. Error %lu",(string)__FUNCTION__,::GetLastError());
         return;
        }
     }
   uint n=0;
//--- In the loop along the height of the working space (pixel Y coordinate)
   for(int y=0;y<this.m_workspace.Height();y++)
      //--- in the loop by the working space width (pixel X coordinate)
      for(int x=0;x<this.m_workspace.Width();x++)
        {
         //--- calculate the pixel index in the receiving array
         n=this.m_workspace.Width()*y+x;
         if(n>this.m_array_wpx.Size()-1)
            break;
         //--- copy pixel to the receiving array from the working space X and Y
         this.m_array_wpx[n]=this.m_workspace.PixelGet(x,y);
        }
  }
Em dois laços aninhados, percorremos cada pixel de cada linha da imagem e os copiamos para o array receptor.
Método que reconstrói a área de trabalho a partir de um array de pixels:
//+------------------------------------------------------------------+
//| Restore the working space from the array of pixels               |
//+------------------------------------------------------------------+
void CDashboard::RestoreWorkspace(void)
  {
//--- Exit if the array is empty
   if(this.m_array_wpx.Size()==0)
      return;
   uint n=0;
//--- In the loop along the height of the working space (pixel Y coordinate)
   for(int y=0;y<this.m_workspace.Height();y++)
      //--- in the loop by the working space width (pixel X coordinate)
      for(int x=0;x<this.m_workspace.Width();x++)
        {
         //--- calculate the pixel index in the array
         n=this.m_workspace.Width()*y+x;
         if(n>this.m_array_wpx.Size()-1)
            break;
         //--- copy the pixel from the array to the X and Y coordinates of the working space
         this.m_workspace.PixelSet(x,y,this.m_array_wpx[n]);
        }
  }
Por meio de dois laços aninhados, calculamos o índice de cada pixel de cada linha da imagem no array e os copiamos do array para as coordenadas X e Y da imagem.
Método que armazena o plano de fundo do painel em um array de pixels:
//+------------------------------------------------------------------+
//| Save the panel background to the pixel array                     |
//+------------------------------------------------------------------+
void CDashboard::SaveBackground(void)
  {
//--- Calculate the required size of the array (panel width * height)
   uint size=this.m_canvas.Width()*this.m_canvas.Height();
//--- If the size of the array is not equal to the calculated one, change it
   if(this.m_array_ppx.Size()!=size)
     {
      ::ResetLastError();
      if(::ArrayResize(this.m_array_ppx,size)!=size)
        {
         ::PrintFormat("%s: ArrayResize failed. Error %lu",(string)__FUNCTION__,::GetLastError());
         return;
        }
     }
   uint n=0;
//--- In the loop by the panel height (pixel Y coordinate)
   for(int y=0;y<this.m_canvas.Height();y++)
      //--- in the loop by the panel width (pixel X coordinate)
      for(int x=0;x<this.m_canvas.Width();x++)
        {
         //--- calculate the pixel index in the receiving array
         n=this.m_canvas.Width()*y+x;
         if(n>this.m_array_ppx.Size()-1)
            break;
         //--- copy pixel to the receiving array from the panel X and Y
         this.m_array_ppx[n]=this.m_canvas.PixelGet(x,y);
        }
  }
Método que restaura o plano de fundo do painel a partir de um array de pixels:
//+------------------------------------------------------------------+
//| Restore the panel background from the array of pixels            |
//+------------------------------------------------------------------+
void CDashboard::RestoreBackground(void)
  {
//--- Exit if the array is empty
   if(this.m_array_ppx.Size()==0)
      return;
   uint n=0;
//--- In the loop by the panel height (pixel Y coordinate)
   for(int y=0;y<this.m_canvas.Height();y++)
      //--- in the loop by the panel width (pixel X coordinate)
      for(int x=0;x<this.m_canvas.Width();x++)
        {
         //--- calculate the pixel index in the array
         n=this.m_canvas.Width()*y+x;
         if(n>this.m_array_ppx.Size()-1)
            break;
         //--- copy the pixel from the array to the X and Y coordinates of the panel
         this.m_canvas.PixelSet(x,y,this.m_array_ppx[n]);
        }
  }
Para trazer um objeto para o primeiro plano, é necessário executar duas operações em sequência: ocultar o objeto e exibi-lo imediatamente. Cada objeto gráfico tem uma propriedade OBJPROP_TIMEFRAMES responsável por sua visibilidade em cada um dos timeframes. Para ocultar o objeto em todos os timeframes, você deve definir o valor OBJ_NO_PERIODS para essa propriedade. Da mesma forma, para exibir o objeto, é necessário definir a propriedade OBJPROP_TIMEFRAMES como OBJ_ALL_PERIODS.
Método que oculta o painel:
//+------------------------------------------------------------------+
//| Hide the panel                                                   |
//+------------------------------------------------------------------+
void CDashboard::Hide(const bool redraw=false)
  {
   ::ObjectSetInteger(this.m_chart_id,this.m_workspace.ChartObjectName(),OBJPROP_TIMEFRAMES,OBJ_NO_PERIODS);
   ::ObjectSetInteger(this.m_chart_id,this.m_canvas.ChartObjectName(),OBJPROP_TIMEFRAMES,OBJ_NO_PERIODS);
   if(redraw)
      ::ChartRedraw(this.m_chart_id);
  }
Quanto aos objetos do painel e da área de trabalho, a propriedade OBJPROP_TIMEFRAMES é definida como OBJ_NO_PERIODS, e o gráfico é redesenhado (se o sinalizador correspondente estiver definido) para exibir imediatamente as alterações.).
Método que exibe o painel:
//+------------------------------------------------------------------+
//| Display the panel                                                |
//+------------------------------------------------------------------+
void CDashboard::Show(const bool redraw=false)
  {
   ::ObjectSetInteger(this.m_chart_id,this.m_canvas.ChartObjectName(),OBJPROP_TIMEFRAMES,OBJ_ALL_PERIODS);
   if(!this.m_minimized)
      ::ObjectSetInteger(this.m_chart_id,this.m_workspace.ChartObjectName(),OBJPROP_TIMEFRAMES,OBJ_ALL_PERIODS);
   if(redraw)
      ::ChartRedraw(this.m_chart_id);
  }
Quanto ao objeto de painel, a propriedade OBJPROP_TIMEFRAMES é imediatamente definida como OBJ_ALL_PERIODS. E para o objeto de espaço de trabalho, o valor é definido somente se o painel estiver no estado expandido.
Quando o sinalizador de redesenho é ativado, o gráfico é redesenhado para exibir imediatamente as alterações.
Método que traz o painel para o primeiro plano:
//+------------------------------------------------------------------+
//| Bring the panel to the foreground                                |
//+------------------------------------------------------------------+
void CDashboard::BringToTop(void)
  {
   this.Hide(false);
   this.Show(true);
  }
Primeiro, o painel e a área de trabalho são ocultos sem redesenhar o gráfico, depois são exibidos imediatamente e o gráfico é redesenhado.
Em alguns casos, quando os arrays de pixels não podem ser armazenados na memória, eles precisam ser salvos em arquivos e depois carregados a partir deles. Os métodos para salvar arrays de pixels em um arquivo e carregá-los a partir de um arquivo estão preparados na classe:
//+------------------------------------------------------------------+
//| Save the pixel array of the working space to a file              |
//+------------------------------------------------------------------+
bool CDashboard::FileSaveWorkspace(void)
  {
//--- Define the folder and file name
   string filename=this.m_program_name+"\\Dashboard"+(string)this.m_id+"\\workspace.bin";
//--- If the saved array is empty, inform of that and return 'false'
   if(this.m_array_wpx.Size()==0)
     {
      ::PrintFormat("%s: Error. The workspace pixel array is empty.",__FUNCTION__);
      return false;
     }
//--- If the array could not be saved to a file, report this and return 'false'
   if(!::FileSave(filename,this.m_array_wpx))
     {
      ::PrintFormat("%s: FileSave '%s' failed. Error %lu",__FUNCTION__,filename,::GetLastError());
      return false;
     }
//--- Successful, return 'true'
   return true;
  }
//+------------------------------------------------------------------+
//| Save the pixel array of the panel background to a file           |
//+------------------------------------------------------------------+
bool CDashboard::FileSaveBackground(void)
  {
//--- Define the folder and file name
   string filename=this.m_program_name+"\\Dashboard"+(string)this.m_id+"\\background.bin";
//--- If the saved array is empty, inform of that and return 'false'
   if(this.m_array_ppx.Size()==0)
     {
      ::PrintFormat("%s: Error. The background pixel array is empty.",__FUNCTION__);
      return false;
     }
//--- If the array could not be saved to a file, report this and return 'false'
   if(!::FileSave(filename,this.m_array_ppx))
     {
      ::PrintFormat("%s: FileSave '%s' failed. Error %lu",__FUNCTION__,filename,::GetLastError());
      return false;
     }
//--- Successful, return 'true'
   return true;
  }
//+------------------------------------------------------------------+
//| Upload the array of working space pixels from a file             |
//+------------------------------------------------------------------+
bool CDashboard::FileLoadWorkspace(void)
  {
//--- Define the folder and file name
   string filename=this.m_program_name+"\\Dashboard"+(string)this.m_id+"\\workspace.bin";
//--- If failed to upload data from the file into the array, report this and return 'false'
   if(::FileLoad(filename,this.m_array_wpx)==WRONG_VALUE)
     {
      ::PrintFormat("%s: FileLoad '%s' failed. Error %lu",__FUNCTION__,filename,::GetLastError());
      return false;
     }
//--- Successful, return 'true'
   return true;
  }
//+------------------------------------------------------------------+
//| Upload the array of panel background pixels from a file          |
//+------------------------------------------------------------------+
bool CDashboard::FileLoadBackground(void)
  {
//--- Define the folder and file name
   string filename=this.m_program_name+"\\Dashboard"+(string)this.m_id+"\\background.bin";
//--- If failed to upload data from the file into the array, report this and return 'false'
   if(::FileLoad(filename,this.m_array_ppx)==WRONG_VALUE)
     {
      ::PrintFormat("%s: FileLoad '%s' failed. Error %lu",__FUNCTION__,filename,::GetLastError());
      return false;
     }
//--- Successful, return 'true'
   return true;
  }
Atualmente, o trabalho com esses métodos não está implementado, porque não havia necessidade deles antes de escrever o artigo. Em artigos futuros, nos quais a classe de painel será usada, esses métodos provavelmente já serão usados.
Indicador com painel de informações
Para testar o funcionamento do painel de informações, vamos criar um indicador simples que desenha uma média móvel comum. O painel exibirá o Bid e Ask atuais e os dados da vela sobre a qual o cursor do mouse está posicionado.
Na pasta Indicators, criamos uma nova pasta TestDashboard e, nela, criamos um novo indicador personalizado:
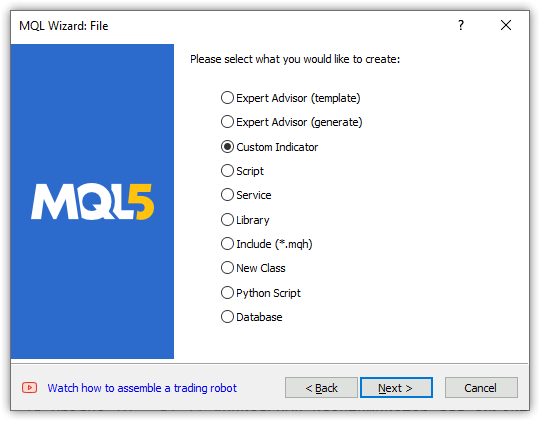
Em seguida, definimos os parâmetros:
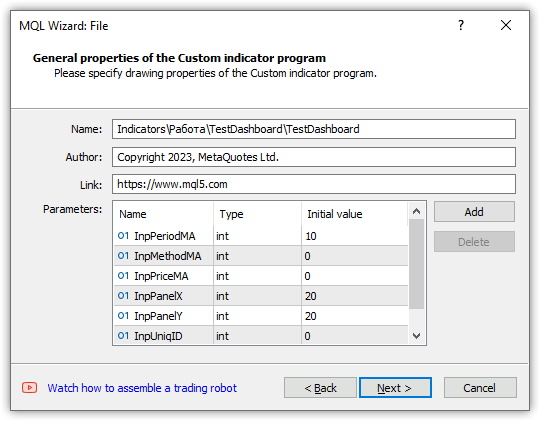
Escolhemos o primeiro tipo OnCalculate, OnChartEvent e OnTimer em caso de modificações posteriores:
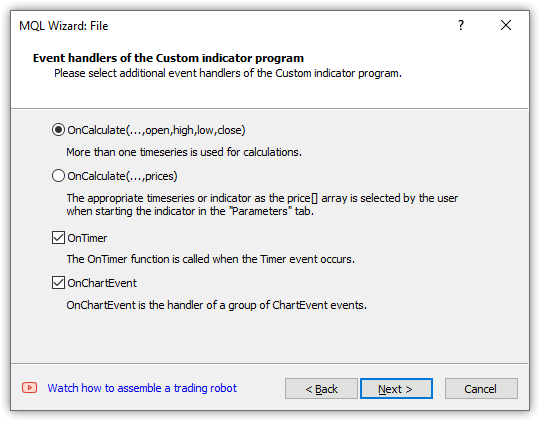
Selecionamos um buffer a ser desenhado e clicamos em "Concluído":
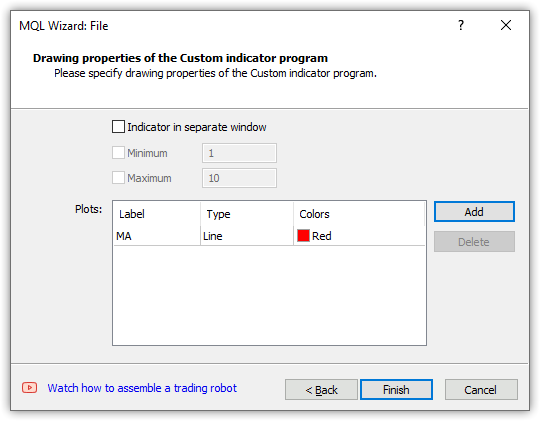
Obtemos esse modelo:
//+------------------------------------------------------------------+
//|                                                TestDashboard.mq5 |
//|                                  Copyright 2023, MetaQuotes Ltd. |
//|                                             https://www.mql5.com |
//+------------------------------------------------------------------+
#property copyright "Copyright 2023, MetaQuotes Ltd."
#property link      "https://www.mql5.com"
#property version   "1.00"
#property indicator_chart_window
#property indicator_buffers 1
#property indicator_plots   1
//--- plot MA
#property indicator_label1  "MA"
#property indicator_type1   DRAW_LINE
#property indicator_color1  clrRed
#property indicator_style1  STYLE_SOLID
#property indicator_width1  1
//--- input parameters
input int      InpPeriodMA=10;
input int      InpMethodMA=0;
input int      InpPriceMA=0;
input int      InpPanelX=20;
input int      InpPanelY=20;
input int      InpUniqID=0;
//--- indicator buffers
double         MABuffer[];
//+------------------------------------------------------------------+
//| Custom indicator initialization function                         |
//+------------------------------------------------------------------+
int OnInit()
  {
//--- indicator buffers mapping
   SetIndexBuffer(0,MABuffer,INDICATOR_DATA);

//---
   return(INIT_SUCCEEDED);
  }
//+------------------------------------------------------------------+
//| Custom indicator iteration function                              |
//+------------------------------------------------------------------+
int OnCalculate(const int rates_total,
                const int prev_calculated,
                const datetime &time[],
                const double &open[],
                const double &high[],
                const double &low[],
                const double &close[],
                const long &tick_volume[],
                const long &volume[],
                const int &spread[])
  {
//---

//--- return value of prev_calculated for the next call
   return(rates_total);
  }
//+------------------------------------------------------------------+
//| Timer function                                                   |
//+------------------------------------------------------------------+
void OnTimer()
  {
//---

  }
//+------------------------------------------------------------------+
//| ChartEvent function                                              |
//+------------------------------------------------------------------+
void OnChartEvent(const int id,
                  const long &lparam,
                  const double &dparam,
                  const string &sparam)
  {
//---

  }
//+------------------------------------------------------------------+
Na pasta do indicador criada, salvaremos o arquivo de classe de objeto do painel. Apenas para que o arquivo inlcude da classe do painel esteja localizado na mesma pasta que o indicador. Concluída a finalização da classe do painel, sua versão final pode ser colocada na pasta Include da área restrita de arquivos do terminal de negociação para ser usada em seus próprios programas.
Vamos ajustar o modelo criado para o indicador. Classe include do objeto painel, inicializados os parâmetros de entrada com valores iniciais mais claros, corrigimos o nome do buffer a ser desenhado e declaramos variáveis globais:
//+------------------------------------------------------------------+
//|                                                TestDashboard.mq5 |
//|                                  Copyright 2023, MetaQuotes Ltd. |
//|                                             https://www.mql5.com |
//+------------------------------------------------------------------+
#property copyright "Copyright 2023, MetaQuotes Ltd."
#property link      "https://www.mql5.com"
#property version   "1.00"
#property indicator_chart_window
#property indicator_buffers 1
#property indicator_plots   1
//--- plot MA
#property indicator_label1  "MA"
#property indicator_type1   DRAW_LINE
#property indicator_color1  clrRed
#property indicator_style1  STYLE_SOLID
#property indicator_width1  1
//--- includes
#include "Dashboard.mqh"
//--- input variables
input int                  InpPeriodMA =  10;            /* MA Period   */ // Moving average calculation period
input ENUM_MA_METHOD       InpMethodMA =  MODE_SMA;      /* MA Method   */ // Moving average calculation method
input ENUM_APPLIED_PRICE   InpPriceMA  =  PRICE_CLOSE;   /* MA Price    */ // Moving average calculation price
input int                  InpPanelX   =  20;            /* Dashboard X */ // Panel X coordinate
input int                  InpPanelY   =  20;            /* Dashboard Y */ // Panel Y coordinate
input int                  InpUniqID   =  0;             /* Unique ID   */ // Unique ID for the panel object
//--- indicator buffers
double         BufferMA[];
//--- global variables
CDashboard    *dashboard=NULL;
int            handle_ma;        // Moving Average indicator handle
int            period_ma;        // Moving Average calculation period
int            mouse_bar_index;  // Index of the bar the data is taken from
string         plot_label;       // Name of the graphical indicator series displayed in DataWindow
//+------------------------------------------------------------------+
//| Custom indicator initialization function                         |
//+------------------------------------------------------------------+
int OnInit()
  {
Criamos o identificador do indicador padrão Moving Average no manipulador OnInit(), definimos os parâmetros do indicador e o buffer a ser desenhado. Como o cálculo do indicador é realizado desde o início do histórico até os dados atuais, definiremos a indexação do buffer do indicador como em uma série temporal. O objeto do painel de informações também será criado nesse mesmo manipulador. Imediatamente após a criação do objeto, vamos exibi-lo e desenhar a grade da tabela. Após isso, os dados da tabela serão registrados no log:
//+------------------------------------------------------------------+
//| Custom indicator initialization function                         |
//+------------------------------------------------------------------+
int OnInit()
  {
//--- indicator buffers mapping
   SetIndexBuffer(0,BufferMA,INDICATOR_DATA);

//--- Create indicator handle
   period_ma=(InpPeriodMA<1 ? 1 : InpPeriodMA);
   ResetLastError();
   handle_ma=iMA(Symbol(),PERIOD_CURRENT,period_ma,0,InpMethodMA,InpPriceMA);
   if(handle_ma==INVALID_HANDLE)
     {
      PrintFormat("%s Failed to create MA indicator handle. Error %lu",__FUNCTION__,GetLastError());
      return INIT_FAILED;
     }
//--- Set the indicator parameters
   IndicatorSetInteger(INDICATOR_DIGITS,Digits());
   IndicatorSetString(INDICATOR_SHORTNAME,"Test Dashboard");
//--- Set the parameters of the buffer being drawn
   plot_label="MA("+(string)period_ma+","+StringSubstr(EnumToString(Period()),7)+")";
   PlotIndexSetString(0,PLOT_LABEL,plot_label);
   ArraySetAsSeries(BufferMA,true);

//--- Create the panel object
   dashboard=new CDashboard(InpUniqID,InpPanelX,InpPanelY,200,250);
   if(dashboard==NULL)
     {
      Print("Error. Failed to create dashboard object");
      return INIT_FAILED;
     }
//--- Display the panel with the "Symbol, Timeframe description" header text
   dashboard.View(Symbol()+", "+StringSubstr(EnumToString(Period()),7));
//--- Draw the name plate on the panel background
   dashboard.DrawGridAutoFill(2,12,2);
   //dashboard.DrawGrid(2,1,12,2,19,97);
//--- Display tabular data in the journal
   dashboard.GridPrint(2);
//--- Initialize the variable with the index of the mouse cursor bar
   mouse_bar_index=0;
//--- Successful initialization
   return(INIT_SUCCEEDED);
  }
Toda a lógica é comentada no código. A tabela é criada com o cálculo automático do tamanho de linhas e colunas. A criação de uma tabela simples está comentada no código. É possível trocar — comentar a tabela automática e descomentar a simples e recompilar o indicador. A diferença será muito pequena com esses parâmetros de tabela.
No manipulador OnDeinit(), removeremos o painel, liberaremos o handle do indicador e apagaremos os comentários no gráfico:
//+------------------------------------------------------------------+
//| Custom indicator deinitialization function                       |
//+------------------------------------------------------------------+
void OnDeinit(const int reason)
  {
//--- If the panel object exists, delete it
   if(dashboard!=NULL)
      delete dashboard;
//--- Release the handle of the MA indicator
   ResetLastError();
   if(!IndicatorRelease(handle_ma))
      PrintFormat("%s: IndicatorRelease failed. Error %ld",__FUNCTION__,GetLastError());
//--- Delete all comments
   Comment("");
  }
No manipulador OnCalculate(), faremos com que todos os arrays de séries temporais predefinidos tenham indexação como a de uma série temporal, para que coincidam com a indexação do buffer desenhado. Tudo o mais está comentado no código do manipulador:
//+------------------------------------------------------------------+
//| Custom indicator iteration function                              |
//+------------------------------------------------------------------+
int OnCalculate(const int rates_total,
                const int prev_calculated,
                const datetime &time[],
                const double &open[],
                const double &high[],
                const double &low[],
                const double &close[],
                const long &tick_volume[],
                const long &volume[],
                const int &spread[])
  {
//--- Set indexing for the arrays as in a timeseries
   ArraySetAsSeries(time,true);
   ArraySetAsSeries(open,true);
   ArraySetAsSeries(high,true);
   ArraySetAsSeries(low,true);
   ArraySetAsSeries(close,true);
   ArraySetAsSeries(tick_volume,true);
   ArraySetAsSeries(volume,true);
   ArraySetAsSeries(spread,true);

//--- Check for the minimum number of bars for calculation
   if(rates_total<period_ma) return 0;

//--- Check and calculate the number of calculated bars
   int limit=rates_total-prev_calculated;
//--- If 'limit' is 0, then only the current bar is calculated
//--- If 'limit' is 1 (opening a new bar), then two bars are calculated - the current newly opened one and the previous one
//--- If 'limit' is more than 1, then this is either the first launch of the indicator, or some changes in history - the indicator is completely recalculated
   if(limit>1)
     {
      limit=rates_total-period_ma-1;
      ArrayInitialize(BufferMA,EMPTY_VALUE);
     }

//--- Calculate the amount of data copied from the indicator handle to the drawing buffer
   int count=(limit>1 ? rates_total : 1),copied=0;
//--- Prepare data (receive data to the moving average buffer by handle)
   copied=CopyBuffer(handle_ma,0,0,count,BufferMA);
   if(copied!=count) return 0;

//--- Loop of indicator calculation based on the moving average data
   for(int i=limit; i>=0 && !IsStopped(); i--)
     {
      // Here we calculate a certain indicator based on the standard Moving Average data
     }

//--- Receive price and timeseries data and display it on the panel
//--- At the first launch, we display the data of the current bar on the panel
   static bool first=true;
   if(first)
     {
      DrawData(0,TimeCurrent());
      first=false;
     }

//--- Declare the price structure and get the current prices
   MqlTick  tick={0};
   if(!SymbolInfoTick(Symbol(),tick))
      return 0;

//--- If the cursor is on the current bar, display the data of the current bar on the panel
   if(mouse_bar_index==0)
      DrawData(0,time[0]);
//--- Otherwise, display only the Bid and Ask prices on the panel (we update the prices on the panel at each tick)
   else
     {
      dashboard.DrawText("Bid",dashboard.CellX(0,0)+2,dashboard.CellY(0,0)+2); dashboard.DrawText(DoubleToString(tick.bid,Digits()),dashboard.CellX(0,1)+2,dashboard.CellY(0,1)+2,90);
      dashboard.DrawText("Ask",dashboard.CellX(1,0)+2,dashboard.CellY(1,0)+2); dashboard.DrawText(DoubleToString(tick.ask,Digits()),dashboard.CellX(1,1)+2,dashboard.CellY(1,1)+2,90);
     }

//--- return value of prev_calculated for the next call
   return(rates_total);
  }
No manipulador OnChartEvent() do indicador, primeiro chamamos o manipulador OnChartEvent do painel, depois tratamos os eventos necessários:
//+------------------------------------------------------------------+
//| ChartEvent function                                              |
//+------------------------------------------------------------------+
void OnChartEvent(const int id,
                  const long &lparam,
                  const double &dparam,
                  const string &sparam)
  {
//--- Call the panel event handler
   dashboard.OnChartEvent(id,lparam,dparam,sparam);

//--- If the cursor moves or a click is made on the chart
   if(id==CHARTEVENT_MOUSE_MOVE || id==CHARTEVENT_CLICK)
     {
      //--- Declare the variables to record time and price coordinates in them
      datetime time=0;
      double price=0;
      int wnd=0;
      //--- If the cursor coordinates are converted to date and time
      if(ChartXYToTimePrice(ChartID(),(int)lparam,(int)dparam,wnd,time,price))
        {
         //--- write the bar index where the cursor is located to a global variable
         mouse_bar_index=iBarShift(Symbol(),PERIOD_CURRENT,time);
         //--- Display the bar data under the cursor on the panel
         DrawData(mouse_bar_index,time);
        }
     }

//--- If we received a custom event, display the appropriate message in the journal
   if(id>CHARTEVENT_CUSTOM)
     {
      //--- Here we can implement handling a click on the close button on the panel
      PrintFormat("%s: Event id=%ld, object id (lparam): %lu, event message (sparam): %s",__FUNCTION__,id,lparam,sparam);
     }
  }
Aqui, ao receber do painel o evento de clique no botão de fechamento, e se necessário reagir a tal evento, deve-se escrever seu tratamento. A decisão sobre o comportamento do programa para esse evento fica a cargo do desenvolvedor do programa.
Função que exibe os dados dos preços atuais e da barra por índice:
//+------------------------------------------------------------------+
//| Display data from the specified timeseries index to the panel    |
//+------------------------------------------------------------------+
void DrawData(const int index,const datetime time)
  {
//--- Declare the variables to receive data in them
   MqlTick  tick={0};
   MqlRates rates[1];
//--- Exit if unable to get the current prices
   if(!SymbolInfoTick(Symbol(),tick))
      return;
//--- Exit if unable to get the bar data by the specified index
   if(CopyRates(Symbol(),PERIOD_CURRENT,index,1,rates)!=1)
      return;
//--- Display the current prices and data of the specified bar on the panel
   dashboard.DrawText("Bid",        dashboard.CellX(0,0)+2,   dashboard.CellY(0,0)+2);  dashboard.DrawText(DoubleToString(tick.bid,Digits()),       dashboard.CellX(0,1)+2,   dashboard.CellY(0,1)+2,90);
   dashboard.DrawText("Ask",        dashboard.CellX(1,0)+2,   dashboard.CellY(1,0)+2);  dashboard.DrawText(DoubleToString(tick.ask,Digits()),       dashboard.CellX(1,1)+2,   dashboard.CellY(1,1)+2,90);
   dashboard.DrawText("Date",       dashboard.CellX(2,0)+2,   dashboard.CellY(2,0)+2);  dashboard.DrawText(TimeToString(rates[0].time,TIME_DATE),   dashboard.CellX(2,1)+2,   dashboard.CellY(2,1)+2,90);
   dashboard.DrawText("Time",       dashboard.CellX(3,0)+2,   dashboard.CellY(3,0)+2);  dashboard.DrawText(TimeToString(rates[0].time,TIME_MINUTES),dashboard.CellX(3,1)+2,   dashboard.CellY(3,1)+2,90);

   dashboard.DrawText("Open",       dashboard.CellX(4,0)+2,   dashboard.CellY(4,0)+2);  dashboard.DrawText(DoubleToString(rates[0].open,Digits()),  dashboard.CellX(4,1)+2,   dashboard.CellY(4,1)+2,90);
   dashboard.DrawText("High",       dashboard.CellX(5,0)+2,   dashboard.CellY(5,0)+2);  dashboard.DrawText(DoubleToString(rates[0].high,Digits()),  dashboard.CellX(5,1)+2,   dashboard.CellY(5,1)+2,90);
   dashboard.DrawText("Low",        dashboard.CellX(6,0)+2,   dashboard.CellY(6,0)+2);  dashboard.DrawText(DoubleToString(rates[0].low,Digits()),   dashboard.CellX(6,1)+2,   dashboard.CellY(6,1)+2,90);
   dashboard.DrawText("Close",      dashboard.CellX(7,0)+2,   dashboard.CellY(7,0)+2);  dashboard.DrawText(DoubleToString(rates[0].close,Digits()), dashboard.CellX(7,1)+2,   dashboard.CellY(7,1)+2,90);

   dashboard.DrawText("Volume",     dashboard.CellX(8,0)+2,   dashboard.CellY(8,0)+2);  dashboard.DrawText((string)rates[0].real_volume,            dashboard.CellX(8,1)+2,   dashboard.CellY(8,1)+2,90);
   dashboard.DrawText("Tick Volume",dashboard.CellX(9,0)+2,   dashboard.CellY(9,0)+2);  dashboard.DrawText((string)rates[0].tick_volume,            dashboard.CellX(9,1)+2,   dashboard.CellY(9,1)+2,90);
   dashboard.DrawText("Spread",     dashboard.CellX(10,0)+2,  dashboard.CellY(10,0)+2); dashboard.DrawText((string)rates[0].spread,                 dashboard.CellX(10,1)+2,  dashboard.CellY(10,1)+2,90);
   dashboard.DrawText(plot_label,   dashboard.CellX(11,0)+2,  dashboard.CellY(11,0)+2); dashboard.DrawText(DoubleToString(BufferMA[index],Digits()),dashboard.CellX(11,1)+2,  dashboard.CellY(11,1)+2,90);
//--- Redraw the chart to immediately display all changes on the panel
   ChartRedraw(ChartID());
  }
Se prestarmos atenção ao método DrawText da classe do painel,
void CDashboard::DrawText(const string text,const int x,const int y,const int width=WRONG_VALUE,const int height=WRONG_VALUE)
vemos que após o texto, as coordenadas X e Y são passadas para o método. É desses dados tabulares que obtemos, especificando a localização da célula da tabela pelo seu número de linha e coluna.
Por exemplo, os preços Bid e Ask são exibidos no painel pelo "endereço" das células da tabela para Bid 0,0 (texto 'Bid') e 0,1 (valor do preço Bid):
dashboard.DrawText("Bid", dashboard.CellX(0,0)+2, dashboard.CellY(0,0)+2); dashboard.DrawText(DoubleToString(tick.bid,Digits()), dashboard.CellX(0,1)+2, dashboard.CellY(0,1)+2,90);
Aqui, são tomados os valores das células
para o texto "Bid":
- CellX(0,0) — célula na linha zero e coluna zero — valor da coordenada X,
- CellY(0,0) — célula na linha zero e coluna zero — valor da coordenada Y.
para o valor do preço Bid:
- CellX(0,1) — célula na linha zero e primeira coluna — valor da coordenada X,
- CellY(0,1) — célula na linha zero e primeira coluna — valor da coordenada Y.
O valor de 90 para a largura do texto exibido na segunda célula — é justamente o caso em que o texto atual pode ser menos largo que o anterior, consequentemente, o texto anterior não será completamente apagado, e dois textos se sobreporão. Por isso, aqui nós especificamos explicitamente a largura da inscrição exibida, o que garantidamente apagará o texto desenhado anteriormente, mas não apagará os dados adjacentes, pois o campo da tabela, onde o texto é escrito, é mais largo que 90 pixels.
Assim, para cada célula da tabela, podemos obter suas coordenadas no painel e exibir o texto nelas. Como as coordenadas são indicadas para os pontos de interseção das linhas da grade da tabela, para alinhar o texto dentro das células da tabela, dois pixels são adicionados às coordenadas em X e Y.
Após a compilação do indicador e seu lançamento no gráfico, os dados da tabela criada e desenhada no painel serão exibidos no log:
Table: Rows: 12, Columns: 2
  Row   0    Column   0      Cell X:  2      Cell Y:  2
  Row   0    Column   1      Cell X:  100    Cell Y:  2
  Row   1    Column   0      Cell X:  2      Cell Y:  21
  Row   1    Column   1      Cell X:  100    Cell Y:  21
  Row   2    Column   0      Cell X:  2      Cell Y:  40
  Row   2    Column   1      Cell X:  100    Cell Y:  40
  Row   3    Column   0      Cell X:  2      Cell Y:  59
  Row   3    Column   1      Cell X:  100    Cell Y:  59
  Row   4    Column   0      Cell X:  2      Cell Y:  78
  Row   4    Column   1      Cell X:  100    Cell Y:  78
  Row   5    Column   0      Cell X:  2      Cell Y:  97
  Row   5    Column   1      Cell X:  100    Cell Y:  97
  Row   6    Column   0      Cell X:  2      Cell Y:  116
  Row   6    Column   1      Cell X:  100    Cell Y:  116
  Row   7    Column   0      Cell X:  2      Cell Y:  135
  Row   7    Column   1      Cell X:  100    Cell Y:  135
  Row   8    Column   0      Cell X:  2      Cell Y:  154
  Row   8    Column   1      Cell X:  100    Cell Y:  154
  Row   9    Column   0      Cell X:  2      Cell Y:  173
  Row   9    Column   1      Cell X:  100    Cell Y:  173
  Row   10   Column   0      Cell X:  2      Cell Y:  192
  Row   10   Column   1      Cell X:  100    Cell Y:  192
  Row   11   Column   0      Cell X:  2      Cell Y:  211
  Row   11   Column   1      Cell X:  100    Cell Y:  211
Se lançar dois indicadores com painel no mesmo gráfico, especificando diferentes valores do identificador único do painel, eles funcionarão independentemente um do outro:
Aqui, vemos que, embora os painéis funcionem separadamente — cada indicador tem o seu —, eles têm um conflito: ao mover os painéis, o gráfico também tenta se mover. Isso acontece porque um painel, ao ser movido, desativa o movimento do gráfico, enquanto o outro, ao ver que o cursor está fora de seus limites, ativa o movimento.
Para se livrar desse comportamento, a coisa mais simples a fazer é configurar um semáforo nas variáveis globais do terminal, onde será registrado o identificador do painel ativo. Os outros, ao verem que não é o seu identificador registrado, não tentarão controlar o gráfico.
Se o indicador for lançado no modo visual do testador e tentar mover o painel, ele poderá ser movido pela tela com algum esforço. Além disso, o que é bastante útil, dados podem ser obtidos dos barras do gráfico testado — ao clicar em uma barra, seus dados serão exibidos no painel. Também, o botão direito do mouse (sua retenção e movimento sobre o gráfico) ajuda a indicar ao painel onde o cursor está atualmente e a exibir dados, ou a capturar o painel pela área do título e movê-lo para o local desejado. Infelizmente, no modo visual do testador, devido à implementação incompleta do trabalho com eventos, é necessário recorrer a tais artifícios.
Considerações finais
Hoje, criamos um pequeno painel que pode se tornar um assistente no desenvolvimento de suas estratégias de indicadores, e nos próximos artigos, examinaremos como integrar indicadores padrão e trabalhar com seus dados em EAs.
Traduzido do russo pela MetaQuotes Ltd.
Artigo original: https://www.mql5.com/ru/articles/13179
Aviso: Todos os direitos sobre esses materiais pertencem à MetaQuotes Ltd. É proibida a reimpressão total ou parcial.
Esse artigo foi escrito por um usuário do site e reflete seu ponto de vista pessoal. A MetaQuotes Ltd. não se responsabiliza pela precisão das informações apresentadas nem pelas possíveis consequências decorrentes do uso das soluções, estratégias ou recomendações descritas.

- Aplicativos de negociação gratuitos
- 8 000+ sinais para cópia
- Notícias econômicas para análise dos mercados financeiros
Você concorda com a política do site e com os termos de uso
Artem, tenho uma pergunta. No método void CDashboard::Move(int x, int y), existe uma coisa dessas:
Em particular, estou interessado nesse bloco. Ou seja, se a altura do painel for menor que a da janela do gráfico e se seu ponto Y (canto superior esquerdo) for menor que a diferença entre a altura da janela e a altura do painel, corrigida em 2 pixels, o ponto superior do painel receberá o valor dessa diferença. Por que isso acontece, qual é o motivo?
Em suma, é por causa do método CDashboard::Move(int x, int y) que ocorre o travamento. Quando você tenta mover o painel depois de alterar o tamanho do gráfico, ele corrige constantemente as coordenadas e não permite que você mova a janela do painel livremente...
Move(int x, int y)
Há um erro em algum lugar. Você precisa imprimir (ou procurar no depurador, mas isso geralmente não funciona) os valores de coordenadas e tamanho.
Aqui está a lógica nos comentários:
Ao tentar mover o painel depois de alterar o tamanho do gráfico, ele corrige constantemente as coordenadas e não permite que você mova a janela do painel livremente...
Provavelmente, o valor da variável this.m_higher_wnd não é relevante no método Move(). Esses valores são definidos no manipulador de eventos:
É bem possível que, em algum lugar aqui, os sinalizadores de tamanho excessivo não estejam definidos corretamente quando a janela do gráfico é expandida.
Se você escrever essas linhas
logo no início do método Move() - para forçar a definição dos valores corretos a cada movimento do mouse, o erro desaparecerá? Se isso acontecer, significa que o problema está nos valores dessas variáveis, e você precisa examinar o manipulador de eventos para ver por que elas não obtêm seus valores quando a janela é expandida. Bem, se tudo estiver normal lá, então você precisa imprimir o método Move() para encontrar o erro.
O erro desapareceu. Fiz essas alterações no método CDashboard::OnChartEvent():
Para não carregar constantemente o método CDashboard:: Move(), adicionei a verificação de sinalizadores de tamanho excessivo nos blocos em que a largura e a altura da janela do gráfico são alteradas diretamente.
O erro desapareceu. No método CDashboard::OnChartEvent(), fiz essas alterações:
Para não carregar constantemente o método CDashboard:: Move(), adicionei a verificação de sinalizadores de tamanho excessivo nos blocos em que a largura e a altura da janela do gráfico são alteradas diretamente.