
Erstellung eines Dashboards zur Anzeige von Daten in Indikatoren und EAs

Inhalt
- Einführung
- Klassen zum Erhalt der Tabellendaten
- Dashboard-Klasse
- Indikator mit Armaturenbrett
- Schlussfolgerung
Einführung
In diesem Artikel werde ich ein Dashboard erstellen, das vom Entwickler festgelegte Daten anzeigen kann. Ein solches Panel eignet sich für die visuelle Darstellung von Daten in einem Chart und für das visuelle Debugging, da es bequemer ist, die erforderlichen Werte auf dem Panel zu sehen als sie im Debugger zu verfolgen. Ich meine Fälle, in denen die Strategie in Abhängigkeit von einigen Datenwerten debuggt wird.
Ich werde das Panel in Form eines Prototyps des Terminal-Datenfensters erstellen und es mit denselben Daten füllen:
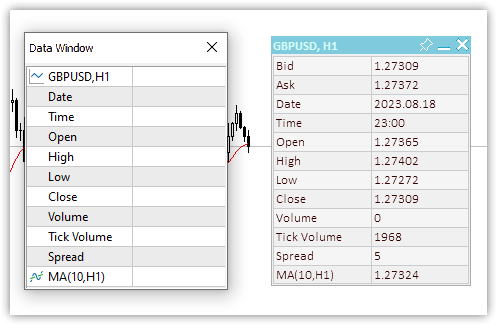
Abb. 1. Datenfenster und Dashboard
Mit unserem nutzerdefinierten Panel können wir jede beliebige Menge der erforderlichen Daten hinzufügen, es signieren und die Messwerte über den Programmcode anzeigen und aktualisieren.
Es sollte möglich sein, das Panel mit der Maus auf dem Chart zu verschieben, es an der gewünschten Position anzudocken und es zu komprimieren/erweitern. Um die Daten bequem auf der Tafel zu platzieren, kann eine Tabelle mit der angegebenen Anzahl von Zeilen und Spalten angezeigt werden. Die Daten dieser Tabelle können im Journal angezeigt werden (X- und Y-Koordinaten jeder Tabellenzelle) und programmatisch abgerufen werden, um den Index der Zeile und der Spalte anzugeben, in der sich diese Daten befinden sollen, oder man kann die Koordinaten einfach ausdrucken und die gewünschten Koordinaten in den Code eingeben, direkt bei der Anzeige von Text und Daten. Die erste Methode ist bequemer, da sie vollständig automatisiert ist. Das Panel wird auch eine aktive Schließtaste haben, aber wir delegieren deren Handhabung an das Steuerprogramm, da nur der Programmentwickler entscheiden sollte, wie er auf das Drücken der Schließtaste reagiert. Wenn eine Schaltfläche angeklickt wird, wird ein nutzerdefiniertes Ereignis an die Ereignisbehandlung des Programms gesendet. Der Entwickler kann sie nach eigenem Ermessen bearbeiten.
Klassen zum Erhalt der Tabellendaten
Da es zweckmäßig ist, die Daten auf der Tafel nach einigen visuell oder virtuell vorgegebenen Koordinaten anzuordnen, werden wir zunächst Klassen für die Anordnung von Tabellendaten erstellen. Die Tabelle kann als einfaches Gitter dargestellt werden, dessen Linienschnittpunkte die Koordinaten der Tabellenzellen sind. Es wird möglich sein, beliebige visuelle Daten an diesen Koordinaten zu platzieren. Die Tabelle hat eine bestimmte Anzahl von Zeilen (horizontale Linien) und jede Zeile hat eine bestimmte Anzahl von Zellen (vertikale Linien). In einer einfachen Gittertabelle haben alle Zeilen die gleiche Anzahl von Zellen.
Auf dieser Grundlage benötigen wir drei Klassen:
- Klasse der Tabellenzellen,
- Klasse der Tabellenzeile,
- Tabellenklasse.
Die Klasse der Tabellenzelle enthält den Zeilen- und Spaltenindex in der Tabelle und die Koordinaten der visuellen Position der Tabellenzelle im Panel - die X- und Y-Koordinaten relativ zum Tabellenursprung in der oberen linken Ecke des Panels.
Die Tabellenzeilenklasse umfasst die Tabellenzellenklasse. Wir können die erforderliche Anzahl von Zellen in einer Zeile erstellen.
Die Tabellenklasse enthält eine Liste von Tabellenzeilen. Die Zeilen in der Tabelle können in der gewünschten Anzahl erstellt und hinzugefügt werden.
Werfen wir einen kurzen Blick auf alle drei Klassen.
Klasse der Tabellenzelle
//+------------------------------------------------------------------+
//| Table cell class                                                 |
//+------------------------------------------------------------------+
class CTableCell : public CObject
  {
private:
   int               m_row;                     // Row
   int               m_col;                     // Column
   int               m_x;                       // X coordinate
   int               m_y;                       // Y coordinate
public:
//--- Methods of setting values
   void              SetRow(const uint row)     { this.m_row=(int)row;  }
   void              SetColumn(const uint col)  { this.m_col=(int)col;  }
   void              SetX(const uint x)         { this.m_x=(int)x;      }
   void              SetY(const uint y)         { this.m_y=(int)y;      }
   void              SetXY(const uint x,const uint y)
                       {
                        this.m_x=(int)x;
                        this.m_y=(int)y;
                       }
//--- Methods of obtaining values
   int               Row(void)            const { return this.m_row;    }
   int               Column(void)         const { return this.m_col;    }
   int               X(void)              const { return this.m_x;      }
   int               Y(void)              const { return this.m_y;      }
//--- Virtual method for comparing two objects
   virtual int       Compare(const CObject *node,const int mode=0) const
                       {
                        const CTableCell *compared=node;
                        return(this.Column()>compared.Column() ? 1 : this.Column()<compared.Column() ? -1 : 0);
                       }
//--- Constructor/destructor
                     CTableCell(const int row,const int column) : m_row(row),m_col(column){}
                    ~CTableCell(void){}
  };
Die Klasse wird von der Basisklasse für den Aufbau der MQL5-Standardbibliothek geerbt, da sie in CArrayObj-Listen der MQL5-Standardbibliothek passt. Die Listen können nur CObject-Objekte oder vom Basis-CObject geerbte Objekte enthalten.
Die Funktion aller Variablen und Methoden ist sehr transparent und leicht verständlich. Die Variablen werden verwendet, um die Werte einer Tabellenzeile (Row) und -spalte (Column) zu speichern, während die Koordinaten die relativen Koordinaten der oberen linken Ecke der Tabellenzelle im Panel sind. Anhand dieser Koordinaten können Sie etwas zeichnen oder auf der Tafel platzieren.
Die virtuelle Methode Compare wird benötigt, um zwei Tabellenzellenobjekte zu finden und zu vergleichen. Die Methode wird in der Basisklasse CObject deklariert:
   //--- method of comparing the objects
   virtual int       Compare(const CObject *node,const int mode=0) const { return(0);      }
Sie gibt Null zurück und sollte in abgeleiteten Klassen überschrieben werden.
Da Tabellenzellen an die Tabellenzeile angehängt werden, d.h. visuell horizontal, sollte die Suche und der Vergleich nach horizontalen Zellennummern erfolgen - nach dem Spaltenwert. Dies ist genau das, was die überschriebene virtuelle Vergleichsmethode hier tut:
//--- Virtual method for comparing two objects
   virtual int       Compare(const CObject *node,const int mode=0) const
                       {
                        const CTableCell *compared=node;
                        return(this.Column()>compared.Column() ? 1 : this.Column()<compared.Column() ? -1 : 0);
                       }
Wenn der Spaltenwert des aktuellen Objekts größer ist als der des zu vergleichenden Objekts (dessen Zeiger an die Methode übergeben wird), wird 1 zurückgegeben. Ist der Spaltenwert kleiner als der der zu vergleichenden Spalte, so wird -1 zurückgegeben. Andernfalls wird true zurückgegeben. Der von der Methode zurückgegebene Wert Null bedeutet also, dass die Werte der zu vergleichenden Objekte gleich sind.
Klasse der Tabellenzeile
Die Zellenobjekte werden der Tabellenzeile hinzugefügt. Wenn die Zellen in einer Zeile horizontal nebeneinander liegen, sind die Zeilen in der Tabelle vertikal untereinander angeordnet.
In diesem Fall müssen wir nur den Zeilenindex und die Y-Koordinate auf der Tafel kennen:
//+------------------------------------------------------------------+
//| Table row class                                                  |
//+------------------------------------------------------------------+
class CTableRow : public CObject
  {
private:
  CArrayObj          m_list_cell;               // Cell list
  int                m_row;                     // Row index
  int                m_y;                       // Y coordinate
public:
//--- Return the list of table cells in a row
   CArrayObj        *GetListCell(void)       { return &this.m_list_cell;         }
//--- Return (1) the number of table cells in a row (2) the row index in the table
   int               CellsTotal(void)  const { return this.m_list_cell.Total();  }
   int               Row(void)         const { return this.m_row;                }
//--- (1) Set and (2) return the Y row coordinate
   void              SetY(const int y)       { this.m_y=y;                       }
   int               Y(void)           const { return this.m_y;                  }
//--- Add a new table cell to the row
   bool              AddCell(CTableCell *cell)
                       {
                        this.m_list_cell.Sort();
                        if(this.m_list_cell.Search(cell)!=WRONG_VALUE)
                          {
                           ::PrintFormat("%s: Table cell with index %lu is already in the list",__FUNCTION__,cell.Column());
                           return false;
                          }
                        if(!this.m_list_cell.InsertSort(cell))
                          {
                           ::PrintFormat("%s: Failed to add table cell with index %lu to list",__FUNCTION__,cell.Column());
                           return false;
                          }
                        return true;
                       }
//--- Return the pointer to the specified cell in the row
   CTableCell       *GetCell(const int column)
                       {
                        const CTableCell *obj=new CTableCell(this.m_row,column);
                        int index=this.m_list_cell.Search(obj);
                        delete obj;
                        return this.m_list_cell.At(index);
                       }
//--- Virtual method for comparing two objects
   virtual int       Compare(const CObject *node,const int mode=0) const
                       {
                        const CTableRow *compared=node;
                        return(this.Row()>compared.Row() ? 1 : this.Row()<compared.Row() ? -1 : 0);
                       }
//--- Constructor/destructor
                     CTableRow(const int row) : m_row(row)  { this.m_list_cell.Clear();   }
                    ~CTableRow(void)                        { this.m_list_cell.Clear();   }
  };
Die CArrayObj-Liste, die neu hinzugefügte Zellenobjekte enthält, wird in der Klasse deklariert.
In der virtuellen Methode Compare werden die Objekte anhand des Zeilenindexwerts (Row) verglichen, da wir beim Hinzufügen einer neuen Zeile nur nach dem Zeilenindex suchen müssen. Wenn keine Zeile mit einem solchen Index gefunden wird, gibt die Suchmethode(Search) -1 zurück, andernfalls gibt die Suche den Index der Position des gefundenen Objekts in der Liste zurück. Die Methode Search wird in der Klasse CArrayObj deklariert und implementiert:
//+------------------------------------------------------------------+
//| Search of position of element in a sorted array                  |
//+------------------------------------------------------------------+
int CArrayObj::Search(const CObject *element) const
  {
   int pos;
//--- check
   if(m_data_total==0 || !CheckPointer(element) || m_sort_mode==-1)
      return(-1);
//--- search
   pos=QuickSearch(element);
   if(m_data[pos].Compare(element,m_sort_mode)==0)
      return(pos);
//--- not found
   return(-1);
  }
Wie wir sehen können, wird die virtuelle Compare-Methode zum Vergleich zweier Objekte verwendet, um die Gleichheit der Objekte festzustellen.
Die Methode, die eine neue Zelle zur Liste hinzufügt:
//--- Add a new table cell to the row
   bool              AddCell(CTableCell *cell)
                       {
                        this.m_list_cell.Sort();
                        if(this.m_list_cell.Search(cell)!=WRONG_VALUE)
                          {
                           ::PrintFormat("%s: Table cell with index %lu is already in the list",__FUNCTION__,cell.Column());
                           return false;
                          }
                        if(!this.m_list_cell.InsertSort(cell))
                          {
                           ::PrintFormat("%s: Failed to add table cell with index %lu to list",__FUNCTION__,cell.Column());
                           return false;
                          }
                        return true;
                       }
Da die Zellen in der Liste strikt nach Spaltennummern (Column) geordnet sind und wir sie in Sortierreihenfolge hinzufügen, sollte in der Liste zuerst das Flag für sortierte Liste gesetzt werden. Wenn die Suche nicht -1 ergibt, ist ein solches Objekt bereits in der Liste vorhanden. Die entsprechende Meldung wird an das Protokoll gesendet, und false wird zurückgegeben. Wenn es nicht gelungen ist, den Objektzeiger zur Liste hinzuzufügen, wird dies ebenfalls gemeldet und false zurückgegeben. Wenn alles in Ordnung ist, wird true zurückgegeben.
Die Methode, die den Zeiger auf die angegebene Zelle in der Zeile zurückgibt:
//--- Return the pointer to the specified cell in the row
   CTableCell       *GetCell(const int column)
                       {
                        const CTableCell *obj=new CTableCell(this.m_row,column);
                        int index=this.m_list_cell.Search(obj);
                        delete obj;
                        return this.m_list_cell.At(index);
                       }
Die Methode Search der Klasse CArrayObj der Standardbibliothek sucht in der Liste nach Gleichheit auf der Grundlage der Instanz des Objekts, dessen Zeiger an die Methode übergeben wird. Daher erstellen wir hier ein neues temporäres Objekt unter Angabe der Spaltennummer, die der Methode in ihrem Konstruktor übergeben wird, und erhalten den Objektindex in der Liste oder -1, wenn kein Objekt mit solchen Parametern in der Liste gefunden wird. Außerdem stellen wir sicher, dass wir ein temporäres Objekt löschen und den Zeiger auf das gefundene Objekt in der Liste zurückgeben.
Wenn das Objekt nicht gefunden wird und der Index gleich -1 ist, gibt die Methode At der Klasse CArrayObj NULL zurück.
Tabelle Klasse
Die Tabelle besteht aus einer Liste von Zeilen, die ihrerseits aus Zelllisten bestehen. Mit anderen Worten, die Tabellendatenklasse enthält nur das Objekt CArrayObj, in das die zu erstellenden Zeilen sowie die Methoden zum Hinzufügen und Empfangen von Tabellenzeilen und Zellen eingefügt werden:
//+------------------------------------------------------------------+
//| Table data class                                                 |
//+------------------------------------------------------------------+
class CTableData : public CObject
  {
private:
   CArrayObj         m_list_rows;               // List of rows
public:
//--- Return the list of table rows
   CArrayObj        *GetListRows(void)       { return &this.m_list_rows;   }
//--- Add a new row to the table
   bool              AddRow(CTableRow *row)
                       {
                        //--- Set the sorted list flag
                        this.m_list_rows.Sort();
                        //--- If such an object is already in the list (the search returns the object index, not -1),
                        //--- inform of that in the journal and return 'false'
                        if(this.m_list_rows.Search(row)!=WRONG_VALUE)
                          {
                           ::PrintFormat("%s: Table row with index %lu is already in the list",__FUNCTION__,row.Row());
                           return false;
                          }
                        //--- If failed to add the pointer to the sorted list, inform of that and return 'false'
                        if(!this.m_list_rows.InsertSort(row))
                          {
                           ::PrintFormat("%s: Failed to add table cell with index %lu to list",__FUNCTION__,row.Row());
                           return false;
                          }
                        //--- Successful - return 'true'
                        return true;
                       }
//--- Return the pointer to the (1) specified row and (2) specified cell in the specified table row
   CTableRow        *GetRow(const int index) { return this.m_list_rows.At(index);   }
   CTableCell       *GetCell(const int row,const int column)
                       {
                        //--- Get a pointer to a string object in a list of strings
                        CTableRow *row_obj=this.GetRow(row);
                        //--- If failed to get the object, return NULL
                        if(row_obj==NULL)
                           .return NULL;
                        //--- Get the pointer to the cell object in the row by a column number and
                        CTableCell *cell=row_obj.GetCell(column);
                        //--- return the result (object pointer or NULL)
                        return cell;
                       }
//--- Write the X and Y coordinates of the specified table cell into the variables passed to the method
   void              CellXY(const uint row,const uint column, int &x, int &y)
                       {
                        x=WRONG_VALUE;
                        y=WRONG_VALUE;
                        CTableCell *cell=this.GetCell(row,column);
                        if(cell==NULL)
                           return;
                        x=cell.X();
                        y=cell.Y();
                       }
//--- Return the X coordinate of the specified table cell
   int               CellX(const uint row,const uint column)
                       {
                        CTableCell *cell=this.GetCell(row,column);
                        return(cell!=NULL ? cell.X() : WRONG_VALUE);
                       }
//--- Return the Y coordinate of the specified table cell
   int               CellY(const uint row,const uint column)
                       {
                        CTableCell *cell=this.GetCell(row,column);
                        return(cell!=NULL ? cell.Y() : WRONG_VALUE);
                       }
//--- Return the number of table (1) rows and (2) columns
   int               RowsTotal(void)            { return this.m_list_rows.Total();  }
   int               ColumnsTotal(void)
                       {
                        //--- If there is no row in the list, return 0
                        if(this.RowsTotal()==0)
                           return 0;
                        //--- Get a pointer to the first row and return the number of cells in it
                        CTableRow *row=this.GetRow(0);
                        return(row!=NULL ? row.CellsTotal() : 0);
                       }
//--- Return the total number of cells in the table
   int               CellsTotal(void){ return this.RowsTotal()*this.ColumnsTotal(); }
//--- Clear lists of rows and table cells
   void              Clear(void)
                       {
                        //--- In the loop by the number of rows in the list of table rows,
                        for(int i=0;i<this.m_list_rows.Total();i++)
                          {
                           //--- get the pointer to the next row
                           CTableRow *row=this.m_list_rows.At(i);
                           if(row==NULL)
                              continue;
                           //--- get cell list from the obtained row object,
                           CArrayObj *list_cell=row.GetListCell();
                           //--- clear cell list
                           if(list_cell!=NULL)
                              list_cell.Clear();
                          }
                        //--- Clear cell list
                        this.m_list_rows.Clear();
                       }
//--- Print the table cell data in the journal
   void              Print(const uint indent=0)
                       {
                        //--- Print the header in the journal
                        ::PrintFormat("Table: Rows: %lu, Columns: %lu",this.RowsTotal(),this.ColumnsTotal());
                        //--- In the loop by table rows
                        for(int r=0;r<this.RowsTotal();r++)
                           //--- in the loop by the next row cells,
                           for(int c=0;c<this.ColumnsTotal();c++)
                             {
                              //--- get the pointer to the next cell and display its data in the journal
                              CTableCell *cell=this.GetCell(r,c);
                              if(cell!=NULL)
                                 ::PrintFormat("%*s%-5s %-4lu %-8s %-6lu %-8s %-6lu %-8s %-4lu",indent,"","Row",r,"Column",c,"Cell X:",cell.X(),"Cell Y:",cell.Y());
                             }
                       }
//--- Constructor/destructor
                     CTableData(void)  { this.m_list_rows.Clear();   }
                    ~CTableData(void)  { this.m_list_rows.Clear();   }
  };
Fast alle Methoden hier sind im Code kommentiert. Ich werde nur auf die Methoden eingehen, die die Anzahl der Zeilen und Spalten in der Tabelle sowie die Gesamtzahl der Tabellenzellen zurückgeben.
Die Anzahl der Zeilen ist eine Zeilenlistengröße. Wir erhalten die genaue Anzahl der Tabellenzeilen:
int RowsTotal(void) { return this.m_list_rows.Total(); }
Anders als bei den Zeilen wird hier die Anzahl der Spalten nur unter der Annahme zurückgegeben, dass ihre Anzahl in jeder Zeile gleich ist. Es wird also nur die Anzahl der Zellen in der allerersten Zeile zurückgegeben (Zeile mit dem Index Null in der Liste):
   int               ColumnsTotal(void)
                       {
                        //--- If there is no row in the list, return 0
                        if(this.RowsTotal()==0)
                           return 0;
                        //--- Get a pointer to the first row and return the number of cells in it
                        CTableRow *row=this.GetRow(0);
                        return(row!=NULL ? row.CellsTotal() : 0);
                       }
Bei der Erweiterung und Finalisierung dieser Klasse wird es möglich sein, Methoden hinzuzufügen, die die Anzahl der Zellen in einer bestimmten Zeile zurückgeben und dementsprechend nicht die Gesamtzahl der Zellen in der Tabelle zurückgeben, indem die (genaue) Anzahl der Zeilen in der Tabelle mit der Anzahl der Zellen in der ersten Zeile multipliziert wird (unter der oben genannten Annahme):
int CellsTotal(void){ return this.RowsTotal()*this.ColumnsTotal(); }
Dies ist ausreichend für genaue Berechnungen für diese Version der Klasse der tabellarischen Daten, und es gibt keine Notwendigkeit, die Dinge noch komplizierter zu machen - dies sind nur Hilfsklassen für die Klasse der Informationstafel, in der wir tabellarische (Gitter) Markup verwenden werden, um Daten auf der Tafel zu platzieren.
Dashboard-Klasse
Lassen Sie uns alle möglichen Mauszustände definieren:
- Die Maustasten (links, rechts) sind nicht gedrückt,
- Die Maustaste wird außerhalb des Bedienfeldfensters gedrückt,
- Die Maustaste wird innerhalb des Panel-Fensters gedrückt,
- Die Maustaste wird innerhalb des Fenstertitels gedrückt,
- Die Maustaste wird auf dem Steuerelement "close" (schließen) gedrückt,
- Die Maustaste wird auf dem Steuerelement "collapse/expand" (zusammenklappen/expandieren) gedrückt,
- Die Maustaste wird auf dem Steuerelement "pin" (anheften) gedrückt,
- Der Mauszeiger befindet sich außerhalb des Bedienfeldfensters,
- Der Mauszeiger befindet sich innerhalb des Bedienfeldfensters,
- Der Mauszeiger befindet sich innerhalb des Fenstertitels,
- Der Mauszeiger befindet sich innerhalb des Steuerelements "close",
- Der Mauszeiger befindet sich innerhalb des Steuerelements "collapse/expand",
- Der Mauszeiger befindet sich innerhalb des Steuerelements "Pin".
Lassen Sie uns die entsprechende Enumerationen erstellen:
enum ENUM_MOUSE_STATE
  {
   MOUSE_STATE_NOT_PRESSED,
   MOUSE_STATE_PRESSED_OUTSIDE_WINDOW,
   MOUSE_STATE_PRESSED_INSIDE_WINDOW,
   MOUSE_STATE_PRESSED_INSIDE_HEADER,
   MOUSE_STATE_PRESSED_INSIDE_CLOSE,
   MOUSE_STATE_PRESSED_INSIDE_MINIMIZE,
   MOUSE_STATE_PRESSED_INSIDE_PIN,
   MOUSE_STATE_OUTSIDE_WINDOW,
   MOUSE_STATE_INSIDE_WINDOW,
   MOUSE_STATE_INSIDE_HEADER,
   MOUSE_STATE_INSIDE_CLOSE,
   MOUSE_STATE_INSIDE_MINIMIZE,
   MOUSE_STATE_INSIDE_PIN
  };
Momentan ist die Verfolgung des Haltens oder Anklickens der Maustaste auf den Bedienelementen des Panels implementiert worden. Mit anderen Worten: Das erste Drücken ist ein Auslöser für die Behebung des Zustands. In Windows-Anwendungen ist ein solcher Auslöser jedoch das Loslassen einer Schaltfläche, nachdem sie gedrückt wurde - ein Klick. Gedrückthalten wird zum Ziehen von Objekten verwendet. Aber im Moment reicht uns eine einfache Lösung - das erste Drücken wird entweder als Klick oder als Halten gewertet. Wenn wir das Panel weiterentwickeln, wird es möglich sein, die Handhabung der Maustasten so zu ergänzen, dass sie dem oben beschriebenen Verhalten entspricht.
Die Klasse CDashboard-Informationspanel besteht aus zwei Elementen: einer Leinwand oder canvas (Hintergrund), auf der das Design und die Steuerelemente des Panels gezeichnet werden, und einem Arbeitsbereich, auf dem die auf dem Panel platzierten Daten gezeichnet werden. Der Arbeitsbereich wird immer vollständig transparent sein, und die Leinwand wird separate Transparenzwerte haben - für die Kopfzeile und für alles andere:
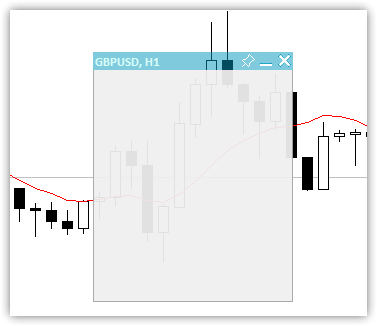
Abb. 2. Nur die Leinwand mit unterschiedlicher Transparenz des Titels und das Feld mit einem Rahmen
Der Bereich unter dem Titel, der von einem Rahmen umrandet ist, dient dazu, einen Arbeitsbereich darauf zu platzieren. Der Bereich ist vollständig transparent und enthält Datentexte. Außerdem kann die Fläche unterhalb des Titels für die visuelle Gestaltung genutzt werden. In diesem Fall werden Tabellen darauf gezeichnet:
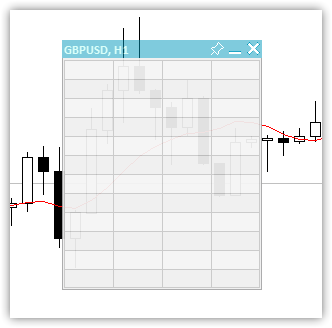
Abb. 3. Tabelle mit 12 Zeilen und 4 Spalten
Ein Arbeitsbereich mit Daten wird über der gestalteten Leinwand eingeblendet. Als Ergebnis erhalten wir ein vollwertiges Panel:
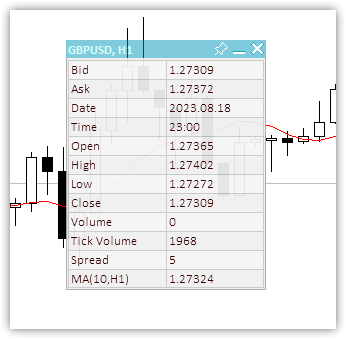
Abb. 4. Das Panel mit der 12x2-Hintergrundtabelle und den darauf befindlichen Daten
Wir werden die Werte einiger Panel-Parameter in globalen Terminalvariablen speichern, sodass sich das Panel seine Zustände merkt und sie bei einem Neustart wiederherstellt - X- und Y-Koordinaten, der minimierte Zustand und das Flag für die Beweglichkeit des Panels. Beim Anheften des Feldes an das Chart in eingeklappter Form wird diese angeheftete Position gespeichert, und beim nächsten Einklappen des angehefteten Feldes erscheint es an der gespeicherten Stelle.
Abb. 5. Das Paneel „merkt“ sich seine Ankerposition, wenn es in zusammengeklappter Form angeheftet wurde
Um sich den Bindungsort eines eingeklappten Bereichs zu merken, muss dieser eingeklappt, an den Bindungsort verschoben und angeheftet werden. Wenn das Bedienfeld in eingeklapptem Zustand angeheftet ist, wird seine Position gespeichert. Dann kann es erweitert, lösen und verschoben werden. Damit das Bedienfeld an die gespeicherte Bindungsposition zurückkehrt, muss es angeheftet und zusammengeklappt werden. Ohne Anheften wird das Panel an seiner aktuellen Position zusammengeklappt.
Klassenkörper:
//+------------------------------------------------------------------+
//| Dashboard class                                                  |
//+------------------------------------------------------------------+
class CDashboard : public CObject
  {
private:
   CCanvas           m_canvas;                  // Canvas
   CCanvas           m_workspace;               // Work space
   CTableData        m_table_data;              // Table cell array
   ENUM_PROGRAM_TYPE m_program_type;            // Program type
   ENUM_MOUSE_STATE  m_mouse_state;             // Mouse button status
   uint              m_id;                      // Object ID
   long              m_chart_id;                // ChartID
   int               m_chart_w;                 // Chart width
   int               m_chart_h;                 // Chart height
   int               m_x;                       // X coordinate
   int               m_y;                       // Y coordinate
   int               m_w;                       // Width
   int               m_h;                       // Height
   int               m_x_dock;                  // X coordinate of the pinned collapsed panel
   int               m_y_dock;                  // Y coordinate of the pinned collapsed panel

   bool              m_header;                  // Header presence flag
   bool              m_butt_close;              // Close button presence flag
   bool              m_butt_minimize;           // Collapse/expand button presence flag
   bool              m_butt_pin;                // Pin button presence flag
   bool              m_wider_wnd;               // Flag for exceeding the horizontal size of the window width panel
   bool              m_higher_wnd;              // Flag for exceeding the vertical size of the window height panel
   bool              m_movable;                 // Panel movability flag
   int               m_header_h;                // Header height
   int               m_wnd;                     // Chart subwindow index

   uchar             m_header_alpha;            // Header transparency
   uchar             m_header_alpha_c;          // Current header transparency
   color             m_header_back_color;       // Header background color
   color             m_header_back_color_c;     // Current header background color
   color             m_header_fore_color;       // Header text color
   color             m_header_fore_color_c;     // Current header text color
   color             m_header_border_color;     // Header border color
   color             m_header_border_color_c;   // Current header border color

   color             m_butt_close_back_color;   // Close button background color
   color             m_butt_close_back_color_c; // Current close button background color
   color             m_butt_close_fore_color;   // Close button icon color
   color             m_butt_close_fore_color_c; // Current close button color

   color             m_butt_min_back_color;     // Expand/collapse button background color
   color             m_butt_min_back_color_c;   // Current expand/collapse button background color
   color             m_butt_min_fore_color;     // Expand/collapse button icon color
   color             m_butt_min_fore_color_c;   // Current expand/collapse button icon color

   color             m_butt_pin_back_color;     // Pin button background color
   color             m_butt_pin_back_color_c;   // Current pin button background color
   color             m_butt_pin_fore_color;     // Pin button icon color
   color             m_butt_pin_fore_color_c;   // Current pin button icon color

   uchar             m_alpha;                   // Panel transparency
   uchar             m_alpha_c;                 // Current panel transparency
   uchar             m_fore_alpha;              // Text transparency
   uchar             m_fore_alpha_c;            // Current text transparency
   color             m_back_color;              // Background color

   color             m_back_color_c;            // Current background color

   color             m_fore_color;              // Text color
   color             m_fore_color_c;            // Current text color
   color             m_border_color;            // Border color
   color             m_border_color_c;          // Current border color

   string            m_title;                   // Title text
   string            m_title_font;              // Title font
   int               m_title_font_size;         // Title font size
   string            m_font;                    // Font
   int               m_font_size;               // Font size

   bool              m_minimized;               // Collapsed panel window flag
   string            m_program_name;            // Program name
   string            m_name_gv_x;               // Name of the global terminal variable storing the X coordinate
   string            m_name_gv_y;               // Name of the global terminal variable storing the Y coordinate
   string            m_name_gv_m;               // Name of the global terminal variable storing the collapsed panel flag

   string            m_name_gv_u;               // Name of the global terminal variable storing the flag of the pinned panel

   uint              m_array_wpx[];             // Array of pixels to save/restore the workspace
   uint              m_array_ppx[];             // Array of pixels to save/restore the panel background

//--- Return the flag that the panel exceeds (1) the height and (2) the width of the corresponding chart size
   bool              HigherWnd(void)      const { return(this.m_h+2>this.m_chart_h);   }
   bool              WiderWnd(void)       const { return(this.m_w+2>this.m_chart_w);   }
//--- Enable/disable modes of working with the chart
   void              SetChartsTool(const bool flag);

//--- Save (1) the working space and (2) the panel background to the pixel array
   void              SaveWorkspace(void);
   void              SaveBackground(void);
//--- Restore (1) the working space and (2) the panel background from the pixel array
   void              RestoreWorkspace(void);
   void              RestoreBackground(void);

//--- Save the pixel array (1) of the working space and the (2) panel background to the file
   bool              FileSaveWorkspace(void);
   bool              FileSaveBackground(void);
//--- Load the pixel array of the (1) working space and (2) the panel background from the file
   bool              FileLoadWorkspace(void);
   bool              FileLoadBackground(void);

//--- Return the subwindow index
   int               GetSubWindow(void) const
                       {
                        return(this.m_program_type==PROGRAM_EXPERT || this.m_program_type==PROGRAM_SCRIPT ? 0 : ::ChartWindowFind());
                       }

protected:
//--- (1) Hide, (2) show and (3) bring the panel to the foreground
   void              Hide(const bool redraw=false);
   void              Show(const bool redraw=false);
   void              BringToTop(void);
//--- Return the chart ID
   long              ChartID(void)        const { return this.m_chart_id;              }
//--- Draw the header area
   void              DrawHeaderArea(const string title);
//--- Redraw the header area using a new color and text values
   void              RedrawHeaderArea(const color new_color=clrNONE,const string title="",const color title_new_color=clrNONE,const ushort new_alpha=USHORT_MAX);
//--- Draw the panel frame
   void              DrawFrame(void);
//--- (1) Draw and (2) redraw the panel closing button
   void              DrawButtonClose(void);
   void              RedrawButtonClose(const color new_back_color=clrNONE,const color new_fore_color=clrNONE,const ushort new_alpha=USHORT_MAX);
//--- (1) Draw and (2) redraw the panel collapse/expand button
   void              DrawButtonMinimize(void);
   void              RedrawButtonMinimize(const color new_back_color=clrNONE,const color new_fore_color=clrNONE,const ushort new_alpha=USHORT_MAX);
//--- (1) Draw and (2) redraw the panel pin button
   void              DrawButtonPin(void);
   void              RedrawButtonPin(const color new_back_color=clrNONE,const color new_fore_color=clrNONE,const ushort new_alpha=USHORT_MAX);

//--- Return the flag for working in the visual tester
   bool              IsVisualMode(void) const
                       { return (bool)::MQLInfoInteger(MQL_VISUAL_MODE);               }
//--- Return the timeframe description
   string            TimeframeDescription(const ENUM_TIMEFRAMES timeframe) const
                       { return ::StringSubstr(EnumToString(timeframe),7);             }

//--- Return the state of mouse buttons
   ENUM_MOUSE_STATE  MouseButtonState(const int x,const int y,bool pressed);
//--- Shift the panel to new coordinates
   void              Move(int x,int y);

//--- Convert RGB to color
   color             RGBToColor(const double r,const double g,const double b) const;
//--- Write RGB component values to variables
   void              ColorToRGB(const color clr,double &r,double &g,double &b);
//--- Return (1) Red, (2) Green, (3) Blue color components
   double            GetR(const color clr)      { return clr&0xff ;                    }
   double            GetG(const color clr)      { return(clr>>8)&0xff;                 }
   double            GetB(const color clr)      { return(clr>>16)&0xff;                }
//--- Return a new color
   color             NewColor(color base_color, int shift_red, int shift_green, int shift_blue);

//--- Draw a panel
   void              Draw(const string title);
//--- (1) Collapse and (2) expand the panel
   void              Collapse(void);
   void              Expand(void);

//--- Set the (1) X and (2) Y panel coordinates
   bool              SetCoordX(const int coord_x);
   bool              SetCoordY(const int coord_y);
//--- Set the panel (1) width and (2) height
   bool              SetWidth(const int width,const bool redraw=false);
   bool              SetHeight(const int height,const bool redraw=false);

public:
//--- Display the panel
   void              View(const string title)   { this.Draw(title);                    }
//--- Return the (1) CCanvas object, (2) working space, (3) object ID
   CCanvas          *Canvas(void)               { return &this.m_canvas;               }
   CCanvas          *Workspace(void)            { return &this.m_workspace;            }
   uint              ID(void)                   { return this.m_id;                    }

//--- Return the panel (1) X and (2) Y coordinates
   int               CoordX(void)         const { return this.m_x;                     }
   int               CoordY(void)         const { return this.m_y;                     }
//--- Return the panel (1) width and (2) height
   int               Width(void)          const { return this.m_w;                     }
   int               Height(void)         const { return this.m_h;                     }

//--- Return the (1) width, (2) height and (3) size of the specified text
   int               TextWidth(const string text)
                       { return this.m_workspace.TextWidth(text);                      }
   int               TextHeight(const string text)
                       { return this.m_workspace.TextHeight(text);                     }
   void              TextSize(const string text,int &width,int &height)
                       { this.m_workspace.TextSize(text,width,height);                 }

//--- Set the close button (1) presence, (2) absence flag
   void              SetButtonCloseOn(void);
   void              SetButtonCloseOff(void);
//--- Set the collapse/expand button (1) presence, (2) absence flag
   void              SetButtonMinimizeOn(void);
   void              SetButtonMinimizeOff(void);

//--- Set the panel coordinates
   bool              SetCoords(const int x,const int y);
//--- Set the panel size
   bool              SetSizes(const int w,const int h,const bool update=false);
//--- Set panel coordinates and size
   bool              SetParams(const int x,const int y,const int w,const int h,const bool update=false);

//--- Set the transparency of the panel (1) header and (2) working space
   void              SetHeaderTransparency(const uchar value);
   void              SetTransparency(const uchar value);
//--- Set default panel font parameters
   void              SetFontParams(const string name,const int size,const uint flags=0,const uint angle=0);
//--- Display a text message at the specified coordinates
   void              DrawText(const string text,const int x,const int y,const int width=WRONG_VALUE,const int height=WRONG_VALUE);
//--- Draw a (1) background grid (2) with automatic cell size
   void              DrawGrid(const uint x,const uint y,const uint rows,const uint columns,const uint row_size,const uint col_size,const color line_color=clrNONE,bool alternating_color=true);
   void              DrawGridAutoFill(const uint border,const uint rows,const uint columns,const color line_color=clrNONE,bool alternating_color=true);
//--- Print grid data (line intersection coordinates)
   void              GridPrint(const uint indent=0)   { this.m_table_data.Print(indent);  }
//--- Write the X and Y coordinate values of the specified table cell to variables
   void              CellXY(const uint row,const uint column, int &x, int &y) { this.m_table_data.CellXY(row,column,x,y);  }
//--- Return the (1) X and (2) Y coordinate of the specified table cell
   int               CellX(const uint row,const uint column)         { return this.m_table_data.CellX(row,column);         }
   int               CellY(const uint row,const uint column)         { return this.m_table_data.CellY(row,column);         }

//--- Event handler
   void              OnChartEvent(const int id,const long &lparam,const double &dparam,const string &sparam);
//--- Constructor/destructor
                     CDashboard(const uint id,const int x,const int y, const int w,const int h,const int wnd=-1);
                    ~CDashboard();
  };
Die deklarierten Variablen und Klassenmethoden werden im Code ausführlich kommentiert. Schauen wir uns nun die Implementierung einiger Methoden an.
Konstruktor der Klasse:
//+------------------------------------------------------------------+
//| Constructor                                                      |
//+------------------------------------------------------------------+
CDashboard::CDashboard(const uint id,const int x,const int y, const int w,const int h,const int wnd=-1) :
                        m_id(id),
                        m_chart_id(::ChartID()),
                        m_program_type((ENUM_PROGRAM_TYPE)::MQLInfoInteger(MQL_PROGRAM_TYPE)),
                        m_program_name(::MQLInfoString(MQL_PROGRAM_NAME)),
                        m_wnd(wnd==-1 ? GetSubWindow() : wnd),
                        m_chart_w((int)::ChartGetInteger(m_chart_id,CHART_WIDTH_IN_PIXELS,m_wnd)),
                        m_chart_h((int)::ChartGetInteger(m_chart_id,CHART_HEIGHT_IN_PIXELS,m_wnd)),
                        m_mouse_state(MOUSE_STATE_NOT_PRESSED),
                        m_x(x),
                        m_y(::ChartGetInteger(m_chart_id,CHART_SHOW_ONE_CLICK) ? (y<79 ? 79 : y) : y),
                        m_w(w),
                        m_h(h),
                        m_x_dock(m_x),
                        m_y_dock(m_y),
                        m_header(true),
                        m_butt_close(true),
                        m_butt_minimize(true),
                        m_butt_pin(true),
                        m_header_h(18),

                        //--- Panel header implementation
                        m_header_alpha(128),
                        m_header_alpha_c(m_header_alpha),
                        m_header_back_color(C'0,153,188'),
                        m_header_back_color_c(m_header_back_color),
                        m_header_fore_color(C'182,255,244'),
                        m_header_fore_color_c(m_header_fore_color),
                        m_header_border_color(C'167,167,168'),
                        m_header_border_color_c(m_header_border_color),
                        m_title("Dashboard"),
                        m_title_font("Calibri"),
                        m_title_font_size(-100),

                        //--- close button
                        m_butt_close_back_color(C'0,153,188'),
                        m_butt_close_back_color_c(m_butt_close_back_color),
                        m_butt_close_fore_color(clrWhite),
                        m_butt_close_fore_color_c(m_butt_close_fore_color),

                        //--- collapse/expand button
                        m_butt_min_back_color(C'0,153,188'),
                        m_butt_min_back_color_c(m_butt_min_back_color),
                        m_butt_min_fore_color(clrWhite),
                        m_butt_min_fore_color_c(m_butt_min_fore_color),

                        //--- pin button
                        m_butt_pin_back_color(C'0,153,188'),
                        m_butt_pin_back_color_c(m_butt_min_back_color),
                        m_butt_pin_fore_color(clrWhite),
                        m_butt_pin_fore_color_c(m_butt_min_fore_color),

                        //--- Panel implementation
                        m_alpha(240),
                        m_alpha_c(m_alpha),
                        m_fore_alpha(255),
                        m_fore_alpha_c(m_fore_alpha),
                        m_back_color(C'240,240,240'),
                        m_back_color_c(m_back_color),
                        m_fore_color(C'53,0,0'),
                        m_fore_color_c(m_fore_color),
                        m_border_color(C'167,167,168'),
                        m_border_color_c(m_border_color),
                        m_font("Calibri"),
                        m_font_size(-100),

                        m_minimized(false),
                        m_movable(true)
  {
//--- Set the permission for the chart to send messages about events of moving and pressing mouse buttons,
//--- mouse scroll events, as well as graphical object creation/deletion
   ::ChartSetInteger(this.m_chart_id,CHART_EVENT_MOUSE_MOVE,true);
   ::ChartSetInteger(this.m_chart_id,CHART_EVENT_MOUSE_WHEEL,true);
   ::ChartSetInteger(this.m_chart_id,CHART_EVENT_OBJECT_CREATE,true);
   ::ChartSetInteger(this.m_chart_id,CHART_EVENT_OBJECT_DELETE,true);

//--- Set the names of global terminal variables to store panel coordinates, collapsed/expanded state and pinning
   this.m_name_gv_x=this.m_program_name+"_id_"+(string)this.m_id+"_"+(string)this.m_chart_id+"_X";
   this.m_name_gv_y=this.m_program_name+"_id_"+(string)this.m_id+"_"+(string)this.m_chart_id+"_Y";
   this.m_name_gv_m=this.m_program_name+"_id_"+(string)this.m_id+"_"+(string)this.m_chart_id+"_Minimize";
   this.m_name_gv_u=this.m_program_name+"_id_"+(string)this.m_id+"_"+(string)this.m_chart_id+"_Unpin";

//--- If a global variable does not exist, create it and write the current value,
//--- otherwise - read the value from the terminal global variable into it
//--- X coordinate
   if(!::GlobalVariableCheck(this.m_name_gv_x))
      ::GlobalVariableSet(this.m_name_gv_x,this.m_x);
   else
      this.m_x=(int)::GlobalVariableGet(this.m_name_gv_x);
//--- Y coordinate
   if(!::GlobalVariableCheck(this.m_name_gv_y))
      ::GlobalVariableSet(this.m_name_gv_y,this.m_y);
   else
      this.m_y=(int)::GlobalVariableGet(this.m_name_gv_y);
//--- Collapsed/expanded
   if(!::GlobalVariableCheck(this.m_name_gv_m))
      ::GlobalVariableSet(this.m_name_gv_m,this.m_minimized);
   else
      this.m_minimized=(int)::GlobalVariableGet(this.m_name_gv_m);
//--- Collapsed/not collapsed
   if(!::GlobalVariableCheck(this.m_name_gv_u))
      ::GlobalVariableSet(this.m_name_gv_u,this.m_movable);
   else
      this.m_movable=(int)::GlobalVariableGet(this.m_name_gv_u);

//--- Set the flags for the size of the panel exceeding the size of the chart window
   this.m_higher_wnd=this.HigherWnd();
   this.m_wider_wnd=this.WiderWnd();

//--- If the panel graphical resource is created,
   if(this.m_canvas.CreateBitmapLabel(this.m_chart_id,this.m_wnd,"P"+(string)this.m_id,this.m_x,this.m_y,this.m_w,this.m_h,COLOR_FORMAT_ARGB_NORMALIZE))
     {
      //--- set the canvas font and fill the canvas with the transparent color
      this.m_canvas.FontSet(this.m_title_font,this.m_title_font_size,FW_BOLD);
      this.m_canvas.Erase(0x00FFFFFF);
     }
//--- otherwise - report unsuccessful object creation to the journal
   else
      ::PrintFormat("%s: Error. CreateBitmapLabel for canvas failed",(string)__FUNCTION__);

//--- If a working space of a graphical resource is created,
   if(this.m_workspace.CreateBitmapLabel(this.m_chart_id,this.m_wnd,"W"+(string)this.m_id,this.m_x+1,this.m_y+this.m_header_h,this.m_w-2,this.m_h-this.m_header_h-1,COLOR_FORMAT_ARGB_NORMALIZE))
     {
      //--- set the font for the working area and fill it with the transparent color
      this.m_workspace.FontSet(this.m_font,this.m_font_size);
      this.m_workspace.Erase(0x00FFFFFF);
     }
//--- otherwise - report unsuccessful object creation to the journal
   else
      ::PrintFormat("%s: Error. CreateBitmapLabel for workspace failed",(string)__FUNCTION__);
  }
Die Klasse hat einen parametrischen Konstruktor und einen, der standardmäßig erstellt wird. Natürlich sind wir nur an der parametrischen Variante interessiert. Sie wird bei der Erstellung eines Klassenobjekts verwendet. Eine eindeutige Objekt-ID, die Anfangskoordinaten des Panels, seine Breite und Höhe und der Index des Teilfensters, in dem das Panel platziert werden soll, werden dem Konstruktor als formale Parameter übergeben.
Die eindeutige Panel-ID wird benötigt, damit die Klasse Objekte mit eindeutigen Namen erstellen kann. Wenn wir mehrere Indikatoren mit Panels in einem Chart verwenden, benötigen wir zur Vermeidung von Konflikten bei den Objektnamen diese eindeutige Nummer, die dem Namen des Panel-Objekts hinzugefügt wird, wenn es erstellt wird. Die Eindeutigkeit der ID sollte wiederholbar sein - bei jedem neuen Start sollte die Nummer die gleiche sein wie beim letzten Start. Zum Beispiel ist GetTickCount() für die ID nicht geeignet.
Wenn der Index des Unterfensters standardmäßig gesetzt ist (-1), wird es programmatisch durchsucht, andernfalls wird der im Parameter angegebene Index verwendet.
Die Standardparameter werden in der Initialisierungsliste des Konstruktors festgelegt. Bei einigen Parametern, die für die visuelle Darstellung verantwortlich sind, werden zwei Variablen verwendet: der Standardwert und der aktuelle Eigenschaftswert. Dies ist für interaktive Änderungen notwendig, z. B. wenn man mit dem Mauszeiger über den Bereich des Panels fährt, für den diese Parameter zuständig sind.
Der Hauptteil des Konstruktors enthält die Werte der globalen Terminalvariablen. Es werden zwei grafische Objekte erstellt - die Leinwand und der Arbeitsbereich des Panels.
Der gesamte Konstruktorcode ist ausführlich kommentiert.
Der Destruktor der Klasse:
//+------------------------------------------------------------------+
//| Destructor                                                       |
//+------------------------------------------------------------------+
CDashboard::~CDashboard()
  {
//--- Write the current values to global terminal variables
   ::GlobalVariableSet(this.m_name_gv_x,this.m_x);
   ::GlobalVariableSet(this.m_name_gv_y,this.m_y);
   ::GlobalVariableSet(this.m_name_gv_m,this.m_minimized);
   ::GlobalVariableSet(this.m_name_gv_u,this.m_movable);
//--- Delete panel objects
   this.m_canvas.Destroy();
   this.m_workspace.Destroy();
  }
Hier setzen wir zunächst die Koordinaten und Flaggen auf globale Terminalvariablen zurück und löschen dann die Objekte Leinwand und Arbeitsfläche.
Um mit dem Cursor und den Maustasten mit dem Panel interagieren zu können, müssen wir die Position des Cursors relativ zum Panel und seinen Bedienelementen kennen. Während sich der Cursor bewegt, können wir seine Koordinaten und die Zustände der Schaltflächen im Ereignis-Handler der Klasse verfolgen. Die Ereignisbehandlung der Klassen hat die gleichen Parameter wie die standardmäßige Ereignisbehandlung OnChartEvent:
void  OnChartEvent()
   const int       id,       // event ID
   const long&     lparam,   // long type event parameter
   const double&   dparam,   // double type event parameter
   const string&   sparam    // string type event parameter
   );
Parameter
id
[in] Ereignis-ID aus der Enumeration ENUM_CHART_EVENT.
lparam
[in] Ereignisparameter vom Typ long
dparam
[in] Ereignisparameter vom Typ double
sparam
[in] Ereignisparameter vom Typ string
Rückgabewert
Kein Rückgabewert
Hinweis
Es gibt 11 Typen von Ereignissen, die mit der vordefinierten Funktion OnChartEvent() behandelt werden können. 65535 IDs von CHARTEVENT_CUSTOM bis einschließlich CHARTEVENT_CUSTOM_LAST werden für nutzerdefinierte Ereignisse bereitgestellt. Um ein nutzerdefiniertes Ereignis zu erzeugen, verwenden wir die Funktion EventChartCustom().
Kurze Ereignisbeschreibung aus der Enumeration ENUM_CHART_EVENT:
- CHARTEVENT_KEYDOWN — Drücken einer Taste auf der Tastatur, wenn ein Chartfenster im Fokus ist;
- CHARTEVENT_MOUSE_MOVE — Bewegen der Maus und Klicken der Maustaste (wenn https://www.mql5.com/de/docs/con für das Chart eingestellt ist);
- CHARTEVENT_OBJECT_CREATE — Erstellung eines grafischen Objekts (wenn CHART_EVENT_OBJECT_CREATE=true für das Chart eingestellt ist);
- CHARTEVENT_OBJECT_CHANGE — Objekteigenschaften über den Eigenschaftsdialog ändern;
- CHARTEVENT_OBJECT_DELETE — löscht ein grafisches Objekt (wenn CHART_EVENT_OBJECT_DELETE für das Chart eingestellt ist);
- CHARTEVENT_CLICK — Klicken auf ein Chart;
- CHARTEVENT_OBJECT_CLICK — Mausklick auf ein grafisches Objekt eines Charts;
- CHARTEVENT_OBJECT_DRAG — Ziehen eines grafischen Objekts mit der Maus;
- CHARTEVENT_OBJECT_ENDEDIT — Beendet die Bearbeitung des Textes im Eingabefeld Bearbeiten eines grafischen Objekts (OBJ_EDIT);
- CHARTEVENT_CHART_CHANGE — ändert ein Chart;
- CHARTEVENT_CUSTOM+n — eigene Ereignis-ID, wobei n im Bereich von 0 bis 65535 liegt. CHARTEVENT_CUSTOM_LAST enthält die letzte akzeptable nutzerdefinierte Ereignis-ID (CHARTEVENT_CUSTOM+65535).
Der Parameter lparam enthält die X-Koordinate, dparam die Y-Koordinate und sparam die Kombination von Merkerwerten zur Bestimmung des Zustands der Maustasten. Alle diese Parameter müssen in Bezug auf die Koordinaten der Tafel und ihrer Elemente empfangen und verarbeitet werden. Der Zustand sollte bestimmt und an den Klassen-Ereignishandler gesendet werden, wo die Reaktion auf all diese Zustände festgelegt wird.
Die Methode, die den Zustand des Cursors und der Maustaste relativ zum Panel zurückgibt:
//+------------------------------------------------------------------+
//| Returns the state of the mouse cursor and button                 |
//+------------------------------------------------------------------+
ENUM_MOUSE_STATE CDashboard::MouseButtonState(const int x,const int y,bool pressed)
  {
//--- If the button is pressed
   if(pressed)
     {
      //--- If the state has already been saved, exit
      if(this.m_mouse_state!=MOUSE_STATE_NOT_PRESSED)
         return this.m_mouse_state;
      //--- If the button is pressed inside the window
      if(x>this.m_x && x<this.m_x+this.m_w && y>this.m_y && y<this.m_y+this.m_h)
        {
         //--- If the button is pressed inside the header
         if(y>this.m_y && y<=this.m_y+this.m_header_h)
           {
            //--- Bring the panel to the foreground
            this.BringToTop();
            //--- Coordinates of the close, collapse/expand and pin buttons
            int wc=(this.m_butt_close ? this.m_header_h : 0);
            int wm=(this.m_butt_minimize ? this.m_header_h : 0);
            int wp=(this.m_butt_pin ? this.m_header_h : 0);
            //--- If the close button is pressed, return this state
            if(x>this.m_x+this.m_w-wc)
               return MOUSE_STATE_PRESSED_INSIDE_CLOSE;
            //--- If the collapse/expand button is pressed, return this state
            if(x>this.m_x+this.m_w-wc-wm)
               return MOUSE_STATE_PRESSED_INSIDE_MINIMIZE;
            //--- If the pin button is pressed, return this state
            if(x>this.m_x+this.m_w-wc-wm-wp)
               return MOUSE_STATE_PRESSED_INSIDE_PIN;
            //--- If the button is not pressed on the control buttons of the panel, record and return the state of the button press inside the header
            this.m_mouse_state=MOUSE_STATE_PRESSED_INSIDE_HEADER;
            return this.m_mouse_state;
           }
         //--- If a button inside the window is pressed, write the state to a variable and return it
         else if(y>this.m_y+this.m_header_h && y<this.m_y+this.m_h)
           {
            this.m_mouse_state=MOUSE_STATE_PRESSED_INSIDE_WINDOW;
            return this.m_mouse_state;
           }
        }
      //--- The button is pressed outside the window - write the state to a variable and return it
      else
        {
         this.m_mouse_state=MOUSE_STATE_PRESSED_OUTSIDE_WINDOW;
         return this.m_mouse_state;
        }
     }
//--- If the button is not pressed
   else
     {
      //--- Write the state of the unpressed button to the variable
      this.m_mouse_state=MOUSE_STATE_NOT_PRESSED;
      //--- If the cursor is inside the panel
      if(x>this.m_x && x<this.m_x+this.m_w && y>this.m_y && y<this.m_y+this.m_h)
        {
         //--- If the cursor is inside the header
         if(y>this.m_y && y<=this.m_y+this.m_header_h)
           {
            //--- Specify the width of the close, collapse/expand and pin buttons
            int wc=(this.m_butt_close ? this.m_header_h : 0);
            int wm=(this.m_butt_minimize ? this.m_header_h : 0);
            int wp=(this.m_butt_pin ? this.m_header_h : 0);
            //--- If the cursor is inside the close button, return this state
            if(x>this.m_x+this.m_w-wc)
               return MOUSE_STATE_INSIDE_CLOSE;
            //--- If the cursor is inside the minimize/expand button, return this state
            if(x>this.m_x+this.m_w-wc-wm)
               return MOUSE_STATE_INSIDE_MINIMIZE;
            //--- If the cursor is inside the pin button, return this state
            if(x>this.m_x+this.m_w-wc-wm-wp)
               return MOUSE_STATE_INSIDE_PIN;
            //--- If the cursor is outside the buttons inside the header area, return this state
            return MOUSE_STATE_INSIDE_HEADER;
           }
         //--- Otherwise, the cursor is inside the working space. Return this state
         else
            return MOUSE_STATE_INSIDE_WINDOW;
        }
     }
//--- In any other case, return the state of the unpressed mouse button
   return MOUSE_STATE_NOT_PRESSED;
  }
Die Methodenlogik wurde in den Codekommentaren ausführlich beschrieben. Wir bestimmen einfach die gegenseitigen Koordinaten des Cursors, des Panels und seiner Elemente und geben den Zustand zurück. Das Flag der gedrückten oder losgelassenen Maustaste wird sofort an die Methode gesendet. Für jeden dieser Zustände gibt es einen eigenen Codeblock, der den Zustand definiert, wenn die Taste gedrückt oder losgelassen wird. Die Verwendung der Logik auf diese Weise ist recht einfach und schnell. Es gibt jedoch einige Nachteile: Sie können einen Mausklick auf ein Steuerelement nicht erkennen. Stattdessen können Sie nur einen Klick darauf erkennen. Normalerweise wird ein Klick registriert, wenn die Maustaste losgelassen wird, und ein Gedrückthalten wird registriert, wenn sie gedrückt wird. Bei der hier verwendeten Logik wird nur das Drücken der Maustaste als Klick und Gedrückthalten betrachtet.
Die in dieser Methode erhaltenen Zustände sollten an die Ereignisbehandlung gesendet werden, wobei jedes Ereignis seinen eigenen Handler hat, der das Verhalten und das Aussehen des Panels ändert:
//+------------------------------------------------------------------+
//| Event handler                                                    |
//+------------------------------------------------------------------+
void CDashboard::OnChartEvent(const int id,const long &lparam,const double &dparam,const string &sparam)
  {
//--- If a graphical object is created
   if(id==CHARTEVENT_OBJECT_CREATE)
     {
      this.BringToTop();
      ::ObjectSetInteger(this.m_chart_id,sparam,OBJPROP_SELECTED,true);
     }
//--- If the chart is changed
   if(id==CHARTEVENT_CHART_CHANGE)
     {
      //--- Get the chart subwindow index (it may change when removing the window of any indicator)
      this.m_wnd=this.GetSubWindow();
      //--- Get the new chart size
      int w=(int)::ChartGetInteger(this.m_chart_id,CHART_WIDTH_IN_PIXELS,this.m_wnd);
      int h=(int)::ChartGetInteger(this.m_chart_id,CHART_HEIGHT_IN_PIXELS,this.m_wnd);
      //--- Determine whether the panel dimensions extend beyond the chart window
      this.m_higher_wnd=this.HigherWnd();
      this.m_wider_wnd=this.WiderWnd();
      //--- If the chart height has changed, adjust the panel vertical position
      if(this.m_chart_h!=h)
        {
         this.m_chart_h=h;
         int y=this.m_y;
         if(this.m_y+this.m_h>h-1)
            y=h-this.m_h-1;
         if(y<1)
            y=1;
         this.Move(this.m_x,y);
        }
      //--- If the chart weight has changed, adjust the panel horizontal position
      if(this.m_chart_w!=w)
        {
         this.m_chart_w=w;
         int x=this.m_x;
         if(this.m_x+this.m_w>w-1)
            x=w-this.m_w-1;
         if(x<1)
            x=1;
         this.Move(x,this.m_y);
        }
     }

//--- Declare variables to store the current cursor shift relative to the initial coordinates of the panel
   static int diff_x=0;
   static int diff_y=0;

//--- Get the flag of the held mouse button. We also take into account the right button for the visual tester (sparam=="2")
   bool pressed=(!this.IsVisualMode() ? (sparam=="1" || sparam=="" ? true : false) : sparam=="1" || sparam=="2" ? true : false);
//--- Get the cursor X and Y coordinates. Take into account the shift for the Y coordinate when working in the chart subwindow
   int  mouse_x=(int)lparam;
   int  mouse_y=(int)dparam-(int)::ChartGetInteger(this.m_chart_id,CHART_WINDOW_YDISTANCE,this.m_wnd);
//--- Get the state of the cursor and mouse buttons relative to the panel
   ENUM_MOUSE_STATE state=this.MouseButtonState(mouse_x,mouse_y,pressed);
//--- If the cursor moves
   if(id==CHARTEVENT_MOUSE_MOVE)
     {
      //--- If a button is pressed inside the working area of the panel
      if(state==MOUSE_STATE_PRESSED_INSIDE_WINDOW)
        {
         //--- Disable chart scrolling, right-click menu and crosshair
         this.SetChartsTool(false);
         //--- Redraw the header area with the default background color
         if(this.m_header_back_color_c!=this.m_header_back_color)
           {
            this.RedrawHeaderArea(this.m_header_back_color);
            this.m_canvas.Update();
           }
         return;
        }
      //--- If a button is pressed inside the panel header area
      else if(state==MOUSE_STATE_PRESSED_INSIDE_HEADER)
        {
         //--- Disable chart scrolling, right-click menu and crosshair
         this.SetChartsTool(false);
         //--- Redraw the header area with a new background color
         color new_color=this.NewColor(this.m_header_back_color,-10,-10,-10);
         if(this.m_header_back_color_c!=new_color)
           {
            this.RedrawHeaderArea(new_color);
            this.m_canvas.Update();
           }
         //--- Shift the panel following the cursor taking into account the amount of cursor displacement relative to the initial coordinates of the panel
         if(this.m_movable)
            this.Move(mouse_x-diff_x,mouse_y-diff_y);
         return;
        }

      //--- If the close button is pressed
      else if(state==MOUSE_STATE_PRESSED_INSIDE_CLOSE)
        {
         //--- Disable chart scrolling, right-click menu and crosshair
         this.SetChartsTool(false);
         //--- Redraw the close button with a new background color
         color new_color=this.NewColor(clrRed,0,40,40);
         if(this.m_butt_close_back_color_c!=new_color)
           {
            this.RedrawButtonClose(new_color);
            this.m_canvas.Update();
           }
         //--- Close button press handling should be defined in the program.
         //--- Send the click event of this button to its OnChartEvent handler.
         //--- Event ID 1001,
         //--- lparam=panel ID (m_id),
         //--- dparam=0
         //--- sparam="Close button pressed"
         ushort event=CHARTEVENT_CUSTOM+1;
         ::EventChartCustom(this.m_chart_id,ushort(event-CHARTEVENT_CUSTOM),this.m_id,0,"Close button pressed");
        }
      //--- If the panel collapse/expand button is pressed
      else if(state==MOUSE_STATE_PRESSED_INSIDE_MINIMIZE)
        {
         //--- Disable chart scrolling, right-click menu and crosshair
         this.SetChartsTool(false);
         //--- "flip" the panel collapse flag,
         this.m_minimized=!this.m_minimized;
         //--- redraw the panel taking into account the new state of the flag,
         this.Draw(this.m_title);
         //--- redraw the panel header area
         this.RedrawHeaderArea();
         //--- If the panel is pinned and expanded, move it to the stored location coordinates
         if(this.m_minimized && !this.m_movable)
            this.Move(this.m_x_dock,this.m_y_dock);
         //--- Update the canvas with chart redrawing and
         this.m_canvas.Update();
         //--- write the state of the panel expand flag to the global terminal variable
         ::GlobalVariableSet(this.m_name_gv_m,this.m_minimized);
        }
      //--- If the panel pin button is pressed
      else if(state==MOUSE_STATE_PRESSED_INSIDE_PIN)
        {
         //--- Disable chart scrolling, right-click menu and crosshair
         this.SetChartsTool(false);
         //--- "flip" the panel collapse flag,
         this.m_movable=!this.m_movable;
         //--- Redraw the pin button with a new background color
         color new_color=this.NewColor(this.m_butt_pin_back_color,30,30,30);
         if(this.m_butt_pin_back_color_c!=new_color)
            this.RedrawButtonPin(new_color);
         //--- If the panel is collapsed and pinned, save its coordinates
         //--- When expanded and collapsed again, the panel returns to these coordinates
         //--- Relevant for pinning a collapsed panel at the bottom of the screen
         if(this.m_minimized && !this.m_movable)
           {
            this.m_x_dock=this.m_x;
            this.m_y_dock=this.m_y;
           }
         //--- Update the canvas with chart redrawing and
         this.m_canvas.Update();
         //--- write the state of the panel movability flag to the global terminal variable
         ::GlobalVariableSet(this.m_name_gv_u,this.m_movable);
        }

      //--- If the cursor is inside the panel header area
      else if(state==MOUSE_STATE_INSIDE_HEADER)
        {
         //--- Disable chart scrolling, right-click menu and crosshair
         this.SetChartsTool(false);
         //--- Redraw the header area with a new background color
         color new_color=this.NewColor(this.m_header_back_color,20,20,20);
         if(this.m_header_back_color_c!=new_color)
           {
            this.RedrawHeaderArea(new_color);
            this.m_canvas.Update();
           }
        }

      //--- If the cursor is inside the close button
      else if(state==MOUSE_STATE_INSIDE_CLOSE)
        {
         //--- Disable chart scrolling, right-click menu and crosshair
         this.SetChartsTool(false);
         //--- Redraw the header area with a minimal change in the background color
         color new_color=this.NewColor(this.m_header_back_color,0,0,1);
         if(this.m_header_back_color_c!=new_color)
            this.RedrawHeaderArea(new_color);
         //--- Redraw the collapse/expand button with the default background color
         if(this.m_butt_min_back_color_c!=this.m_butt_min_back_color)
            this.RedrawButtonMinimize(this.m_butt_min_back_color);
         //--- Redraw the pin button with the default background color
         if(this.m_butt_pin_back_color_c!=this.m_butt_pin_back_color)
            this.RedrawButtonPin(this.m_butt_pin_back_color);
         //--- Redraw the close button with the red background color
         if(this.m_butt_close_back_color_c!=clrRed)
           {
            this.RedrawButtonClose(clrRed);
            this.m_canvas.Update();
           }
        }

      //--- If the cursor is inside the collapse/expand button
      else if(state==MOUSE_STATE_INSIDE_MINIMIZE)
        {
         //--- Disable chart scrolling, right-click menu and crosshair
         this.SetChartsTool(false);
         //--- Redraw the header area with a minimal change in the background color
         color new_color=this.NewColor(this.m_header_back_color,0,0,1);
         if(this.m_header_back_color_c!=new_color)
            this.RedrawHeaderArea(new_color);
         //--- Redraw the close button with the default background color
         if(this.m_butt_close_back_color_c!=this.m_butt_close_back_color)
            this.RedrawButtonClose(this.m_butt_close_back_color);
         //--- Redraw the pin button with the default background color
         if(this.m_butt_pin_back_color_c!=this.m_butt_pin_back_color)
            this.RedrawButtonPin(this.m_butt_pin_back_color);
         //--- Redraw the collapse/expand button with a new background color
         new_color=this.NewColor(this.m_butt_min_back_color,20,20,20);
         if(this.m_butt_min_back_color_c!=new_color)
           {
            this.RedrawButtonMinimize(new_color);
            this.m_canvas.Update();
           }
        }

      //--- If the cursor is inside the pin button
      else if(state==MOUSE_STATE_INSIDE_PIN)
        {
         //--- Disable chart scrolling, right-click menu and crosshair
         this.SetChartsTool(false);
         //--- Redraw the header area with a minimal change in the background color
         color new_color=this.NewColor(this.m_header_back_color,0,0,1);
         if(this.m_header_back_color_c!=new_color)
            this.RedrawHeaderArea(new_color);
         //--- Redraw the close button with the default background color
         if(this.m_butt_close_back_color_c!=this.m_butt_close_back_color)
            this.RedrawButtonClose(this.m_butt_close_back_color);
         //--- Redraw the collapse/expand button with the default background color
         if(this.m_butt_min_back_color_c!=this.m_butt_min_back_color)
            this.RedrawButtonMinimize(this.m_butt_min_back_color);
         //--- Redraw the pin button with a new background color
         new_color=this.NewColor(this.m_butt_pin_back_color,20,20,20);
         if(this.m_butt_pin_back_color_c!=new_color)
           {
            this.RedrawButtonPin(new_color);
            this.m_canvas.Update();
           }
        }

      //--- If the cursor is inside the working space
      else if(state==MOUSE_STATE_INSIDE_WINDOW)
        {
         //--- Disable chart scrolling, right-click menu and crosshair
         this.SetChartsTool(false);
         //--- Redraw the header area with the default background color
         if(this.m_header_back_color_c!=this.m_header_back_color)
           {
            this.RedrawHeaderArea(this.m_header_back_color);
            this.m_canvas.Update();
           }
        }
      //--- Otherwise (the cursor is outside the panel, and we need to restore the chart parameters)
      else
        {
         //--- Enable chart scrolling, right-click menu and crosshair
         this.SetChartsTool(true);
         //--- Redraw the header area with the default background color
         if(this.m_header_back_color_c!=this.m_header_back_color)
           {
            this.RedrawHeaderArea(this.m_header_back_color);
            this.m_canvas.Update();
           }
        }
      //--- Write the cursor shift by X and Y relative to the panel initial coordinates
      diff_x=mouse_x-this.m_x;
      diff_y=mouse_y-this.m_y;
     }
  }
Die Logik der Ereignisbehandlung ist im Code hinreichend ausführlich kommentiert. Wir sollten hier einige bemerkenswerte Punkte beachten.
Die Behandlung des Ereignisses der Erstellung eines neuen grafischen Objekts wird ganz am Anfang festgelegt:
//--- If a graphical object is created
   if(id==CHARTEVENT_OBJECT_CREATE)
     {
      this.BringToTop();
      ::ObjectSetInteger(this.m_chart_id,sparam,OBJPROP_SELECTED,true);
     }
Was sind seine Funktionen? Wenn wir ein neues grafisches Objekt erstellen, wird es über anderen grafischen Objekten auf dem Chart platziert und dementsprechend über dem Bedienfeld eingeblendet. Daher wird bei der Definition eines solchen Ereignisses das Panel sofort in den Vordergrund gebracht. Dann wird ein neues grafisches Objekt hervorgehoben. Warum? Wenn dies nicht geschieht, werden grafische Objekte, die mehrere Punkte für die Konstruktion benötigen, z. B. eine Trendlinie, nicht normal erstellt - alle ihre Kontrollpunkte liegen dann auf derselben Koordinate, und das Objekt selbst ist nicht sichtbar. Dies geschieht durch den Verlust der Kontrolle über das grafische Objekt während seiner Erstellung, wenn das Panel in den Vordergrund gebracht wird. Daher sollte das neue grafische Objekt zwangsweise ausgewählt werden, nachdem das Panel in den Vordergrund gebracht wurde.
Daher verhalten sich das Panel und die grafischen Objekte bei ihrer Erstellung wie folgt:
Abb. 6. Das neue grafische Objekt wird „unter“ dem Panel erstellt und verliert nicht den Fokus, wenn es erstellt wird.
Die Ereignisbehandlung hat für jeden Zustand einen eigenen Verarbeitungsblock. Die Logik all dieser Blöcke ist identisch. Verarbeiten Sie zum Beispiel einen Mausklick und halten Sie die Maustaste in der Kopfzeile des Panels gedrückt:
      //--- If a button is pressed inside the panel header area
      else if(state==MOUSE_STATE_PRESSED_INSIDE_HEADER)
        {
         //--- Disable chart scrolling, right-click menu and crosshair
         this.SetChartsTool(false);
         //--- Redraw the header area with a new background color
         color new_color=this.NewColor(this.m_header_back_color,-10,-10,-10);
         if(this.m_header_back_color_c!=new_color)
           {
            this.RedrawHeaderArea(new_color);
            this.m_canvas.Update();
           }
         //--- Shift the panel following the cursor taking into account the amount of cursor displacement relative to the initial coordinates of the panel
         if(this.m_movable)
            this.Move(mouse_x-diff_x,mouse_y-diff_y);
         return;
        }
Um zu verhindern, dass sich das Chart mit dem Panel mitbewegt, sind die Ereignisse zum Scrollen des Charts mit der Maus, das Rechtsklick-Menü und das Fadenkreuz für das Chart deaktiviert. Da die Kopfzeile visuell auf Mausbewegungen reagieren soll, wird sie dunkler eingefärbt. Bevor wir die Farbe ändern, müssen wir prüfen, ob sie bereits geändert wurde. Es macht keinen Sinn, ständig denselben zu verwenden und dabei CPU-Ressourcen zu verschwenden. Wenn die Bewegung nicht deaktiviert ist (das Panel ist nicht angeheftet), wird es zu neuen Koordinaten verschoben, die aus den Mauskoordinaten abzüglich der Verschiebung der Cursorposition relativ zur oberen linken Ecke des Panels berechnet werden. Wenn die Verschiebung nicht berücksichtigt wird, wird das Panel genau an den Cursor-Koordinaten in der oberen linken Ecke positioniert.
Die Methode zum Verschieben des Panels zu bestimmten Koordinaten:
//+------------------------------------------------------------------+
//| Move the panel                                                   |
//+------------------------------------------------------------------+
void CDashboard::Move(int x,int y)
  {
   int h=this.m_canvas.Height();
   int w=this.m_canvas.Width();
   if(!this.m_wider_wnd)
     {
      if(x+w>this.m_chart_w-1)
         x=this.m_chart_w-w-1;
      if(x<1)
         x=1;
     }
   else
     {
      if(x>1)
         x=1;
      if(x<this.m_chart_w-w-1)
         x=this.m_chart_w-w-1;
     }
   if(!this.m_higher_wnd)
     {
      if(y+h>this.m_chart_h-2)
         y=this.m_chart_h-h-2;
      if(y<1)
         y=1;
     }
   else
     {
      if(y>1)
         y=1;
      if(y<this.m_chart_h-h-2)
         y=this.m_chart_h-h-2;
     }
   if(this.SetCoords(x,y))
      this.m_canvas.Update();
  }
Die Koordinaten, an die das Panel verschoben werden soll, werden an die Methode übergeben. Wenn das Feld beim Ändern der Koordinaten außerhalb des Charts liegt, werden die Koordinaten so angepasst, dass sich das Feld immer innerhalb des Chartfensters befindet, das von jeder Kante um 1 Pixel eingerückt ist. Nach Abschluss aller Überprüfungen und Anpassungen der Tafelkoordinaten werden neue Koordinaten für die Lage der Tafel auf der Karte festgelegt.
Die Methoden, die die Panelkoordinaten festlegen:
//+------------------------------------------------------------------+
//| Set the panel X coordinate                                       |
//+------------------------------------------------------------------+
bool CDashboard::SetCoordX(const int coord_x)
  {
   int x=(int)::ObjectGetInteger(this.m_chart_id,this.m_canvas.ChartObjectName(),OBJPROP_XDISTANCE);
   if(x==coord_x)
      return true;
   if(!::ObjectSetInteger(this.m_chart_id,this.m_canvas.ChartObjectName(),OBJPROP_XDISTANCE,coord_x))
      return false;
   if(!::ObjectSetInteger(this.m_chart_id,this.m_workspace.ChartObjectName(),OBJPROP_XDISTANCE,coord_x+1))
      return false;
   this.m_x=coord_x;
   return true;
  }
//+------------------------------------------------------------------+
//| Set the panel Y coordinate                                       |
//+------------------------------------------------------------------+
bool CDashboard::SetCoordY(const int coord_y)
  {
   int y=(int)::ObjectGetInteger(this.m_chart_id,this.m_canvas.ChartObjectName(),OBJPROP_YDISTANCE);
   if(y==coord_y)
      return true;
   if(!::ObjectSetInteger(this.m_chart_id,this.m_canvas.ChartObjectName(),OBJPROP_YDISTANCE,coord_y))
      return false;
   if(!::ObjectSetInteger(this.m_chart_id,this.m_workspace.ChartObjectName(),OBJPROP_YDISTANCE,coord_y+this.m_header_h))
      return false;
   this.m_y=coord_y;
   return true;
  }
Wird der Methode eine Koordinate übergeben, die mit der Koordinate der Tafel übereinstimmt, muss diese nicht erneut festgelegt werden - der Erfolg der Methode wird einfach zurückgegeben. Zuerst wird die Leinwand verschoben, dann die Arbeitsfläche. Der Arbeitsbereich wird unter Berücksichtigung seiner relativen Position auf der Leinwand verschoben - links um ein Pixel innerhalb des Panels und oben um die Höhe der Kopfzeile.
Die Methoden zum Festlegen der Plattenabmessungen:
//+------------------------------------------------------------------+
//| Set the panel width                                              |
//+------------------------------------------------------------------+
bool CDashboard::SetWidth(const int width,const bool redraw=false)
  {
   if(width<4)
     {
      ::PrintFormat("%s: Error. Width cannot be less than 4px",(string)__FUNCTION__);
      return false;
     }
   if(width==this.m_canvas.Width())
      return true;
   if(!this.m_canvas.Resize(width,this.m_canvas.Height()))
      return false;
   if(width-2<1)
      ::ObjectSetInteger(this.m_chart_id,this.m_workspace.ChartObjectName(),OBJPROP_TIMEFRAMES,OBJ_NO_PERIODS);
   else
     {
      ::ObjectSetInteger(this.m_chart_id,this.m_workspace.ChartObjectName(),OBJPROP_TIMEFRAMES,OBJ_ALL_PERIODS);
      if(!this.m_workspace.Resize(width-2,this.m_workspace.Height()))
         return false;
     }
   this.m_w=width;
   return true;
  }
//+------------------------------------------------------------------+
//| Set the panel height                                             |
//+------------------------------------------------------------------+
bool CDashboard::SetHeight(const int height,const bool redraw=false)
  {
   if(height<::fmax(this.m_header_h,1))
     {
      ::PrintFormat("%s: Error. Width cannot be less than %lupx",(string)__FUNCTION__,::fmax(this.m_header_h,1));
      return false;
     }
   if(height==this.m_canvas.Height())
      return true;
   if(!this.m_canvas.Resize(this.m_canvas.Width(),height))
      return false;
   if(height-this.m_header_h-2<1)
      ::ObjectSetInteger(this.m_chart_id,this.m_workspace.ChartObjectName(),OBJPROP_TIMEFRAMES,OBJ_NO_PERIODS);
   else
     {
      ::ObjectSetInteger(this.m_chart_id,this.m_workspace.ChartObjectName(),OBJPROP_TIMEFRAMES,OBJ_ALL_PERIODS);
      if(!this.m_workspace.Resize(this.m_workspace.Width(),height-this.m_header_h-2))
         return false;
     }
   this.m_h=height;
   return true;
  }
Hier ist alles genau so wie beim Setzen von Koordinaten - wenn die an die Methode übergebene Größe die gleiche ist, die das Panel bereits hat, dann geben die Methoden einfach true zurück. Ein wichtiges Detail ist, dass die Arbeitsfläche immer kleiner ist als die Leinwand. Wenn sich bei der Verkleinerung des Arbeitsbereichs herausstellt, dass die Größe kleiner als 1 wird, wird der Arbeitsbereich einfach ausgeblendet, ohne seine Größe zu ändern, um Größenänderungsfehler zu vermeiden.
Hilfsmethoden, die zwei Koordinaten auf einmal, alle Dimensionen und Koordinaten sowie die Dimensionen des Panels auf einmal festlegen:
//+------------------------------------------------------------------+
//| Set the panel coordinates                                        |
//+------------------------------------------------------------------+
bool CDashboard::SetCoords(const int x,const int y)
  {
   bool res=true;
   res &=this.SetCoordX(x);
   res &=this.SetCoordY(y);
   return res;
  }
//+------------------------------------------------------------------+
//| Set the panel size                                               |
//+------------------------------------------------------------------+
bool CDashboard::SetSizes(const int w,const int h,const bool update=false)
  {
   bool res=true;
   res &=this.SetWidth(w);
   res &=this.SetHeight(h);
   if(res && update)
      this.Expand();
   return res;
  }
//+------------------------------------------------------------------+
//| Set panel coordinates and size                                   |
//+------------------------------------------------------------------+
bool CDashboard::SetParams(const int x,const int y,const int w,const int h,const bool update=false)
  {
   bool res=true;
   res &=this.SetCoords(x,y);
   res &=this.SetSizes(w,h);
   if(res && update)
      this.Expand();
   return res;
  }
Die Methoden erhalten die Parameter und das Aktualisierungsflag. Wenn die Parameter und das Aktualisierungsflag erfolgreich gesetzt sind, wird die Methode zur Erweiterung des Panels aufgerufen, bei der alle Paneelelemente neu gezeichnet werden.
Die Methode, die den Kopfbereich zeichnet:
//+------------------------------------------------------------------+
//| Draw the header area                                             |
//+------------------------------------------------------------------+
void CDashboard::DrawHeaderArea(const string title)
  {
//--- Exit if the header is not used
   if(!this.m_header)
      return;
//--- Set the title text
   this.m_title=title;
//--- The Y coordinate of the text is located vertically in the center of the header area
   int y=this.m_header_h/2;
//--- Fill the area with color
   this.m_canvas.FillRectangle(0,0,this.m_w-1,this.m_header_h-1,::ColorToARGB(this.m_header_back_color,this.m_header_alpha));
//--- Display the header text
   this.m_canvas.TextOut(2,y,this.m_title,::ColorToARGB(this.m_header_fore_color,this.m_header_alpha),TA_LEFT|TA_VCENTER);
//--- Save the current header background color
   this.m_header_back_color_c=this.m_header_back_color;
//--- Draw control elements (close, collapse/expand and pin buttons) and
   this.DrawButtonClose();
   this.DrawButtonMinimize();
   this.DrawButtonPin();
//--- update the canvas without redrawing the screen
   this.m_canvas.Update(false);
  }
Die Methode zeichnet den Kopfbereich - malt einen rechteckigen Bereich an den Kopfkoordinaten und zeichnet die Steuerelemente - Schließen, Verkleinern/Erweitern und Pin-Schaltflächen. Es werden die Standardfarben und -transparenz des Kopfbereichs verwendet.
Methode, mit der der Kopfbereich neu gezeichnet wird:
//+------------------------------------------------------------------+
//| Redraw header area                                               |
//+------------------------------------------------------------------+
void CDashboard::RedrawHeaderArea(const color new_color=clrNONE,const string title="",const color title_new_color=clrNONE,const ushort new_alpha=USHORT_MAX)
  {
//--- Exit if the header is not used or all passed parameters have default values
   if(!this.m_header || (new_color==clrNONE && title=="" && title_new_color==clrNONE && new_alpha==USHORT_MAX))
      return;
//--- Exit if all passed parameters are equal to those already set
   if(new_color==this.m_header_back_color && title==this.m_title && title_new_color==this.m_header_fore_color && new_alpha==this.m_header_alpha)
      return;
//--- If the title is not equal to the default value, set a new title
   if(title!="")
      this.m_title=title;
//--- Define new background and text colors, and transparency
   color back_clr=(new_color!=clrNONE ? new_color : this.m_header_back_color);
   color fore_clr=(title_new_color!=clrNONE ? title_new_color : this.m_header_fore_color);
   uchar alpha=uchar(new_alpha==USHORT_MAX ? this.m_header_alpha : new_alpha>255 ? 255 : new_alpha);
//--- The Y coordinate of the text is located vertically in the center of the header area
   int y=this.m_header_h/2;
//--- Fill the area with color
   this.m_canvas.FillRectangle(0,0,this.m_w-1,this.m_header_h-1,::ColorToARGB(back_clr,alpha));
//--- Display the header text
   this.m_canvas.TextOut(2,y,this.m_title,::ColorToARGB(fore_clr,alpha),TA_LEFT|TA_VCENTER);
//--- Save the current header background color, text and transparency
   this.m_header_back_color_c=back_clr;
   this.m_header_fore_color_c=fore_clr;
   this.m_header_alpha_c=alpha;
//--- Draw control elements (close, collapse/expand and pin buttons) and
   this.RedrawButtonClose(back_clr,clrNONE,alpha);
   this.RedrawButtonMinimize(back_clr,clrNONE,alpha);
   this.RedrawButtonPin(back_clr,clrNONE,alpha);
//--- update the canvas without redrawing the screen
   this.m_canvas.Update(true);
  }
Die neue Hintergrundfarbe, der neue Kopftext, die neue Kopftextfarbe und die neue Transparenz werden an die Methode übergeben. Wir beenden die Methode, wenn die übergebenen Parameter vollständig mit den bereits gesetzten übereinstimmen. Die Methode wird verwendet, um die Farbe, den Text und die Transparenz der Kopfzeile zu aktualisieren.
Die Methode, die den Panelrahmen zeichnet:
//+------------------------------------------------------------------+
//| Draw the panel frame                                             |
//+------------------------------------------------------------------+
void CDashboard::DrawFrame(void)
  {
   this.m_canvas.Rectangle(0,0,this.m_w-1,this.m_h-1,::ColorToARGB(this.m_border_color,this.m_alpha));
   this.m_border_color_c=this.m_border_color;
   this.m_canvas.Update(false);
  }
Wir zeichnen einen Rahmen um den Umfang der Leinwand und speichern die eingestellte Farbe als die aktuelle Farbe.
Die Methode, die die Schaltfläche zum Schließen des Fensters zeichnet:
//+------------------------------------------------------------------+
//| Draws the panel close button                                     |
//+------------------------------------------------------------------+
void CDashboard::DrawButtonClose(void)
  {
//--- Exit if the button is not used
   if(!this.m_butt_close)
      return;
//--- The button width is equal to the height of the header area
   int w=this.m_header_h;
//--- Button coordinates and size
   int x1=this.m_w-w;
   int x2=this.m_w-1;
   int y1=0;
   int y2=w-1;
//--- Shift of the upper left corner of the rectangular area of the image from the upper left corner of the button
   int shift=4;
//--- Draw the button background
   this.m_canvas.FillRectangle(x1,y1,x2,y2,::ColorToARGB(this.m_butt_close_back_color,this.m_header_alpha));
//--- Draw the close button
   this.m_canvas.LineThick(x1+shift+1,y1+shift+1,x2-shift,y2-shift,::ColorToARGB(this.m_butt_close_fore_color,255),3,STYLE_SOLID,LINE_END_ROUND);
   this.m_canvas.LineThick(x1+shift+1,y2-shift-1,x2-shift,y1+shift,::ColorToARGB(this.m_butt_close_fore_color,255),3,STYLE_SOLID,LINE_END_ROUND);
//--- Remember the current background color and button design
   this.m_butt_close_back_color_c=this.m_butt_close_back_color;
   this.m_butt_close_fore_color_c=this.m_butt_close_fore_color;
//--- update the canvas without redrawing the screen
   this.m_canvas.Update(false);
  }
Die gesamte Logik ist in den Codekommentaren beschrieben: Zeichne den Hintergrund und das Schließsymbol (ein Kreuz) darüber.
Die Methode, mit der die Schaltfläche zum Schließen des Bedienfelds neu gezeichnet wird:
//+------------------------------------------------------------------+
//| Redraw the panel close button                                    |
//+------------------------------------------------------------------+
void CDashboard::RedrawButtonClose(const color new_back_color=clrNONE,const color new_fore_color=clrNONE,const ushort new_alpha=USHORT_MAX)
  {
//--- Exit if the button is not used or all passed parameters have default values
   if(!this.m_butt_close || (new_back_color==clrNONE && new_fore_color==clrNONE && new_alpha==USHORT_MAX))
      return;
//--- The button width is equal to the height of the header area
   int w=this.m_header_h;
//--- Button coordinates and size
   int x1=this.m_w-w;
   int x2=this.m_w-1;
   int y1=0;
   int y2=w-1;
//--- Shift of the upper left corner of the rectangular area of the image from the upper left corner of the button
   int shift=4;
//--- Define new background and text colors, and transparency
   color back_color=(new_back_color!=clrNONE ? new_back_color : this.m_butt_close_back_color);
   color fore_color=(new_fore_color!=clrNONE ? new_fore_color : this.m_butt_close_fore_color);
   uchar alpha=uchar(new_alpha==USHORT_MAX ? this.m_header_alpha : new_alpha>255 ? 255 : new_alpha);
//--- Draw the button background
   this.m_canvas.FillRectangle(x1,y1,x2,y2,::ColorToARGB(back_color,alpha));
//--- Draw the close button
   this.m_canvas.LineThick(x1+shift+1,y1+shift+1,x2-shift,y2-shift,::ColorToARGB(fore_color,255),3,STYLE_SOLID,LINE_END_ROUND);
   this.m_canvas.LineThick(x1+shift+1,y2-shift-1,x2-shift,y1+shift,::ColorToARGB(fore_color,255),3,STYLE_SOLID,LINE_END_ROUND);
//--- Remember the current background color and button design
   this.m_butt_close_back_color_c=back_color;
   this.m_butt_close_fore_color_c=fore_color;
//--- update the canvas without redrawing the screen
   this.m_canvas.Update(false);
  }
Um neu zu zeichnen, muss sich mindestens einer der übergebenen Parameter von dem aktuellen Parameter unterscheiden. Der Rest ist identisch mit der Methode zum Zeichnen von Schaltflächen, mit Ausnahme der Auswahl und Einstellung neuer Zeichenparameter.
Andere Methoden zum Zeichnen und erneuten Zeichnen von Schaltflächen zum Ein- und Ausklappen und Anheften:
//+------------------------------------------------------------------+
//| Draw the panel collapse/expand button                            |
//+------------------------------------------------------------------+
void CDashboard::DrawButtonMinimize(void)
  {
//--- Exit if the button is not used
   if(!this.m_butt_minimize)
      return;
//--- The button width is equal to the height of the header area
   int w=this.m_header_h;
//--- The width of the close button is zero if the button is not used
   int wc=(this.m_butt_close ? w : 0);
//--- Button coordinates and size
   int x1=this.m_w-wc-w;
   int x2=this.m_w-wc-1;
   int y1=0;
   int y2=w-1;
//--- Shift of the upper left corner of the rectangular area of the image from the upper left corner of the button
   int shift=4;
//--- Draw the button background
   this.m_canvas.FillRectangle(x1,y1,x2,y2,::ColorToARGB(this.m_butt_min_back_color,this.m_header_alpha));
//--- If the panel is collapsed, draw a rectangle
   if(this.m_minimized)
      this.m_canvas.Rectangle(x1+shift,y1+shift,x2-shift,y2-shift,::ColorToARGB(this.m_butt_min_fore_color,255));
//--- Otherwise, the panel is expanded. Draw a line segment
   else
      this.m_canvas.LineThick(x1+shift,y2-shift,x2-shift,y2-shift,::ColorToARGB(this.m_butt_min_fore_color,255),3,STYLE_SOLID,LINE_END_ROUND);
//--- Remember the current background color and button design
   this.m_butt_min_back_color_c=this.m_butt_min_back_color;
   this.m_butt_min_fore_color_c=this.m_butt_min_fore_color;
//--- update the canvas without redrawing the screen
   this.m_canvas.Update(false);
  }
//+------------------------------------------------------------------+
//| Redraw the panel collapse/expand button                          |
//+------------------------------------------------------------------+
void CDashboard::RedrawButtonMinimize(const color new_back_color=clrNONE,const color new_fore_color=clrNONE,const ushort new_alpha=USHORT_MAX)
  {
//--- Exit if the button is not used or all passed parameters have default values
   if(!this.m_butt_minimize || (new_back_color==clrNONE && new_fore_color==clrNONE && new_alpha==USHORT_MAX))
      return;
//--- The button width is equal to the height of the header area
   int w=this.m_header_h;
//--- The width of the close button is zero if the button is not used
   int wc=(this.m_butt_close ? w : 0);
//--- Button coordinates and size
   int x1=this.m_w-wc-w;
   int x2=this.m_w-wc-1;
   int y1=0;
   int y2=w-1;
//--- Shift of the upper left corner of the rectangular area of the image from the upper left corner of the button
   int shift=4;
//--- Define new background and text colors, and transparency
   color back_color=(new_back_color!=clrNONE ? new_back_color : this.m_butt_min_back_color);
   color fore_color=(new_fore_color!=clrNONE ? new_fore_color : this.m_butt_min_fore_color);
   uchar alpha=uchar(new_alpha==USHORT_MAX ? this.m_header_alpha : new_alpha>255 ? 255 : new_alpha);
//--- Draw the button background
   this.m_canvas.FillRectangle(x1,y1,x2,y2,::ColorToARGB(back_color,alpha));
//--- If the panel is collapsed, draw a rectangle
   if(this.m_minimized)
      this.m_canvas.Rectangle(x1+shift,y1+shift,x2-shift,y2-shift,::ColorToARGB(fore_color,255));
//--- Otherwise, the panel is expanded. Draw a line segment
   else
      this.m_canvas.LineThick(x1+shift,y2-shift,x2-shift,y2-shift,::ColorToARGB(fore_color,255),3,STYLE_SOLID,LINE_END_ROUND);
//--- Remember the current background color and button design
   this.m_butt_min_back_color_c=back_color;
   this.m_butt_min_fore_color_c=fore_color;
//--- update the canvas without redrawing the screen
   this.m_canvas.Update(false);
  }
//+------------------------------------------------------------------+
//| Draw the panel pin button                                        |
//+------------------------------------------------------------------+
void CDashboard::DrawButtonPin(void)
  {
//--- Exit if the button is not used
   if(!this.m_butt_pin)
      return;
//--- The button width is equal to the height of the header area
   int w=this.m_header_h;
//--- The width of the close and collapse buttons is zero if the button is not used
   int wc=(this.m_butt_close ? w : 0);
   int wm=(this.m_butt_minimize ? w : 0);
//--- Button coordinates and size
   int x1=this.m_w-wc-wm-w;
   int x2=this.m_w-wc-wm-1;
   int y1=0;
   int y2=w-1;
//--- Draw the button background
   this.m_canvas.FillRectangle(x1,y1,x2,y2,::ColorToARGB(this.m_butt_pin_back_color,this.m_header_alpha));
//--- Coordinates of the broken line points
   int x[]={x1+3, x1+6, x1+3,x1+4,x1+6,x1+9,x1+9,x1+10,x1+15,x1+14,x1+13,x1+10,x1+10,x1+9,x1+6};
   int y[]={y1+14,y1+11,y1+8,y1+7,y1+7,y1+4,y1+3,y1+2, y1+7, y1+8, y1+8, y1+11,y1+13,y1+14,y1+11};
//--- Draw the "button" shape
   this.m_canvas.Polygon(x,y,::ColorToARGB(this.m_butt_pin_fore_color,255));
//--- If the movability flag is reset (pinned) - cross out the drawn button
   if(!this.m_movable)
      this.m_canvas.Line(x1+3,y1+2,x1+15,y1+14,::ColorToARGB(this.m_butt_pin_fore_color,255));
//--- Remember the current background color and button design
   this.m_butt_pin_back_color_c=this.m_butt_pin_back_color;
   this.m_butt_pin_fore_color_c=this.m_butt_pin_fore_color;
//--- update the canvas without redrawing the screen
   this.m_canvas.Update(false);
  }
//+------------------------------------------------------------------+
//| Redraw the panel pin button                                      |
//+------------------------------------------------------------------+
void CDashboard::RedrawButtonPin(const color new_back_color=clrNONE,const color new_fore_color=clrNONE,const ushort new_alpha=USHORT_MAX)
  {
//--- Exit if the button is not used or all passed parameters have default values
   if(!this.m_butt_pin || (new_back_color==clrNONE && new_fore_color==clrNONE && new_alpha==USHORT_MAX))
      return;
//--- The button width is equal to the height of the header area
   int w=this.m_header_h;
//--- The width of the close and collapse buttons is zero if the button is not used
   int wc=(this.m_butt_close ? w : 0);
   int wm=(this.m_butt_minimize ? w : 0);
//--- Button coordinates and size
   int x1=this.m_w-wc-wm-w;
   int x2=this.m_w-wc-wm-1;
   int y1=0;
   int y2=w-1;
//--- Define new background and text colors, and transparency
   color back_color=(new_back_color!=clrNONE ? new_back_color : this.m_butt_pin_back_color);
   color fore_color=(new_fore_color!=clrNONE ? new_fore_color : this.m_butt_pin_fore_color);
   uchar alpha=uchar(new_alpha==USHORT_MAX ? this.m_header_alpha : new_alpha>255 ? 255 : new_alpha);
//--- Draw the button background
   this.m_canvas.FillRectangle(x1,y1,x2,y2,::ColorToARGB(back_color,alpha));
//--- Coordinates of the broken line points
   int x[]={x1+3, x1+6, x1+3,x1+4,x1+6,x1+9,x1+9,x1+10,x1+15,x1+14,x1+13,x1+10,x1+10,x1+9,x1+6};
   int y[]={y1+14,y1+11,y1+8,y1+7,y1+7,y1+4,y1+3,y1+2, y1+7, y1+8, y1+8, y1+11,y1+13,y1+14,y1+11};
//--- Draw the "button" shape
   this.m_canvas.Polygon(x,y,::ColorToARGB(this.m_butt_pin_fore_color,255));
//--- If the movability flag is reset (pinned) - cross out the drawn button
   if(!this.m_movable)
      this.m_canvas.Line(x1+3,y1+2,x1+15,y1+14,::ColorToARGB(this.m_butt_pin_fore_color,255));
//--- Remember the current background color and button design
   this.m_butt_pin_back_color_c=back_color;
   this.m_butt_pin_fore_color_c=fore_color;
//--- update the canvas without redrawing the screen
   this.m_canvas.Update(false);
  }
Die Methoden sind identisch mit den Methoden zum Zeichnen und erneuten Zeichnen der Schließen-Schaltfläche. Die Logik ist genau dieselbe, und sie ist in den Kommentaren zum Code beschrieben.
Die Methode, die das Panel zeichnet:
//+------------------------------------------------------------------+
//| Draw the panel                                                   |
//+------------------------------------------------------------------+
void CDashboard::Draw(const string title)
  {
//--- Set the title text
   this.m_title=title;
//--- If the collapse flag is not set, expand the panel
   if(!this.m_minimized)
      this.Expand();
//--- Otherwise, collapse the panel
   else
      this.Collapse();
//--- Update the canvas without redrawing the chart
   this.m_canvas.Update(false);
//--- Update the working space and redraw the chart
   this.m_workspace.Update();
  }
Wenn das Flag zum Zusammenklappen nicht gesetzt ist, erweitern Sie den Bereich (zeichnen Sie ihn in erweiterter Form). Wenn das Flag „collapse“ gesetzt ist, wird das Panel zusammengeklappt: Das Panel wird in zusammengeklappter Form gezeichnet, wobei nur die Kopfzeile übrig bleibt.
Die Methode zum Zusammenklappen des Panels:
//+------------------------------------------------------------------+
//| Collapse the panel                                               |
//+------------------------------------------------------------------+
void CDashboard::Collapse(void)
  {
//--- Save the pixels of the working space and the panel background into arrays
   this.SaveWorkspace();
   this.SaveBackground();
//--- Remember the current height of the panel
   int h=this.m_h;
//--- Change the dimensions (height) of the canvas and working space
   if(!this.SetSizes(this.m_canvas.Width(),this.m_header_h))
      return;
//--- Draw the header area
   this.DrawHeaderArea(this.m_title);
//--- Return the saved panel height to the variable
   this.m_h=h;
  }
Bevor wir das Panel zusammenklappen, müssen wir alle Pixel des Hintergrunds und der Arbeitsfläche in Arrays speichern. Dies ist notwendig, um das Panel schnell zu erweitern, indem man einfach die Panel-Bilder und den Arbeitsbereich aus Pixel-Arrays wiederherstellt, anstatt sie neu zu zeichnen. Außerdem können wir einige zusätzliche Verzierungen auf den Hintergrund der Tafel malen (z. B. ein Namensschild). Auch sie werden zusammen mit dem Hintergrund gespeichert und anschließend wiederhergestellt.
Die Methode, mit der das Panel erweitert wird:
//+------------------------------------------------------------------+
//| Expand the panel                                                 |
//+------------------------------------------------------------------+
void CDashboard::Expand(void)
  {
//--- Resize the panel
   if(!this.SetSizes(this.m_canvas.Width(),this.m_h))
      return;
//--- If the panel background pixels have never been saved into an array
   if(this.m_array_ppx.Size()==0)
     {
      //--- Draw the panel and
      this.m_canvas.Erase(::ColorToARGB(this.m_back_color,this.m_alpha));
      this.DrawFrame();
      this.DrawHeaderArea(this.m_title);
      //--- save the background pixels of the panel and working space into arrays
      this.SaveWorkspace();
      this.SaveBackground();
     }
//--- If the background pixels of the panel and working space were previously saved,
   else
     {
      //--- restore the background pixels of the panel and working space from arrays
      this.RestoreBackground();
      if(this.m_array_wpx.Size()>0)
         this.RestoreWorkspace();
     }
//--- If, after expanding, the panel goes beyond the chart window, adjust the panel location
   if(this.m_y+this.m_canvas.Height()>this.m_chart_h-1)
      this.Move(this.m_x,this.m_chart_h-1-this.m_canvas.Height());
  }
Wenn die Arrays, in denen die Hintergrund- und Arbeitsbereichspixel gespeichert sind, leer sind, zeichnen wir das gesamte Panel mit den Zeichenmethoden. Wenn die Felder bereits gefüllt sind, stellen wir einfach den Hintergrund des Panels und seinen Arbeitsbereich aus den Feldern wieder her.
Hilfsmethoden für die Arbeit mit Farbe:
//+------------------------------------------------------------------+
//| Returns color with a new color component                         |
//+------------------------------------------------------------------+
color CDashboard::NewColor(color base_color, int shift_red, int shift_green, int shift_blue)
  {
   double clR=0, clG=0, clB=0;
   this.ColorToRGB(base_color,clR,clG,clB);
   double clRn=(clR+shift_red  < 0 ? 0 : clR+shift_red  > 255 ? 255 : clR+shift_red);
   double clGn=(clG+shift_green< 0 ? 0 : clG+shift_green> 255 ? 255 : clG+shift_green);
   double clBn=(clB+shift_blue < 0 ? 0 : clB+shift_blue > 255 ? 255 : clB+shift_blue);
   return this.RGBToColor(clRn,clGn,clBn);
  }
//+------------------------------------------------------------------+
//| Convert RGB to color                                             |
//+------------------------------------------------------------------+
color CDashboard::RGBToColor(const double r,const double g,const double b) const
  {
   int int_r=(int)::round(r);
   int int_g=(int)::round(g);
   int int_b=(int)::round(b);
   int clr=0;
   clr=int_b;
   clr<<=8;
   clr|=int_g;
   clr<<=8;
   clr|=int_r;
//---
   return (color)clr;
  }
//+------------------------------------------------------------------+
//| Getting values of the RGB components                             |
//+------------------------------------------------------------------+
void CDashboard::ColorToRGB(const color clr,double &r,double &g,double &b)
  {
   r=GetR(clr);
   g=GetG(clr);
   b=GetB(clr);
  }
Die Methoden sind erforderlich, um die Farbe zu ändern, wenn der Cursor mit den Bedienelementen des Panels interagiert.
Die Methode zur Einstellung der Transparenz der Kopfzeile:
//+------------------------------------------------------------------+
//| Set the header transparency                                      |
//+------------------------------------------------------------------+
void CDashboard::SetHeaderTransparency(const uchar value)
  {
   this.m_header_alpha=value;
   if(this.m_header_alpha_c!=this.m_header_alpha)
      this.RedrawHeaderArea(clrNONE,NULL,clrNONE,value);
   this.m_header_alpha_c=value;
  }
Zunächst wird der an die Methode übergebene Transparenzwert in eine Variable geschrieben, die die Standardtransparenz speichert, dann wird der neue Wert mit dem aktuellen verglichen. Wenn die Werte nicht gleich sind, wird der Kopfbereich komplett neu gezeichnet. Am Ende wird die eingestellte Transparenz in die aktuelle Transparenz geschrieben.
Die Methode zur Einstellung der Transparenz des Panels:
//+------------------------------------------------------------------+
//| Set the panel transparency                                       |
//+------------------------------------------------------------------+
void CDashboard::SetTransparency(const uchar value)
  {
   this.m_alpha=value;
   if(this.m_alpha_c!=this.m_alpha)
     {
      this.m_canvas.Erase(::ColorToARGB(this.m_back_color,value));
      this.DrawFrame();
      this.RedrawHeaderArea(clrNONE,NULL,clrNONE,value);
      this.m_canvas.Update(false);
     }
   this.m_alpha_c=value;
  }
Die Logik ist ähnlich wie bei der obigen Methode. Wenn die an die Methode übergebene Transparenz nicht mit der aktuellen Transparenz übereinstimmt, wird das Panel komplett mit der neuen Transparenz neu gezeichnet.
Die Methode zur Einstellung der Standard-Schriftartenparameter des Arbeitsbereichs:
//+------------------------------------------------------------------+
//| Set the default font parameters of the working space             |
//+------------------------------------------------------------------+
void CDashboard::SetFontParams(const string name,const int size,const uint flags=0,const uint angle=0)
  {
   if(!this.m_workspace.FontSet(name,size*-10,flags,angle))
     {
      ::PrintFormat("%s: Failed to set font options. Error %lu",(string)__FUNCTION__,::GetLastError());
      return;
     }
   this.m_font=name;
   this.m_font_size=size*-10;
  }
Die an die Methode übergebenen Schriftparameter (Schriftname, Größe, Flags und Winkel) werden auf das CCanvas-Objekt des Arbeitsbereichs gesetzt und in Variablen gespeichert.
Die an die Methode übergebene Schriftgröße wird aus dem in der Anmerkung zur Funktion TextSetFont beschriebenen Grund mit -10 multipliziert:
Die Schriftgröße wird mit positiven oder negativen Werten eingestellt. Das Zeichen legt fest, ob die Textgröße von den Einstellungen des Betriebssystems abhängt (Schriftgröße).
- Ist die Größe positiv, wird sie in physische Einheiten (Pixel) umgerechnet, wenn die logische Schriftart als physische Schriftart angezeigt wird. Die Größe entspricht der Höhe der Symbolzellen der verfügbaren Schriftarten. Es wird nicht empfohlen, Texte, die mit der Funktion TextOut() angezeigt werden, und Texte, die mit dem grafischen Objekt OBJ_LABEL („Text label“) angezeigt werden, gemeinsam zu verwenden.
- Wenn die Größe negativ ist, wird angenommen, dass sie in Zehntel eines logischen Punktes festgelegt wird (der Wert -350 entspricht 35 logischen Punkten) und durch 10 geteilt wird. Der resultierende Wert wird in physikalische Einheiten des Geräts (Pixel) umgerechnet und entspricht dem absoluten Wert der Zeichenhöhe aus den verfügbaren Schriftarten. Um einen Text in der Größe des Objekts OBJ_LABEL auf dem Bildschirm zu erhalten, multiplizieren wir die in den Objekteigenschaften angegebene Schriftgröße mit -10.
Die Methode zum Aktivieren/Deaktivieren von Arbeitsmodi mit einem Chart:
//+------------------------------------------------------------------+
//| Enable/disable modes of working with the chart                   |
//+------------------------------------------------------------------+
void CDashboard::SetChartsTool(const bool flag)
  {
//--- If the 'true' flag is passed and if chart scrolling is disabled
   if(flag && !::ChartGetInteger(this.m_chart_id,CHART_MOUSE_SCROLL))
     {
      //--- enable chart scrolling, right-click menu and crosshair
      ::ChartSetInteger(0,CHART_MOUSE_SCROLL,true);
      ::ChartSetInteger(0,CHART_CONTEXT_MENU,true);
      ::ChartSetInteger(0,CHART_CROSSHAIR_TOOL,true);
     }
//--- otherwise, if the 'false' flag is passed and if chart scrolling is enabled
   else if(!flag && ::ChartGetInteger(this.m_chart_id,CHART_MOUSE_SCROLL))
     {
      //--- disable chart scrolling, right-click menu and crosshair
      ::ChartSetInteger(0,CHART_MOUSE_SCROLL,false);
      ::ChartSetInteger(0,CHART_CONTEXT_MENU,false);
      ::ChartSetInteger(0,CHART_CROSSHAIR_TOOL,false);
     }
  }
Abhängig von dem übergebenen Flag prüft die Methode den Status des Scrollens des Charts mit der Maus und aktiviert entweder alle Modi der Arbeit mit dem Chart oder deaktiviert sie. Die Überprüfung des Bildlaufmodus ist notwendig, um nicht ständig einen Befehl zum Einstellen der Modi zu senden, wenn sich der Cursor innerhalb oder außerhalb des Bedienfeldfensters befindet. Der Moduswechsel erfolgt nur, wenn der Cursor in das Feld eintritt oder wenn der Cursor seine Grenzen verlässt.
Die Methode, die eine Textnachricht an den angegebenen Koordinaten ausgibt:
//+------------------------------------------------------------------+
//| Display a text message at the specified coordinates              |
//+------------------------------------------------------------------+
void CDashboard::DrawText(const string text,const int x,const int y,const int width=WRONG_VALUE,const int height=WRONG_VALUE)
  {
//--- Declare variables to record the text width and height in them
   int w=width;
   int h=height;
//--- If the width and height of the text passed to the method have zero values,
//--- then the entire working space is completely cleared using the transparent color
   if(width==0 && height==0)
      this.m_workspace.Erase(0x00FFFFFF);
//--- Otherwise
   else
     {
      //--- If the passed width and height have default values (-1), we get its width and height from the text
      if(width==WRONG_VALUE && height==WRONG_VALUE)
         this.m_workspace.TextSize(text,w,h);
      //--- otherwise,
      else
        {
         //--- if the width passed to the method has the default value (-1) - get the width from the text, or
         //--- if the width passed to the method has a value greater than zero, use the width passed to the method, or
         //--- if the width passed to the method has a zero value, use the value 1 for the width
         w=(width ==WRONG_VALUE ? this.m_workspace.TextWidth(text)  : width>0  ? width  : 1);
         //--- if the height passed to the method has a default value (-1), get the height from the text, or
         //--- if the height passed to the method has a value greater than zero, use the height passed to the method, or
         //--- if the height passed to the method has a zero value, use value 1 for the height
         h=(height==WRONG_VALUE ? this.m_workspace.TextHeight(text) : height>0 ? height : 1);
        }
      //--- Fill the space according to the specified coordinates and the resulting width and height with a transparent color (erase the previous entry)
      this.m_workspace.FillRectangle(x,y,x+w,y+h,0x00FFFFFF);
     }
//--- Display the text to the space cleared of previous text and update the working space without redrawing the screen
   this.m_workspace.TextOut(x,y,text,::ColorToARGB(this.m_fore_color));
   this.m_workspace.Update(false);
  }
Die Arbeit mit einer Leinwand, auf der Grafiken angezeigt werden, beinhaltet das Zeichnen dieser Grafiken auf der Leinwand, so wie man einen Pinsel auf einer Leinwand nutzt. Ein auf die Leinwand gemaltes Bild wird über ein anderes, zuerst gemaltes Bild gelegt. Um ein Bild zu ersetzen, sollten Sie entweder die gesamte Leinwand neu zeichnen oder die Abmessungen des vorherigen Bildes berechnen, diesen Bereich löschen und das nächste Bild auf dem gelöschten Bereich zeichnen.
Bei Texten können wir die Abmessungen des bereits gezeichneten Textes auf der Leinwand ermitteln, um diesen Bereich zu löschen, bevor wir den nächsten Text zeichnen. Alle zuvor gezeichneten Texte und Formen irgendwo in einem Objekt zu speichern, ist keineswegs eine optimale Lösung. Daher wird hier eine Wahl zwischen Genauigkeit und Einfachheit gepaart mit Optimalität getroffen. Hier werden die Abmessungen des aktuellen Textes ermittelt (die möglicherweise nicht mit der Breite des zuvor an dieser Stelle gezeichneten Textes übereinstimmen), und diese Abmessungen werden verwendet, um den zuvor gezeichneten Text zu löschen, bevor der nächste Text angezeigt wird.
Wenn der vorherige Text nicht die gleiche Breite wie der aktuelle hat oder sogar größer ist, wird nicht der gesamte Text gelöscht. Für solche Fälle sieht die Methode die Übergabe von Parametern vor, die die gewünschten Abmessungen des gelöschten Bereichs in Höhe und Breite angeben:
- wenn die an die Methode übergebenen Werte für Breite und Höhe gleich -1 sind (Standardeinstellung), wird der Bereich, der der Breite und Höhe des aktuellen Textes entspricht, gelöscht,
- wenn Nullen übergeben werden, wird der gesamte Arbeitsbereich vollständig gelöscht,
- wenn ein Breiten- oder Höhenwert größer als Null übergeben wird, werden diese Werte für die Breite bzw. Höhe verwendet.
Die Panel-Klasse ist für die Anzeige von Daten in Tabellenform vorgesehen. Um die Berechnung der Koordinaten der auf dem Panel angezeigten Daten und die visuelle Gestaltung des Panels zu erleichtern, sind zwei Methoden vorgesehen, die die Koordinaten der Tabellenzellen berechnen und (gegebenenfalls) Namensschilder auf den Panelhintergrund zeichnen.
- Die erste Methode berechnet die Koordinaten der Tabellenzellen auf der Grundlage der ihr übergebenen Daten: die anfänglichen X- und Y-Koordinaten der Tabelle im Panel, die Anzahl der Zeilen, Spalten, Zeilenhöhe und Spaltenbreite. Wir können auch eine nutzerdefinierte eigene Farbe für die Tabellengitterlinien und das Attribut der „alternierenden“ Zeilen festlegen.
- Die zweite Methode berechnet die Größe der Zeilen und Spalten automatisch in Abhängigkeit von ihrer Anzahl und der Breite des Tabelleneinzugs von den Rändern der Platte. Bei der zweiten Methode können wir auch eine eigene Farbe für die Linien des Tabellengitters und das Attribut „abwechselnd“ für die Zeilen festlegen.
Die Methode, die ein Hintergrundgitter auf der Grundlage der angegebenen Parameter zeichnet:
//+------------------------------------------------------------------+
//| Draw the background grid                                         |
//+------------------------------------------------------------------+
void CDashboard::DrawGrid(const uint x,const uint y,const uint rows,const uint columns,const uint row_size,const uint col_size,
                          const color line_color=clrNONE,bool alternating_color=true)
  {
//--- If the panel is collapsed, leave
   if(this.m_minimized)
      return;
//--- Clear all lists of the tabular data object (remove cells from rows and all rows)
   this.m_table_data.Clear();
//--- Line height cannot be less than 2
   int row_h=int(row_size<2 ? 2 : row_size);
//--- Column width cannot be less than 2
   int col_w=int(col_size<2 ? 2 : col_size);

//--- The X1 (left) coordinate of the table cannot be less than 1 (to leave one pixel around the perimeter of the panel for the frame)
   int x1=int(x<1 ? 1 : x);
//--- Calculate the X2 coordinate (right) depending on the number of columns and their width
   int x2=x1+col_w*int(columns>0 ? columns : 1);
//--- The Y1 coordinate is located under the panel title area
   int y1=this.m_header_h+(int)y;
//--- Calculate the Y2 coordinate (bottom) depending on the number of lines and their height
   int y2=y1+row_h*int(rows>0 ? rows : 1);

//--- Get the color of the table grid lines, either by default or passed to the method
   color clr=(line_color==clrNONE ? C'200,200,200' : line_color);
//--- If the initial X coordinate is greater than 1, draw a table frame
//--- (in case of the coordinate 1, the table frame is the panel frame)
   if(x1>1)
      this.m_canvas.Rectangle(x1,y1,x2,y2,::ColorToARGB(clr,this.m_alpha));
//--- In the loop by table rows,
   for(int i=0;i<(int)rows;i++)
     {
      //--- calculate the Y coordinate of the next horizontal grid line (Y coordinate of the next table row)
      int row_y=y1+row_h*i;
      //--- if the flag of "alternating" line colors is passed and the line is even
      if(alternating_color && i%2==0)
        {
         //--- lighten the table background color and draw a background rectangle
         color new_color=this.NewColor(clr,45,45,45);
         this.m_canvas.FillRectangle(x1+1,row_y+1,x2-1,row_y+row_h-1,::ColorToARGB(new_color,this.m_alpha));
        }
      //--- Draw a table grid horizontal line
      this.m_canvas.Line(x1,row_y,x2,row_y,::ColorToARGB(clr,this.m_alpha));

      //--- Create a new table row object
      CTableRow *row_obj=new CTableRow(i);
      if(row_obj==NULL)
        {
         ::PrintFormat("%s: Failed to create table row object at index %lu",(string)__FUNCTION__,i);
         continue;
        }
      //--- Add it to the list of rows of the tabular data object
      //--- (if adding an object failed, delete the created object)
      if(!this.m_table_data.AddRow(row_obj))
         delete row_obj;
      //--- Set its Y coordinate in the created row object taking into account the offset from the panel title
      row_obj.SetY(row_y-this.m_header_h);
     }
//--- In the loop by table columns,
   for(int i=0;i<(int)columns;i++)
     {
      //--- calculate the X coordinate of the next vertical grid line (X coordinate of the next table row)
      int col_x=x1+col_w*i;
      //--- If the grid line goes beyond the panel, interrupt the loop
      if(x1==1 && col_x>=x1+m_canvas.Width()-2)
         break;
      //--- Draw a vertical line of the table grid
      this.m_canvas.Line(col_x,y1,col_x,y2,::ColorToARGB(clr,this.m_alpha));

      //--- Get the number of created rows from the table data object
      int total=this.m_table_data.RowsTotal();
      //--- In the loop by table rows
      for(int j=0;j<total;j++)
        {
         //--- get the next row
         CTableRow *row=m_table_data.GetRow(j);
         if(row==NULL)
            continue;
         //--- Create a new table cell
         CTableCell *cell=new CTableCell(row.Row(),i);
         if(cell==NULL)
           {
            ::PrintFormat("%s: Failed to create table cell object at index %lu",(string)__FUNCTION__,i);
            continue;
           }
         //--- Add the created cell to the row
         //--- (if adding an object failed, delete the created object)
         if(!row.AddCell(cell))
           {
            delete cell;
            continue;
           }
         //--- In the created cell object, set its X coordinate and the Y coordinate from the row object
         cell.SetXY(col_x,row.Y());
        }
     }
//--- Update the canvas without redrawing the chart
   this.m_canvas.Update(false);
  }
Die Logik der Methode und die Abfolge des Zeichnens einer Tabelle und des Erstellens ihrer Instanz in einem tabellarischen Datenobjekt sind im Code in fast jeder Zeile detailliert beschrieben. Die Daten, die in die Instanz der gezeichneten Tabelle im Tabellendatenobjekt geschrieben werden, werden benötigt, um die Koordinaten jeder Zelle zu erhalten, sodass es bequem ist, die erforderlichen Koordinaten anzugeben, wenn die Daten auf der Tafel angezeigt werden. Wir müssen nur die Zellennummer nach ihrer Position in der Tabelle (Zeile und Spalte) angeben und die Koordinaten der linken oberen Ecke dieser Zelle auf dem Panel ermitteln.
Die Methode zeichnet ein Hintergrundgitter mit automatischer Zellengröße:
//+------------------------------------------------------------------+
//| Draws the background grid with automatic cell sizing             |
//+------------------------------------------------------------------+
void CDashboard::DrawGridAutoFill(const uint border,const uint rows,const uint columns,const color line_color=clrNONE,bool alternating_color=true)
  {
//--- If the panel is collapsed, leave
   if(this.m_minimized)
      return;
//--- X1 (left) table coordinate
   int x1=(int)border;
//--- X2 (right) table coordinate
   int x2=this.m_canvas.Width()-(int)border-1;
//--- Y1 (upper) table coordinate
   int y1=this.m_header_h+(int)border;
//--- Y2 (lower) table coordinate
   int y2=this.m_canvas.Height()-(int)border-1;

//--- Get the color of the table grid lines, either by default or passed to the method
   color clr=(line_color==clrNONE ? C'200,200,200' : line_color);
//--- If the offset from the edge of the panel is greater than zero, draw a table border,
//--- otherwise, the panel border is used as the table border
   if(border>0)
      this.m_canvas.Rectangle(x1,y1,x2,y2,::ColorToARGB(clr,this.m_alpha));

//--- Height of the entire table grid
   int greed_h=y2-y1;
//--- Calculate the row height depending on the table height and the number of rows
   int row_h=(int)::round((double)greed_h/(double)rows);
//--- In the loop based on the number of rows
   for(int i=0;i<(int)rows;i++)
     {
      //--- calculate the Y coordinate of the next horizontal grid line (Y coordinate of the next table row)
      int row_y=y1+row_h*i;
      //--- if the flag of "alternating" line colors is passed and the line is even
      if(alternating_color && i%2==0)
        {
         //--- lighten the table background color and draw a background rectangle
         color new_color=this.NewColor(clr,45,45,45);
         this.m_canvas.FillRectangle(x1+1,row_y+1,x2-1,row_y+row_h-1,::ColorToARGB(new_color,this.m_alpha));
        }
      //--- Draw a table grid horizontal line
      this.m_canvas.Line(x1,row_y,x2,row_y,::ColorToARGB(clr,this.m_alpha));

      //--- Create a new table row object
      CTableRow *row_obj=new CTableRow(i);
      if(row_obj==NULL)
        {
         ::PrintFormat("%s: Failed to create table row object at index %lu",(string)__FUNCTION__,i);
         continue;
        }
      //--- Add it to the list of rows of the tabular data object
      //--- (if adding an object failed, delete the created object)
      if(!this.m_table_data.AddRow(row_obj))
         delete row_obj;
      //--- Set its Y coordinate in the created row object taking into account the offset from the panel title
      row_obj.SetY(row_y-this.m_header_h);
     }

//--- Table grid width
   int greed_w=x2-x1;
//--- Calculate the column width depending on the table width and the number of columns
   int col_w=(int)::round((double)greed_w/(double)columns);
//--- In the loop by table columns,
   for(int i=0;i<(int)columns;i++)
     {
      //--- calculate the X coordinate of the next vertical grid line (X coordinate of the next table row)
      int col_x=x1+col_w*i;
      //--- If this is not the very first vertical line, draw it
      //--- (the first vertical line is either the table frame or the panel frame)
      if(i>0)
         this.m_canvas.Line(col_x,y1,col_x,y2,::ColorToARGB(clr,this.m_alpha));

      //--- Get the number of created rows from the table data object
      int total=this.m_table_data.RowsTotal();
      //--- In the loop by table rows
      for(int j=0;j<total;j++)
        {
         //--- get the next row
         CTableRow *row=this.m_table_data.GetRow(j);
         if(row==NULL)
            continue;
         //--- Create a new table cell
         CTableCell *cell=new CTableCell(row.Row(),i);
         if(cell==NULL)
           {
            ::PrintFormat("%s: Failed to create table cell object at index %lu",(string)__FUNCTION__,i);
            continue;
           }
         //--- Add the created cell to the row
         //--- (if adding an object failed, delete the created object)
         if(!row.AddCell(cell))
           {
            delete cell;
            continue;
           }
         //--- In the created cell object, set its X coordinate and the Y coordinate from the row object
         cell.SetXY(col_x,row.Y());
        }
     }
//--- Update the canvas without redrawing the chart
   this.m_canvas.Update(false);
  }
Diese Methode unterscheidet sich von der oben beschriebenen nur durch die automatische Berechnung der Tabellenbreite und -höhe in Abhängigkeit vom Tabelleneinzug vom Rand der Platte, der Zeilenhöhe (Tabellenhöhe/Anzahl der Zeilen) und der Spaltenbreite (Tabellenbreite/Anzahl der Spalten). Sie ist auch direkt im Code vollständig kommentiert.
Wir müssen diese Namensschilder erstellen (auf die Tafel zeichnen), nachdem wir die Tafel erstellt und auf die Karte gezeichnet haben. Andernfalls wird das Namensschild nicht gezeichnet, aber die Tabellendaten werden alle berechnet und können verwendet werden. Mit anderen Worten: Das Zeichnen einer Tabelle nach der Anzeige eines Feldes auf einem Chart ist nur dann erforderlich, wenn eine Tabelle auf dem Feld gezeichnet werden soll.
Um den Hintergrund des Paneels und der Arbeitsfläche schnell wiederherzustellen, verwenden wir die Arrays, die die Pixel aus dem Bild der Arbeitsfläche und des Paneels erhalten, bevor das Paneel zusammengeklappt wird. Beim Erweitern eines Bedienfelds wird nicht alles neu gezeichnet, was zuvor darauf gezeichnet wurde, sondern der Hintergrund des Bedienfelds und der Arbeitsbereich werden einfach aus Pixelanordnungen wiederhergestellt. Das ist viel praktischer, als alles, was auf der Leinwand gezeichnet wurde, zu speichern, um es später neu zu zeichnen.
Es gibt zwei Methoden für das Panel und den Arbeitsbereich - für das Speichern eines Bildes in einem Pixelarray und für das Wiederherstellen eines Bildes aus einem Pixelarray.
Die Methode, die den Arbeitsbereich in der Pixelmatrix speichert:
//+------------------------------------------------------------------+
//| Save the working space to the array of pixels                    |
//+------------------------------------------------------------------+
void CDashboard::SaveWorkspace(void)
  {
//--- Calculate the required size of the array (width * height of the working space)
   uint size=this.m_workspace.Width()*this.m_workspace.Height();
//--- If the size of the array is not equal to the calculated one, change it
   if(this.m_array_wpx.Size()!=size)
     {
      ::ResetLastError();
      if(::ArrayResize(this.m_array_wpx,size)!=size)
        {
         ::PrintFormat("%s: ArrayResize failed. Error %lu",(string)__FUNCTION__,::GetLastError());
         return;
        }
     }
   uint n=0;
//--- In the loop along the height of the working space (pixel Y coordinate)
   for(int y=0;y<this.m_workspace.Height();y++)
      //--- in the loop by the working space width (pixel X coordinate)
      for(int x=0;x<this.m_workspace.Width();x++)
        {
         //--- calculate the pixel index in the receiving array
         n=this.m_workspace.Width()*y+x;
         if(n>this.m_array_wpx.Size()-1)
            break;
         //--- copy pixel to the receiving array from the working space X and Y
         this.m_array_wpx[n]=this.m_workspace.PixelGet(x,y);
        }
  }
Wir gehen jedes Pixel jeder Bildzeile in zwei verschachtelten Schleifen durch und kopieren sie in das empfangende Array.
Die Methode, die den Arbeitsbereich aus dem Array von Pixeln wiederherstellt:
//+------------------------------------------------------------------+
//| Restore the working space from the array of pixels               |
//+------------------------------------------------------------------+
void CDashboard::RestoreWorkspace(void)
  {
//--- Exit if the array is empty
   if(this.m_array_wpx.Size()==0)
      return;
   uint n=0;
//--- In the loop along the height of the working space (pixel Y coordinate)
   for(int y=0;y<this.m_workspace.Height();y++)
      //--- in the loop by the working space width (pixel X coordinate)
      for(int x=0;x<this.m_workspace.Width();x++)
        {
         //--- calculate the pixel index in the array
         n=this.m_workspace.Width()*y+x;
         if(n>this.m_array_wpx.Size()-1)
            break;
         //--- copy the pixel from the array to the X and Y coordinates of the working space
         this.m_workspace.PixelSet(x,y,this.m_array_wpx[n]);
        }
  }
In zwei verschachtelten Schleifen berechnen wir den Index jedes Pixels jeder Bildzeile im Array und kopieren sie aus dem Array in die X- und Y-Koordinaten des Bildes.
Die Methode, die den Panel-Hintergrund in einem Pixel-Array speichert:
//+------------------------------------------------------------------+
//| Save the panel background to the pixel array                     |
//+------------------------------------------------------------------+
void CDashboard::SaveBackground(void)
  {
//--- Calculate the required size of the array (panel width * height)
   uint size=this.m_canvas.Width()*this.m_canvas.Height();
//--- If the size of the array is not equal to the calculated one, change it
   if(this.m_array_ppx.Size()!=size)
     {
      ::ResetLastError();
      if(::ArrayResize(this.m_array_ppx,size)!=size)
        {
         ::PrintFormat("%s: ArrayResize failed. Error %lu",(string)__FUNCTION__,::GetLastError());
         return;
        }
     }
   uint n=0;
//--- In the loop by the panel height (pixel Y coordinate)
   for(int y=0;y<this.m_canvas.Height();y++)
      //--- in the loop by the panel width (pixel X coordinate)
      for(int x=0;x<this.m_canvas.Width();x++)
        {
         //--- calculate the pixel index in the receiving array
         n=this.m_canvas.Width()*y+x;
         if(n>this.m_array_ppx.Size()-1)
            break;
         //--- copy pixel to the receiving array from the panel X and Y
         this.m_array_ppx[n]=this.m_canvas.PixelGet(x,y);
        }
  }
Die Methode stellt den Panelhintergrund aus der Pixelmatrix wieder her:
//+------------------------------------------------------------------+
//| Restore the panel background from the array of pixels            |
//+------------------------------------------------------------------+
void CDashboard::RestoreBackground(void)
  {
//--- Exit if the array is empty
   if(this.m_array_ppx.Size()==0)
      return;
   uint n=0;
//--- In the loop by the panel height (pixel Y coordinate)
   for(int y=0;y<this.m_canvas.Height();y++)
      //--- in the loop by the panel width (pixel X coordinate)
      for(int x=0;x<this.m_canvas.Width();x++)
        {
         //--- calculate the pixel index in the array
         n=this.m_canvas.Width()*y+x;
         if(n>this.m_array_ppx.Size()-1)
            break;
         //--- copy the pixel from the array to the X and Y coordinates of the panel
         this.m_canvas.PixelSet(x,y,this.m_array_ppx[n]);
        }
  }
Um ein Objekt in den Vordergrund zu bringen, müssen wir zwei Operationen hintereinander durchführen: das Objekt ausblenden und sofort einblenden. Jedes grafische Objekt hat die Eigenschaft OBJPROP_TIMEFRAMES, die für seine Sichtbarkeit in jedem Zeitrahmen verantwortlich ist. Um ein Objekt in allen Zeitrahmen auszublenden, müssen wir diese Eigenschaft auf OBJ_NO_PERIODS setzen. Dementsprechend müssen wir, um das Objekt anzuzeigen, die Eigenschaft OBJPROP_TIMEFRAMES auf OBJ_ALL_PERIODS setzen.
Die Methode, die das Panel versteckt:
//+------------------------------------------------------------------+
//| Hide the panel                                                   |
//+------------------------------------------------------------------+
void CDashboard::Hide(const bool redraw=false)
  {
   ::ObjectSetInteger(this.m_chart_id,this.m_workspace.ChartObjectName(),OBJPROP_TIMEFRAMES,OBJ_NO_PERIODS);
   ::ObjectSetInteger(this.m_chart_id,this.m_canvas.ChartObjectName(),OBJPROP_TIMEFRAMES,OBJ_NO_PERIODS);
   if(redraw)
      ::ChartRedraw(this.m_chart_id);
  }
Bei Tafel- und Arbeitsflächenobjekten wird die Eigenschaft OBJPROP_TIMEFRAMES auf OBJ_NO_PERIODS gesetzt, und das Chart wird neu gezeichnet, um die Änderungen sofort widerzuspiegeln (wenn das entsprechende Flag gesetzt ist).
Die Methode, die das Panel anzeigt:
//+------------------------------------------------------------------+
//| Display the panel                                                |
//+------------------------------------------------------------------+
void CDashboard::Show(const bool redraw=false)
  {
   ::ObjectSetInteger(this.m_chart_id,this.m_canvas.ChartObjectName(),OBJPROP_TIMEFRAMES,OBJ_ALL_PERIODS);
   if(!this.m_minimized)
      ::ObjectSetInteger(this.m_chart_id,this.m_workspace.ChartObjectName(),OBJPROP_TIMEFRAMES,OBJ_ALL_PERIODS);
   if(redraw)
      ::ChartRedraw(this.m_chart_id);
  }
Für das Panel-Objekt wird die Eigenschaft OBJPROP_TIMEFRAMES sofort auf OBJ_ALL_PERIODS gesetzt. Für das Objekt Arbeitsbereich wird der Wert nur gesetzt, wenn sich das Panel im aufgeklappten Zustand befindet.
Wenn das Flag zum Neuzeichnen aktiviert ist, wird das Chart neu gezeichnet, um die Änderungen sofort anzuzeigen.
Die Methode, die das Panel in den Vordergrund bringt:
//+------------------------------------------------------------------+
//| Bring the panel to the foreground                                |
//+------------------------------------------------------------------+
void CDashboard::BringToTop(void)
  {
   this.Hide(false);
   this.Show(true);
  }
Zunächst werden das Bedienfeld und der Arbeitsbereich ausgeblendet, ohne dass das Chart neu gezeichnet wird, dann werden sie sofort angezeigt und das Chart wird neu gezeichnet.
In einigen Fällen, in denen Pixelarrays nicht im Speicher abgelegt werden können, müssen sie in Dateien gespeichert und dann von dort geladen werden. Die Klasse enthält Methoden zum Speichern von Pixelarrays in einer Datei und zum Laden von Pixelarrays aus der Datei:
//+------------------------------------------------------------------+
//| Save the pixel array of the working space to a file              |
//+------------------------------------------------------------------+
bool CDashboard::FileSaveWorkspace(void)
  {
//--- Define the folder and file name
   string filename=this.m_program_name+"\\Dashboard"+(string)this.m_id+"\\workspace.bin";
//--- If the saved array is empty, inform of that and return 'false'
   if(this.m_array_wpx.Size()==0)
     {
      ::PrintFormat("%s: Error. The workspace pixel array is empty.",__FUNCTION__);
      return false;
     }
//--- If the array could not be saved to a file, report this and return 'false'
   if(!::FileSave(filename,this.m_array_wpx))
     {
      ::PrintFormat("%s: FileSave '%s' failed. Error %lu",__FUNCTION__,filename,::GetLastError());
      return false;
     }
//--- Successful, return 'true'
   return true;
  }
//+------------------------------------------------------------------+
//| Save the pixel array of the panel background to a file           |
//+------------------------------------------------------------------+
bool CDashboard::FileSaveBackground(void)
  {
//--- Define the folder and file name
   string filename=this.m_program_name+"\\Dashboard"+(string)this.m_id+"\\background.bin";
//--- If the saved array is empty, inform of that and return 'false'
   if(this.m_array_ppx.Size()==0)
     {
      ::PrintFormat("%s: Error. The background pixel array is empty.",__FUNCTION__);
      return false;
     }
//--- If the array could not be saved to a file, report this and return 'false'
   if(!::FileSave(filename,this.m_array_ppx))
     {
      ::PrintFormat("%s: FileSave '%s' failed. Error %lu",__FUNCTION__,filename,::GetLastError());
      return false;
     }
//--- Successful, return 'true'
   return true;
  }
//+------------------------------------------------------------------+
//| Upload the array of working space pixels from a file             |
//+------------------------------------------------------------------+
bool CDashboard::FileLoadWorkspace(void)
  {
//--- Define the folder and file name
   string filename=this.m_program_name+"\\Dashboard"+(string)this.m_id+"\\workspace.bin";
//--- If failed to upload data from the file into the array, report this and return 'false'
   if(::FileLoad(filename,this.m_array_wpx)==WRONG_VALUE)
     {
      ::PrintFormat("%s: FileLoad '%s' failed. Error %lu",__FUNCTION__,filename,::GetLastError());
      return false;
     }
//--- Successful, return 'true'
   return true;
  }
//+------------------------------------------------------------------+
//| Upload the array of panel background pixels from a file          |
//+------------------------------------------------------------------+
bool CDashboard::FileLoadBackground(void)
  {
//--- Define the folder and file name
   string filename=this.m_program_name+"\\Dashboard"+(string)this.m_id+"\\background.bin";
//--- If failed to upload data from the file into the array, report this and return 'false'
   if(::FileLoad(filename,this.m_array_ppx)==WRONG_VALUE)
     {
      ::PrintFormat("%s: FileLoad '%s' failed. Error %lu",__FUNCTION__,filename,::GetLastError());
      return false;
     }
//--- Successful, return 'true'
   return true;
  }
Derzeit ist die Handhabung dieser Methoden noch nicht implementiert, da die Notwendigkeit dafür erst zum Zeitpunkt der Erstellung dieses Artikels entdeckt wurde. Künftige Artikel über die Dashboard-Klasse werden diese Methoden wahrscheinlich verwenden.
Indikator mit Dashboard
Um das Dashboard zu testen, erstellen wir einen einfachen Indikator, der einen regelmäßigen gleitenden Durchschnitt zeichnet. Es werden die aktuellen Geld- und Briefkurse sowie die Daten der Kerze angezeigt, über der sich der Mauszeiger gerade befindet.
Wir erstellen im Ordner Indicators einen neuen Ordner TestDashboard mit einem neuen nutzerdefinierten Indikator:
Dann legen wir die Parameter fest:
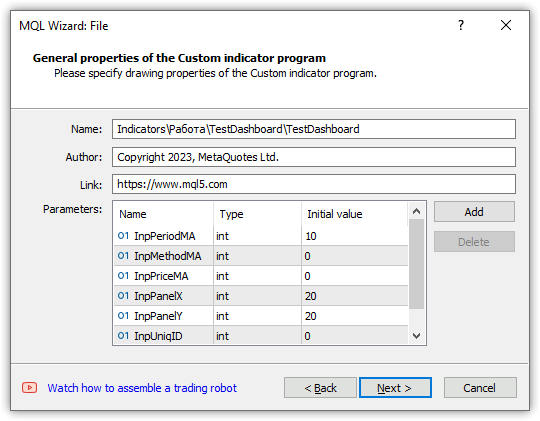
Wir wählen den ersten OnCalculate-, OnChartEvent- und OnTimer-Typ für den Fall weiterer Verbesserungen:
Wir wählen einen zu zeichnenden Puffer aus und klicken auf Fertig stellen:
Wir erhalten die folgende Vorlage:
//+------------------------------------------------------------------+
//|                                                TestDashboard.mq5 |
//|                                  Copyright 2023, MetaQuotes Ltd. |
//|                                             https://www.mql5.com |
//+------------------------------------------------------------------+
#property copyright "Copyright 2023, MetaQuotes Ltd."
#property link      "https://www.mql5.com"
#property version   "1.00"
#property indicator_chart_window
#property indicator_buffers 1
#property indicator_plots   1
//--- plot MA
#property indicator_label1  "MA"
#property indicator_type1   DRAW_LINE
#property indicator_color1  clrRed
#property indicator_style1  STYLE_SOLID
#property indicator_width1  1
//--- input parameters
input int      InpPeriodMA=10;
input int      InpMethodMA=0;
input int      InpPriceMA=0;
input int      InpPanelX=20;
input int      InpPanelY=20;
input int      InpUniqID=0;
//--- indicator buffers
double         MABuffer[];
//+------------------------------------------------------------------+
//| Custom indicator initialization function                         |
//+------------------------------------------------------------------+
int OnInit()
  {
//--- indicator buffers mapping
   SetIndexBuffer(0,MABuffer,INDICATOR_DATA);

//---
   return(INIT_SUCCEEDED);
  }
//+------------------------------------------------------------------+
//| Custom indicator iteration function                              |
//+------------------------------------------------------------------+
int OnCalculate(const int rates_total,
                const int prev_calculated,
                const datetime &time[],
                const double &open[],
                const double &high[],
                const double &low[],
                const double &close[],
                const long &tick_volume[],
                const long &volume[],
                const int &spread[])
  {
//---

//--- return value of prev_calculated for the next call
   return(rates_total);
  }
//+------------------------------------------------------------------+
//| Timer function                                                   |
//+------------------------------------------------------------------+
void OnTimer()
  {
//---

  }
//+------------------------------------------------------------------+
//| ChartEvent function                                              |
//+------------------------------------------------------------------+
void OnChartEvent(const int id,
                  const long &lparam,
                  const double &dparam,
                  const string &sparam)
  {
//---

  }
//+------------------------------------------------------------------+
Wir speichern die Panel-Objektklassendatei im erstellten Indikatorordner, sodass sich die enthaltene Panel-Klassendatei im selben Ordner wie der Indikator befindet. Nach der Fertigstellung der Panel-Klasse kann ihre endgültige Version im Include-Ordner der Datei-Sandbox des Handelsterminals abgelegt werden, um in nutzerdefinierten Programmen verwendet zu werden.
Passen wir jetzt noch die erstellte Indikatorvorlage an. Wir binden die Panel-Objektklasse ein, initialisieren die Eingänge mit verständlicheren Anfangswerten, legen den Namen des zu zeichnenden Puffers fest und deklarieren die globalen Variablen:
//+------------------------------------------------------------------+
//|                                                TestDashboard.mq5 |
//|                                  Copyright 2023, MetaQuotes Ltd. |
//|                                             https://www.mql5.com |
//+------------------------------------------------------------------+
#property copyright "Copyright 2023, MetaQuotes Ltd."
#property link      "https://www.mql5.com"
#property version   "1.00"
#property indicator_chart_window
#property indicator_buffers 1
#property indicator_plots   1
//--- plot MA
#property indicator_label1  "MA"
#property indicator_type1   DRAW_LINE
#property indicator_color1  clrRed
#property indicator_style1  STYLE_SOLID
#property indicator_width1  1
//--- includes
#include "Dashboard.mqh"
//--- input variables
input int                  InpPeriodMA =  10;            /* MA Period   */ // Moving average calculation period
input ENUM_MA_METHOD       InpMethodMA =  MODE_SMA;      /* MA Method   */ // Moving average calculation method
input ENUM_APPLIED_PRICE   InpPriceMA  =  PRICE_CLOSE;   /* MA Price    */ // Moving average calculation price
input int                  InpPanelX   =  20;            /* Dashboard X */ // Panel X coordinate
input int                  InpPanelY   =  20;            /* Dashboard Y */ // Panel Y coordinate
input int                  InpUniqID   =  0;             /* Unique ID   */ // Unique ID for the panel object
//--- indicator buffers
double         BufferMA[];
//--- global variables
CDashboard    *dashboard=NULL;
int            handle_ma;        // Moving Average indicator handle
int            period_ma;        // Moving Average calculation period
int            mouse_bar_index;  // Index of the bar the data is taken from
string         plot_label;       // Name of the graphical indicator series displayed in DataWindow
//+------------------------------------------------------------------+
//| Custom indicator initialization function                         |
//+------------------------------------------------------------------+
int OnInit()
  {
In OnInit() erstellen wir das Handle des Standardindikators gleitenden Durchschnitts, setzen Sie die Parameter des Indikators und den zu zeichnenden Puffer. Da der Indikator vom Beginn der Historie bis zu den aktuellen Daten berechnet wird, legen wir die Indizierung des Indikatorpuffers wie bei der Zeitreihe fest. Wir erstellen das Dashboard-Objekt in demselben Handler. Wir zeigen das Objekt sofort nach der Erstellung an und zeichnen das Tabellengitter. Anschließend senden wir die tabellarischen Daten an das Journal:
//+------------------------------------------------------------------+
//| Custom indicator initialization function                         |
//+------------------------------------------------------------------+
int OnInit()
  {
//--- indicator buffers mapping
   SetIndexBuffer(0,BufferMA,INDICATOR_DATA);

//--- Create indicator handle
   period_ma=(InpPeriodMA<1 ? 1 : InpPeriodMA);
   ResetLastError();
   handle_ma=iMA(Symbol(),PERIOD_CURRENT,period_ma,0,InpMethodMA,InpPriceMA);
   if(handle_ma==INVALID_HANDLE)
     {
      PrintFormat("%s Failed to create MA indicator handle. Error %lu",__FUNCTION__,GetLastError());
      return INIT_FAILED;
     }
//--- Set the indicator parameters
   IndicatorSetInteger(INDICATOR_DIGITS,Digits());
   IndicatorSetString(INDICATOR_SHORTNAME,"Test Dashboard");
//--- Set the parameters of the buffer being drawn
   plot_label="MA("+(string)period_ma+","+StringSubstr(EnumToString(Period()),7)+")";
   PlotIndexSetString(0,PLOT_LABEL,plot_label);
   ArraySetAsSeries(BufferMA,true);

//--- Create the panel object
   dashboard=new CDashboard(InpUniqID,InpPanelX,InpPanelY,200,250);
   if(dashboard==NULL)
     {
      Print("Error. Failed to create dashboard object");
      return INIT_FAILED;
     }
//--- Display the panel with the "Symbol, Timeframe description" header text
   dashboard.View(Symbol()+", "+StringSubstr(EnumToString(Period()),7));
//--- Draw the name plate on the panel background
   dashboard.DrawGridAutoFill(2,12,2);
   //dashboard.DrawGrid(2,1,12,2,19,97);
//--- Display tabular data in the journal
   dashboard.GridPrint(2);
//--- Initialize the variable with the index of the mouse cursor bar
   mouse_bar_index=0;
//--- Successful initialization
   return(INIT_SUCCEEDED);
  }
Die gesamte Logik ist im Code kommentiert. Die Tabelle wird mit automatischer Berechnung der Zeilen- und Spaltengrößen erstellt. Die Erstellung einer einfachen Tabelle ist im Code auskommentiert. Sie können das automatische Namensschild auskommentieren, das einfache auskommentieren und den Indikator neu kompilieren. Der Unterschied wird angesichts der aktuellen Tabellenparameter unbedeutend sein.
In OnDeinit() entfernen wir das Panel, geben den Indikator-Handle frei und löschen die Chart-Kommentare:
//+------------------------------------------------------------------+
//| Custom indicator deinitialization function                       |
//+------------------------------------------------------------------+
void OnDeinit(const int reason)
  {
//--- If the panel object exists, delete it
   if(dashboard!=NULL)
      delete dashboard;
//--- Release the handle of the MA indicator
   ResetLastError();
   if(!IndicatorRelease(handle_ma))
      PrintFormat("%s: IndicatorRelease failed. Error %ld",__FUNCTION__,GetLastError());
//--- Delete all comments
   Comment("");
  }
In OnCalculate() haben alle vordefinierten Zeitreihen-Arrays die gleiche Indexierung wie die Zeitreihen, sodass sie mit der Indexierung des Zeichenpuffers übereinstimmen. Alles Weitere ist in den Kommentaren zum Handler-Code beschrieben:
//+------------------------------------------------------------------+
//| Custom indicator iteration function                              |
//+------------------------------------------------------------------+
int OnCalculate(const int rates_total,
                const int prev_calculated,
                const datetime &time[],
                const double &open[],
                const double &high[],
                const double &low[],
                const double &close[],
                const long &tick_volume[],
                const long &volume[],
                const int &spread[])
  {
//--- Set indexing for the arrays as in a timeseries
   ArraySetAsSeries(time,true);
   ArraySetAsSeries(open,true);
   ArraySetAsSeries(high,true);
   ArraySetAsSeries(low,true);
   ArraySetAsSeries(close,true);
   ArraySetAsSeries(tick_volume,true);
   ArraySetAsSeries(volume,true);
   ArraySetAsSeries(spread,true);

//--- Check for the minimum number of bars for calculation
   if(rates_total<period_ma) return 0;

//--- Check and calculate the number of calculated bars
   int limit=rates_total-prev_calculated;
//--- If 'limit' is 0, then only the current bar is calculated
//--- If 'limit' is 1 (opening a new bar), then two bars are calculated - the current newly opened one and the previous one
//--- If 'limit' is more than 1, then this is either the first launch of the indicator, or some changes in history - the indicator is completely recalculated
   if(limit>1)
     {
      limit=rates_total-period_ma-1;
      ArrayInitialize(BufferMA,EMPTY_VALUE);
     }

//--- Calculate the amount of data copied from the indicator handle to the drawing buffer
   int count=(limit>1 ? rates_total : 1),copied=0;
//--- Prepare data (receive data to the moving average buffer by handle)
   copied=CopyBuffer(handle_ma,0,0,count,BufferMA);
   if(copied!=count) return 0;

//--- Loop of indicator calculation based on the moving average data
   for(int i=limit; i>=0 && !IsStopped(); i--)
     {
      // Here we calculate a certain indicator based on the standard Moving Average data
     }

//--- Receive price and timeseries data and display it on the panel
//--- At the first launch, we display the data of the current bar on the panel
   static bool first=true;
   if(first)
     {
      DrawData(0,TimeCurrent());
      first=false;
     }

//--- Declare the price structure and get the current prices
   MqlTick  tick={0};
   if(!SymbolInfoTick(Symbol(),tick))
      return 0;

//--- If the cursor is on the current bar, display the data of the current bar on the panel
   if(mouse_bar_index==0)
      DrawData(0,time[0]);
//--- Otherwise, display only the Bid and Ask prices on the panel (we update the prices on the panel at each tick)
   else
     {
      dashboard.DrawText("Bid",dashboard.CellX(0,0)+2,dashboard.CellY(0,0)+2); dashboard.DrawText(DoubleToString(tick.bid,Digits()),dashboard.CellX(0,1)+2,dashboard.CellY(0,1)+2,90);
      dashboard.DrawText("Ask",dashboard.CellX(1,0)+2,dashboard.CellY(1,0)+2); dashboard.DrawText(DoubleToString(tick.ask,Digits()),dashboard.CellX(1,1)+2,dashboard.CellY(1,1)+2,90);
     }

//--- return value of prev_calculated for the next call
   return(rates_total);
  }
In OnChartEvent() ruft der Indikator zunächst OnChartEvent die Panelbehandlung auf und verarbeitet dann die erforderlichen Ereignisse:
//+------------------------------------------------------------------+
//| ChartEvent function                                              |
//+------------------------------------------------------------------+
void OnChartEvent(const int id,
                  const long &lparam,
                  const double &dparam,
                  const string &sparam)
  {
//--- Call the panel event handler
   dashboard.OnChartEvent(id,lparam,dparam,sparam);

//--- If the cursor moves or a click is made on the chart
   if(id==CHARTEVENT_MOUSE_MOVE || id==CHARTEVENT_CLICK)
     {
      //--- Declare the variables to record time and price coordinates in them
      datetime time=0;
      double price=0;
      int wnd=0;
      //--- If the cursor coordinates are converted to date and time
      if(ChartXYToTimePrice(ChartID(),(int)lparam,(int)dparam,wnd,time,price))
        {
         //--- write the bar index where the cursor is located to a global variable
         mouse_bar_index=iBarShift(Symbol(),PERIOD_CURRENT,time);
         //--- Display the bar data under the cursor on the panel
         DrawData(mouse_bar_index,time);
        }
     }

//--- If we received a custom event, display the appropriate message in the journal
   if(id>CHARTEVENT_CUSTOM)
     {
      //--- Here we can implement handling a click on the close button on the panel
      PrintFormat("%s: Event id=%ld, object id (lparam): %lu, event message (sparam): %s",__FUNCTION__,id,lparam,sparam);
     }
  }
Hier, wenn ein Ereignis vom Panel empfangen wird, wenn die Schaltfläche „close“ angeklickt wird, und wenn es notwendig ist, auf ein solches Ereignis zu reagieren, müssen wir seine Verarbeitung registrieren. Die Entscheidung über das Programmverhalten bei diesem Ereignis liegt beim Programmentwickler.
Die Funktion, die die aktuellen Kurse und Taktdaten nach Index anzeigt:
//+------------------------------------------------------------------+
//| Display data from the specified timeseries index to the panel    |
//+------------------------------------------------------------------+
void DrawData(const int index,const datetime time)
  {
//--- Declare the variables to receive data in them
   MqlTick  tick={0};
   MqlRates rates[1];
//--- Exit if unable to get the current prices
   if(!SymbolInfoTick(Symbol(),tick))
      return;
//--- Exit if unable to get the bar data by the specified index
   if(CopyRates(Symbol(),PERIOD_CURRENT,index,1,rates)!=1)
      return;
//--- Display the current prices and data of the specified bar on the panel
   dashboard.DrawText("Bid",        dashboard.CellX(0,0)+2,   dashboard.CellY(0,0)+2);  dashboard.DrawText(DoubleToString(tick.bid,Digits()),       dashboard.CellX(0,1)+2,   dashboard.CellY(0,1)+2,90);
   dashboard.DrawText("Ask",        dashboard.CellX(1,0)+2,   dashboard.CellY(1,0)+2);  dashboard.DrawText(DoubleToString(tick.ask,Digits()),       dashboard.CellX(1,1)+2,   dashboard.CellY(1,1)+2,90);
   dashboard.DrawText("Date",       dashboard.CellX(2,0)+2,   dashboard.CellY(2,0)+2);  dashboard.DrawText(TimeToString(rates[0].time,TIME_DATE),   dashboard.CellX(2,1)+2,   dashboard.CellY(2,1)+2,90);
   dashboard.DrawText("Time",       dashboard.CellX(3,0)+2,   dashboard.CellY(3,0)+2);  dashboard.DrawText(TimeToString(rates[0].time,TIME_MINUTES),dashboard.CellX(3,1)+2,   dashboard.CellY(3,1)+2,90);

   dashboard.DrawText("Open",       dashboard.CellX(4,0)+2,   dashboard.CellY(4,0)+2);  dashboard.DrawText(DoubleToString(rates[0].open,Digits()),  dashboard.CellX(4,1)+2,   dashboard.CellY(4,1)+2,90);
   dashboard.DrawText("High",       dashboard.CellX(5,0)+2,   dashboard.CellY(5,0)+2);  dashboard.DrawText(DoubleToString(rates[0].high,Digits()),  dashboard.CellX(5,1)+2,   dashboard.CellY(5,1)+2,90);
   dashboard.DrawText("Low",        dashboard.CellX(6,0)+2,   dashboard.CellY(6,0)+2);  dashboard.DrawText(DoubleToString(rates[0].low,Digits()),   dashboard.CellX(6,1)+2,   dashboard.CellY(6,1)+2,90);
   dashboard.DrawText("Close",      dashboard.CellX(7,0)+2,   dashboard.CellY(7,0)+2);  dashboard.DrawText(DoubleToString(rates[0].close,Digits()), dashboard.CellX(7,1)+2,   dashboard.CellY(7,1)+2,90);

   dashboard.DrawText("Volume",     dashboard.CellX(8,0)+2,   dashboard.CellY(8,0)+2);  dashboard.DrawText((string)rates[0].real_volume,            dashboard.CellX(8,1)+2,   dashboard.CellY(8,1)+2,90);
   dashboard.DrawText("Tick Volume",dashboard.CellX(9,0)+2,   dashboard.CellY(9,0)+2);  dashboard.DrawText((string)rates[0].tick_volume,            dashboard.CellX(9,1)+2,   dashboard.CellY(9,1)+2,90);
   dashboard.DrawText("Spread",     dashboard.CellX(10,0)+2,  dashboard.CellY(10,0)+2); dashboard.DrawText((string)rates[0].spread,                 dashboard.CellX(10,1)+2,  dashboard.CellY(10,1)+2,90);
   dashboard.DrawText(plot_label,   dashboard.CellX(11,0)+2,  dashboard.CellY(11,0)+2); dashboard.DrawText(DoubleToString(BufferMA[index],Digits()),dashboard.CellX(11,1)+2,  dashboard.CellY(11,1)+2,90);
//--- Redraw the chart to immediately display all changes on the panel
   ChartRedraw(ChartID());
  }
Wenn wir auf die Methode DrawText des Klasse des Panels achten:
void CDashboard::DrawText(const string text,const int x,const int y,const int width=WRONG_VALUE,const int height=WRONG_VALUE)
können wir sehen, dass die X- und Y-Koordinaten nach dem Text an die Methode übergeben werden. Dies ist das, was wir von Tabellendaten erhalten, wobei die Position der Tabellenzelle durch ihre Zeilen- und Spaltennummer angegeben wird.
Zum Beispiel werden Geld- und Briefkurs (Bid und Ask) auf dem Panel an der „Adresse“ der Tabellenzellen für Bid 0,0 (Text „Bid“) und 0,1 (Geldkurs) angezeigt:
dashboard.DrawText("Bid", dashboard.CellX(0,0)+2, dashboard.CellY(0,0)+2); dashboard.DrawText(DoubleToString(tick.bid,Digits()), dashboard.CellX(0,1)+2, dashboard.CellY(0,1)+2,90);
Die Zellenwerte werden hier übernommen
für den Text „Bid“:
- CellX(0,0) — Zelle in der Zeile und Spalte Null — X-Koordinatenwert,
- CellY0,0) — Zelle in der Zeile und Spalte Null — Y-Koordinatenwert.
für den Bid-Preis:
- CellX(0,1) — Zelle in der Zeile Null und Spalte Eins — X-Koordinatenwert,
- CellY0,1) — Zelle in der Zeile Null und Spalte Eins — Y-Koordinatenwert.
Der Wert 90 für die angezeigte Textbreite in der zweiten Zelle weist auf den Fall hin, dass der aktuelle Text weniger breit sein kann als der vorherige. Daher wird der vorherige Text nicht vollständig gelöscht, und die beiden Texte überschneiden sich. Deshalb geben wir hier ausdrücklich die Breite der angezeigten Beschriftung an, die garantiert den zuvor gezeichneten Text löscht, aber nicht die angrenzenden Daten, da das Tabellenfeld, in das der Text geschrieben wird, breiter als 90 Pixel ist.
Auf diese Weise können wir für jede Tabellenzelle ihre Koordinaten im Panel abrufen und Text darin anzeigen. Da die Koordinaten für die Schnittpunkte der Tabellengitterlinien angegeben werden, werden zu den Koordinaten in X und Y zwei Pixel hinzugefügt, um den Text innerhalb der Tabellenzellen auszurichten.
Nach der Erstellung des Indikators und dem Start im Chart werden die Daten aus der erstellten und im Panel gezeichneten Tabelle im Journal angezeigt:
Table: Rows: 12, Columns: 2
  Row   0    Column   0      Cell X:  2      Cell Y:  2
  Row   0    Column   1      Cell X:  100    Cell Y:  2
  Row   1    Column   0      Cell X:  2      Cell Y:  21
  Row   1    Column   1      Cell X:  100    Cell Y:  21
  Row   2    Column   0      Cell X:  2      Cell Y:  40
  Row   2    Column   1      Cell X:  100    Cell Y:  40
  Row   3    Column   0      Cell X:  2      Cell Y:  59
  Row   3    Column   1      Cell X:  100    Cell Y:  59
  Row   4    Column   0      Cell X:  2      Cell Y:  78
  Row   4    Column   1      Cell X:  100    Cell Y:  78
  Row   5    Column   0      Cell X:  2      Cell Y:  97
  Row   5    Column   1      Cell X:  100    Cell Y:  97
  Row   6    Column   0      Cell X:  2      Cell Y:  116
  Row   6    Column   1      Cell X:  100    Cell Y:  116
  Row   7    Column   0      Cell X:  2      Cell Y:  135
  Row   7    Column   1      Cell X:  100    Cell Y:  135
  Row   8    Column   0      Cell X:  2      Cell Y:  154
  Row   8    Column   1      Cell X:  100    Cell Y:  154
  Row   9    Column   0      Cell X:  2      Cell Y:  173
  Row   9    Column   1      Cell X:  100    Cell Y:  173
  Row   10   Column   0      Cell X:  2      Cell Y:  192
  Row   10   Column   1      Cell X:  100    Cell Y:  192
  Row   11   Column   0      Cell X:  2      Cell Y:  211
  Row   11   Column   1      Cell X:  100    Cell Y:  211
Wenn wir zwei Indikatoren mit einem Panel auf demselben Chart starten und dabei unterschiedliche Werte für die eindeutige ID des Panels angeben, funktionieren sie unabhängig voneinander:
Hier sehen wir, dass die Felder zwar getrennt funktionieren, aber jeder Indikator sein eigenes Feld hat. Allerdings gibt es auch einen Konflikt: Wenn die Tafeln bewegt werden, versucht auch das Chart, sich zu bewegen. Dies geschieht, weil ein Feld, das wir verschieben, das Verschieben des Charts deaktiviert, während das zweite es aktiviert, wenn wir sehen, dass der Cursor außerhalb des Feldes ist.
Um dieses Verhalten loszuwerden, ist es am einfachsten, eine Semaphore in den globalen Terminalvariablen anzulegen, in die die ID des aktiven Panels geschrieben wird. Die anderen werden sich nicht in die Verwaltung der Karte einmischen, wenn sie dort etwas anderes als ihre ID sehen.
Wenn wir den Indikator im visuellen Modus des Testers laufen lassen und versuchen, das Panel zu verschieben, bewegt es sich mit einigen Schwierigkeiten über den Bildschirm. Gleichzeitig können die Daten aus den Balken des getesteten Charts abgerufen werden - wenn Sie auf einen Balken klicken, werden seine Daten auf dem Panel angezeigt. Auch mit der rechten Maustaste (halten Sie sie gedrückt und bewegen Sie den Cursor entlang des Charts) können Sie das Feld anzeigen, in dem sich der Cursor gerade befindet, und die Daten anzeigen oder das Feld am Kopfbereich anfassen und an die gewünschte Stelle verschieben. Leider müssen wir im visuellen Modus des Testers aufgrund der unvollständigen Implementierung der Ereignisbehandlung auf solche Tricks zurückgreifen.
Schlussfolgerung
Heute haben wir ein kleines Panel erstellt, das bei der Entwicklung nutzerdefinierter Strategien unter Verwendung von Indikatoren helfen kann. In den folgenden Artikeln werden wir uns mit der Einbeziehung von Indikatoren und der Handhabung ihrer Daten in EAs für alle Standardindikatoren befassen.
Übersetzt aus dem Russischen von MetaQuotes Ltd.
Originalartikel: https://www.mql5.com/ru/articles/13179
Warnung: Alle Rechte sind von MetaQuotes Ltd. vorbehalten. Kopieren oder Vervielfältigen untersagt.
Dieser Artikel wurde von einem Nutzer der Website verfasst und gibt dessen persönliche Meinung wieder. MetaQuotes Ltd übernimmt keine Verantwortung für die Richtigkeit der dargestellten Informationen oder für Folgen, die sich aus der Anwendung der beschriebenen Lösungen, Strategien oder Empfehlungen ergeben.

- Freie Handelsapplikationen
- Über 8.000 Signale zum Kopieren
- Wirtschaftsnachrichten für die Lage an den Finanzmärkte
Sie stimmen der Website-Richtlinie und den Nutzungsbedingungen zu.
Artem, ich habe eine Frage. In der Methode void CDashboard::Move(int x, int y) gibt es so etwas:
Insbesondere bin ich an diesem Block interessiert. D.h. wenn die Höhe des Panels kleiner ist als die des Diagrammfensters, und wenn sein Y-Punkt (obere linke Ecke) niedriger ist als die Differenz zwischen der Fensterhöhe und der Panelhöhe, korrigiert um 2 Pixel, dann wird dem oberen Punkt des Panels der Wert dieser Differenz zugewiesen. Warum ist das so, was ist der Grund dafür?
Kurz gesagt, es liegt an der Methode CDashboard::Move(int x, int y), dass es zum Hängenbleiben kommt. Wenn Sie versuchen, das Panel zu verschieben, nachdem Sie die Größe des Diagramms geändert haben, werden die Koordinaten ständig korrigiert und Sie können das Panel-Fenster nicht frei verschieben...
Move(int x, int y)
Irgendwo gibt es einen Fehler. Sie müssen die Koordinaten- und Größenwerte ausdrucken (oder im Debugger nachsehen, aber das funktioniert oft nicht).
Hier ist die Logik in den Kommentaren:
Wenn Sie versuchen, das Panel zu verschieben, nachdem Sie die Größe des Diagramms geändert haben, korrigiert es ständig die Koordinaten und lässt Sie das Panel-Fenster nicht frei bewegen...
Wahrscheinlich ist der Wert der Variable this.m_higher_wnd in der Methode Move() nicht relevant. Diese Werte werden im Eventhandler gesetzt:
Es ist durchaus möglich, dass hier irgendwo die Oversize-Flags nicht korrekt gesetzt werden, wenn das Diagrammfenster erweitert wird.
Wenn Sie diese Zeilen
ganz am Anfang der Move()-Methode schreiben, um das Setzen der korrekten Werte bei jeder Mausbewegung zu erzwingen, wird der Fehler dann verschwinden? Wenn ja, bedeutet dies, dass der Fehler in den Werten dieser Variablen liegt, und Sie müssen im Event-Handler nachsehen, warum sie ihre Werte nicht erhalten, wenn das Fenster erweitert wird. Wenn dort alles normal ist, müssen Sie die Methode Move() ausdrucken, um den Fehler zu finden.
Der Fehler ist verschwunden. Ich habe diese Änderungen an der Methode CDashboard::OnChartEvent() vorgenommen:
Um die CDashboard:: Move()-Methode nicht ständig zu laden, habe ich die Überprüfung auf Übergrößen-Flags in den Blöcken hinzugefügt, in denen die Breite und Höhe des Diagrammfensters direkt geändert werden.
Der Fehler ist verschwunden. In der Methode CDashboard::OnChartEvent() habe ich diese Änderungen vorgenommen:
Um die Methode CDashboard:: Move() nicht ständig zu laden, habe ich die Überprüfung auf Übergrößen-Flags in den Blöcken hinzugefügt, in denen die Breite und Höhe des Diagrammfensters direkt geändert werden.