
Modelos prontos para integrar indicadores nos Expert Advisors (Parte 1): Osciladores

Conteúdo
- Introdução
- Average True Range
- Bears Power
- Bulls Power
- Chaikin Oscillator
- Commodity Channel Index
- DeMarker
- Force Index
- MACD
- Momentum
- Moving Average of Oscillator
- Relative Strength Index
- Relative Vigor Index
- Stochastic Oscillator
- Triple Exponential Average
- Williams' Percent Range
- Considerações finais
Introdução
Embora integrar indicadores ao EA e usar os dados do buffer de indicador no EA seja uma tarefa bastante simples, é necessário consultar os materiais de referência o tempo todo. De fato, é preciso lembrar todos os parâmetros passados para a função de criação do indicador, preparar parte deles como parâmetros de entrada do EA, verificar se estão corretos, etc. Já para acessar os dados, a pessoa tem de escrever funções que retornem os dados necessários a partir da barra desejada. Tudo isso requer tempo para consultar a documentação, inserir as variáveis necessárias no EA, escrever funções para receber e monitorar dados para detectar sinais, etc.
É por isso que o objetivo deste artigo é criar modelos para acoplar indicadores aos Expert Advisors. Veremos os indicadores da categoria Oscilador, suas variáveis de entrada, a criação de um handle de indicador e a recuperação dos dados necessários a partir dele. Para cada indicador, escreveremos:
- um exemplo de parâmetros de entrada;
- a inicialização dos parâmetros de entrada e criação do handle;
- a desinicialização;
- a recuperação de dados da linha de indicador especificada mediante o índice de série temporal especificado;
- o controle dos valores dos dados obtidos em relação ao estado da linha e seu estado em relação a algum nível.
Por estado da linha, entenderemos sua aparência e forma:
- Direção para cima (o valor 2 é menor ou igual ao valor 1, e o valor 1 é menor que o valor 0)
- Direção para baixo (o valor 2 é maior ou igual ao valor 1, e o valor 1 é maior que o valor 0)
- Reversão para cima (o valor 2 é maior que o valor 1, e o valor 1 é menor que o valor 0)
- Reversão para baixo (o valor 2 é menor que o valor 1, e o valor 1 é maior que o valor 0)
- Parada da direção para cima (o valor 2 é menor ou igual ao valor 1, e o valor 1 é igual ao valor 0)
- Parada da direção para baixo (o valor 2 é maior ou igual ao valor 1, e o valor 1 é igual ao valor 0)
- Estado indefinido (estados não previstos)
Por estado da linha em relação a algum nível, entenderemos:
- Acima do valor (o valor da linha é maior que o valor do nível)
- Abaixo do valor (o valor da linha é menor que o valor do nível)
- Cruzamento do valor para cima (o valor 1 é menor ou igual ao valor do nível na barra 1, e o valor 0 é maior que o valor do nível na barra 0)
- Cruzamento do valor para baixo (o valor 1 é maior ou igual ao valor do nível na barra 1, e o valor 0 é menor que o valor do nível na barra 0)
- Toque do valor por baixo (o valor 1 é menor que o valor do nível na barra 1, e o valor 0 é igual ao valor do nível na barra 0)
- Toque do valor por cima (o valor 1 é maior que o valor do nível na barra 1, e o valor 0 é igual ao valor do nível na barra 0)
- Igual ao valor (os valores da linha nas barras 1 e 0 são iguais ao valor do nível nas barras 1 e 0)
Essas condições são suficientes para determinar os estados da linha (sua forma ou aparência nos dois segmentos entre a 2ª, a 1ª e a barra zero) e os cruzamentos com outras linhas de indicadores ou níveis horizontais.
Controlaremos esses estados escrevendo funções universais comuns a todos os indicadores. Também a função para acessar dados do buffer do indicador será comum a todo e qualquer indicador.
Lembre que todos os exemplos e códigos propostos no artigo serão blocos de código na íntegra e poderão ser usados "como estão" nos programas que você criar.
Average True Range
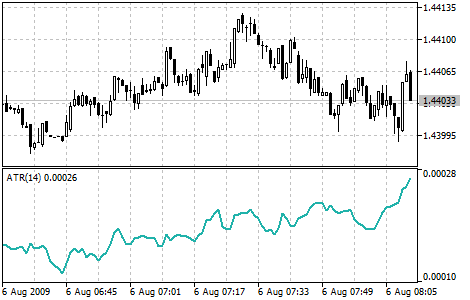
O indicador técnico Média de Amplitude de Variação (Average True Range, ATR) é um indicador de volatilidade do mercado. Foi introduzido por Welles Wilder em seu livro "New Concepts in Technical Trading Systems" e desde então o indicador tem sido usado como componente de muitos outros indicadores e sistemas de trading.
O indicador Average True Range frequentemente atinge valores altos nas bases do mercado após uma queda rápida nos preços causada por vendas em pânico. E alcança valores baixos, geralmente, após longos períodos de movimento horizontal, observados nos topos do mercado e durante a consolidação. Ele pode ser interpretado de acordo com os mesmos princípios que os outros indicadores de volatilidade. Agora já é possível fazer previsões com o Average True Range da seguinte forma: quanto maior o valor do indicador, maior a probabilidade de mudança de tendência; quanto menor o valor, mais fraca a direção da tendência.
A Amplitude de Variação (True Range) é o maior dos seguintes três valores:
- a diferença entre os atuais máximo e mínimo;
- a diferença entre o preço de fechamento anterior e o máximo atual;
- a diferença entre o preço de fechamento anterior e o mínimo atual.
O indicador Média de Amplitude de Variação (Average True Range, ATR) é uma média móvel dos valores de amplitude de variação verdadeira.
Parâmetros
O indicador tem apenas um parâmetro ajustável: o período de suavização da média móvel. Por padrão, é 14.
Vamos supor que todos os parâmetros de entrada de todos os indicadores serão definidos como parâmetros ajustáveis do EA.
Criaremos um modelo de EA vazio:

Inseriremos um nome e um parâmetro de entrada:
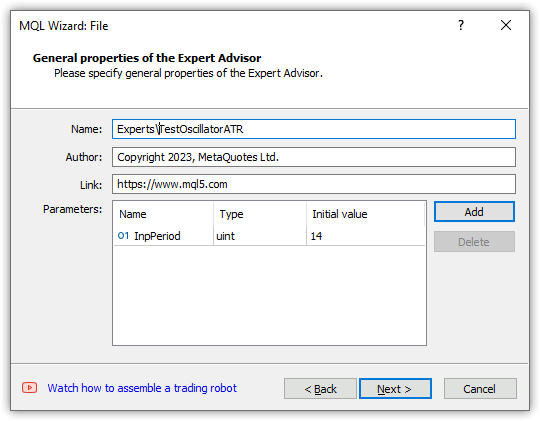
Dentre os manipuladores, escolheremos temporizador e manipulador de eventos:
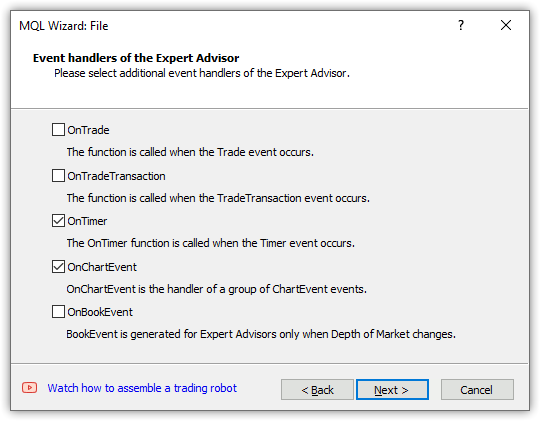
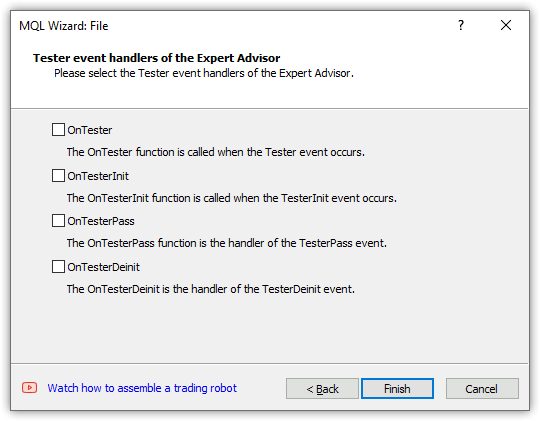
e clicaremos em "Concluir". Como resultado, obteremos um modelo vazio do EA:
//+------------------------------------------------------------------+
//|                                            TestOscillatorATR.mq5 |
//|                                  Copyright 2023, MetaQuotes Ltd. |
//|                                             https://www.mql5.com |
//+------------------------------------------------------------------+
#property copyright "Copyright 2023, MetaQuotes Ltd."
#property link      "https://www.mql5.com"
#property version   "1.00"
//--- input parameters
input uint     InpPeriod=14;
//+------------------------------------------------------------------+
//| Expert initialization function                                   |
//+------------------------------------------------------------------+
int OnInit()
  {
//--- create timer
   EventSetTimer(60);

//---
   return(INIT_SUCCEEDED);
  }
//+------------------------------------------------------------------+
//| Expert deinitialization function                                 |
//+------------------------------------------------------------------+
void OnDeinit(const int reason)
  {
//--- destroy timer
   EventKillTimer();

  }
//+------------------------------------------------------------------+
//| Expert tick function                                             |
//+------------------------------------------------------------------+
void OnTick()
  {
//---

  }
//+------------------------------------------------------------------+
//| Timer function                                                   |
//+------------------------------------------------------------------+
void OnTimer()
  {
//---

  }
//+------------------------------------------------------------------+
//| ChartEvent function                                              |
//+------------------------------------------------------------------+
void OnChartEvent(const int id,
                  const long &lparam,
                  const double &dparam,
                  const string &sparam)
  {
//---

  }
//+------------------------------------------------------------------+
O código será inserido apenas no escopo global: variáveis e funções. Nos manipuladores OnInit() e OnDeinit(), escreveremos a inicialização e o controle dos parâmetros do indicador, criação e exclusão do handle do indicador. Nos Expert Advisors de teste, será usado uma painel de informação, no qual serão exibidos os dados recebidos do indicador com a descrição dos estados das linhas do indicador. No manipulador OnChartEvent() do Expert Advisor, será escrita apenas a manipulação de eventos para trabalhar com o painel. Ou seja, para trabalhar efetivamente com o indicador no EA, basta usar: exemplos/inicialização das variáveis criadas, criação/exclusão do handle do indicador e funções gerais para receber dados a partir de buffers de qualquer indicador. Tudo o resto nos exemplos é apenas trabalho com o painel.
Adicionaremos uma descrição ao parâmetro de entrada e variáveis globais para a criação do indicador e trabalho com ele:
//--- input parameters
input uint  InpPeriod   =  14;   /* ATR Period  */
//--- global variables
int      handle=INVALID_HANDLE;  // Indicator handle
int      period=0;               // ATR calculation period
int      ind_digits=0;           // Number of decimal places in the indicator values
string   ind_title;              // Indicator description
No artigo anterior, criamos um painel que pode ser usado em indicadores e Expert Advisors. Agora a classe está um pouco modificada e pode gerar quantas tabelas forem necessárias no painel para distribuir os dados nelas. Hoje não vamos descrever as alterações feitas por aqui, mas voltaremos a elas um pouco mais tarde - nos próximos artigos, descreveremos brevemente as alterações e os aprimoramentos introduzidos. Para testar os Experts deste artigo, o arquivo de classes do painel deve estar localizado em \MQL5\Include\Dashboard\Dashboard.mqh. O arquivo com o código-fonte das classes do painel está anexado ao artigo junto com os arquivos dos EAs de teste.
Integraremos o arquivo do painel de informações ao código do EA e escreveremos variáveis globais para trabalhar com o painel:
#property copyright "Copyright 2023, MetaQuotes Ltd."
#property link      "https://www.mql5.com"
#property version   "1.00"
//--- includes
#include <Dashboard\Dashboard.mqh>
//--- input parameters
input uint  InpPeriod   =  14;   /* ATR Period  */
//--- global variables
int      handle=INVALID_HANDLE;  // Indicator handle
int      period=0;               // ATR calculation period
int      ind_digits=0;           // Number of decimal places in the indicator values
string   ind_title;              // Indicator description
//--- variables for the panel
int      mouse_bar_index;        // Index of the bar the data is taken from
CDashboard *panel=NULL;          // Pointer to the panel object
Acima, examinamos as possíveis classificações do estado da linha de indicador. Na minha opinião, a mais prático é criar uma enumeração com todas as variantes, e obter da função que determina o estado da linha do indicador, o resultado em uma variável desse tipo de enumeração. Criaremos essa enumeração no escopo global, e finalmente obteremos esse cabeçalho:
#property copyright "Copyright 2023, MetaQuotes Ltd."
#property link      "https://www.mql5.com"
#property version   "1.00"
//--- includes
#include <Dashboard\Dashboard.mqh>
//--- enums
enum ENUM_LINE_STATE
  {
   LINE_STATE_NONE,        // Undefined state
   LINE_STATE_UP,          // Upward
   LINE_STATE_DOWN,        // Downward
   LINE_STATE_TURN_UP,     // Upward reversal
   LINE_STATE_TURN_DOWN,   // Downward reversal
   LINE_STATE_STOP_UP,     // Upward stop
   LINE_STATE_STOP_DOWN,   // Downward stop
   LINE_STATE_ABOVE,       // Above value
   LINE_STATE_UNDER,       // Below value
   LINE_STATE_CROSS_UP,    // Crossing value upwards
   LINE_STATE_CROSS_DOWN,  // Crossing value downwards
   LINE_STATE_TOUCH_BELOW, // Touching value from below
   LINE_STATE_TOUCH_ABOVE, // Touch value from above
   LINE_STATE_EQUALS,      // Equal to value
  };
//--- input parameters
input uint  InpPeriod   =  14;   /* ATR Period  */
//--- global variables
int      handle=INVALID_HANDLE;  // Indicator handle
int      period=0;               // ATR calculation period
int      ind_digits=0;           // Number of decimal places in the indicator values
string   ind_title;              // Indicator description
//--- variables for the panel
int      mouse_bar_index;        // Index of the bar the data is taken from
CDashboard *panel=NULL;          // Pointer to the panel object
Em seguida, precisamos verificar os valores dos parâmetros de entrada e ajustá-los, se necessário.
Inicialização
Para todos os indicadores, basta inserir zero como valor do período para que o valor padrão seja definido. Desse modo, o mesmo comportamento deve ser reproduzido no EA, de modo que, ao definir o valor zero no valor do período de suavização, o EA criará um indicador idêntico ao padrão, que também terá seu período definido como zero. Nesse caso, esse deve se tornar o valor padrão para ambos os indicadores. Ademais, ao inserir um um no valor do período, alguns indicadores não são calculados. O que significa que seu período mínimo é igual a dois. Outro aspecto é que o número de dígitos após o ponto decimal é diferente para cada indicador e deve ser verificado e avaliado ao utilizar o indicador. É importante observar todas essas nuances. Bem, todos os modelos incluídos no artigo contemplam todas essas nuances, dito isso, todas as verificações já foram concluídas e são devidamente executadas. Basta copiar o código do artigo para o código de seu Expert Advisor e usá-lo.
Manipulador OnInit() do EA com a configuração dos valores das variáveis do indicador e criação do handle do indicador:
//+------------------------------------------------------------------+
//| Expert initialization function                                   |
//+------------------------------------------------------------------+
int OnInit()
  {
//--- create timer
   EventSetTimer(60);

//--- Indicator
//--- Set and adjust the calculation period if necessary
   period=int(InpPeriod<1 ? 14 : InpPeriod);
//--- Set the indicator name and the number of decimal places
   ind_title=StringFormat("ATR(%lu)",period);
   ind_digits=Digits();
//--- Create indicator handle
   ResetLastError();
   handle=iATR(Symbol(),PERIOD_CURRENT,period);
   if(handle==INVALID_HANDLE)
     {
      PrintFormat("%s: Failed to create indicator handle %s. Error %ld",__FUNCTION__,ind_title,GetLastError());
      return INIT_FAILED;
     }

//--- Successful initialization
   return(INIT_SUCCEEDED);
  }
//+------------------------------------------------------------------+
Para usar o painel de informações no EA, adicionaremos um bloco de código no seu manipulador OnInit(). Assim, o código completo do manipulador será (criação do indicador e criação do painel):
//+------------------------------------------------------------------+
//| Expert initialization function                                   |
//+------------------------------------------------------------------+
int OnInit()
  {
//--- create timer
   EventSetTimer(60);

//--- Indicator
//--- Set and adjust the calculation period if necessary
   period=int(InpPeriod<1 ? 14 : InpPeriod);
//--- Set the indicator name and the number of decimal places
   ind_title=StringFormat("ATR(%lu)",period);
   ind_digits=Digits();
//--- Create indicator handle
   ResetLastError();
   handle=iATR(Symbol(),PERIOD_CURRENT,period);
   if(handle==INVALID_HANDLE)
     {
      PrintFormat("%s: Failed to create indicator handle %s. Error %ld",__FUNCTION__,ind_title,GetLastError());
      return INIT_FAILED;
     }

//--- Dashboard
//--- Create the panel
   panel=new CDashboard(1,20,20,199,225);
   if(panel==NULL)
     {
      Print("Error. Failed to create panel object");
      return INIT_FAILED;
     }
//--- Set font parameters
   panel.SetFontParams("Calibri",9);
//--- Display the panel with the "Symbol, Timeframe description" header text
   panel.View(Symbol()+", "+StringSubstr(EnumToString(Period()),7));
//--- Create a table with ID 0 to display bar data in it
   panel.CreateNewTable(0);
//--- Draw a table with ID 0 on the panel background
   panel.DrawGrid(0,2,20,6,2,18,97);

//--- Create a table with ID 1 to display indicator data in it
   panel.CreateNewTable(1);
//--- Get the Y2 table coordinate with ID 0 and
//--- set the Y1 coordinate for the table with ID 1
   int y1=panel.TableY2(0)+22;
//--- Draw a table with ID 1 on the panel background
   panel.DrawGrid(1,2,y1,3,2,18,97);

//--- Display tabular data in the journal
   panel.GridPrint(0,2);
   panel.GridPrint(1,2);
//--- Initialize the variable with the index of the mouse cursor bar
   mouse_bar_index=0;
//--- Display the data of the current bar on the panel
   DrawData(mouse_bar_index,TimeCurrent());

//--- Successful initialization
   return(INIT_SUCCEEDED);
  }
Para criar o indicador, basta o código a cores. O painel deste artigo e dos Expert Advisors de teste a seguir é criado para mostrar visualmente os dados que receberemos do indicador.
Desinicialização
No manipulador OnDeinit() do EA, é necessário liberar o handle do indicador criado
//+------------------------------------------------------------------+
//| Expert deinitialization function                                 |
//+------------------------------------------------------------------+
void OnDeinit(const int reason)
  {
//--- destroy timer
   EventKillTimer();

//--- Release handle of the indicator
   ResetLastError();
   if(!IndicatorRelease(handle))
      PrintFormat("%s: IndicatorRelease failed. Error %ld",__FUNCTION__,GetLastError());
//--- Clear all comments on the chart
   Comment("");
  }
Caso seja usado o painel, é preciso também remover o objeto de painel criado:
//+------------------------------------------------------------------+
//| Expert deinitialization function                                 |
//+------------------------------------------------------------------+
void OnDeinit(const int reason)
  {
//--- destroy timer
   EventKillTimer();

//--- Release handle of the indicator
   ResetLastError();
   if(!IndicatorRelease(handle))
      PrintFormat("%s: IndicatorRelease failed. Error %ld",__FUNCTION__,GetLastError());
//--- Clear all comments on the chart
   Comment("");

//--- If the panel object exists, delete it
   if(panel!=NULL)
      delete panel;
  }
Recuperação de dados
Para acessar dados do buffer do indicador, deve-se usar a função CopyBuffer(). A função coloca no array buffer os dados do buffer especificado do indicador especificado na quantidade especificada.
Existem três maneiras de acessar dados:
Acesso pela posição inicial e quantidade de elementos necessários:
int  CopyBuffer(
   int       indicator_handle,     // indicator handle
   int       buffer_num,           // indicator buffer index
   int       start_pos,            // starting point
   int       count,                // amount to copy
   double    buffer[]              // array the data to be copied to
   );
Acesso pela data inicial e quantidade de elementos necessários:
int  CopyBuffer(
   int       indicator_handle,     // indicator handle
   int       buffer_num,           // indicator buffer index
   datetime  start_time,           // starting date
   int       count,                // amount to copy
   double    buffer[]              // array the data to be copied to
   );
Acesso pelas datas inicial e final do intervalo de tempo necessário:
int  CopyBuffer(
   int       indicator_handle,     // indicator handle
   int       buffer_num,           // indicator buffer index
   datetime  start_time,           // starting date
   datetime  stop_time,            // end time
   double    buffer[]              // array the data to be copied to
   );
Vamos usar a primeira alternativa de recuperação de dados, que é pelo índice da barra.
A função receberá o handle do indicador necessário, o índice da barra e o número do buffer de indicador e retornará o valor recebido da linha do indicador especificada pelo índice de barra especificado ou EMPTY_VALUE se houver falha no acesso aos dados:
//+------------------------------------------------------------------+
//| Return the indicator data on the specified bar                   |
//+------------------------------------------------------------------+
double IndicatorValue(const int ind_handle,const int index,const int buffer_num)
  {
   double array[1]={0};
   ResetLastError();
   if(CopyBuffer(ind_handle,buffer_num,index,1,array)!=1)
     {
      PrintFormat("%s: CopyBuffer failed. Error %ld",__FUNCTION__,GetLastError());
      return EMPTY_VALUE;
     }
   return array[0];
  }
É importante observar que a função CopyBuffer() permite recuperar não apenas um valor de uma única barra por vez, mas, sim, uma faixa especificada de valores da linha do indicador de uma só vez. Esse recurso não será usado aqui, de modo a não complicar o controle sobre o estado da linha do indicador, armazenando em algum lugar da memória a faixa de valores obtida e, em seguida, calculando os valores necessários a partir dela por deslocamentos do índice especificado. Em vez disso, tudo será mais simples: se precisarmos recuperar o valor pelo índice especificado, nós o recuperaremos; se precisarmos compará-lo com outro valor, recuperaremos outro valor e, em seguida, compararemos os valores obtidos. Isso é mais simples e mais prático para manter a versatilidade da função.
Função que retorna o estado da linha do indicador:
//+------------------------------------------------------------------+
//| Return the state of the indicator line                           |
//+------------------------------------------------------------------+
ENUM_LINE_STATE LineState(const int ind_handle,const int index,const int buffer_num)
  {
//--- Get the values of the indicator line with the shift (0,1,2) relative to the passed index
   const double value0=IndicatorValue(ind_handle,index,  buffer_num);
   const double value1=IndicatorValue(ind_handle,index+1,buffer_num);
   const double value2=IndicatorValue(ind_handle,index+2,buffer_num);
//--- If at least one of the values could not be obtained, return an undefined value
   if(value0==EMPTY_VALUE || value1==EMPTY_VALUE || value2==EMPTY_VALUE)
      return LINE_STATE_NONE;
//--- Line upward reversal (value2>value1 && value0>value1)
   if(NormalizeDouble(value2-value1,ind_digits)>0 && NormalizeDouble(value0-value1,ind_digits)>0)
      return LINE_STATE_TURN_UP;
//--- Line upward direction (value2<=value1 && value0>value1)
   else if(NormalizeDouble(value2-value1,ind_digits)<=0 && NormalizeDouble(value0-value1,ind_digits)>0)
      return LINE_STATE_UP;
//--- Line upward stop (value2<=value1 && value0==value1)
   else if(NormalizeDouble(value2-value1,ind_digits)<=0 && NormalizeDouble(value0-value1,ind_digits)==0)
      return LINE_STATE_STOP_UP;
//--- Line downward reversal (value2<value1 && value0<value1)
   if(NormalizeDouble(value2-value1,ind_digits)<0 && NormalizeDouble(value0-value1,ind_digits)<0)
      return LINE_STATE_TURN_DOWN;
//--- Line downward direction (value2>=value1 && value0<value1)
   else if(NormalizeDouble(value2-value1,ind_digits)>=0 && NormalizeDouble(value0-value1,ind_digits)<0)
      return LINE_STATE_DOWN;
//--- Line downward stop (value2>=value1 && value0==value1)
   else if(NormalizeDouble(value2-value1,ind_digits)>=0 && NormalizeDouble(value0-value1,ind_digits)==0)
      return LINE_STATE_STOP_DOWN;
//--- Undefined state
   return LINE_STATE_NONE;
  }
Aqui, recuperamos os valores da linha de indicador de três barras - da barra atual e das duas barras anteriores. Isso é suficiente para obter uma configuração simples da aparência da linha. A função recebe o índice da barra mais à direita das três barras, por exemplo, com o índice 15. Nesse caso, as barras 17, 16 e 15 são usadas para calcular o estado da linha. Como estamos trabalhando com números reais, para comparar os valores de cada barra, usamos a diferença normalizada entre dois valores e a comparamos com zero.
Função que retorna o estado da linha do indicador em relação ao nível especificado:
//+------------------------------------------------------------------+
//| Return the state of the line relative to the specified level     |
//+------------------------------------------------------------------+
ENUM_LINE_STATE LineStateRelative(const int ind_handle,const int index,const int buffer_num,const double level0,const double level1=EMPTY_VALUE)
  {
//--- Get the values of the indicator line with the shift (0,1) relative to the passed index
   const double value0=IndicatorValue(ind_handle,index,  buffer_num);
   const double value1=IndicatorValue(ind_handle,index+1,buffer_num);
//--- If at least one of the values could not be obtained, return an undefined value
   if(value0==EMPTY_VALUE || value1==EMPTY_VALUE)
      return LINE_STATE_NONE;
//--- Define the second level to compare
   double level=(level1==EMPTY_VALUE ? level0 : level1);
//--- The line is below the level (value1<level && value0<level0)
   if(NormalizeDouble(value1-level,ind_digits)<0 && NormalizeDouble(value0-level0,ind_digits)<0)
      return LINE_STATE_UNDER;
//--- The line is above the level (value1>level && value0>level0)
   if(NormalizeDouble(value1-level,ind_digits)>0 && NormalizeDouble(value0-level0,ind_digits)>0)
      return LINE_STATE_ABOVE;
//--- The line crossed the level upwards (value1<=level && value0>level0)
   if(NormalizeDouble(value1-level,ind_digits)<=0 && NormalizeDouble(value0-level0,ind_digits)>0)
      return LINE_STATE_CROSS_UP;
//--- The line crossed the level downwards (value1>=level && value0<level0)
   if(NormalizeDouble(value1-level,ind_digits)>=0 && NormalizeDouble(value0-level0,ind_digits)<0)
      return LINE_STATE_CROSS_DOWN;
//--- The line touched the level from below (value1<level0 && value0==level0)
   if(NormalizeDouble(value1-level,ind_digits)<0 && NormalizeDouble(value0-level0,ind_digits)==0)
      return LINE_STATE_TOUCH_BELOW;
//--- The line touched the level from above (value1>level0 && value0==level0)
   if(NormalizeDouble(value1-level,ind_digits)>0 && NormalizeDouble(value0-level0,ind_digits)==0)
      return LINE_STATE_TOUCH_BELOW;
//--- Line is equal to the level value (value1==level0 && value0==level0)
   if(NormalizeDouble(value1-level,ind_digits)==0 && NormalizeDouble(value0-level0,ind_digits)==0)
      return LINE_STATE_EQUALS;
//--- Undefined state
   return LINE_STATE_NONE;
  }
A função verifica se os valores de duas linhas de indicador de duas barras vizinhas estão relacionados entre si, tendo em vista o nível passado nos parâmetros. Os parâmetros incluem o índice da barra direita (das duas barras de onde os valores da linha de indicador são retirados) e o valor do nível (que deve ser usado para comparar os valores das duas barras da linha de modo a descobrir sua relação).
Se for necessário obter uma relação com um nível horizontal, esse nível deverá ser passado no parâmetro level0. O segundo parâmetro do nível, level1, por padrão, é igual a EMPTY_VALUE, o que indica que ambos os valores da linha de indicador de duas barras adjacentes serão comparados apenas com um valor passado em level0. (a barra da linha no índice+1 é comparada com o valor level0, e a barra no índice é comparada com level0).
Se um valor diferente de EMPTY_VALUE for passado para level1, então cada barra da linha do indicador dos dois é comparada com os dois valores correspondentes em level1 e level0 (a barra da linha no índice+1 é comparada com o valor de level1, e a barra no índice é comparada com level0). Dessa forma, a linha do indicador pode ser comparada com outra linha do mesmo ou de outro indicador, para identificar suas relações, especialmente cruzamentos.
Para descrever os estados e relações identificados da linha de indicador, escreveremos uma função que retorna a descrição do estado da linha do indicador:
//+------------------------------------------------------------------+
//| Return the indicator line state description                      |
//+------------------------------------------------------------------+
string LineStateDescription(const ENUM_LINE_STATE state)
  {
   switch(state)
     {
      case LINE_STATE_UP         :  return "Up";
      case LINE_STATE_STOP_UP    :  return "Stop Up";
      case LINE_STATE_TURN_UP    :  return "Turn Up";
      case LINE_STATE_DOWN       :  return "Down";
      case LINE_STATE_STOP_DOWN  :  return "Stop Down";
      case LINE_STATE_TURN_DOWN  :  return "Turn Down";
      case LINE_STATE_ABOVE      :  return "Above level";
      case LINE_STATE_UNDER      :  return "Under level";
      case LINE_STATE_CROSS_UP   :  return "Crossing Up";
      case LINE_STATE_CROSS_DOWN :  return "Crossing Down";
      case LINE_STATE_TOUCH_BELOW:  return "Touch from Below";
      case LINE_STATE_TOUCH_ABOVE:  return "Touch from Above";
      case LINE_STATE_EQUALS     :  return "Equals";
      default                    :  return "Unknown";
     }
  }
As três funções discutidas anteriormente podem ser usadas "como estão" nos EAs para recuperar dados dos indicadores e controlar seu estado e arranjo mútuo.
Como exemplo de como recuperar dados do indicador e exibir suas descrições, criaremos no EA uma função que exibe os dados recebidos do indicador no painel de informações:
//+------------------------------------------------------------------+
//| Display data from the specified timeseries index to the panel    |
//+------------------------------------------------------------------+
void DrawData(const int index,const datetime time)
  {
//--- Declare the variables to receive data in them
   MqlTick  tick={0};
   MqlRates rates[1];

//--- Exit if unable to get the current prices
   if(!SymbolInfoTick(Symbol(),tick))
      return;
//--- Exit if unable to get the bar data by the specified index
   if(CopyRates(Symbol(),PERIOD_CURRENT,index,1,rates)!=1)
      return;

//--- Set font parameters for bar and indicator data headers
   int  size=0;
   uint flags=0;
   uint angle=0;
   string name=panel.FontParams(size,flags,angle);
   panel.SetFontParams(name,9,FW_BOLD);
   panel.DrawText("Bar data ["+(string)index+"]",3,panel.TableY1(0)-16,clrMaroon,panel.Width()-6);
   panel.DrawText("Indicator data ["+(string)index+"]",3,panel.TableY1(1)-16,clrGreen,panel.Width()-6);
//--- Set font parameters for bar and indicator data
   panel.SetFontParams(name,9);

//--- Display the data of the specified bar in table 0 on the panel
   panel.DrawText("Date",  panel.CellX(0,0,0)+2, panel.CellY(0,0,0)+2); panel.DrawText(TimeToString(  rates[0].time,TIME_DATE),     panel.CellX(0,0,1)+2, panel.CellY(0,0,1)+2,clrNONE,90);
   panel.DrawText("Time",  panel.CellX(0,1,0)+2, panel.CellY(0,1,0)+2); panel.DrawText(TimeToString(  rates[0].time,TIME_MINUTES),  panel.CellX(0,1,1)+2, panel.CellY(0,1,1)+2,clrNONE,90);
   panel.DrawText("Open",  panel.CellX(0,2,0)+2, panel.CellY(0,2,0)+2); panel.DrawText(DoubleToString(rates[0].open,Digits()),      panel.CellX(0,2,1)+2, panel.CellY(0,2,1)+2,clrNONE,90);
   panel.DrawText("High",  panel.CellX(0,3,0)+2, panel.CellY(0,3,0)+2); panel.DrawText(DoubleToString(rates[0].high,Digits()),      panel.CellX(0,3,1)+2, panel.CellY(0,3,1)+2,clrNONE,90);
   panel.DrawText("Low",   panel.CellX(0,4,0)+2, panel.CellY(0,4,0)+2); panel.DrawText(DoubleToString(rates[0].low,Digits()),       panel.CellX(0,4,1)+2, panel.CellY(0,4,1)+2,clrNONE,90);
   panel.DrawText("Close", panel.CellX(0,5,0)+2, panel.CellY(0,5,0)+2); panel.DrawText(DoubleToString(rates[0].close,Digits()),     panel.CellX(0,5,1)+2, panel.CellY(0,5,1)+2,clrNONE,90);

//--- Display the indicator data from the specified bar on the panel in table 1
   panel.DrawText(ind_title, panel.CellX(1,0,0)+2, panel.CellY(1,0,0)+2);
   double value=IndicatorValue(handle,index,0);
   string value_str=(value!=EMPTY_VALUE ? DoubleToString(value,ind_digits) : "");
   panel.DrawText(value_str,panel.CellX(1,0,1)+2,panel.CellY(1,0,1)+2,clrNONE,90);

//--- Display a description of the indicator line state
   panel.DrawText("Line state", panel.CellX(1,1,0)+2, panel.CellY(1,1,0)+2);
   ENUM_LINE_STATE state=LineState(handle,index,0);
   panel.DrawText(LineStateDescription(state),panel.CellX(1,1,1)+2,panel.CellY(1,1,1)+2,clrNONE,90);

//--- Redraw the chart to immediately display all changes on the panel
   ChartRedraw(ChartID());
  }
Essa função já foi usada nos exemplos do artigo anterior ao criar o painel de informações. Aqui, os dados dos barras sob o cursor são exibidos na primeira tabela do painel, e os dados do indicador e o estado de sua linha, na segunda.
Para o funcionamento do painel, é necessário adicionar código no manipulador de eventos OnChartEvent():
//+------------------------------------------------------------------+
//| ChartEvent function                                              |
//+------------------------------------------------------------------+
void OnChartEvent(const int id,
                  const long &lparam,
                  const double &dparam,
                  const string &sparam)
  {
//--- Handling the panel
//--- Call the panel event handler
   panel.OnChartEvent(id,lparam,dparam,sparam);

//--- If the cursor moves or a click is made on the chart
   if(id==CHARTEVENT_MOUSE_MOVE || id==CHARTEVENT_CLICK)
     {
      //--- Declare the variables to record time and price coordinates in them
      datetime time=0;
      double price=0;
      int wnd=0;
      //--- If the cursor coordinates are converted to date and time
      if(ChartXYToTimePrice(ChartID(),(int)lparam,(int)dparam,wnd,time,price))
        {
         //--- write the bar index where the cursor is located to a global variable
         mouse_bar_index=iBarShift(Symbol(),PERIOD_CURRENT,time);
         //--- Display the bar data under the cursor on the panel
         DrawData(mouse_bar_index,time);
        }
     }

//--- If we received a custom event, display the appropriate message in the journal
   if(id>CHARTEVENT_CUSTOM)
     {
      //--- Here we can implement handling a click on the close button on the panel
      PrintFormat("%s: Event id=%ld, object id (lparam): %lu, event message (sparam): %s",__FUNCTION__,id,lparam,sparam);
     }
  }
A lógica do manipulador já foi discutida no artigo anterior. Aqui, usamos como está.
Se agora compilarmos o EA e o executarmos em um gráfico com os parâmetros padrão, previamente aplicando o indicador ATR também com parâmetros padrão, veremos o painel de informações, cujos dados mudam à medida que movemos o cursor pelo gráfico:
O arquivo do EA de teste TestOscillatorATR.mq5 pode ser encontrado nos arquivos anexados ao artigo.
Bears Power
Cada dia de negociação representa uma luta entre compradores ("touros"), que tentam elevar o preço, e vendedores ("ursos"), que empurram o preço para baixo. Dependendo de qual lado prevalece, o dia termina com um preço mais alto ou mais baixo em comparação com o dia anterior, e os resultados intermediários, principalmente os preços máximos e mínimos, permitem julgar como a luta se desenrolou ao longo do dia.
A tarefa de avaliar o equilíbrio de forças dos "ursos" é muito importante, pois a mudança desse equilíbrio é um dos primeiros sinais que podem prever uma possível mudança de tendência. Essa tarefa é resolvida pelo oscilador Bears Power, que foi desenvolvido por Alexander Elder e descrito em seu livro "Como se transformar em um operador e investidor de sucesso". Na sua formulação, Elder usou as seguintes premissas:
- a média móvel é um acordo sobre o preço entre vendedores e compradores durante um determinado período de tempo,
- o preço mínimo reflete a máxima força dos vendedores durante o dia.
Baseado nessas premissas, Elder desenvolveu o Bear Power como a diferença entre o preço mínimo e a média móvel exponencial de 13 períodos (LOW - EMA).
Este indicador é melhor usado em conjunto com um dos indicadores de tendência (geralmente uma média móvel):
- se o indicador de tendência estiver subindo e o índice de força dos ursos estiver abaixo de zero mas aumentando, isso é um sinal de compra;
- é desejável que, ao mesmo tempo, seja formada uma divergência nos fundos no gráfico do indicador.
Parâmetros
O indicador tem um parâmetro ajustável, nomeadamente o período de cálculo. Por padrão, o valor é 13.
Incluiremos no código os parâmetros e variáveis para trabalhar com o indicador:
//+------------------------------------------------------------------+
//|                                          TestOscillatorBears.mq5 |
//|                                  Copyright 2023, MetaQuotes Ltd. |
//|                                             https://www.mql5.com |
//+------------------------------------------------------------------+
#property copyright "Copyright 2023, MetaQuotes Ltd."
#property link      "https://www.mql5.com"
#property version   "1.00"
//--- enums
enum ENUM_LINE_STATE
  {
   LINE_STATE_NONE,        // Undefined state
   LINE_STATE_UP,          // Upward
   LINE_STATE_DOWN,        // Downward
   LINE_STATE_TURN_UP,     // Upward reversal
   LINE_STATE_TURN_DOWN,   // Downward reversal
   LINE_STATE_STOP_UP,     // Upward stop
   LINE_STATE_STOP_DOWN,   // Downward stop
   LINE_STATE_ABOVE,       // Above value
   LINE_STATE_UNDER,       // Below value
   LINE_STATE_CROSS_UP,    // Crossing value upwards
   LINE_STATE_CROSS_DOWN,  // Crossing value downwards
   LINE_STATE_TOUCH_BELOW, // Touching value from below
   LINE_STATE_TOUCH_ABOVE, // Touch value from above
   LINE_STATE_EQUALS,      // Equal to value
  };
//--- input parameters
input uint  InpPeriod   =  13;   /* Bears Power Period   */
//--- global variables
int      handle=INVALID_HANDLE;  // Indicator handle
int      period=0;               // Bears Power calculation period
int      ind_digits=0;           // Number of decimal places in the indicator values
string   ind_title;              // Indicator description
Ao usar o painel, integraremos o arquivo da classe do painel de informações e adicionaremos variáveis para trabalhar com ele:
//+------------------------------------------------------------------+
//|                                          TestOscillatorBears.mq5 |
//|                                  Copyright 2023, MetaQuotes Ltd. |
//|                                             https://www.mql5.com |
//+------------------------------------------------------------------+
#property copyright "Copyright 2023, MetaQuotes Ltd."
#property link      "https://www.mql5.com"
#property version   "1.00"
//--- includes
#include <Dashboard\Dashboard.mqh>
//--- enums
enum ENUM_LINE_STATE
  {
   LINE_STATE_NONE,        // Undefined state
   LINE_STATE_UP,          // Upward
   LINE_STATE_DOWN,        // Downward
   LINE_STATE_TURN_UP,     // Upward reversal
   LINE_STATE_TURN_DOWN,   // Downward reversal
   LINE_STATE_STOP_UP,     // Upward stop
   LINE_STATE_STOP_DOWN,   // Downward stop
   LINE_STATE_ABOVE,       // Above value
   LINE_STATE_UNDER,       // Below value
   LINE_STATE_CROSS_UP,    // Crossing value upwards
   LINE_STATE_CROSS_DOWN,  // Crossing value downwards
   LINE_STATE_TOUCH_BELOW, // Touching value from below
   LINE_STATE_TOUCH_ABOVE, // Touch value from above
   LINE_STATE_EQUALS,      // Equal to value
  };
//--- input parameters
input uint  InpPeriod   =  13;   /* Bears Power Period   */
//--- global variables
int      handle=INVALID_HANDLE;  // Indicator handle
int      period=0;               // Bears Power calculation period
int      ind_digits=0;           // Number of decimal places in the indicator values
string   ind_title;              // Indicator description
//--- variables for the panel
int      mouse_bar_index;        // Index of the bar the data is taken from
CDashboard *panel=NULL;          // Pointer to the panel object
Inicialização
No manipulador OnInit(), inicializaremos e ajustaremos os parâmetros de entrada do indicador e criaremos seu handle:
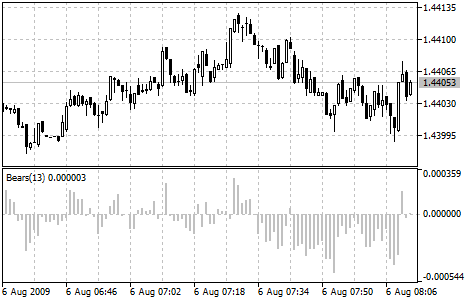
//+------------------------------------------------------------------+
//| Expert initialization function                                   |
//+------------------------------------------------------------------+
int OnInit()
  {
//--- create timer
   EventSetTimer(60);

//--- Indicator
//--- Set and adjust the calculation period if necessary
   period=int(InpPeriod<1 ? 13 : InpPeriod);
//--- Set the indicator name and the number of decimal places
   ind_title=StringFormat("Bears(%lu)",period);
   ind_digits=Digits()+1;
//--- Create indicator handle
   ResetLastError();
   handle=iBearsPower(Symbol(),PERIOD_CURRENT,period);
   if(handle==INVALID_HANDLE)
     {
      PrintFormat("%s: Failed to create indicator handle %s. Error %ld",__FUNCTION__,ind_title,GetLastError());
      return INIT_FAILED;
     }

//--- Successful initialization
   return(INIT_SUCCEEDED);
  }
Ao usar o painel de informações no EA, criaremos o painel aqui também:
//+------------------------------------------------------------------+
//| Expert initialization function                                   |
//+------------------------------------------------------------------+
int OnInit()
  {
//--- create timer
   EventSetTimer(60);

//--- Indicator
//--- Set and adjust the calculation period if necessary
   period=int(InpPeriod<1 ? 13 : InpPeriod);
//--- Set the indicator name and the number of decimal places
   ind_title=StringFormat("Bears(%lu)",period);
   ind_digits=Digits()+1;
//--- Create indicator handle
   ResetLastError();
   handle=iBearsPower(Symbol(),PERIOD_CURRENT,period);
   if(handle==INVALID_HANDLE)
     {
      PrintFormat("%s: Failed to create indicator handle %s. Error %ld",__FUNCTION__,ind_title,GetLastError());
      return INIT_FAILED;
     }

//--- Dashboard
//--- Create the panel
   panel=new CDashboard(1,20,20,199,225);
   if(panel==NULL)
     {
      Print("Error. Failed to create panel object");
      return INIT_FAILED;
     }
//--- Set font parameters
   panel.SetFontParams("Calibri",9);
//--- Display the panel with the "Symbol, Timeframe description" header text
   panel.View(Symbol()+", "+StringSubstr(EnumToString(Period()),7));
//--- Create a table with ID 0 to display bar data in it
   panel.CreateNewTable(0);
//--- Draw a table with ID 0 on the panel background
   panel.DrawGrid(0,2,20,6,2,18,97);

//--- Create a table with ID 1 to display indicator data in it
   panel.CreateNewTable(1);
//--- Get the Y2 table coordinate with ID 0 and
//--- set the Y1 coordinate for the table with ID 1
   int y1=panel.TableY2(0)+22;
//--- Draw a table with ID 1 on the panel background
   panel.DrawGrid(1,2,y1,3,2,18,97);

//--- Display tabular data in the journal
   panel.GridPrint(0,2);
   panel.GridPrint(1,2);
//--- Initialize the variable with the index of the mouse cursor bar
   mouse_bar_index=0;
//--- Display the data of the current bar on the panel
   DrawData(mouse_bar_index,TimeCurrent());

//--- Successful initialization
   return(INIT_SUCCEEDED);
  }
Desinicialização
No manipulador OnDeinit() do EA, liberaremos o handle do indicador:
//+------------------------------------------------------------------+
//| Expert deinitialization function                                 |
//+------------------------------------------------------------------+
void OnDeinit(const int reason)
  {
//--- destroy timer
   EventKillTimer();

//--- Release handle of the indicator
   ResetLastError();
   if(!IndicatorRelease(handle))
      PrintFormat("%s: IndicatorRelease failed. Error %ld",__FUNCTION__,GetLastError());
//--- Clear all comments on the chart
   Comment("");
  }
Se o painel for usado no EA, então removeremos o objeto criado da classe do painel:
//+------------------------------------------------------------------+
//| Expert deinitialization function                                 |
//+------------------------------------------------------------------+
void OnDeinit(const int reason)
  {
//--- destroy timer
   EventKillTimer();

//--- Release handle of the indicator
   ResetLastError();
   if(!IndicatorRelease(handle))
      PrintFormat("%s: IndicatorRelease failed. Error %ld",__FUNCTION__,GetLastError());
//--- Clear all comments on the chart
   Comment("");

//--- If the panel object exists, delete it
   if(panel!=NULL)
      delete panel;
  }
Recuperação de dados
Para recuperar dados do indicador, já escrevemos funções comuns a todos os indicadores:
//+------------------------------------------------------------------+
//| Return the indicator data on the specified bar                   |
//+------------------------------------------------------------------+
double IndicatorValue(const int ind_handle,const int index,const int buffer_num)
  {
   double array[1]={0};
   ResetLastError();
   if(CopyBuffer(ind_handle,buffer_num,index,1,array)!=1)
     {
      PrintFormat("%s: CopyBuffer failed. Error %ld",__FUNCTION__,GetLastError());
      return EMPTY_VALUE;
     }
   return array[0];
  }
//+------------------------------------------------------------------+
//| Return the state of the indicator line                           |
//+------------------------------------------------------------------+
ENUM_LINE_STATE LineState(const int ind_handle,const int index,const int buffer_num)
  {
//--- Get the values of the indicator line with the shift (0,1,2) relative to the passed index
   const double value0=IndicatorValue(ind_handle,index,  buffer_num);
   const double value1=IndicatorValue(ind_handle,index+1,buffer_num);
   const double value2=IndicatorValue(ind_handle,index+2,buffer_num);
//--- If at least one of the values could not be obtained, return an undefined value
   if(value0==EMPTY_VALUE || value1==EMPTY_VALUE || value2==EMPTY_VALUE)
      return LINE_STATE_NONE;
//--- Line upward reversal (value2>value1 && value0>value1)
   if(NormalizeDouble(value2-value1,ind_digits)>0 && NormalizeDouble(value0-value1,ind_digits)>0)
      return LINE_STATE_TURN_UP;
//--- Line upward direction (value2<=value1 && value0>value1)
   else if(NormalizeDouble(value2-value1,ind_digits)<=0 && NormalizeDouble(value0-value1,ind_digits)>0)
      return LINE_STATE_UP;
//--- Line upward stop (value2<=value1 && value0==value1)
   else if(NormalizeDouble(value2-value1,ind_digits)<=0 && NormalizeDouble(value0-value1,ind_digits)==0)
      return LINE_STATE_STOP_UP;
//--- Line downward reversal (value2<value1 && value0<value1)
   if(NormalizeDouble(value2-value1,ind_digits)<0 && NormalizeDouble(value0-value1,ind_digits)<0)
      return LINE_STATE_TURN_DOWN;
//--- Line downward direction (value2>=value1 && value0<value1)
   else if(NormalizeDouble(value2-value1,ind_digits)>=0 && NormalizeDouble(value0-value1,ind_digits)<0)
      return LINE_STATE_DOWN;
//--- Line downward stop (value2>=value1 && value0==value1)
   else if(NormalizeDouble(value2-value1,ind_digits)>=0 && NormalizeDouble(value0-value1,ind_digits)==0)
      return LINE_STATE_STOP_DOWN;
//--- Undefined state
   return LINE_STATE_NONE;
  }
//+------------------------------------------------------------------+
//| Return the state of the line relative to the specified level     |
//+------------------------------------------------------------------+
ENUM_LINE_STATE LineStateRelative(const int ind_handle,const int index,const int buffer_num,const double level0,const double level1=EMPTY_VALUE)
  {
//--- Get the values of the indicator line with the shift (0,1) relative to the passed index
   const double value0=IndicatorValue(ind_handle,index,  buffer_num);
   const double value1=IndicatorValue(ind_handle,index+1,buffer_num);
//--- If at least one of the values could not be obtained, return an undefined value
   if(value0==EMPTY_VALUE || value1==EMPTY_VALUE)
      return LINE_STATE_NONE;
//--- Define the second level to compare
   double level=(level1==EMPTY_VALUE ? level0 : level1);
//--- The line is below the level (value1<level && value0<level0)
   if(NormalizeDouble(value1-level,ind_digits)<0 && NormalizeDouble(value0-level0,ind_digits)<0)
      return LINE_STATE_UNDER;
//--- The line is above the level (value1>level && value0>level0)
   if(NormalizeDouble(value1-level,ind_digits)>0 && NormalizeDouble(value0-level0,ind_digits)>0)
      return LINE_STATE_ABOVE;
//--- The line crossed the level upwards (value1<=level && value0>level0)
   if(NormalizeDouble(value1-level,ind_digits)<=0 && NormalizeDouble(value0-level0,ind_digits)>0)
      return LINE_STATE_CROSS_UP;
//--- The line crossed the level downwards (value1>=level && value0<level0)
   if(NormalizeDouble(value1-level,ind_digits)>=0 && NormalizeDouble(value0-level0,ind_digits)<0)
      return LINE_STATE_CROSS_DOWN;
//--- The line touched the level from below (value1<level0 && value0==level0)
   if(NormalizeDouble(value1-level,ind_digits)<0 && NormalizeDouble(value0-level0,ind_digits)==0)
      return LINE_STATE_TOUCH_BELOW;
//--- The line touched the level from above (value1>level0 && value0==level0)
   if(NormalizeDouble(value1-level,ind_digits)>0 && NormalizeDouble(value0-level0,ind_digits)==0)
      return LINE_STATE_TOUCH_BELOW;
//--- Line is equal to the level value (value1==level0 && value0==level0)
   if(NormalizeDouble(value1-level,ind_digits)==0 && NormalizeDouble(value0-level0,ind_digits)==0)
      return LINE_STATE_EQUALS;
//--- Undefined state
   return LINE_STATE_NONE;
  }
//+------------------------------------------------------------------+
//| Return the indicator line state description                      |
//+------------------------------------------------------------------+
string LineStateDescription(const ENUM_LINE_STATE state)
  {
   switch(state)
     {
      case LINE_STATE_UP         :  return "Up";
      case LINE_STATE_STOP_UP    :  return "Stop Up";
      case LINE_STATE_TURN_UP    :  return "Turn Up";
      case LINE_STATE_DOWN       :  return "Down";
      case LINE_STATE_STOP_DOWN  :  return "Stop Down";
      case LINE_STATE_TURN_DOWN  :  return "Turn Down";
      case LINE_STATE_ABOVE      :  return "Above level";
      case LINE_STATE_UNDER      :  return "Under level";
      case LINE_STATE_CROSS_UP   :  return "Crossing Up";
      case LINE_STATE_CROSS_DOWN :  return "Crossing Down";
      case LINE_STATE_TOUCH_BELOW:  return "Touch from Below";
      case LINE_STATE_TOUCH_ABOVE:  return "Touch from Above";
      case LINE_STATE_EQUALS     :  return "Equals";
      default                    :  return "Unknown";
     }
  }
Em cada exemplo de como usar indicadores neste artigo, nós os usaremos sem nenhuma alteração.
Se o painel de informações for usado no EA, escreveremos uma função que exibe os dados recebidos do indicador no painel de informações:
//+------------------------------------------------------------------+
//| Display data from the specified timeseries index to the panel    |
//+------------------------------------------------------------------+
void DrawData(const int index,const datetime time)
  {
//--- Declare the variables to receive data in them
   MqlTick  tick={0};
   MqlRates rates[1];

//--- Exit if unable to get the current prices
   if(!SymbolInfoTick(Symbol(),tick))
      return;
//--- Exit if unable to get the bar data by the specified index
   if(CopyRates(Symbol(),PERIOD_CURRENT,index,1,rates)!=1)
      return;

//--- Set font parameters for bar and indicator data headers
   int  size=0;
   uint flags=0;
   uint angle=0;
   string name=panel.FontParams(size,flags,angle);
   panel.SetFontParams(name,9,FW_BOLD);
   panel.DrawText("Bar data ["+(string)index+"]",3,panel.TableY1(0)-16,clrMaroon,panel.Width()-6);
   panel.DrawText("Indicator data ["+(string)index+"]",3,panel.TableY1(1)-16,clrGreen,panel.Width()-6);
//--- Set font parameters for bar and indicator data
   panel.SetFontParams(name,9);

//--- Display the data of the specified bar in table 0 on the panel
   panel.DrawText("Date",  panel.CellX(0,0,0)+2, panel.CellY(0,0,0)+2); panel.DrawText(TimeToString(  rates[0].time,TIME_DATE),     panel.CellX(0,0,1)+2, panel.CellY(0,0,1)+2,clrNONE,90);
   panel.DrawText("Time",  panel.CellX(0,1,0)+2, panel.CellY(0,1,0)+2); panel.DrawText(TimeToString(  rates[0].time,TIME_MINUTES),  panel.CellX(0,1,1)+2, panel.CellY(0,1,1)+2,clrNONE,90);
   panel.DrawText("Open",  panel.CellX(0,2,0)+2, panel.CellY(0,2,0)+2); panel.DrawText(DoubleToString(rates[0].open,Digits()),      panel.CellX(0,2,1)+2, panel.CellY(0,2,1)+2,clrNONE,90);
   panel.DrawText("High",  panel.CellX(0,3,0)+2, panel.CellY(0,3,0)+2); panel.DrawText(DoubleToString(rates[0].high,Digits()),      panel.CellX(0,3,1)+2, panel.CellY(0,3,1)+2,clrNONE,90);
   panel.DrawText("Low",   panel.CellX(0,4,0)+2, panel.CellY(0,4,0)+2); panel.DrawText(DoubleToString(rates[0].low,Digits()),       panel.CellX(0,4,1)+2, panel.CellY(0,4,1)+2,clrNONE,90);
   panel.DrawText("Close", panel.CellX(0,5,0)+2, panel.CellY(0,5,0)+2); panel.DrawText(DoubleToString(rates[0].close,Digits()),     panel.CellX(0,5,1)+2, panel.CellY(0,5,1)+2,clrNONE,90);

//--- Display the indicator data from the specified bar on the panel in table 1
   panel.DrawText(ind_title, panel.CellX(1,0,0)+2, panel.CellY(1,0,0)+2);
   double value=IndicatorValue(handle,index,0);
   string value_str=(value!=EMPTY_VALUE ? DoubleToString(value,ind_digits) : "");
   panel.DrawText(value_str,panel.CellX(1,0,1)+2,panel.CellY(1,0,1)+2,clrNONE,90);

//--- Display a description of the indicator line state
   panel.DrawText("Line state", panel.CellX(1,1,0)+2, panel.CellY(1,1,0)+2);
   ENUM_LINE_STATE state=LineState(handle,index,0);
//--- The label color changes depending on the value of the line above/below zero
   color clr=(value<0 ? clrRed : value>0 ? clrBlue : clrNONE);
   panel.DrawText(LineStateDescription(state),panel.CellX(1,1,1)+2,panel.CellY(1,1,1)+2,clr,90);

//--- Redraw the chart to immediately display all changes on the panel
   ChartRedraw(ChartID());
  }
Como os sinais do indicador dependem da posição da linha em relação ao zero, destacaremos com cores os valores positivos e negativos do indicador no painel.
No manipulador de eventos OnChartEvent(), escreveremos o código para trabalhar com os eventos do painel e para indicar o número do barra sobre o qual o cursor está posicionado:
//+------------------------------------------------------------------+
//| ChartEvent function                                              |
//+------------------------------------------------------------------+
void OnChartEvent(const int id,
                  const long &lparam,
                  const double &dparam,
                  const string &sparam)
  {
//--- Handling the panel
//--- Call the panel event handler
   panel.OnChartEvent(id,lparam,dparam,sparam);

//--- If the cursor moves or a click is made on the chart
   if(id==CHARTEVENT_MOUSE_MOVE || id==CHARTEVENT_CLICK)
     {
      //--- Declare the variables to record time and price coordinates in them
      datetime time=0;
      double price=0;
      int wnd=0;
      //--- If the cursor coordinates are converted to date and time
      if(ChartXYToTimePrice(ChartID(),(int)lparam,(int)dparam,wnd,time,price))
        {
         //--- write the bar index where the cursor is located to a global variable
         mouse_bar_index=iBarShift(Symbol(),PERIOD_CURRENT,time);
         //--- Display the bar data under the cursor on the panel
         DrawData(mouse_bar_index,time);
        }
     }

//--- If we received a custom event, display the appropriate message in the journal
   if(id>CHARTEVENT_CUSTOM)
     {
      //--- Here we can implement handling a click on the close button on the panel
      PrintFormat("%s: Event id=%ld, object id (lparam): %lu, event message (sparam): %s",__FUNCTION__,id,lparam,sparam);
     }
  }
Compilaremos o EA e o executaremos no gráfico com os valores padrão, sem esquecer de adicionar o indicador com os mesmos parâmetros:
O arquivo do EA "TestOscillatorBears.mq5" pode ser encontrado nos arquivos anexados ao artigo.
Bulls Power
Cada dia de negociação representa uma luta entre compradores ("touros"), que tentam elevar o preço, e vendedores ("ursos"), que empurram o preço para baixo. Dependendo de qual lado prevalece, o dia termina com um preço mais alto ou mais baixo em comparação com o dia anterior, e os resultados intermediários, principalmente os preços máximos e mínimos, permitem julgar como a luta se desenrolou ao longo do dia.
A tarefa de avaliar o equilíbrio de forças dos "touros" é muito importante, pois a mudança desse equilíbrio é um dos primeiros sinais que podem prever uma possível mudança de tendência. Essa tarefa é resolvida pelo oscilador Bulls Power, que foi desenvolvido por Alexander Elder e descrito em seu livro "Como se transformar em um operador e investidor de sucesso". Na sua formulação, Elder usou as seguintes premissas:
- a média móvel é um acordo sobre o preço entre vendedores e compradores durante um determinado período de tempo,
- o preço máximo reflete a máxima força dos compradores durante o dia.
Baseado nessas premissas, Elder desenvolveu o Bulls Power como a diferença entre o preço máximo e a média móvel exponencial de 13 períodos (HIGH - EMA).
Este indicador é melhor usado em conjunto com um dos indicadores de tendência (geralmente uma média móvel):
- se o indicador de tendência estiver descendo e o índice de força dos touros estiver acima de zero mas diminuindo, isso é um sinal de venda;
- é desejável que, ao mesmo tempo, seja formada uma divergência nos topos no gráfico do indicador.
Parâmetros
O indicador tem um parâmetro ajustável, nomeadamente o período de suavização. Por padrão, é 13.
Lista de parâmetros de entrada e variáveis globais para uso no EA:
//+------------------------------------------------------------------+
//|                                          TestOscillatorBulls.mq5 |
//|                                  Copyright 2023, MetaQuotes Ltd. |
//|                                             https://www.mql5.com |
//+------------------------------------------------------------------+
#property copyright "Copyright 2023, MetaQuotes Ltd."
#property link      "https://www.mql5.com"
#property version   "1.00"
//--- enums
enum ENUM_LINE_STATE
  {
   LINE_STATE_NONE,        // Undefined state
   LINE_STATE_UP,          // Upward
   LINE_STATE_DOWN,        // Downward
   LINE_STATE_TURN_UP,     // Upward reversal
   LINE_STATE_TURN_DOWN,   // Downward reversal
   LINE_STATE_STOP_UP,     // Upward stop
   LINE_STATE_STOP_DOWN,   // Downward stop
   LINE_STATE_ABOVE,       // Above value
   LINE_STATE_UNDER,       // Below value
   LINE_STATE_CROSS_UP,    // Crossing value upwards
   LINE_STATE_CROSS_DOWN,  // Crossing value downwards
   LINE_STATE_TOUCH_BELOW, // Touching value from below
   LINE_STATE_TOUCH_ABOVE, // Touch value from above
   LINE_STATE_EQUALS,      // Equal to value
  };
//--- input parameters
input uint  InpPeriod   =  13;   /* Bulls Power Period   */
//--- global variables
int      handle=INVALID_HANDLE;  // Indicator handle
int      period=0;               // Bulls Power calculation period
int      ind_digits=0;           // Number of decimal places in the indicator values
string   ind_title;              // Indicator description
Ao usar o painel de informações, inclui-se o arquivo da classe do painel e adicionam-se variáveis para trabalhar com ele:
//+------------------------------------------------------------------+
//|                                          TestOscillatorBulls.mq5 |
//|                                  Copyright 2023, MetaQuotes Ltd. |
//|                                             https://www.mql5.com |
//+------------------------------------------------------------------+
#property copyright "Copyright 2023, MetaQuotes Ltd."
#property link      "https://www.mql5.com"
#property version   "1.00"
//--- includes
#include <Dashboard\Dashboard.mqh>
//--- enums
enum ENUM_LINE_STATE
  {
   LINE_STATE_NONE,        // Undefined state
   LINE_STATE_UP,          // Upward
   LINE_STATE_DOWN,        // Downward
   LINE_STATE_TURN_UP,     // Upward reversal
   LINE_STATE_TURN_DOWN,   // Downward reversal
   LINE_STATE_STOP_UP,     // Upward stop
   LINE_STATE_STOP_DOWN,   // Downward stop
   LINE_STATE_ABOVE,       // Above value
   LINE_STATE_UNDER,       // Below value
   LINE_STATE_CROSS_UP,    // Crossing value upwards
   LINE_STATE_CROSS_DOWN,  // Crossing value downwards
   LINE_STATE_TOUCH_BELOW, // Touching value from below
   LINE_STATE_TOUCH_ABOVE, // Touch value from above
   LINE_STATE_EQUALS,      // Equal to value
  };
//--- input parameters
input uint  InpPeriod   =  13;   /* Bulls Power Period   */
//--- global variables
int      handle=INVALID_HANDLE;  // Indicator handle
int      period=0;               // Bulls Power calculation period
int      ind_digits=0;           // Number of decimal places in the indicator values
string   ind_title;              // Indicator description
//--- variables for the panel
int      mouse_bar_index;        // Index of the bar the data is taken from
CDashboard *panel=NULL;          // Pointer to the panel object
Inicialização
Manipulador OnInit() para inicializar os parâmetros do indicador e criar seu handle:
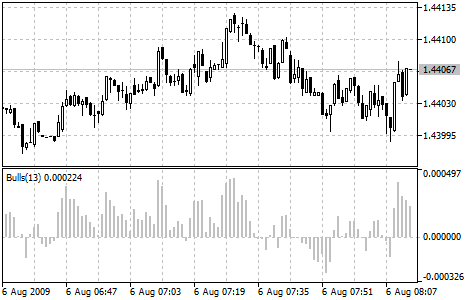
//+------------------------------------------------------------------+
//| Expert initialization function                                   |
//+------------------------------------------------------------------+
int OnInit()
  {
//--- create timer
   EventSetTimer(60);

//--- Indicator
//--- Set and adjust the calculation period if necessary
   period=int(InpPeriod<1 ? 13 : InpPeriod);
//--- Set the indicator name and the number of decimal places
   ind_title=StringFormat("Bulls(%lu)",period);
   ind_digits=Digits()+1;
//--- Create indicator handle
   ResetLastError();
   handle=iBullsPower(Symbol(),PERIOD_CURRENT,period);
   if(handle==INVALID_HANDLE)
     {
      PrintFormat("%s: Failed to create indicator handle %s. Error %ld",__FUNCTION__,ind_title,GetLastError());
      return INIT_FAILED;
     }

//--- Successful initialization
   return(INIT_SUCCEEDED);
  }
Ao usar o painel de informações, cria-se o painel:
//+------------------------------------------------------------------+
//| Expert initialization function                                   |
//+------------------------------------------------------------------+
int OnInit()
  {
//--- create timer
   EventSetTimer(60);

//--- Indicator
//--- Set and adjust the calculation period if necessary
   period=int(InpPeriod<1 ? 13 : InpPeriod);
//--- Set the indicator name and the number of decimal places
   ind_title=StringFormat("Bulls(%lu)",period);
   ind_digits=Digits()+1;
//--- Create indicator handle
   ResetLastError();
   handle=iBullsPower(Symbol(),PERIOD_CURRENT,period);
   if(handle==INVALID_HANDLE)
     {
      PrintFormat("%s: Failed to create indicator handle %s. Error %ld",__FUNCTION__,ind_title,GetLastError());
      return INIT_FAILED;
     }

//--- Dashboard
//--- Create the panel
   panel=new CDashboard(1,20,20,199,225);
   if(panel==NULL)
     {
      Print("Error. Failed to create panel object");
      return INIT_FAILED;
     }
//--- Set font parameters
   panel.SetFontParams("Calibri",9);
//--- Display the panel with the "Symbol, Timeframe description" header text
   panel.View(Symbol()+", "+StringSubstr(EnumToString(Period()),7));
//--- Create a table with ID 0 to display bar data in it
   panel.CreateNewTable(0);
//--- Draw a table with ID 0 on the panel background
   panel.DrawGrid(0,2,20,6,2,18,97);

//--- Create a table with ID 1 to display indicator data in it
   panel.CreateNewTable(1);
//--- Get the Y2 table coordinate with ID 0 and
//--- set the Y1 coordinate for the table with ID 1
   int y1=panel.TableY2(0)+22;
//--- Draw a table with ID 1 on the panel background
   panel.DrawGrid(1,2,y1,3,2,18,97);

//--- Display tabular data in the journal
   panel.GridPrint(0,2);
   panel.GridPrint(1,2);
//--- Initialize the variable with the index of the mouse cursor bar
   mouse_bar_index=0;
//--- Display the data of the current bar on the panel
   DrawData(mouse_bar_index,TimeCurrent());

//--- Successful initialization
   return(INIT_SUCCEEDED);
  }
Desinicialização
No manipulador OnDeinit() do EA, libera-se o handle do indicador:
//+------------------------------------------------------------------+
//| Expert deinitialization function                                 |
//+------------------------------------------------------------------+
void OnDeinit(const int reason)
  {
//--- destroy timer
   EventKillTimer();

//--- Release handle of the indicator
   ResetLastError();
   if(!IndicatorRelease(handle))
      PrintFormat("%s: IndicatorRelease failed. Error %ld",__FUNCTION__,GetLastError());
//--- Clear all comments on the chart
   Comment("");
  }
Ao usar o painel de informações, remove-se o objeto do painel criado:
//+------------------------------------------------------------------+
//| Expert deinitialization function                                 |
//+------------------------------------------------------------------+
void OnDeinit(const int reason)
  {
//--- destroy timer
   EventKillTimer();

//--- Release handle of the indicator
   ResetLastError();
   if(!IndicatorRelease(handle))
      PrintFormat("%s: IndicatorRelease failed. Error %ld",__FUNCTION__,GetLastError());
//--- Clear all comments on the chart
   Comment("");

//--- If the panel object exists, delete it
   if(panel!=NULL)
      delete panel;
  }
Recuperação de dados
Funções comuns para recuperar dados através do handle do indicador:
//+------------------------------------------------------------------+
//| Return the indicator data on the specified bar                   |
//+------------------------------------------------------------------+
double IndicatorValue(const int ind_handle,const int index,const int buffer_num)
  {
   double array[1]={0};
   ResetLastError();
   if(CopyBuffer(ind_handle,buffer_num,index,1,array)!=1)
     {
      PrintFormat("%s: CopyBuffer failed. Error %ld",__FUNCTION__,GetLastError());
      return EMPTY_VALUE;
     }
   return array[0];
  }
//+------------------------------------------------------------------+
//| Return the state of the indicator line                           |
//+------------------------------------------------------------------+
ENUM_LINE_STATE LineState(const int ind_handle,const int index,const int buffer_num)
  {
//--- Get the values of the indicator line with the shift (0,1,2) relative to the passed index
   const double value0=IndicatorValue(ind_handle,index,  buffer_num);
   const double value1=IndicatorValue(ind_handle,index+1,buffer_num);
   const double value2=IndicatorValue(ind_handle,index+2,buffer_num);
//--- If at least one of the values could not be obtained, return an undefined value
   if(value0==EMPTY_VALUE || value1==EMPTY_VALUE || value2==EMPTY_VALUE)
      return LINE_STATE_NONE;
//--- Line upward reversal (value2>value1 && value0>value1)
   if(NormalizeDouble(value2-value1,ind_digits)>0 && NormalizeDouble(value0-value1,ind_digits)>0)
      return LINE_STATE_TURN_UP;
//--- Line upward direction (value2<=value1 && value0>value1)
   else if(NormalizeDouble(value2-value1,ind_digits)<=0 && NormalizeDouble(value0-value1,ind_digits)>0)
      return LINE_STATE_UP;
//--- Line upward stop (value2<=value1 && value0==value1)
   else if(NormalizeDouble(value2-value1,ind_digits)<=0 && NormalizeDouble(value0-value1,ind_digits)==0)
      return LINE_STATE_STOP_UP;
//--- Line downward reversal (value2<value1 && value0<value1)
   if(NormalizeDouble(value2-value1,ind_digits)<0 && NormalizeDouble(value0-value1,ind_digits)<0)
      return LINE_STATE_TURN_DOWN;
//--- Line downward direction (value2>=value1 && value0<value1)
   else if(NormalizeDouble(value2-value1,ind_digits)>=0 && NormalizeDouble(value0-value1,ind_digits)<0)
      return LINE_STATE_DOWN;
//--- Line downward stop (value2>=value1 && value0==value1)
   else if(NormalizeDouble(value2-value1,ind_digits)>=0 && NormalizeDouble(value0-value1,ind_digits)==0)
      return LINE_STATE_STOP_DOWN;
//--- Undefined state
   return LINE_STATE_NONE;
  }
//+------------------------------------------------------------------+
//| Return the state of the line relative to the specified level     |
//+------------------------------------------------------------------+
ENUM_LINE_STATE LineStateRelative(const int ind_handle,const int index,const int buffer_num,const double level0,const double level1=EMPTY_VALUE)
  {
//--- Get the values of the indicator line with the shift (0,1) relative to the passed index
   const double value0=IndicatorValue(ind_handle,index,  buffer_num);
   const double value1=IndicatorValue(ind_handle,index+1,buffer_num);
//--- If at least one of the values could not be obtained, return an undefined value
   if(value0==EMPTY_VALUE || value1==EMPTY_VALUE)
      return LINE_STATE_NONE;
//--- Define the second level to compare
   double level=(level1==EMPTY_VALUE ? level0 : level1);
//--- The line is below the level (value1<level && value0<level0)
   if(NormalizeDouble(value1-level,ind_digits)<0 && NormalizeDouble(value0-level0,ind_digits)<0)
      return LINE_STATE_UNDER;
//--- The line is above the level (value1>level && value0>level0)
   if(NormalizeDouble(value1-level,ind_digits)>0 && NormalizeDouble(value0-level0,ind_digits)>0)
      return LINE_STATE_ABOVE;
//--- The line crossed the level upwards (value1<=level && value0>level0)
   if(NormalizeDouble(value1-level,ind_digits)<=0 && NormalizeDouble(value0-level0,ind_digits)>0)
      return LINE_STATE_CROSS_UP;
//--- The line crossed the level downwards (value1>=level && value0<level0)
   if(NormalizeDouble(value1-level,ind_digits)>=0 && NormalizeDouble(value0-level0,ind_digits)<0)
      return LINE_STATE_CROSS_DOWN;
//--- The line touched the level from below (value1<level0 && value0==level0)
   if(NormalizeDouble(value1-level,ind_digits)<0 && NormalizeDouble(value0-level0,ind_digits)==0)
      return LINE_STATE_TOUCH_BELOW;
//--- The line touched the level from above (value1>level0 && value0==level0)
   if(NormalizeDouble(value1-level,ind_digits)>0 && NormalizeDouble(value0-level0,ind_digits)==0)
      return LINE_STATE_TOUCH_BELOW;
//--- Line is equal to the level value (value1==level0 && value0==level0)
   if(NormalizeDouble(value1-level,ind_digits)==0 && NormalizeDouble(value0-level0,ind_digits)==0)
      return LINE_STATE_EQUALS;
//--- Undefined state
   return LINE_STATE_NONE;
  }
//+------------------------------------------------------------------+
//| Return the indicator line state description                      |
//+------------------------------------------------------------------+
string LineStateDescription(const ENUM_LINE_STATE state)
  {
   switch(state)
     {
      case LINE_STATE_UP         :  return "Up";
      case LINE_STATE_STOP_UP    :  return "Stop Up";
      case LINE_STATE_TURN_UP    :  return "Turn Up";
      case LINE_STATE_DOWN       :  return "Down";
      case LINE_STATE_STOP_DOWN  :  return "Stop Down";
      case LINE_STATE_TURN_DOWN  :  return "Turn Down";
      case LINE_STATE_ABOVE      :  return "Above level";
      case LINE_STATE_UNDER      :  return "Under level";
      case LINE_STATE_CROSS_UP   :  return "Crossing Up";
      case LINE_STATE_CROSS_DOWN :  return "Crossing Down";
      case LINE_STATE_TOUCH_BELOW:  return "Touch from Below";
      case LINE_STATE_TOUCH_ABOVE:  return "Touch from Above";
      case LINE_STATE_EQUALS     :  return "Equals";
      default                    :  return "Unknown";
     }
  }
Ao usar o painel de informações, os dados são exibidos no painel por meio de uma função:
//+------------------------------------------------------------------+
//| Display data from the specified timeseries index to the panel    |
//+------------------------------------------------------------------+
void DrawData(const int index,const datetime time)
  {
//--- Declare the variables to receive data in them
   MqlTick  tick={0};
   MqlRates rates[1];

//--- Exit if unable to get the current prices
   if(!SymbolInfoTick(Symbol(),tick))
      return;
//--- Exit if unable to get the bar data by the specified index
   if(CopyRates(Symbol(),PERIOD_CURRENT,index,1,rates)!=1)
      return;

//--- Set font parameters for bar and indicator data headers
   int  size=0;
   uint flags=0;
   uint angle=0;
   string name=panel.FontParams(size,flags,angle);
   panel.SetFontParams(name,9,FW_BOLD);
   panel.DrawText("Bar data ["+(string)index+"]",3,panel.TableY1(0)-16,clrMaroon,panel.Width()-6);
   panel.DrawText("Indicator data ["+(string)index+"]",3,panel.TableY1(1)-16,clrGreen,panel.Width()-6);
//--- Set font parameters for bar and indicator data
   panel.SetFontParams(name,9);

//--- Display the data of the specified bar in table 0 on the panel
   panel.DrawText("Date",  panel.CellX(0,0,0)+2, panel.CellY(0,0,0)+2); panel.DrawText(TimeToString(  rates[0].time,TIME_DATE),     panel.CellX(0,0,1)+2, panel.CellY(0,0,1)+2,clrNONE,90);
   panel.DrawText("Time",  panel.CellX(0,1,0)+2, panel.CellY(0,1,0)+2); panel.DrawText(TimeToString(  rates[0].time,TIME_MINUTES),  panel.CellX(0,1,1)+2, panel.CellY(0,1,1)+2,clrNONE,90);
   panel.DrawText("Open",  panel.CellX(0,2,0)+2, panel.CellY(0,2,0)+2); panel.DrawText(DoubleToString(rates[0].open,Digits()),      panel.CellX(0,2,1)+2, panel.CellY(0,2,1)+2,clrNONE,90);
   panel.DrawText("High",  panel.CellX(0,3,0)+2, panel.CellY(0,3,0)+2); panel.DrawText(DoubleToString(rates[0].high,Digits()),      panel.CellX(0,3,1)+2, panel.CellY(0,3,1)+2,clrNONE,90);
   panel.DrawText("Low",   panel.CellX(0,4,0)+2, panel.CellY(0,4,0)+2); panel.DrawText(DoubleToString(rates[0].low,Digits()),       panel.CellX(0,4,1)+2, panel.CellY(0,4,1)+2,clrNONE,90);
   panel.DrawText("Close", panel.CellX(0,5,0)+2, panel.CellY(0,5,0)+2); panel.DrawText(DoubleToString(rates[0].close,Digits()),     panel.CellX(0,5,1)+2, panel.CellY(0,5,1)+2,clrNONE,90);

//--- Display the indicator data from the specified bar on the panel in table 1
   panel.DrawText(ind_title, panel.CellX(1,0,0)+2, panel.CellY(1,0,0)+2);
   double value=IndicatorValue(handle,index,0);
   string value_str=(value!=EMPTY_VALUE ? DoubleToString(value,ind_digits) : "");
   panel.DrawText(value_str,panel.CellX(1,0,1)+2,panel.CellY(1,0,1)+2,clrNONE,90);

//--- Display a description of the indicator line state
   panel.DrawText("Line state", panel.CellX(1,1,0)+2, panel.CellY(1,1,0)+2);
   ENUM_LINE_STATE state=LineState(handle,index,0);
//--- The label color changes depending on the value of the line above/below zero
   color clr=(value<0 ? clrRed : value>0 ? clrBlue : clrNONE);
   panel.DrawText(LineStateDescription(state),panel.CellX(1,1,1)+2,panel.CellY(1,1,1)+2,clr,90);

//--- Redraw the chart to immediately display all changes on the panel
   ChartRedraw(ChartID());
  }
Adicionalmente, no manipulador de eventos OnChartEvent() do EA, chama-se o manipulador de eventos do painel e processam-se eventos para recuperar o índice da barra sob o cursor:
//+------------------------------------------------------------------+
//| ChartEvent function                                              |
//+------------------------------------------------------------------+
void OnChartEvent(const int id,
                  const long &lparam,
                  const double &dparam,
                  const string &sparam)
  {
//--- Handling the panel
//--- Call the panel event handler
   panel.OnChartEvent(id,lparam,dparam,sparam);

//--- If the cursor moves or a click is made on the chart
   if(id==CHARTEVENT_MOUSE_MOVE || id==CHARTEVENT_CLICK)
     {
      //--- Declare the variables to record time and price coordinates in them
      datetime time=0;
      double price=0;
      int wnd=0;
      //--- If the cursor coordinates are converted to date and time
      if(ChartXYToTimePrice(ChartID(),(int)lparam,(int)dparam,wnd,time,price))
        {
         //--- write the bar index where the cursor is located to a global variable
         mouse_bar_index=iBarShift(Symbol(),PERIOD_CURRENT,time);
         //--- Display the bar data under the cursor on the panel
         DrawData(mouse_bar_index,time);
        }
     }

//--- If we received a custom event, display the appropriate message in the journal
   if(id>CHARTEVENT_CUSTOM)
     {
      //--- Here we can implement handling a click on the close button on the panel
      PrintFormat("%s: Event id=%ld, object id (lparam): %lu, event message (sparam): %s",__FUNCTION__,id,lparam,sparam);
     }
  }
Após compilar o EA e executá-lo no gráfico, podemos monitorar o estado da linha do indicador no painel:
O arquivo do EA "TestOscillatorBulls.mq5" pode ser encontrado nos arquivos anexados ao artigo.
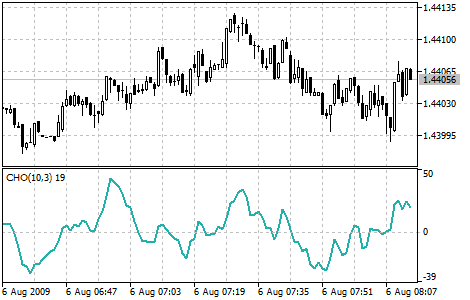
Chaikin Oscillator
O Oscilador Chaikin (Chaikin Oscillator, CHO) é a diferença das médias móveis do indicador Acumulação/Distribuição.
O conceito desse oscilador se baseia em três postulados centrais. Primeiro: se uma ação ou índice fecha acima de seu valor médio diário (que é determinado como [máximo + mínimo] / 2), significa que houve acumulação nesse dia. Quanto mais próximo o nível de fechamento da ação ou índice estiver do máximo, mais ativa é a acumulação. E inversamente, se uma ação fecha abaixo do preço médio do dia, então houve distribuição nesse dia. Quanto mais próximo do mínimo a ação fecha, mais ativa é a distribuição.
Segundo postulado: um aumento estável nos preços é acompanhado por um aumento no volume de negociações e uma forte acumulação de volume. Uma vez que o volume é uma espécie de combustível que alimenta o crescimento do mercado, a falta de volume durante um aumento de preços indica a falta de combustível para continuar a subida.
Por outro lado, a queda dos preços geralmente é acompanhada por um volume baixo e termina com o pânico dos investidores institucionais liquidando suas posições. Assim, primeiro há um aumento no volume, depois uma queda nos preços com volume reduzido, e apenas quando o mercado se aproxima do fundo, ocorre alguma acumulação.
O terceiro postulado afirma que o Oscilador Chaikin pode ser usado para rastrear o fluxo de dinheiro que entra e sai do mercado. A comparação da dinâmica do volume e do preço permite identificar os topos e os fundos do mercado, tanto no curto quanto no médio prazo.
Uma vez que não existem métodos de análise técnica infalíveis, recomenda-se usar este oscilador juntamente com outros indicadores técnicos. A confiabilidade dos sinais de negociação de curto e médio prazo será maior se, junto com o Oscilador Chaikin, forem usados, por exemplo, os Envelopes baseados na média móvel de 21 dias e algum oscilador de sobrecompra/sobrevenda.
O sinal mais importante do Oscilador Chaikin ocorre quando os preços atingem um novo máximo ou mínimo (especialmente em um nível de sobrecompra ou sobrevenda), mas o oscilador não consegue superar seu valor extremo anterior e reverte.
- Sinais na direção da tendência de médio prazo são mais confiáveis do que sinais contra a tendência.
- A confirmação pelo oscilador de um novo máximo ou mínimo não significa que os preços continuarão a se mover na mesma direção. Esse evento é interpretado como irrelevante.
Existe também outra maneira de usar o Oscilador Chaikin, na qual a mudança de sua direção é considerada um sinal de compra ou venda, mas apenas se coincidir com a direção da tendência de preço. Assim, se uma ação está em ascensão e seu preço está acima da média móvel de 90 dias, então uma virada para cima da curva do oscilador no escopo de valores negativos pode ser considerada um sinal de compra (mas apenas se o preço da ação estiver acima da média móvel de 90 dias - não abaixo dela).
Uma reviravolta do oscilador para baixo no escopo de valores positivos (acima de zero) pode ser considerada um sinal de venda, apenas se o preço da ação nesse momento estiver abaixo da média móvel de 90 dias dos preços de fechamento.
Parâmetros
O indicador tem quatro parâmetros ajustáveis:
- Volumes utilizados, por padrão — volumes de tick,
- Período de cálculo da MA rápida, por padrão — 3,
- Período de cálculo da MA lenta, por padrão — 10,
- Método de cálculo - por padrão EMA.
Variáveis de entrada e globais para uso do indicador no EA:
//+------------------------------------------------------------------+
//|                                            TestOscillatorCHO.mq5 |
//|                                  Copyright 2023, MetaQuotes Ltd. |
//|                                             https://www.mql5.com |
//+------------------------------------------------------------------+
#property copyright "Copyright 2023, MetaQuotes Ltd."
#property link      "https://www.mql5.com"
#property version   "1.00"
//--- enums
enum ENUM_LINE_STATE
  {
   LINE_STATE_NONE,        // Undefined state
   LINE_STATE_UP,          // Upward
   LINE_STATE_DOWN,        // Downward
   LINE_STATE_TURN_UP,     // Upward reversal
   LINE_STATE_TURN_DOWN,   // Downward reversal
   LINE_STATE_STOP_UP,     // Upward stop
   LINE_STATE_STOP_DOWN,   // Downward stop
   LINE_STATE_ABOVE,       // Above value
   LINE_STATE_UNDER,       // Below value
   LINE_STATE_CROSS_UP,    // Crossing value upwards
   LINE_STATE_CROSS_DOWN,  // Crossing value downwards
   LINE_STATE_TOUCH_BELOW, // Touching value from below
   LINE_STATE_TOUCH_ABOVE, // Touch value from above
   LINE_STATE_EQUALS,      // Equal to value
  };
//--- input parameters
input uint                 InpPeriodFast  =  3;             /* CHO Fast MA Period   */
input uint                 InpPeriodSlow  =  10;            /* CHO Slow MA Period   */
input ENUM_MA_METHOD       InpMethod      =  MODE_EMA;      /* Method */
input ENUM_APPLIED_VOLUME  InpAppliedVol  =  VOLUME_TICK;   /* Applied Volume       */
//--- global variables
int      handle=INVALID_HANDLE;  // Indicator handle
int      period_fast=0;          // Fast moving average calculation period
int      period_slow=0;          // Slow moving average calculation period
int      ind_digits=0;           // Number of decimal places in the indicator values
string   ind_title;              // Indicator description
Ao usar o painel de informações, inclui-se o arquivo da classe do painel e adicionam-se variáveis para trabalhar com ele:
//+------------------------------------------------------------------+
//|                                            TestOscillatorCHO.mq5 |
//|                                  Copyright 2023, MetaQuotes Ltd. |
//|                                             https://www.mql5.com |
//+------------------------------------------------------------------+
#property copyright "Copyright 2023, MetaQuotes Ltd."
#property link      "https://www.mql5.com"
#property version   "1.00"
//--- includes
#include <Dashboard\Dashboard.mqh>
//--- enums
enum ENUM_LINE_STATE
  {
   LINE_STATE_NONE,        // Undefined state
   LINE_STATE_UP,          // Upward
   LINE_STATE_DOWN,        // Downward
   LINE_STATE_TURN_UP,     // Upward reversal
   LINE_STATE_TURN_DOWN,   // Downward reversal
   LINE_STATE_STOP_UP,     // Upward stop
   LINE_STATE_STOP_DOWN,   // Downward stop
   LINE_STATE_ABOVE,       // Above value
   LINE_STATE_UNDER,       // Below value
   LINE_STATE_CROSS_UP,    // Crossing value upwards
   LINE_STATE_CROSS_DOWN,  // Crossing value downwards
   LINE_STATE_TOUCH_BELOW, // Touching value from below
   LINE_STATE_TOUCH_ABOVE, // Touch value from above
   LINE_STATE_EQUALS,      // Equal to value
  };
//--- input parameters
input uint                 InpPeriodFast  =  3;             /* CHO Fast MA Period   */
input uint                 InpPeriodSlow  =  10;            /* CHO Slow MA Period   */
input ENUM_MA_METHOD       InpMethod      =  MODE_EMA;      /* Method */
input ENUM_APPLIED_VOLUME  InpAppliedVol  =  VOLUME_TICK;   /* Applied Volume       */
//--- global variables
int      handle=INVALID_HANDLE;  // Indicator handle
int      period_fast=0;          // Fast moving average calculation period
int      period_slow=0;          // Slow moving average calculation period
int      ind_digits=0;           // Number of decimal places in the indicator values
string   ind_title;              // Indicator description
//--- variables for the panel
int      mouse_bar_index;        // Index of the bar the data is taken from
CDashboard *panel=NULL;          // Pointer to the panel object
Inicialização
Manipulador OnInit() para inicializar os parâmetros do indicador e criar seu handle:
//+------------------------------------------------------------------+
//| Expert initialization function                                   |
//+------------------------------------------------------------------+
int OnInit()
  {
//--- create timer
   EventSetTimer(60);

//--- Indicator
//--- Set and adjust the calculation period if necessary
   period_fast=int(InpPeriodFast<1 ? 3  : InpPeriodFast);
   period_slow=int(InpPeriodSlow<1 ? 10 : InpPeriodSlow);
//--- Set the indicator name and the number of decimal places
   ind_title=StringFormat("CHO(%lu,%lu)",period_slow,period_fast);
   ind_digits=0;
//--- Create indicator handle
   ResetLastError();
   handle=iChaikin(Symbol(),PERIOD_CURRENT,period_fast,period_slow,InpMethod,InpAppliedVol);
   if(handle==INVALID_HANDLE)
     {
      PrintFormat("%s: Failed to create indicator handle %s. Error %ld",__FUNCTION__,ind_title,GetLastError());
      return INIT_FAILED;
     }

//--- Successful initialization
   return(INIT_SUCCEEDED);
  }
Ao usar o painel de informações, cria-se o painel:
//+------------------------------------------------------------------+
//| Expert initialization function                                   |
//+------------------------------------------------------------------+
int OnInit()
  {
//--- create timer
   EventSetTimer(60);

//--- Indicator
//--- Set and adjust the calculation period if necessary
   period_fast=int(InpPeriodFast<1 ? 3  : InpPeriodFast);
   period_slow=int(InpPeriodSlow<1 ? 10 : InpPeriodSlow);
//--- Set the indicator name and the number of decimal places
   ind_title=StringFormat("CHO(%lu,%lu)",period_slow,period_fast);
   ind_digits=0;
//--- Create indicator handle
   ResetLastError();
   handle=iChaikin(Symbol(),PERIOD_CURRENT,period_fast,period_slow,InpMethod,InpAppliedVol);
   if(handle==INVALID_HANDLE)
     {
      PrintFormat("%s: Failed to create indicator handle %s. Error %ld",__FUNCTION__,ind_title,GetLastError());
      return INIT_FAILED;
     }

//--- Dashboard
//--- Create the panel
   panel=new CDashboard(1,20,20,199,225);
   if(panel==NULL)
     {
      Print("Error. Failed to create panel object");
      return INIT_FAILED;
     }
//--- Set font parameters
   panel.SetFontParams("Calibri",9);
//--- Display the panel with the "Symbol, Timeframe description" header text
   panel.View(Symbol()+", "+StringSubstr(EnumToString(Period()),7));
//--- Create a table with ID 0 to display bar data in it
   panel.CreateNewTable(0);
//--- Draw a table with ID 0 on the panel background
   panel.DrawGrid(0,2,20,6,2,18,97);

//--- Create a table with ID 1 to display indicator data in it
   panel.CreateNewTable(1);
//--- Get the Y2 table coordinate with ID 0 and
//--- set the Y1 coordinate for the table with ID 1
   int y1=panel.TableY2(0)+22;
//--- Draw a table with ID 1 on the panel background
   panel.DrawGrid(1,2,y1,3,2,18,97);

//--- Display tabular data in the journal
   panel.GridPrint(0,2);
   panel.GridPrint(1,2);
//--- Initialize the variable with the index of the mouse cursor bar
   mouse_bar_index=0;
//--- Display the data of the current bar on the panel
   DrawData(mouse_bar_index,TimeCurrent());

//--- Successful initialization
   return(INIT_SUCCEEDED);
  }
Desinicialização
No manipulador OnDeinit() do EA, libera-se o handle do indicador:
//+------------------------------------------------------------------+
//| Expert deinitialization function                                 |
//+------------------------------------------------------------------+
void OnDeinit(const int reason)
  {
//--- destroy timer
   EventKillTimer();

//--- Release handle of the indicator
   ResetLastError();
   if(!IndicatorRelease(handle))
      PrintFormat("%s: IndicatorRelease failed. Error %ld",__FUNCTION__,GetLastError());
//--- Clear all comments on the chart
   Comment("");
  }
Ao usar o painel de informações, remove-se o objeto do painel criado:
//+------------------------------------------------------------------+
//| Expert deinitialization function                                 |
//+------------------------------------------------------------------+
void OnDeinit(const int reason)
  {
//--- destroy timer
   EventKillTimer();

//--- Release handle of the indicator
   ResetLastError();
   if(!IndicatorRelease(handle))
      PrintFormat("%s: IndicatorRelease failed. Error %ld",__FUNCTION__,GetLastError());
//--- Clear all comments on the chart
   Comment("");

//--- If the panel object exists, delete it
   if(panel!=NULL)
      delete panel;
  }
Recuperação de dados
Funções comuns para recuperar dados através do handle do indicador:
//+------------------------------------------------------------------+
//| Return the indicator data on the specified bar                   |
//+------------------------------------------------------------------+
double IndicatorValue(const int ind_handle,const int index,const int buffer_num)
  {
   double array[1]={0};
   ResetLastError();
   if(CopyBuffer(ind_handle,buffer_num,index,1,array)!=1)
     {
      PrintFormat("%s: CopyBuffer failed. Error %ld",__FUNCTION__,GetLastError());
      return EMPTY_VALUE;
     }
   return array[0];
  }
//+------------------------------------------------------------------+
//| Return the state of the indicator line                           |
//+------------------------------------------------------------------+
ENUM_LINE_STATE LineState(const int ind_handle,const int index,const int buffer_num)
  {
//--- Get the values of the indicator line with the shift (0,1,2) relative to the passed index
   const double value0=IndicatorValue(ind_handle,index,  buffer_num);
   const double value1=IndicatorValue(ind_handle,index+1,buffer_num);
   const double value2=IndicatorValue(ind_handle,index+2,buffer_num);
//--- If at least one of the values could not be obtained, return an undefined value
   if(value0==EMPTY_VALUE || value1==EMPTY_VALUE || value2==EMPTY_VALUE)
      return LINE_STATE_NONE;
//--- Line upward reversal (value2>value1 && value0>value1)
   if(NormalizeDouble(value2-value1,ind_digits)>0 && NormalizeDouble(value0-value1,ind_digits)>0)
      return LINE_STATE_TURN_UP;
//--- Line upward direction (value2<=value1 && value0>value1)
   else if(NormalizeDouble(value2-value1,ind_digits)<=0 && NormalizeDouble(value0-value1,ind_digits)>0)
      return LINE_STATE_UP;
//--- Line upward stop (value2<=value1 && value0==value1)
   else if(NormalizeDouble(value2-value1,ind_digits)<=0 && NormalizeDouble(value0-value1,ind_digits)==0)
      return LINE_STATE_STOP_UP;
//--- Line downward reversal (value2<value1 && value0<value1)
   if(NormalizeDouble(value2-value1,ind_digits)<0 && NormalizeDouble(value0-value1,ind_digits)<0)
      return LINE_STATE_TURN_DOWN;
//--- Line downward direction (value2>=value1 && value0<value1)
   else if(NormalizeDouble(value2-value1,ind_digits)>=0 && NormalizeDouble(value0-value1,ind_digits)<0)
      return LINE_STATE_DOWN;
//--- Line downward stop (value2>=value1 && value0==value1)
   else if(NormalizeDouble(value2-value1,ind_digits)>=0 && NormalizeDouble(value0-value1,ind_digits)==0)
      return LINE_STATE_STOP_DOWN;
//--- Undefined state
   return LINE_STATE_NONE;
  }
//+------------------------------------------------------------------+
//| Return the state of the line relative to the specified level     |
//+------------------------------------------------------------------+
ENUM_LINE_STATE LineStateRelative(const int ind_handle,const int index,const int buffer_num,const double level0,const double level1=EMPTY_VALUE)
  {
//--- Get the values of the indicator line with the shift (0,1) relative to the passed index
   const double value0=IndicatorValue(ind_handle,index,  buffer_num);
   const double value1=IndicatorValue(ind_handle,index+1,buffer_num);
//--- If at least one of the values could not be obtained, return an undefined value
   if(value0==EMPTY_VALUE || value1==EMPTY_VALUE)
      return LINE_STATE_NONE;
//--- Define the second level to compare
   double level=(level1==EMPTY_VALUE ? level0 : level1);
//--- The line is below the level (value1<level && value0<level0)
   if(NormalizeDouble(value1-level,ind_digits)<0 && NormalizeDouble(value0-level0,ind_digits)<0)
      return LINE_STATE_UNDER;
//--- The line is above the level (value1>level && value0>level0)
   if(NormalizeDouble(value1-level,ind_digits)>0 && NormalizeDouble(value0-level0,ind_digits)>0)
      return LINE_STATE_ABOVE;
//--- The line crossed the level upwards (value1<=level && value0>level0)
   if(NormalizeDouble(value1-level,ind_digits)<=0 && NormalizeDouble(value0-level0,ind_digits)>0)
      return LINE_STATE_CROSS_UP;
//--- The line crossed the level downwards (value1>=level && value0<level0)
   if(NormalizeDouble(value1-level,ind_digits)>=0 && NormalizeDouble(value0-level0,ind_digits)<0)
      return LINE_STATE_CROSS_DOWN;
//--- The line touched the level from below (value1<level0 && value0==level0)
   if(NormalizeDouble(value1-level,ind_digits)<0 && NormalizeDouble(value0-level0,ind_digits)==0)
      return LINE_STATE_TOUCH_BELOW;
//--- The line touched the level from above (value1>level0 && value0==level0)
   if(NormalizeDouble(value1-level,ind_digits)>0 && NormalizeDouble(value0-level0,ind_digits)==0)
      return LINE_STATE_TOUCH_BELOW;
//--- Line is equal to the level value (value1==level0 && value0==level0)
   if(NormalizeDouble(value1-level,ind_digits)==0 && NormalizeDouble(value0-level0,ind_digits)==0)
      return LINE_STATE_EQUALS;
//--- Undefined state
   return LINE_STATE_NONE;
  }
//+------------------------------------------------------------------+
//| Return the indicator line state description                      |
//+------------------------------------------------------------------+
string LineStateDescription(const ENUM_LINE_STATE state)
  {
   switch(state)
     {
      case LINE_STATE_UP         :  return "Up";
      case LINE_STATE_STOP_UP    :  return "Stop Up";
      case LINE_STATE_TURN_UP    :  return "Turn Up";
      case LINE_STATE_DOWN       :  return "Down";
      case LINE_STATE_STOP_DOWN  :  return "Stop Down";
      case LINE_STATE_TURN_DOWN  :  return "Turn Down";
      case LINE_STATE_ABOVE      :  return "Above level";
      case LINE_STATE_UNDER      :  return "Under level";
      case LINE_STATE_CROSS_UP   :  return "Crossing Up";
      case LINE_STATE_CROSS_DOWN :  return "Crossing Down";
      case LINE_STATE_TOUCH_BELOW:  return "Touch from Below";
      case LINE_STATE_TOUCH_ABOVE:  return "Touch from Above";
      case LINE_STATE_EQUALS     :  return "Equals";
      default                    :  return "Unknown";
     }
  }
Ao usar o painel de informações, os dados são exibidos no painel por meio de uma função:
//+------------------------------------------------------------------+
//| Display data from the specified timeseries index to the panel    |
//+------------------------------------------------------------------+
void DrawData(const int index,const datetime time)
  {
//--- Declare the variables to receive data in them
   MqlTick  tick={0};
   MqlRates rates[1];

//--- Exit if unable to get the current prices
   if(!SymbolInfoTick(Symbol(),tick))
      return;
//--- Exit if unable to get the bar data by the specified index
   if(CopyRates(Symbol(),PERIOD_CURRENT,index,1,rates)!=1)
      return;

//--- Set font parameters for bar and indicator data headers
   int  size=0;
   uint flags=0;
   uint angle=0;
   string name=panel.FontParams(size,flags,angle);
   panel.SetFontParams(name,9,FW_BOLD);
   panel.DrawText("Bar data ["+(string)index+"]",3,panel.TableY1(0)-16,clrMaroon,panel.Width()-6);
   panel.DrawText("Indicator data ["+(string)index+"]",3,panel.TableY1(1)-16,clrGreen,panel.Width()-6);
//--- Set font parameters for bar and indicator data
   panel.SetFontParams(name,9);

//--- Display the data of the specified bar in table 0 on the panel
   panel.DrawText("Date",  panel.CellX(0,0,0)+2, panel.CellY(0,0,0)+2); panel.DrawText(TimeToString(  rates[0].time,TIME_DATE),     panel.CellX(0,0,1)+2, panel.CellY(0,0,1)+2,clrNONE,90);
   panel.DrawText("Time",  panel.CellX(0,1,0)+2, panel.CellY(0,1,0)+2); panel.DrawText(TimeToString(  rates[0].time,TIME_MINUTES),  panel.CellX(0,1,1)+2, panel.CellY(0,1,1)+2,clrNONE,90);
   panel.DrawText("Open",  panel.CellX(0,2,0)+2, panel.CellY(0,2,0)+2); panel.DrawText(DoubleToString(rates[0].open,Digits()),      panel.CellX(0,2,1)+2, panel.CellY(0,2,1)+2,clrNONE,90);
   panel.DrawText("High",  panel.CellX(0,3,0)+2, panel.CellY(0,3,0)+2); panel.DrawText(DoubleToString(rates[0].high,Digits()),      panel.CellX(0,3,1)+2, panel.CellY(0,3,1)+2,clrNONE,90);
   panel.DrawText("Low",   panel.CellX(0,4,0)+2, panel.CellY(0,4,0)+2); panel.DrawText(DoubleToString(rates[0].low,Digits()),       panel.CellX(0,4,1)+2, panel.CellY(0,4,1)+2,clrNONE,90);
   panel.DrawText("Close", panel.CellX(0,5,0)+2, panel.CellY(0,5,0)+2); panel.DrawText(DoubleToString(rates[0].close,Digits()),     panel.CellX(0,5,1)+2, panel.CellY(0,5,1)+2,clrNONE,90);

//--- Display the indicator data from the specified bar on the panel in table 1
   panel.DrawText(ind_title, panel.CellX(1,0,0)+2, panel.CellY(1,0,0)+2);
   double value=IndicatorValue(handle,index,0);
   string value_str=(value!=EMPTY_VALUE ? DoubleToString(value,ind_digits) : "");
   panel.DrawText(value_str,panel.CellX(1,0,1)+2,panel.CellY(1,0,1)+2,clrNONE,90);

//--- Display a description of the indicator line state
   panel.DrawText("Line state", panel.CellX(1,1,0)+2, panel.CellY(1,1,0)+2);
   ENUM_LINE_STATE state=LineState(handle,index,0);
   color clr=(value<0 ? clrRed : value>0 ? clrBlue : clrNONE); // The label color changes depending on the value of the line above/below zero
   panel.DrawText(LineStateDescription(state),panel.CellX(1,1,1)+2,panel.CellY(1,1,1)+2,clr,90);

//--- Redraw the chart to immediately display all changes on the panel
   ChartRedraw(ChartID());
  }
Os valores da linha do indicador acima/abaixo de zero são marcados com cores no painel.
Adicionalmente, no manipulador de eventos OnChartEvent() do EA, chama-se o manipulador de eventos do painel e processam-se eventos para recuperar o índice da barra sob o cursor:
//+------------------------------------------------------------------+
//| ChartEvent function                                              |
//+------------------------------------------------------------------+
void OnChartEvent(const int id,
                  const long &lparam,
                  const double &dparam,
                  const string &sparam)
  {
//--- Handling the panel
//--- Call the panel event handler
   panel.OnChartEvent(id,lparam,dparam,sparam);

//--- If the cursor moves or a click is made on the chart
   if(id==CHARTEVENT_MOUSE_MOVE || id==CHARTEVENT_CLICK)
     {
      //--- Declare the variables to record time and price coordinates in them
      datetime time=0;
      double price=0;
      int wnd=0;
      //--- If the cursor coordinates are converted to date and time
      if(ChartXYToTimePrice(ChartID(),(int)lparam,(int)dparam,wnd,time,price))
        {
         //--- write the bar index where the cursor is located to a global variable
         mouse_bar_index=iBarShift(Symbol(),PERIOD_CURRENT,time);
         //--- Display the bar data under the cursor on the panel
         DrawData(mouse_bar_index,time);
        }
     }

//--- If we received a custom event, display the appropriate message in the journal
   if(id>CHARTEVENT_CUSTOM)
     {
      //--- Here we can implement handling a click on the close button on the panel
      PrintFormat("%s: Event id=%ld, object id (lparam): %lu, event message (sparam): %s",__FUNCTION__,id,lparam,sparam);
     }
  }
Após compilar o EA e executá-lo no gráfico, podemos monitorar o estado da linha do indicador no painel:
O arquivo do EA "TestOscillatorCHO.mq5" pode ser encontrado nos arquivos anexados ao artigo.
Commodity Channel Index
O indicador técnico Índice de Canal de Commodities (Commodity Channel Index, CCI) mede o desvio do preço de um instrumento em relação ao seu preço médio. Valores altos do índice indicam que o preço está anormalmente alto em comparação com a média, e valores baixos indicam que está demasiadamente baixo. Apesar do nome, o Commodity Channel Index pode ser aplicado a qualquer instrumento financeiro, não apenas a commodities.
São duas as maneiras básicas de usar o CCI:
- Como identificador divergências
Uma divergência ocorre quando o preço atinge um novo máximo e o Commodity Channel Index falha em subir acima de seus máximos anteriores. Essa divergência clássica geralmente é seguida por uma correção de preço. - Como indicador de sobrecompra/sobrevenda
O Índice de Canal de Commodities geralmente varia dentro de uma faixa de ±100. Valores acima de +100 indicam uma condição de sobrecompra (e uma potencial correção descendente), enquanto valores abaixo de -100 indicam uma condição de sobrevenda (e uma potencial correção ascendente).
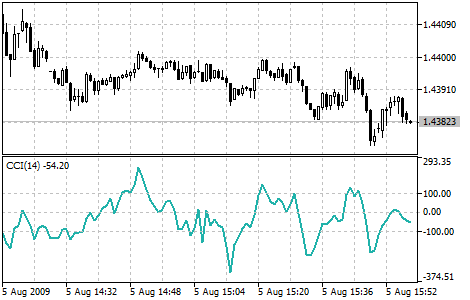
Parâmetros
O indicador tem dois parâmetros ajustáveis:
- Período de cálculo, por padrão — 14
- Preço de cálculo, por padrão — Typical Price (HLC/3)
Além dos parâmetros de entrada padrão do indicador, os níveis de sobrecompra e sobrevenda podem ser usados para identificar seus sinais. Esses níveis também devem ser especificados nos parâmetros de entrada do EA.
Variáveis de entrada e globais para uso do indicador no EA:
//+------------------------------------------------------------------+
//|                                            TestOscillatorCCI.mq5 |
//|                                  Copyright 2023, MetaQuotes Ltd. |
//|                                             https://www.mql5.com |
//+------------------------------------------------------------------+
#property copyright "Copyright 2023, MetaQuotes Ltd."
#property link      "https://www.mql5.com"
#property version   "1.00"
//--- enums
enum ENUM_LINE_STATE
  {
   LINE_STATE_NONE,        // Undefined state
   LINE_STATE_UP,          // Upward
   LINE_STATE_DOWN,        // Downward
   LINE_STATE_TURN_UP,     // Upward reversal
   LINE_STATE_TURN_DOWN,   // Downward reversal
   LINE_STATE_STOP_UP,     // Upward stop
   LINE_STATE_STOP_DOWN,   // Downward stop
   LINE_STATE_ABOVE,       // Above value
   LINE_STATE_UNDER,       // Below value
   LINE_STATE_CROSS_UP,    // Crossing value upwards
   LINE_STATE_CROSS_DOWN,  // Crossing value downwards
   LINE_STATE_TOUCH_BELOW, // Touching value from below
   LINE_STATE_TOUCH_ABOVE, // Touch value from above
   LINE_STATE_EQUALS,      // Equal to value
  };
//--- input parameters
input uint                 InpPeriod   =  14;            /* CCI Period     */
input ENUM_APPLIED_PRICE   InpPrice    =  PRICE_TYPICAL; /* Applied Price  */
input double               InpOverbough=  100.0;         /* Overbough level*/
input double               InpOversold = -100.0;         /* Oversold level */
//--- global variables
int      handle=INVALID_HANDLE;  // Indicator handle
int      period=0;               // CCI calculation period
int      ind_digits=0;           // Number of decimal places in the indicator values
double   overbough=0;            // Overbought level
double   oversold=0;             // Oversold level
string   ind_title;              // Indicator description
Ao usar o painel de informações, inclui-se o arquivo da classe do painel e adicionam-se variáveis para trabalhar com ele:
//+------------------------------------------------------------------+
//|                                            TestOscillatorCCI.mq5 |
//|                                  Copyright 2023, MetaQuotes Ltd. |
//|                                             https://www.mql5.com |
//+------------------------------------------------------------------+
#property copyright "Copyright 2023, MetaQuotes Ltd."
#property link      "https://www.mql5.com"
#property version   "1.00"
//--- includes
#include <Dashboard\Dashboard.mqh>
//--- enums
enum ENUM_LINE_STATE
  {
   LINE_STATE_NONE,        // Undefined state
   LINE_STATE_UP,          // Upward
   LINE_STATE_DOWN,        // Downward
   LINE_STATE_TURN_UP,     // Upward reversal
   LINE_STATE_TURN_DOWN,   // Downward reversal
   LINE_STATE_STOP_UP,     // Upward stop
   LINE_STATE_STOP_DOWN,   // Downward stop
   LINE_STATE_ABOVE,       // Above value
   LINE_STATE_UNDER,       // Below value
   LINE_STATE_CROSS_UP,    // Crossing value upwards
   LINE_STATE_CROSS_DOWN,  // Crossing value downwards
   LINE_STATE_TOUCH_BELOW, // Touching value from below
   LINE_STATE_TOUCH_ABOVE, // Touch value from above
   LINE_STATE_EQUALS,      // Equal to value
  };
//--- input parameters
input uint                 InpPeriod   =  14;            /* CCI Period     */
input ENUM_APPLIED_PRICE   InpPrice    =  PRICE_TYPICAL; /* Applied Price  */
input double               InpOverbough=  100.0;         /* Overbough level*/
input double               InpOversold = -100.0;         /* Oversold level */
//--- global variables
int      handle=INVALID_HANDLE;  // Indicator handle
int      period=0;               // CCI calculation period
int      ind_digits=0;           // Number of decimal places in the indicator values
double   overbough=0;            // Overbought level
double   oversold=0;             // Oversold level
string   ind_title;              // Indicator description
//--- variables for the panel
int      mouse_bar_index;        // Index of the bar the data is taken from
CDashboard *panel=NULL;          // Pointer to the panel object
Inicialização
Manipulador OnInit() para inicializar os parâmetros do indicador e criar seu handle:
//+------------------------------------------------------------------+
//| Expert initialization function                                   |
//+------------------------------------------------------------------+
int OnInit()
  {
//--- create timer
   EventSetTimer(60);

//--- Indicator
//--- Set and adjust the calculation period and levels if necessary
   period=int(InpPeriod<1 ? 14  : InpPeriod<2 ? 2 : InpPeriod);
   overbough=InpOverbough;
   oversold=(InpOversold>=overbough ? overbough-0.01 : InpOversold);
//--- Set the indicator name and the number of decimal places
   ind_title=StringFormat("CCI(%lu)",period);
   ind_digits=2;
//--- Create indicator handle
   ResetLastError();
   handle=iCCI(Symbol(),PERIOD_CURRENT,period,InpPrice);
   if(handle==INVALID_HANDLE)
     {
      PrintFormat("%s: Failed to create indicator handle %s. Error %ld",__FUNCTION__,ind_title,GetLastError());
      return INIT_FAILED;
     }

//--- Successful initialization
   return(INIT_SUCCEEDED);
  }
Ao usar o painel de informações, cria-se o painel:
//+------------------------------------------------------------------+
//| Expert initialization function                                   |
//+------------------------------------------------------------------+
int OnInit()
  {
//--- create timer
   EventSetTimer(60);

//--- Indicator
//--- Set and adjust the calculation period and levels if necessary
   period=int(InpPeriod<1 ? 14  : InpPeriod<2 ? 2 : InpPeriod);
   overbough=InpOverbough;
   oversold=(InpOversold>=overbough ? overbough-0.01 : InpOversold);
//--- Set the indicator name and the number of decimal places
   ind_title=StringFormat("CCI(%lu)",period);
   ind_digits=2;
//--- Create indicator handle
   ResetLastError();
   handle=iCCI(Symbol(),PERIOD_CURRENT,period,InpPrice);
   if(handle==INVALID_HANDLE)
     {
      PrintFormat("%s: Failed to create indicator handle %s. Error %ld",__FUNCTION__,ind_title,GetLastError());
      return INIT_FAILED;
     }

//--- Dashboard
//--- Create the panel
   panel=new CDashboard(1,20,20,229,243);
   if(panel==NULL)
     {
      Print("Error. Failed to create panel object");
      return INIT_FAILED;
     }
//--- Set font parameters
   panel.SetFontParams("Calibri",9);
//--- Display the panel with the "Symbol, Timeframe description" header text
   panel.View(Symbol()+", "+StringSubstr(EnumToString(Period()),7));
//--- Create a table with ID 0 to display bar data in it
   panel.CreateNewTable(0);
//--- Draw a table with ID 0 on the panel background
   panel.DrawGrid(0,2,20,6,2,18,112);

//--- Create a table with ID 1 to display indicator data in it
   panel.CreateNewTable(1);
//--- Get the Y2 table coordinate with ID 0 and
//--- set the Y1 coordinate for the table with ID 1
   int y1=panel.TableY2(0)+22;
//--- Draw a table with ID 1 on the panel background
   panel.DrawGrid(1,2,y1,4,2,18,112);

//--- Display tabular data in the journal
   panel.GridPrint(0,2);
   panel.GridPrint(1,2);
//--- Initialize the variable with the index of the mouse cursor bar
   mouse_bar_index=0;
//--- Display the data of the current bar on the panel
   DrawData(mouse_bar_index,TimeCurrent());

//--- Successful initialization
   return(INIT_SUCCEEDED);
  }
Desinicialização
No manipulador OnDeinit() do EA, libera-se o handle do indicador:
//+------------------------------------------------------------------+
//| Expert deinitialization function                                 |
//+------------------------------------------------------------------+
void OnDeinit(const int reason)
  {
//--- destroy timer
   EventKillTimer();

//--- Release handle of the indicator
   ResetLastError();
   if(!IndicatorRelease(handle))
      PrintFormat("%s: IndicatorRelease failed. Error %ld",__FUNCTION__,GetLastError());
//--- Clear all comments on the chart
   Comment("");
  }
Ao usar o painel de informações, remove-se o objeto do painel criado:
//+------------------------------------------------------------------+
//| Expert deinitialization function                                 |
//+------------------------------------------------------------------+
void OnDeinit(const int reason)
  {
//--- destroy timer
   EventKillTimer();

//--- Release handle of the indicator
   ResetLastError();
   if(!IndicatorRelease(handle))
      PrintFormat("%s: IndicatorRelease failed. Error %ld",__FUNCTION__,GetLastError());
//--- Clear all comments on the chart
   Comment("");

//--- If the panel object exists, delete it
   if(panel!=NULL)
      delete panel;
  }
Recuperação de dados
Funções comuns para recuperar dados através do handle do indicador:
//+------------------------------------------------------------------+
//| Return the indicator data on the specified bar                   |
//+------------------------------------------------------------------+
double IndicatorValue(const int ind_handle,const int index,const int buffer_num)
  {
   double array[1]={0};
   ResetLastError();
   if(CopyBuffer(ind_handle,buffer_num,index,1,array)!=1)
     {
      PrintFormat("%s: CopyBuffer failed. Error %ld",__FUNCTION__,GetLastError());
      return EMPTY_VALUE;
     }
   return array[0];
  }
//+------------------------------------------------------------------+
//| Return the state of the indicator line                           |
//+------------------------------------------------------------------+
ENUM_LINE_STATE LineState(const int ind_handle,const int index,const int buffer_num)
  {
//--- Get the values of the indicator line with the shift (0,1,2) relative to the passed index
   const double value0=IndicatorValue(ind_handle,index,  buffer_num);
   const double value1=IndicatorValue(ind_handle,index+1,buffer_num);
   const double value2=IndicatorValue(ind_handle,index+2,buffer_num);
//--- If at least one of the values could not be obtained, return an undefined value
   if(value0==EMPTY_VALUE || value1==EMPTY_VALUE || value2==EMPTY_VALUE)
      return LINE_STATE_NONE;
//--- Line upward reversal (value2>value1 && value0>value1)
   if(NormalizeDouble(value2-value1,ind_digits)>0 && NormalizeDouble(value0-value1,ind_digits)>0)
      return LINE_STATE_TURN_UP;
//--- Line upward direction (value2<=value1 && value0>value1)
   else if(NormalizeDouble(value2-value1,ind_digits)<=0 && NormalizeDouble(value0-value1,ind_digits)>0)
      return LINE_STATE_UP;
//--- Line upward stop (value2<=value1 && value0==value1)
   else if(NormalizeDouble(value2-value1,ind_digits)<=0 && NormalizeDouble(value0-value1,ind_digits)==0)
      return LINE_STATE_STOP_UP;
//--- Line downward reversal (value2<value1 && value0<value1)
   if(NormalizeDouble(value2-value1,ind_digits)<0 && NormalizeDouble(value0-value1,ind_digits)<0)
      return LINE_STATE_TURN_DOWN;
//--- Line downward direction (value2>=value1 && value0<value1)
   else if(NormalizeDouble(value2-value1,ind_digits)>=0 && NormalizeDouble(value0-value1,ind_digits)<0)
      return LINE_STATE_DOWN;
//--- Line downward stop (value2>=value1 && value0==value1)
   else if(NormalizeDouble(value2-value1,ind_digits)>=0 && NormalizeDouble(value0-value1,ind_digits)==0)
      return LINE_STATE_STOP_DOWN;
//--- Undefined state
   return LINE_STATE_NONE;
  }
//+------------------------------------------------------------------+
//| Return the state of the line relative to the specified level     |
//+------------------------------------------------------------------+
ENUM_LINE_STATE LineStateRelative(const int ind_handle,const int index,const int buffer_num,const double level0,const double level1=EMPTY_VALUE)
  {
//--- Get the values of the indicator line with the shift (0,1) relative to the passed index
   const double value0=IndicatorValue(ind_handle,index,  buffer_num);
   const double value1=IndicatorValue(ind_handle,index+1,buffer_num);
//--- If at least one of the values could not be obtained, return an undefined value
   if(value0==EMPTY_VALUE || value1==EMPTY_VALUE)
      return LINE_STATE_NONE;
//--- Define the second level to compare
   double level=(level1==EMPTY_VALUE ? level0 : level1);
//--- The line is below the level (value1<level && value0<level0)
   if(NormalizeDouble(value1-level,ind_digits)<0 && NormalizeDouble(value0-level0,ind_digits)<0)
      return LINE_STATE_UNDER;
//--- The line is above the level (value1>level && value0>level0)
   if(NormalizeDouble(value1-level,ind_digits)>0 && NormalizeDouble(value0-level0,ind_digits)>0)
      return LINE_STATE_ABOVE;
//--- The line crossed the level upwards (value1<=level && value0>level0)
   if(NormalizeDouble(value1-level,ind_digits)<=0 && NormalizeDouble(value0-level0,ind_digits)>0)
      return LINE_STATE_CROSS_UP;
//--- The line crossed the level downwards (value1>=level && value0<level0)
   if(NormalizeDouble(value1-level,ind_digits)>=0 && NormalizeDouble(value0-level0,ind_digits)<0)
      return LINE_STATE_CROSS_DOWN;
//--- The line touched the level from below (value1<level0 && value0==level0)
   if(NormalizeDouble(value1-level,ind_digits)<0 && NormalizeDouble(value0-level0,ind_digits)==0)
      return LINE_STATE_TOUCH_BELOW;
//--- The line touched the level from above (value1>level0 && value0==level0)
   if(NormalizeDouble(value1-level,ind_digits)>0 && NormalizeDouble(value0-level0,ind_digits)==0)
      return LINE_STATE_TOUCH_BELOW;
//--- Line is equal to the level value (value1==level0 && value0==level0)
   if(NormalizeDouble(value1-level,ind_digits)==0 && NormalizeDouble(value0-level0,ind_digits)==0)
      return LINE_STATE_EQUALS;
//--- Undefined state
   return LINE_STATE_NONE;
  }
//+------------------------------------------------------------------+
//| Return the indicator line state description                      |
//+------------------------------------------------------------------+
string LineStateDescription(const ENUM_LINE_STATE state)
  {
   switch(state)
     {
      case LINE_STATE_UP         :  return "Up";
      case LINE_STATE_STOP_UP    :  return "Stop Up";
      case LINE_STATE_TURN_UP    :  return "Turn Up";
      case LINE_STATE_DOWN       :  return "Down";
      case LINE_STATE_STOP_DOWN  :  return "Stop Down";
      case LINE_STATE_TURN_DOWN  :  return "Turn Down";
      case LINE_STATE_ABOVE      :  return "Above level";
      case LINE_STATE_UNDER      :  return "Under level";
      case LINE_STATE_CROSS_UP   :  return "Crossing Up";
      case LINE_STATE_CROSS_DOWN :  return "Crossing Down";
      case LINE_STATE_TOUCH_BELOW:  return "Touch from Below";
      case LINE_STATE_TOUCH_ABOVE:  return "Touch from Above";
      case LINE_STATE_EQUALS     :  return "Equals";
      default                    :  return "Unknown";
     }
  }
Ao usar o painel de informações, os dados são exibidos no painel por meio de uma função:
//+------------------------------------------------------------------+
//| Display data from the specified timeseries index to the panel    |
//+------------------------------------------------------------------+
void DrawData(const int index,const datetime time)
  {
//--- Declare the variables to receive data in them
   MqlTick  tick={0};
   MqlRates rates[1];

//--- Exit if unable to get the current prices
   if(!SymbolInfoTick(Symbol(),tick))
      return;
//--- Exit if unable to get the bar data by the specified index
   if(CopyRates(Symbol(),PERIOD_CURRENT,index,1,rates)!=1)
      return;

//--- Set font parameters for bar and indicator data headers
   int  size=0;
   uint flags=0;
   uint angle=0;
   string name=panel.FontParams(size,flags,angle);
   panel.SetFontParams(name,9,FW_BOLD);
   panel.DrawText("Bar data ["+(string)index+"]",3,panel.TableY1(0)-16,clrMaroon,panel.Width()-6);
   panel.DrawText("Indicator data ["+(string)index+"]",3,panel.TableY1(1)-16,clrGreen,panel.Width()-6);
//--- Set font parameters for bar and indicator data
   panel.SetFontParams(name,9);

//--- Display the data of the specified bar in table 0 on the panel
   panel.DrawText("Date",  panel.CellX(0,0,0)+2, panel.CellY(0,0,0)+2); panel.DrawText(TimeToString(  rates[0].time,TIME_DATE),     panel.CellX(0,0,1)+2, panel.CellY(0,0,1)+2,clrNONE,90);
   panel.DrawText("Time",  panel.CellX(0,1,0)+2, panel.CellY(0,1,0)+2); panel.DrawText(TimeToString(  rates[0].time,TIME_MINUTES),  panel.CellX(0,1,1)+2, panel.CellY(0,1,1)+2,clrNONE,90);
   panel.DrawText("Open",  panel.CellX(0,2,0)+2, panel.CellY(0,2,0)+2); panel.DrawText(DoubleToString(rates[0].open,Digits()),      panel.CellX(0,2,1)+2, panel.CellY(0,2,1)+2,clrNONE,90);
   panel.DrawText("High",  panel.CellX(0,3,0)+2, panel.CellY(0,3,0)+2); panel.DrawText(DoubleToString(rates[0].high,Digits()),      panel.CellX(0,3,1)+2, panel.CellY(0,3,1)+2,clrNONE,90);
   panel.DrawText("Low",   panel.CellX(0,4,0)+2, panel.CellY(0,4,0)+2); panel.DrawText(DoubleToString(rates[0].low,Digits()),       panel.CellX(0,4,1)+2, panel.CellY(0,4,1)+2,clrNONE,90);
   panel.DrawText("Close", panel.CellX(0,5,0)+2, panel.CellY(0,5,0)+2); panel.DrawText(DoubleToString(rates[0].close,Digits()),     panel.CellX(0,5,1)+2, panel.CellY(0,5,1)+2,clrNONE,90);

//--- Display the indicator data from the specified bar on the panel in table 1
   panel.DrawText(ind_title, panel.CellX(1,0,0)+2, panel.CellY(1,0,0)+2);
   double value=IndicatorValue(handle,index,0);
   string value_str=(value!=EMPTY_VALUE ? DoubleToString(value,ind_digits) : "");
   panel.DrawText(value_str,panel.CellX(1,0,1)+2,panel.CellY(1,0,1)+2,clrNONE,90);

//--- Display a description of the indicator line state relative to the overbought level
   string ovb=StringFormat("%+.2f",overbough);
   panel.DrawText("Overbough", panel.CellX(1,2,0)+2, panel.CellY(1,2,0)+2);
   panel.DrawText(ovb, panel.CellX(1,2,0)+66, panel.CellY(1,2,0)+2);
   ENUM_LINE_STATE state_ovb=LineStateRelative(handle,index,0,overbough);
//--- The label color changes depending on the value of the line relative to the level
   color clr=(state_ovb==LINE_STATE_ABOVE || state_ovb==LINE_STATE_CROSS_DOWN ? clrRed : clrNONE);
   string ovb_str=(state_ovb==LINE_STATE_ABOVE ? "Inside the area" : LineStateDescription(state_ovb));
   panel.DrawText(ovb_str,panel.CellX(1,2,1)+2,panel.CellY(1,2,1)+2,clr,90);

//--- Display a description of the indicator line state relative to the oversold level
   panel.DrawText("Oversold", panel.CellX(1,3,0)+2, panel.CellY(1,3,0)+2);
   string ovs=StringFormat("%+.2f",oversold);
   panel.DrawText(ovs, panel.CellX(1,3,0)+68, panel.CellY(1,3,0)+2);
   ENUM_LINE_STATE state_ovs=LineStateRelative(handle,index,0,oversold);
//--- The label color changes depending on the value of the line relative to the level
   clr=(state_ovs==LINE_STATE_UNDER || state_ovs==LINE_STATE_CROSS_UP ? clrBlue : clrNONE);
   string ovs_str=(state_ovs==LINE_STATE_UNDER ? "Inside the area" : LineStateDescription(state_ovs));
   panel.DrawText(ovs_str,panel.CellX(1,3,1)+2,panel.CellY(1,3,1)+2,clr,90);

//--- Display a description of the indicator line state
   panel.DrawText("Line state", panel.CellX(1,1,0)+2, panel.CellY(1,1,0)+2);
   ENUM_LINE_STATE state=LineState(handle,index,0);
//--- The label color changes depending on the location of the line in the overbought/oversold areas
   clr=(state_ovb==LINE_STATE_ABOVE || state_ovb==LINE_STATE_CROSS_DOWN ? clrRed : state_ovs==LINE_STATE_UNDER || state_ovs==LINE_STATE_CROSS_UP ? clrBlue : clrNONE);
   panel.DrawText(LineStateDescription(state),panel.CellX(1,1,1)+2,panel.CellY(1,1,1)+2,clr,90);

//--- Redraw the chart to immediately display all changes on the panel
   ChartRedraw(ChartID());
  }
A localização da linha do indicador nas áreas de sobrecompra e sobrevenda, bem como os sinais nessas áreas, são marcados com cores no painel.
Adicionalmente, no manipulador de eventos OnChartEvent() do EA, chama-se o manipulador de eventos do painel e processam-se eventos para recuperar o índice da barra sob o cursor:
//+------------------------------------------------------------------+
//| ChartEvent function                                              |
//+------------------------------------------------------------------+
void OnChartEvent(const int id,
                  const long &lparam,
                  const double &dparam,
                  const string &sparam)
  {
//--- Handling the panel
//--- Call the panel event handler
   panel.OnChartEvent(id,lparam,dparam,sparam);

//--- If the cursor moves or a click is made on the chart
   if(id==CHARTEVENT_MOUSE_MOVE || id==CHARTEVENT_CLICK)
     {
      //--- Declare the variables to record time and price coordinates in them
      datetime time=0;
      double price=0;
      int wnd=0;
      //--- If the cursor coordinates are converted to date and time
      if(ChartXYToTimePrice(ChartID(),(int)lparam,(int)dparam,wnd,time,price))
        {
         //--- write the bar index where the cursor is located to a global variable
         mouse_bar_index=iBarShift(Symbol(),PERIOD_CURRENT,time);
         //--- Display the bar data under the cursor on the panel
         DrawData(mouse_bar_index,time);
        }
     }

//--- If we received a custom event, display the appropriate message in the journal
   if(id>CHARTEVENT_CUSTOM)
     {
      //--- Here we can implement handling a click on the close button on the panel
      PrintFormat("%s: Event id=%ld, object id (lparam): %lu, event message (sparam): %s",__FUNCTION__,id,lparam,sparam);
     }
  }
Após compilar o EA e executá-lo no gráfico, podemos monitorar o estado da linha do indicador no painel:
O arquivo do EA "TestOscillatorCCI.mq5" pode ser encontrado nos arquivos anexados ao artigo.
DeMarker
O indicador técnico DeMarker (DeM) é baseado na comparação do máximo da barra atual com o máximo do barra anterior. Caso o máximo da barra atual seja maior, é registrada a diferença correspondente. Caso o máximo atual seja menor ou igual ao máximo da barra anterior, é registrado o valor zero. Em seguida, são somadas as diferenças de n períodos obtidas dessa forma. O valor resultante se torna o numerador do indicador DeMarker e é dividido pelo mesmo valor mais a soma das diferenças entre os mínimos de preço da barra anterior e da barra atual. Já caso o preço mínimo atual seja maior do que o da barra anterior, é atribuído o valor zero.
Quando o DeMarker cai abaixo de 30, espera-se uma reversão para cima. Quando o DeMarker sobe acima de 70, espera-se uma reversão para baixo.
Períodos de cálculo mais longos permitem monitorar o desenvolvimento da tendência de longo prazo no mercado. Indicadores com períodos curtos permitem entrar no mercado no ponto com o menor risco e planejar o momento de realizar uma negociação de modo que ela esteja alinhada com a tendência principal.
Parâmetros
O indicador tem um parâmetro ajustável, nomeadamente o período de cálculo. Por padrão, é 14.
Além disso, como as áreas de sobrecompra/sobrevenda são usadas para encontrar sinais do indicador, elas também devem ser inseridas nos parâmetros de entrada do EA.
Variáveis de entrada e globais para uso do indicador no EA:
//+------------------------------------------------------------------+
//|                                            TestOscillatorDeM.mq5 |
//|                                  Copyright 2023, MetaQuotes Ltd. |
//|                                             https://www.mql5.com |
//+------------------------------------------------------------------+
#property copyright "Copyright 2023, MetaQuotes Ltd."
#property link      "https://www.mql5.com"
#property version   "1.00"
//--- enums
enum ENUM_LINE_STATE
  {
   LINE_STATE_NONE,        // Undefined state
   LINE_STATE_UP,          // Upward
   LINE_STATE_DOWN,        // Downward
   LINE_STATE_TURN_UP,     // Upward reversal
   LINE_STATE_TURN_DOWN,   // Downward reversal
   LINE_STATE_STOP_UP,     // Upward stop
   LINE_STATE_STOP_DOWN,   // Downward stop
   LINE_STATE_ABOVE,       // Above value
   LINE_STATE_UNDER,       // Below value
   LINE_STATE_CROSS_UP,    // Crossing value upwards
   LINE_STATE_CROSS_DOWN,  // Crossing value downwards
   LINE_STATE_TOUCH_BELOW, // Touching value from below
   LINE_STATE_TOUCH_ABOVE, // Touch value from above
   LINE_STATE_EQUALS,      // Equal to value
  };
//--- input parameters
input uint                 InpPeriod   =  14;   /* Period         */
input double               InpOverbough=  0.7;  /* Overbough level*/
input double               InpOversold =  0.3;  /* Oversold level */
//--- global variables
int      handle=INVALID_HANDLE;  // Indicator handle
int      period=0;               // DeMarker calculation period
int      ind_digits=0;           // Number of decimal places in the indicator values
double   overbough=0;            // Overbought level
double   oversold=0;             // Oversold level
string   ind_title;              // Indicator description
Ao usar o painel de informações, inclui-se o arquivo da classe do painel e adicionam-se variáveis para trabalhar com ele:
//+------------------------------------------------------------------+
//|                                            TestOscillatorDeM.mq5 |
//|                                  Copyright 2023, MetaQuotes Ltd. |
//|                                             https://www.mql5.com |
//+------------------------------------------------------------------+
#property copyright "Copyright 2023, MetaQuotes Ltd."
#property link      "https://www.mql5.com"
#property version   "1.00"
//--- includes
#include <Dashboard\Dashboard.mqh>
//--- enums
enum ENUM_LINE_STATE
  {
   LINE_STATE_NONE,        // Undefined state
   LINE_STATE_UP,          // Upward
   LINE_STATE_DOWN,        // Downward
   LINE_STATE_TURN_UP,     // Upward reversal
   LINE_STATE_TURN_DOWN,   // Downward reversal
   LINE_STATE_STOP_UP,     // Upward stop
   LINE_STATE_STOP_DOWN,   // Downward stop
   LINE_STATE_ABOVE,       // Above value
   LINE_STATE_UNDER,       // Below value
   LINE_STATE_CROSS_UP,    // Crossing value upwards
   LINE_STATE_CROSS_DOWN,  // Crossing value downwards
   LINE_STATE_TOUCH_BELOW, // Touching value from below
   LINE_STATE_TOUCH_ABOVE, // Touch value from above
   LINE_STATE_EQUALS,      // Equal to value
  };
//--- input parameters
input uint                 InpPeriod   =  14;   /* Period         */
input double               InpOverbough=  0.7;  /* Overbough level*/
input double               InpOversold =  0.3;  /* Oversold level */
//--- global variables
int      handle=INVALID_HANDLE;  // Indicator handle
int      period=0;               // DeMarker calculation period
int      ind_digits=0;           // Number of decimal places in the indicator values
double   overbough=0;            // Overbought level
double   oversold=0;             // Oversold level
string   ind_title;              // Indicator description
//--- variables for the panel
int      mouse_bar_index;        // Index of the bar the data is taken from
CDashboard *panel=NULL;          // Pointer to the panel object
Inicialização
Manipulador OnInit() para inicializar os parâmetros do indicador e criar seu handle:
//+------------------------------------------------------------------+
//| Expert initialization function                                   |
//+------------------------------------------------------------------+
int OnInit()
  {
//--- create timer
   EventSetTimer(60);

//--- Indicator
//--- Set and adjust the calculation period and levels if necessary
   period=int(InpPeriod<1 ? 14  : InpPeriod);
   overbough=InpOverbough;
   oversold=(InpOversold>=overbough ? overbough-0.01 : InpOversold);
//--- Set the indicator name and the number of decimal places
   ind_title=StringFormat("DeM(%lu)",period);
   ind_digits=3;
//--- Create indicator handle
   ResetLastError();
   handle=iDeMarker(Symbol(),PERIOD_CURRENT,period);
   if(handle==INVALID_HANDLE)
     {
      PrintFormat("%s: Failed to create indicator handle %s. Error %ld",__FUNCTION__,ind_title,GetLastError());
      return INIT_FAILED;
     }

//--- Successful initialization
   return(INIT_SUCCEEDED);
  }
Ao usar o painel de informações, cria-se o painel:
//+------------------------------------------------------------------+
//| Expert initialization function                                   |
//+------------------------------------------------------------------+
int OnInit()
  {
//--- create timer
   EventSetTimer(60);

//--- Indicator
//--- Set and adjust the calculation period and levels if necessary
   period=int(InpPeriod<1 ? 14  : InpPeriod);
   overbough=InpOverbough;
   oversold=(InpOversold>=overbough ? overbough-0.01 : InpOversold);
//--- Set the indicator name and the number of decimal places
   ind_title=StringFormat("DeM(%lu)",period);
   ind_digits=3;
//--- Create indicator handle
   ResetLastError();
   handle=iDeMarker(Symbol(),PERIOD_CURRENT,period);
   if(handle==INVALID_HANDLE)
     {
      PrintFormat("%s: Failed to create indicator handle %s. Error %ld",__FUNCTION__,ind_title,GetLastError());
      return INIT_FAILED;
     }

//--- Dashboard
//--- Create the panel
   panel=new CDashboard(1,20,20,229,243);
   if(panel==NULL)
     {
      Print("Error. Failed to create panel object");
      return INIT_FAILED;
     }
//--- Set font parameters
   panel.SetFontParams("Calibri",9);
//--- Display the panel with the "Symbol, Timeframe description" header text
   panel.View(Symbol()+", "+StringSubstr(EnumToString(Period()),7));
//--- Create a table with ID 0 to display bar data in it
   panel.CreateNewTable(0);
//--- Draw a table with ID 0 on the panel background
   panel.DrawGrid(0,2,20,6,2,18,112);

//--- Create a table with ID 1 to display indicator data in it
   panel.CreateNewTable(1);
//--- Get the Y2 table coordinate with ID 0 and
//--- set the Y1 coordinate for the table with ID 1
   int y1=panel.TableY2(0)+22;
//--- Draw a table with ID 1 on the panel background
   panel.DrawGrid(1,2,y1,4,2,18,112);

//--- Display tabular data in the journal
   panel.GridPrint(0,2);
   panel.GridPrint(1,2);
//--- Initialize the variable with the index of the mouse cursor bar
   mouse_bar_index=0;
//--- Display the data of the current bar on the panel
   DrawData(mouse_bar_index,TimeCurrent());

//--- Successful initialization
   return(INIT_SUCCEEDED);
  }
Desinicialização
No manipulador OnDeinit() do EA, libera-se o handle do indicador:
//+------------------------------------------------------------------+
//| Expert deinitialization function                                 |
//+------------------------------------------------------------------+
void OnDeinit(const int reason)
  {
//--- destroy timer
   EventKillTimer();

//--- Release handle of the indicator
   ResetLastError();
   if(!IndicatorRelease(handle))
      PrintFormat("%s: IndicatorRelease failed. Error %ld",__FUNCTION__,GetLastError());
//--- Clear all comments on the chart
   Comment("");
  }
Ao usar o painel de informações, remove-se o objeto do painel criado:
//+------------------------------------------------------------------+
//| Expert deinitialization function                                 |
//+------------------------------------------------------------------+
void OnDeinit(const int reason)
  {
//--- destroy timer
   EventKillTimer();

//--- Release handle of the indicator
   ResetLastError();
   if(!IndicatorRelease(handle))
      PrintFormat("%s: IndicatorRelease failed. Error %ld",__FUNCTION__,GetLastError());
//--- Clear all comments on the chart
   Comment("");

//--- If the panel object exists, delete it
   if(panel!=NULL)
      delete panel;
  }
Recuperação de dados
Funções comuns para recuperar dados através do handle do indicador:
//+------------------------------------------------------------------+
//| Return the indicator data on the specified bar                   |
//+------------------------------------------------------------------+
double IndicatorValue(const int ind_handle,const int index,const int buffer_num)
  {
   double array[1]={0};
   ResetLastError();
   if(CopyBuffer(ind_handle,buffer_num,index,1,array)!=1)
     {
      PrintFormat("%s: CopyBuffer failed. Error %ld",__FUNCTION__,GetLastError());
      return EMPTY_VALUE;
     }
   return array[0];
  }
//+------------------------------------------------------------------+
//| Return the state of the indicator line                           |
//+------------------------------------------------------------------+
ENUM_LINE_STATE LineState(const int ind_handle,const int index,const int buffer_num)
  {
//--- Get the values of the indicator line with the shift (0,1,2) relative to the passed index
   const double value0=IndicatorValue(ind_handle,index,  buffer_num);
   const double value1=IndicatorValue(ind_handle,index+1,buffer_num);
   const double value2=IndicatorValue(ind_handle,index+2,buffer_num);
//--- If at least one of the values could not be obtained, return an undefined value
   if(value0==EMPTY_VALUE || value1==EMPTY_VALUE || value2==EMPTY_VALUE)
      return LINE_STATE_NONE;
//--- Line upward reversal (value2>value1 && value0>value1)
   if(NormalizeDouble(value2-value1,ind_digits)>0 && NormalizeDouble(value0-value1,ind_digits)>0)
      return LINE_STATE_TURN_UP;
//--- Line upward direction (value2<=value1 && value0>value1)
   else if(NormalizeDouble(value2-value1,ind_digits)<=0 && NormalizeDouble(value0-value1,ind_digits)>0)
      return LINE_STATE_UP;
//--- Line upward stop (value2<=value1 && value0==value1)
   else if(NormalizeDouble(value2-value1,ind_digits)<=0 && NormalizeDouble(value0-value1,ind_digits)==0)
      return LINE_STATE_STOP_UP;
//--- Line downward reversal (value2<value1 && value0<value1)
   if(NormalizeDouble(value2-value1,ind_digits)<0 && NormalizeDouble(value0-value1,ind_digits)<0)
      return LINE_STATE_TURN_DOWN;
//--- Line downward direction (value2>=value1 && value0<value1)
   else if(NormalizeDouble(value2-value1,ind_digits)>=0 && NormalizeDouble(value0-value1,ind_digits)<0)
      return LINE_STATE_DOWN;
//--- Line downward stop (value2>=value1 && value0==value1)
   else if(NormalizeDouble(value2-value1,ind_digits)>=0 && NormalizeDouble(value0-value1,ind_digits)==0)
      return LINE_STATE_STOP_DOWN;
//--- Undefined state
   return LINE_STATE_NONE;
  }
//+------------------------------------------------------------------+
//| Return the state of the line relative to the specified level     |
//+------------------------------------------------------------------+
ENUM_LINE_STATE LineStateRelative(const int ind_handle,const int index,const int buffer_num,const double level0,const double level1=EMPTY_VALUE)
  {
//--- Get the values of the indicator line with the shift (0,1) relative to the passed index
   const double value0=IndicatorValue(ind_handle,index,  buffer_num);
   const double value1=IndicatorValue(ind_handle,index+1,buffer_num);
//--- If at least one of the values could not be obtained, return an undefined value
   if(value0==EMPTY_VALUE || value1==EMPTY_VALUE)
      return LINE_STATE_NONE;
//--- Define the second level to compare
   double level=(level1==EMPTY_VALUE ? level0 : level1);
//--- The line is below the level (value1<level && value0<level0)
   if(NormalizeDouble(value1-level,ind_digits)<0 && NormalizeDouble(value0-level0,ind_digits)<0)
      return LINE_STATE_UNDER;
//--- The line is above the level (value1>level && value0>level0)
   if(NormalizeDouble(value1-level,ind_digits)>0 && NormalizeDouble(value0-level0,ind_digits)>0)
      return LINE_STATE_ABOVE;
//--- The line crossed the level upwards (value1<=level && value0>level0)
   if(NormalizeDouble(value1-level,ind_digits)<=0 && NormalizeDouble(value0-level0,ind_digits)>0)
      return LINE_STATE_CROSS_UP;
//--- The line crossed the level downwards (value1>=level && value0<level0)
   if(NormalizeDouble(value1-level,ind_digits)>=0 && NormalizeDouble(value0-level0,ind_digits)<0)
      return LINE_STATE_CROSS_DOWN;
//--- The line touched the level from below (value1<level0 && value0==level0)
   if(NormalizeDouble(value1-level,ind_digits)<0 && NormalizeDouble(value0-level0,ind_digits)==0)
      return LINE_STATE_TOUCH_BELOW;
//--- The line touched the level from above (value1>level0 && value0==level0)
   if(NormalizeDouble(value1-level,ind_digits)>0 && NormalizeDouble(value0-level0,ind_digits)==0)
      return LINE_STATE_TOUCH_BELOW;
//--- Line is equal to the level value (value1==level0 && value0==level0)
   if(NormalizeDouble(value1-level,ind_digits)==0 && NormalizeDouble(value0-level0,ind_digits)==0)
      return LINE_STATE_EQUALS;
//--- Undefined state
   return LINE_STATE_NONE;
  }
//+------------------------------------------------------------------+
//| Return the indicator line state description                      |
//+------------------------------------------------------------------+
string LineStateDescription(const ENUM_LINE_STATE state)
  {
   switch(state)
     {
      case LINE_STATE_UP         :  return "Up";
      case LINE_STATE_STOP_UP    :  return "Stop Up";
      case LINE_STATE_TURN_UP    :  return "Turn Up";
      case LINE_STATE_DOWN       :  return "Down";
      case LINE_STATE_STOP_DOWN  :  return "Stop Down";
      case LINE_STATE_TURN_DOWN  :  return "Turn Down";
      case LINE_STATE_ABOVE      :  return "Above level";
      case LINE_STATE_UNDER      :  return "Under level";
      case LINE_STATE_CROSS_UP   :  return "Crossing Up";
      case LINE_STATE_CROSS_DOWN :  return "Crossing Down";
      case LINE_STATE_TOUCH_BELOW:  return "Touch from Below";
      case LINE_STATE_TOUCH_ABOVE:  return "Touch from Above";
      case LINE_STATE_EQUALS     :  return "Equals";
      default                    :  return "Unknown";
     }
  }
Ao usar o painel de informações, os dados são exibidos no painel por meio de uma função:
//+------------------------------------------------------------------+
//| Display data from the specified timeseries index to the panel    |
//+------------------------------------------------------------------+
void DrawData(const int index,const datetime time)
  {
//--- Declare the variables to receive data in them
   MqlTick  tick={0};
   MqlRates rates[1];

//--- Exit if unable to get the current prices
   if(!SymbolInfoTick(Symbol(),tick))
      return;
//--- Exit if unable to get the bar data by the specified index
   if(CopyRates(Symbol(),PERIOD_CURRENT,index,1,rates)!=1)
      return;

//--- Set font parameters for bar and indicator data headers
   int  size=0;
   uint flags=0;
   uint angle=0;
   string name=panel.FontParams(size,flags,angle);
   panel.SetFontParams(name,9,FW_BOLD);
   panel.DrawText("Bar data ["+(string)index+"]",3,panel.TableY1(0)-16,clrMaroon,panel.Width()-6);
   panel.DrawText("Indicator data ["+(string)index+"]",3,panel.TableY1(1)-16,clrGreen,panel.Width()-6);
//--- Set font parameters for bar and indicator data
   panel.SetFontParams(name,9);

//--- Display the data of the specified bar in table 0 on the panel
   panel.DrawText("Date",  panel.CellX(0,0,0)+2, panel.CellY(0,0,0)+2); panel.DrawText(TimeToString(  rates[0].time,TIME_DATE),     panel.CellX(0,0,1)+2, panel.CellY(0,0,1)+2,clrNONE,90);
   panel.DrawText("Time",  panel.CellX(0,1,0)+2, panel.CellY(0,1,0)+2); panel.DrawText(TimeToString(  rates[0].time,TIME_MINUTES),  panel.CellX(0,1,1)+2, panel.CellY(0,1,1)+2,clrNONE,90);
   panel.DrawText("Open",  panel.CellX(0,2,0)+2, panel.CellY(0,2,0)+2); panel.DrawText(DoubleToString(rates[0].open,Digits()),      panel.CellX(0,2,1)+2, panel.CellY(0,2,1)+2,clrNONE,90);
   panel.DrawText("High",  panel.CellX(0,3,0)+2, panel.CellY(0,3,0)+2); panel.DrawText(DoubleToString(rates[0].high,Digits()),      panel.CellX(0,3,1)+2, panel.CellY(0,3,1)+2,clrNONE,90);
   panel.DrawText("Low",   panel.CellX(0,4,0)+2, panel.CellY(0,4,0)+2); panel.DrawText(DoubleToString(rates[0].low,Digits()),       panel.CellX(0,4,1)+2, panel.CellY(0,4,1)+2,clrNONE,90);
   panel.DrawText("Close", panel.CellX(0,5,0)+2, panel.CellY(0,5,0)+2); panel.DrawText(DoubleToString(rates[0].close,Digits()),     panel.CellX(0,5,1)+2, panel.CellY(0,5,1)+2,clrNONE,90);

//--- Display the indicator data from the specified bar on the panel in table 1
   panel.DrawText(ind_title, panel.CellX(1,0,0)+2, panel.CellY(1,0,0)+2);
   double value=IndicatorValue(handle,index,0);
   string value_str=(value!=EMPTY_VALUE ? DoubleToString(value,ind_digits) : "");
   panel.DrawText(value_str,panel.CellX(1,0,1)+2,panel.CellY(1,0,1)+2,clrNONE,100);

//--- Display a description of the indicator line state relative to the overbought level
   string ovb=StringFormat("%+.2f",overbough);
   panel.DrawText("Overbough", panel.CellX(1,2,0)+2, panel.CellY(1,2,0)+2);
   panel.DrawText(ovb, panel.CellX(1,2,0)+66, panel.CellY(1,2,0)+2);
   ENUM_LINE_STATE state_ovb=LineStateRelative(handle,index,0,overbough);
//--- The label color changes depending on the value of the line relative to the level
   color clr=(state_ovb==LINE_STATE_ABOVE || state_ovb==LINE_STATE_CROSS_DOWN ? clrRed : clrNONE);
   string ovb_str=(state_ovb==LINE_STATE_ABOVE ? "Inside the area" : LineStateDescription(state_ovb));
   panel.DrawText(ovb_str,panel.CellX(1,2,1)+2,panel.CellY(1,2,1)+2,clr,100);

//--- Display a description of the indicator line state relative to the oversold level
   panel.DrawText("Oversold", panel.CellX(1,3,0)+2, panel.CellY(1,3,0)+2);
   string ovs=StringFormat("%+.2f",oversold);
   panel.DrawText(ovs, panel.CellX(1,3,0)+68, panel.CellY(1,3,0)+2);
   ENUM_LINE_STATE state_ovs=LineStateRelative(handle,index,0,oversold);
//--- The label color changes depending on the value of the line relative to the level
   clr=(state_ovs==LINE_STATE_UNDER || state_ovs==LINE_STATE_CROSS_UP ? clrBlue : clrNONE);
   string ovs_str=(state_ovs==LINE_STATE_UNDER ? "Inside the area" : LineStateDescription(state_ovs));
   panel.DrawText(ovs_str,panel.CellX(1,3,1)+2,panel.CellY(1,3,1)+2,clr,100);

//--- Display a description of the indicator line state
   panel.DrawText("Line state", panel.CellX(1,1,0)+2, panel.CellY(1,1,0)+2);
   ENUM_LINE_STATE state=LineState(handle,index,0);
//--- The label color changes depending on the location of the line in the overbought/oversold areas
   clr=(state_ovb==LINE_STATE_ABOVE || state_ovb==LINE_STATE_CROSS_DOWN ? clrRed : state_ovs==LINE_STATE_UNDER || state_ovs==LINE_STATE_CROSS_UP ? clrBlue : clrNONE);
   panel.DrawText(LineStateDescription(state),panel.CellX(1,1,1)+2,panel.CellY(1,1,1)+2,clr,100);

//--- Redraw the chart to immediately display all changes on the panel
   ChartRedraw(ChartID());
  }
O painel exibe em cores a localização da linha do indicador nas áreas de sobrecompra/sobrevenda.
Adicionalmente, no manipulador de eventos OnChartEvent() do EA, chama-se o manipulador de eventos do painel e processam-se eventos para recuperar o índice da barra sob o cursor:
//+------------------------------------------------------------------+
//| ChartEvent function                                              |
//+------------------------------------------------------------------+
void OnChartEvent(const int id,
                  const long &lparam,
                  const double &dparam,
                  const string &sparam)
  {
//--- Handling the panel
//--- Call the panel event handler
   panel.OnChartEvent(id,lparam,dparam,sparam);

//--- If the cursor moves or a click is made on the chart
   if(id==CHARTEVENT_MOUSE_MOVE || id==CHARTEVENT_CLICK)
     {
      //--- Declare the variables to record time and price coordinates in them
      datetime time=0;
      double price=0;
      int wnd=0;
      //--- If the cursor coordinates are converted to date and time
      if(ChartXYToTimePrice(ChartID(),(int)lparam,(int)dparam,wnd,time,price))
        {
         //--- write the bar index where the cursor is located to a global variable
         mouse_bar_index=iBarShift(Symbol(),PERIOD_CURRENT,time);
         //--- Display the bar data under the cursor on the panel
         DrawData(mouse_bar_index,time);
        }
     }

//--- If we received a custom event, display the appropriate message in the journal
   if(id>CHARTEVENT_CUSTOM)
     {
      //--- Here we can implement handling a click on the close button on the panel
      PrintFormat("%s: Event id=%ld, object id (lparam): %lu, event message (sparam): %s",__FUNCTION__,id,lparam,sparam);
     }
  }
Após compilar o EA e executá-lo no gráfico, podemos monitorar o estado da linha do indicador no painel:
O arquivo do EA "TestOscillatorDeM.mq5" pode ser encontrado nos arquivos anexados ao artigo.
Force Index
O indicador técnico Índice de Força (Force Index, FRC) foi desenvolvido por Alexander Elder e mede a força dos touros em cada aumento e a força dos ursos em cada declínio. Ele associa as informações básicas do mercado: direção/variações do preço e volume de negociações. Esse índice pode ser usado em sua forma pura, no entanto, é melhor suavizá-lo usando uma média móvel. A suavização com uma média móvel curta (o autor sugere o uso de 2 períodos) ajuda a encontrar momentos favoráveis para abrir e fechar posições. Se a suavização for feita com uma média móvel longa (por exemplo, de 13 períodos), então o índice revela mudanças de tendência.
- É aconselhável comprar quando, durante uma tendência de alta, o Force Index se tornar negativo (cair abaixo da linha zero);
- Com a subida para um novo patamar, o indicador sinaliza a continuação da tendência de alta;
- O sinal de venda é dado quando, durante uma tendência de baixa, o Force Index se torna positivo;
- Com queda para um novo fundo, o Índice de Força sinaliza a força dos ursos e a continuação da tendência de baixa;
- Se as mudanças de preços não forem apoiadas por uma mudança correspondente no volume, então o Force Index permanece no mesmo nível, o que alerta para uma iminente reversão da tendência.
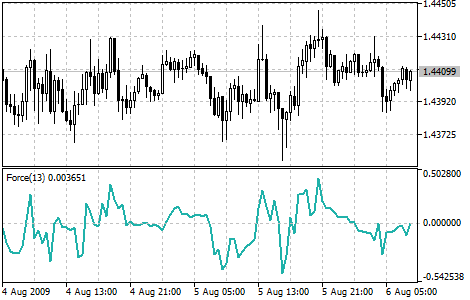
Parâmetros
O indicador tem três parâmetros ajustáveis:
- Período de cálculo, por padrão — 2,
- Método de cálculo, por padrão — SMA,
- Volumes utilizados, por padrão — volumes de tick.
Variáveis de entrada e globais para uso do indicador no EA:
//+------------------------------------------------------------------+
//|                                          TestOscillatorForce.mq5 |
//|                                  Copyright 2023, MetaQuotes Ltd. |
//|                                             https://www.mql5.com |
//+------------------------------------------------------------------+
#property copyright "Copyright 2023, MetaQuotes Ltd."
#property link      "https://www.mql5.com"
#property version   "1.00"
//--- enums
enum ENUM_LINE_STATE
  {
   LINE_STATE_NONE,        // Undefined state
   LINE_STATE_UP,          // Upward
   LINE_STATE_DOWN,        // Downward
   LINE_STATE_TURN_UP,     // Upward reversal
   LINE_STATE_TURN_DOWN,   // Downward reversal
   LINE_STATE_STOP_UP,     // Upward stop
   LINE_STATE_STOP_DOWN,   // Downward stop
   LINE_STATE_ABOVE,       // Above value
   LINE_STATE_UNDER,       // Below value
   LINE_STATE_CROSS_UP,    // Crossing value upwards
   LINE_STATE_CROSS_DOWN,  // Crossing value downwards
   LINE_STATE_TOUCH_BELOW, // Touching value from below
   LINE_STATE_TOUCH_ABOVE, // Touch value from above
   LINE_STATE_EQUALS,      // Equal to value
  };
//--- input parameters
input uint                 InpPeriod      =  13;            /* Period         */
input ENUM_MA_METHOD       InpMethod      =  MODE_SMA;      /* Method         */
input ENUM_APPLIED_VOLUME  InpAppliedVol  =  VOLUME_TICK;   /* Applied Volume */
//--- global variables
int      handle=INVALID_HANDLE;  // Indicator handle
int      period=0;               // Force Index calculation period
int      ind_digits=0;           // Number of decimal places in the indicator values
string   ind_title;              // Indicator description
Ao usar o painel de informações, inclui-se o arquivo da classe do painel e adicionam-se variáveis para trabalhar com ele:
//+------------------------------------------------------------------+
//|                                          TestOscillatorForce.mq5 |
//|                                  Copyright 2023, MetaQuotes Ltd. |
//|                                             https://www.mql5.com |
//+------------------------------------------------------------------+
#property copyright "Copyright 2023, MetaQuotes Ltd."
#property link      "https://www.mql5.com"
#property version   "1.00"
//--- includes
#include <Dashboard\Dashboard.mqh>
//--- enums
enum ENUM_LINE_STATE
  {
   LINE_STATE_NONE,        // Undefined state
   LINE_STATE_UP,          // Upward
   LINE_STATE_DOWN,        // Downward
   LINE_STATE_TURN_UP,     // Upward reversal
   LINE_STATE_TURN_DOWN,   // Downward reversal
   LINE_STATE_STOP_UP,     // Upward stop
   LINE_STATE_STOP_DOWN,   // Downward stop
   LINE_STATE_ABOVE,       // Above value
   LINE_STATE_UNDER,       // Below value
   LINE_STATE_CROSS_UP,    // Crossing value upwards
   LINE_STATE_CROSS_DOWN,  // Crossing value downwards
   LINE_STATE_TOUCH_BELOW, // Touching value from below
   LINE_STATE_TOUCH_ABOVE, // Touch value from above
   LINE_STATE_EQUALS,      // Equal to value
  };
//--- input parameters
input uint                 InpPeriod      =  13;            /* Period         */
input ENUM_MA_METHOD       InpMethod      =  MODE_SMA;      /* Method         */
input ENUM_APPLIED_VOLUME  InpAppliedVol  =  VOLUME_TICK;   /* Applied Volume */
//--- global variables
int      handle=INVALID_HANDLE;  // Indicator handle
int      period=0;               // Force Index calculation period
int      ind_digits=0;           // Number of decimal places in the indicator values
string   ind_title;              // Indicator description
//--- variables for the panel
int      mouse_bar_index;        // Index of the bar the data is taken from
CDashboard *panel=NULL;          // Pointer to the panel object
Inicialização
Manipulador OnInit() para inicializar os parâmetros do indicador e criar seu handle:
//+------------------------------------------------------------------+
//| Expert initialization function                                   |
//+------------------------------------------------------------------+
int OnInit()
  {
//--- create timer
   EventSetTimer(60);

//--- Indicator
//--- Set and adjust the calculation period if necessary
   period=int(InpPeriod<1 ? 13 : InpPeriod);
//--- Set the indicator name and the number of decimal places
   ind_title=StringFormat("Force(%lu)",period);
   ind_digits=Digits()+1;
//--- Create indicator handle
   ResetLastError();
   handle=iForce(Symbol(),PERIOD_CURRENT,period,InpMethod,InpAppliedVol);
   if(handle==INVALID_HANDLE)
     {
      PrintFormat("%s: Failed to create indicator handle %s. Error %ld",__FUNCTION__,ind_title,GetLastError());
      return INIT_FAILED;
     }

//--- Successful initialization
   return(INIT_SUCCEEDED);
  }
Ao usar o painel de informações, cria-se o painel:
//+------------------------------------------------------------------+
//| Expert initialization function                                   |
//+------------------------------------------------------------------+
int OnInit()
  {
//--- create timer
   EventSetTimer(60);

//--- Indicator
//--- Set and adjust the calculation period if necessary
   period=int(InpPeriod<1 ? 13 : InpPeriod);
//--- Set the indicator name and the number of decimal places
   ind_title=StringFormat("Force(%lu)",period);
   ind_digits=Digits()+1;
//--- Create indicator handle
   ResetLastError();
   handle=iForce(Symbol(),PERIOD_CURRENT,period,InpMethod,InpAppliedVol);
   if(handle==INVALID_HANDLE)
     {
      PrintFormat("%s: Failed to create indicator handle %s. Error %ld",__FUNCTION__,ind_title,GetLastError());
      return INIT_FAILED;
     }

//--- Dashboard
//--- Create the panel
   panel=new CDashboard(1,20,20,199,225);
   if(panel==NULL)
     {
      Print("Error. Failed to create panel object");
      return INIT_FAILED;
     }
//--- Set font parameters
   panel.SetFontParams("Calibri",9);
//--- Display the panel with the "Symbol, Timeframe description" header text
   panel.View(Symbol()+", "+StringSubstr(EnumToString(Period()),7));
//--- Create a table with ID 0 to display bar data in it
   panel.CreateNewTable(0);
//--- Draw a table with ID 0 on the panel background
   panel.DrawGrid(0,2,20,6,2,18,97);

//--- Create a table with ID 1 to display indicator data in it
   panel.CreateNewTable(1);
//--- Get the Y2 table coordinate with ID 0 and
//--- set the Y1 coordinate for the table with ID 1
   int y1=panel.TableY2(0)+22;
//--- Draw a table with ID 1 on the panel background
   panel.DrawGrid(1,2,y1,3,2,18,97);

//--- Display tabular data in the journal
   panel.GridPrint(0,2);
   panel.GridPrint(1,2);
//--- Initialize the variable with the index of the mouse cursor bar
   mouse_bar_index=0;
//--- Display the data of the current bar on the panel
   DrawData(mouse_bar_index,TimeCurrent());

//--- Successful initialization
   return(INIT_SUCCEEDED);
  }
Desinicialização
No manipulador OnDeinit() do EA, libera-se o handle do indicador:
//+------------------------------------------------------------------+
//| Expert deinitialization function                                 |
//+------------------------------------------------------------------+
void OnDeinit(const int reason)
  {
//--- destroy timer
   EventKillTimer();

//--- Release handle of the indicator
   ResetLastError();
   if(!IndicatorRelease(handle))
      PrintFormat("%s: IndicatorRelease failed. Error %ld",__FUNCTION__,GetLastError());
//--- Clear all comments on the chart
   Comment("");
  }
Ao usar o painel de informações, remove-se o objeto do painel criado:
//+------------------------------------------------------------------+
//| Expert deinitialization function                                 |
//+------------------------------------------------------------------+
void OnDeinit(const int reason)
  {
//--- destroy timer
   EventKillTimer();

//--- Release handle of the indicator
   ResetLastError();
   if(!IndicatorRelease(handle))
      PrintFormat("%s: IndicatorRelease failed. Error %ld",__FUNCTION__,GetLastError());
//--- Clear all comments on the chart
   Comment("");

//--- If the panel object exists, delete it
   if(panel!=NULL)
      delete panel;
  }
Recuperação de dados
Funções comuns para recuperar dados através do handle do indicador:
//+------------------------------------------------------------------+
//| Return the indicator data on the specified bar                   |
//+------------------------------------------------------------------+
double IndicatorValue(const int ind_handle,const int index,const int buffer_num)
  {
   double array[1]={0};
   ResetLastError();
   if(CopyBuffer(ind_handle,buffer_num,index,1,array)!=1)
     {
      PrintFormat("%s: CopyBuffer failed. Error %ld",__FUNCTION__,GetLastError());
      return EMPTY_VALUE;
     }
   return array[0];
  }
//+------------------------------------------------------------------+
//| Return the state of the indicator line                           |
//+------------------------------------------------------------------+
ENUM_LINE_STATE LineState(const int ind_handle,const int index,const int buffer_num)
  {
//--- Get the values of the indicator line with the shift (0,1,2) relative to the passed index
   const double value0=IndicatorValue(ind_handle,index,  buffer_num);
   const double value1=IndicatorValue(ind_handle,index+1,buffer_num);
   const double value2=IndicatorValue(ind_handle,index+2,buffer_num);
//--- If at least one of the values could not be obtained, return an undefined value
   if(value0==EMPTY_VALUE || value1==EMPTY_VALUE || value2==EMPTY_VALUE)
      return LINE_STATE_NONE;
//--- Line upward reversal (value2>value1 && value0>value1)
   if(NormalizeDouble(value2-value1,ind_digits)>0 && NormalizeDouble(value0-value1,ind_digits)>0)
      return LINE_STATE_TURN_UP;
//--- Line upward direction (value2<=value1 && value0>value1)
   else if(NormalizeDouble(value2-value1,ind_digits)<=0 && NormalizeDouble(value0-value1,ind_digits)>0)
      return LINE_STATE_UP;
//--- Line upward stop (value2<=value1 && value0==value1)
   else if(NormalizeDouble(value2-value1,ind_digits)<=0 && NormalizeDouble(value0-value1,ind_digits)==0)
      return LINE_STATE_STOP_UP;
//--- Line downward reversal (value2<value1 && value0<value1)
   if(NormalizeDouble(value2-value1,ind_digits)<0 && NormalizeDouble(value0-value1,ind_digits)<0)
      return LINE_STATE_TURN_DOWN;
//--- Line downward direction (value2>=value1 && value0<value1)
   else if(NormalizeDouble(value2-value1,ind_digits)>=0 && NormalizeDouble(value0-value1,ind_digits)<0)
      return LINE_STATE_DOWN;
//--- Line downward stop (value2>=value1 && value0==value1)
   else if(NormalizeDouble(value2-value1,ind_digits)>=0 && NormalizeDouble(value0-value1,ind_digits)==0)
      return LINE_STATE_STOP_DOWN;
//--- Undefined state
   return LINE_STATE_NONE;
  }
//+------------------------------------------------------------------+
//| Return the state of the line relative to the specified level     |
//+------------------------------------------------------------------+
ENUM_LINE_STATE LineStateRelative(const int ind_handle,const int index,const int buffer_num,const double level0,const double level1=EMPTY_VALUE)
  {
//--- Get the values of the indicator line with the shift (0,1) relative to the passed index
   const double value0=IndicatorValue(ind_handle,index,  buffer_num);
   const double value1=IndicatorValue(ind_handle,index+1,buffer_num);
//--- If at least one of the values could not be obtained, return an undefined value
   if(value0==EMPTY_VALUE || value1==EMPTY_VALUE)
      return LINE_STATE_NONE;
//--- Define the second level to compare
   double level=(level1==EMPTY_VALUE ? level0 : level1);
//--- The line is below the level (value1<level && value0<level0)
   if(NormalizeDouble(value1-level,ind_digits)<0 && NormalizeDouble(value0-level0,ind_digits)<0)
      return LINE_STATE_UNDER;
//--- The line is above the level (value1>level && value0>level0)
   if(NormalizeDouble(value1-level,ind_digits)>0 && NormalizeDouble(value0-level0,ind_digits)>0)
      return LINE_STATE_ABOVE;
//--- The line crossed the level upwards (value1<=level && value0>level0)
   if(NormalizeDouble(value1-level,ind_digits)<=0 && NormalizeDouble(value0-level0,ind_digits)>0)
      return LINE_STATE_CROSS_UP;
//--- The line crossed the level downwards (value1>=level && value0<level0)
   if(NormalizeDouble(value1-level,ind_digits)>=0 && NormalizeDouble(value0-level0,ind_digits)<0)
      return LINE_STATE_CROSS_DOWN;
//--- The line touched the level from below (value1<level0 && value0==level0)
   if(NormalizeDouble(value1-level,ind_digits)<0 && NormalizeDouble(value0-level0,ind_digits)==0)
      return LINE_STATE_TOUCH_BELOW;
//--- The line touched the level from above (value1>level0 && value0==level0)
   if(NormalizeDouble(value1-level,ind_digits)>0 && NormalizeDouble(value0-level0,ind_digits)==0)
      return LINE_STATE_TOUCH_BELOW;
//--- Line is equal to the level value (value1==level0 && value0==level0)
   if(NormalizeDouble(value1-level,ind_digits)==0 && NormalizeDouble(value0-level0,ind_digits)==0)
      return LINE_STATE_EQUALS;
//--- Undefined state
   return LINE_STATE_NONE;
  }
//+------------------------------------------------------------------+
//| Return the indicator line state description                      |
//+------------------------------------------------------------------+
string LineStateDescription(const ENUM_LINE_STATE state)
  {
   switch(state)
     {
      case LINE_STATE_UP         :  return "Up";
      case LINE_STATE_STOP_UP    :  return "Stop Up";
      case LINE_STATE_TURN_UP    :  return "Turn Up";
      case LINE_STATE_DOWN       :  return "Down";
      case LINE_STATE_STOP_DOWN  :  return "Stop Down";
      case LINE_STATE_TURN_DOWN  :  return "Turn Down";
      case LINE_STATE_ABOVE      :  return "Above level";
      case LINE_STATE_UNDER      :  return "Under level";
      case LINE_STATE_CROSS_UP   :  return "Crossing Up";
      case LINE_STATE_CROSS_DOWN :  return "Crossing Down";
      case LINE_STATE_TOUCH_BELOW:  return "Touch from Below";
      case LINE_STATE_TOUCH_ABOVE:  return "Touch from Above";
      case LINE_STATE_EQUALS     :  return "Equals";
      default                    :  return "Unknown";
     }
  }
Ao usar o painel de informações, os dados são exibidos no painel por meio de uma função:
//+------------------------------------------------------------------+
//| Display data from the specified timeseries index to the panel    |
//+------------------------------------------------------------------+
void DrawData(const int index,const datetime time)
  {
//--- Declare the variables to receive data in them
   MqlTick  tick={0};
   MqlRates rates[1];

//--- Exit if unable to get the current prices
   if(!SymbolInfoTick(Symbol(),tick))
      return;
//--- Exit if unable to get the bar data by the specified index
   if(CopyRates(Symbol(),PERIOD_CURRENT,index,1,rates)!=1)
      return;

//--- Set font parameters for bar and indicator data headers
   int  size=0;
   uint flags=0;
   uint angle=0;
   string name=panel.FontParams(size,flags,angle);
   panel.SetFontParams(name,9,FW_BOLD);
   panel.DrawText("Bar data ["+(string)index+"]",3,panel.TableY1(0)-16,clrMaroon,panel.Width()-6);
   panel.DrawText("Indicator data ["+(string)index+"]",3,panel.TableY1(1)-16,clrGreen,panel.Width()-6);
//--- Set font parameters for bar and indicator data
   panel.SetFontParams(name,9);

//--- Display the data of the specified bar in table 0 on the panel
   panel.DrawText("Date",  panel.CellX(0,0,0)+2, panel.CellY(0,0,0)+2); panel.DrawText(TimeToString(  rates[0].time,TIME_DATE),     panel.CellX(0,0,1)+2, panel.CellY(0,0,1)+2,clrNONE,90);
   panel.DrawText("Time",  panel.CellX(0,1,0)+2, panel.CellY(0,1,0)+2); panel.DrawText(TimeToString(  rates[0].time,TIME_MINUTES),  panel.CellX(0,1,1)+2, panel.CellY(0,1,1)+2,clrNONE,90);
   panel.DrawText("Open",  panel.CellX(0,2,0)+2, panel.CellY(0,2,0)+2); panel.DrawText(DoubleToString(rates[0].open,Digits()),      panel.CellX(0,2,1)+2, panel.CellY(0,2,1)+2,clrNONE,90);
   panel.DrawText("High",  panel.CellX(0,3,0)+2, panel.CellY(0,3,0)+2); panel.DrawText(DoubleToString(rates[0].high,Digits()),      panel.CellX(0,3,1)+2, panel.CellY(0,3,1)+2,clrNONE,90);
   panel.DrawText("Low",   panel.CellX(0,4,0)+2, panel.CellY(0,4,0)+2); panel.DrawText(DoubleToString(rates[0].low,Digits()),       panel.CellX(0,4,1)+2, panel.CellY(0,4,1)+2,clrNONE,90);
   panel.DrawText("Close", panel.CellX(0,5,0)+2, panel.CellY(0,5,0)+2); panel.DrawText(DoubleToString(rates[0].close,Digits()),     panel.CellX(0,5,1)+2, panel.CellY(0,5,1)+2,clrNONE,90);

//--- Display the indicator data from the specified bar on the panel in table 1
   panel.DrawText(ind_title, panel.CellX(1,0,0)+2, panel.CellY(1,0,0)+2);
   double value=IndicatorValue(handle,index,0);
   string value_str=(value!=EMPTY_VALUE ? DoubleToString(value,ind_digits) : "");
   panel.DrawText(value_str,panel.CellX(1,0,1)+2,panel.CellY(1,0,1)+2,clrNONE,90);

//--- Display a description of the indicator line state
   panel.DrawText("Line state", panel.CellX(1,1,0)+2, panel.CellY(1,1,0)+2);
   ENUM_LINE_STATE state=LineState(handle,index,0);
   color clr=(value<0 ? clrRed : value>0 ? clrBlue : clrNONE); // The label color changes depending on the value of the line above/below zero
   panel.DrawText(LineStateDescription(state),panel.CellX(1,1,1)+2,panel.CellY(1,1,1)+2,clr,90);

//--- Redraw the chart to immediately display all changes on the panel
   ChartRedraw(ChartID());
  }
Os valores da linha do indicador acima/abaixo de zero são marcados com cores no painel.
Adicionalmente, no manipulador de eventos OnChartEvent() do EA, chama-se o manipulador de eventos do painel e processam-se eventos para recuperar o índice da barra sob o cursor:
//+------------------------------------------------------------------+
//| ChartEvent function                                              |
//+------------------------------------------------------------------+
void OnChartEvent(const int id,
                  const long &lparam,
                  const double &dparam,
                  const string &sparam)
  {
//--- Handling the panel
//--- Call the panel event handler
   panel.OnChartEvent(id,lparam,dparam,sparam);

//--- If the cursor moves or a click is made on the chart
   if(id==CHARTEVENT_MOUSE_MOVE || id==CHARTEVENT_CLICK)
     {
      //--- Declare the variables to record time and price coordinates in them
      datetime time=0;
      double price=0;
      int wnd=0;
      //--- If the cursor coordinates are converted to date and time
      if(ChartXYToTimePrice(ChartID(),(int)lparam,(int)dparam,wnd,time,price))
        {
         //--- write the bar index where the cursor is located to a global variable
         mouse_bar_index=iBarShift(Symbol(),PERIOD_CURRENT,time);
         //--- Display the bar data under the cursor on the panel
         DrawData(mouse_bar_index,time);
        }
     }

//--- If we received a custom event, display the appropriate message in the journal
   if(id>CHARTEVENT_CUSTOM)
     {
      //--- Here we can implement handling a click on the close button on the panel
      PrintFormat("%s: Event id=%ld, object id (lparam): %lu, event message (sparam): %s",__FUNCTION__,id,lparam,sparam);
     }
  }
Após compilar o EA e executá-lo no gráfico, podemos monitorar o estado da linha do indicador no painel:
O arquivo do EA "TestOscillatorForce.mq5" pode ser encontrado nos arquivos anexados ao artigo.
MACD
O indicador técnico Convergência/Divergência de Médias Móveis (Moving Average Convergence/Divergence, MACD) é um indicador dinâmico que segue a tendência. Ele mostra a relação entre duas médias móveis de preço.
O indicador técnico MACD é construído como a diferença entre duas médias móveis exponenciais (EMA) com períodos de 12 e 26. Para marcar claramente momentos favoráveis para compra ou venda, uma chamada linha de sinal - uma média móvel de 9 períodos do indicador - é plotada no gráfico MACD.
O MACD é mais eficaz em condições de mercado que oscilam amplamente dentro de um corredor de negociação. Os sinais do MACD mais frequentemente usados são cruzamentos, condições de sobrecompra/sobrevenda e divergências.
Cruzamentos
A regra básica de negociação com o MACD é baseada em cruzamentos do indicador com sua linha de sinal: quando o Moving Average Convergence/Divergence cai abaixo da linha de sinal, sugere-se vender, e quando sobe acima da linha de sinal, sugere-se comprar. Os cruzamentos do MACD com a linha zero para cima/para baixo também são usados como sinais de compra/venda.
Condições de sobrecompra/sobrevenda
O Moving Average Convergence/Divergence também é muito valorizado como um indicador de sobrecompra/sobrevenda. Quando a média móvel curta sobe significativamente acima da longa (ou seja, o MACD aumenta), isso indica que o preço do instrumento em questão provavelmente está excessivamente elevado e em breve retornará a um nível mais realista.
Divergências
Quando uma divergência é formada entre o MACD e o preço, isso indica a possibilidade de um término iminente da tendência atual. Uma divergência de alta ocorre quando o MACD atinge novos mínimos enquanto o preço não consegue alcançá-los. Uma divergência de baixa é formada quando o indicador atinge novos máximos, mas o preço não. Ambos os tipos de divergência são mais significativos se formados em áreas de sobrecompra ou sobrevenda.
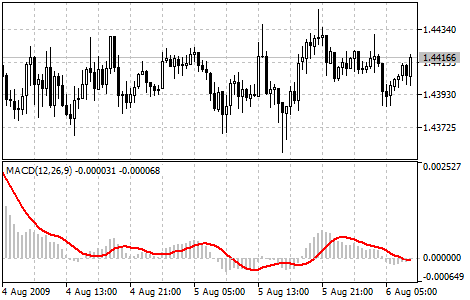
Parâmetros
O indicador tem quatro parâmetros ajustáveis:
- Período de cálculo da EMA rápida, por padrão — 12,
- Período de cálculo da EMA lenta, por padrão — 26,
- Período de cálculo da SMA de sinal, por padrão — 9,
- Preço de cálculo, por padrão — Close.
Variáveis de entrada e globais para uso do indicador no EA:
//+------------------------------------------------------------------+
//|                                           TestOscillatorMACD.mq5 |
//|                                  Copyright 2023, MetaQuotes Ltd. |
//|                                             https://www.mql5.com |
//+------------------------------------------------------------------+
#property copyright "Copyright 2023, MetaQuotes Ltd."
#property link      "https://www.mql5.com"
#property version   "1.00"
//--- enums
enum ENUM_LINE_STATE
  {
   LINE_STATE_NONE,        // Undefined state
   LINE_STATE_UP,          // Upward
   LINE_STATE_DOWN,        // Downward
   LINE_STATE_TURN_UP,     // Upward reversal
   LINE_STATE_TURN_DOWN,   // Downward reversal
   LINE_STATE_STOP_UP,     // Upward stop
   LINE_STATE_STOP_DOWN,   // Downward stop
   LINE_STATE_ABOVE,       // Above value
   LINE_STATE_UNDER,       // Below value
   LINE_STATE_CROSS_UP,    // Crossing value upwards
   LINE_STATE_CROSS_DOWN,  // Crossing value downwards
   LINE_STATE_TOUCH_BELOW, // Touching value from below
   LINE_STATE_TOUCH_ABOVE, // Touch value from above
   LINE_STATE_EQUALS,      // Equal to value
  };
//--- input parameters
input uint                 InpPeriodFast  =  12;            /* Fast MA Period */
input uint                 InpPeriodSlow  =  26;            /* Slow MA Period */
input uint                 InpPeriodSignal=  9;             /* MACD SMA       */
input ENUM_APPLIED_PRICE   InpAppliedPrice=  PRICE_CLOSE;   /* Applied Price  */
//--- global variables
int      handle=INVALID_HANDLE;  // Indicator handle
int      period_fast=0;          // Fast EMA calculation period
int      period_slow=0;          // Slow EMA calculation period
int      period_signal=0;        // Signal line calculation period
int      ind_digits=0;           // Number of decimal places in the indicator values
string   ind_title;              // Indicator description
Ao usar o painel de informações, inclui-se o arquivo da classe do painel e adicionam-se variáveis para trabalhar com ele:
//+------------------------------------------------------------------+
//|                                           TestOscillatorMACD.mq5 |
//|                                  Copyright 2023, MetaQuotes Ltd. |
//|                                             https://www.mql5.com |
//+------------------------------------------------------------------+
#property copyright "Copyright 2023, MetaQuotes Ltd."
#property link      "https://www.mql5.com"
#property version   "1.00"
//--- includes
#include <Dashboard\Dashboard.mqh>
//--- enums
enum ENUM_LINE_STATE
  {
   LINE_STATE_NONE,        // Undefined state
   LINE_STATE_UP,          // Upward
   LINE_STATE_DOWN,        // Downward
   LINE_STATE_TURN_UP,     // Upward reversal
   LINE_STATE_TURN_DOWN,   // Downward reversal
   LINE_STATE_STOP_UP,     // Upward stop
   LINE_STATE_STOP_DOWN,   // Downward stop
   LINE_STATE_ABOVE,       // Above value
   LINE_STATE_UNDER,       // Below value
   LINE_STATE_CROSS_UP,    // Crossing value upwards
   LINE_STATE_CROSS_DOWN,  // Crossing value downwards
   LINE_STATE_TOUCH_BELOW, // Touching value from below
   LINE_STATE_TOUCH_ABOVE, // Touch value from above
   LINE_STATE_EQUALS,      // Equal to value
  };
//--- input parameters
input uint                 InpPeriodFast  =  12;            /* Fast MA Period */
input uint                 InpPeriodSlow  =  26;            /* Slow MA Period */
input uint                 InpPeriodSignal=  9;             /* MACD SMA       */
input ENUM_APPLIED_PRICE   InpAppliedPrice=  PRICE_CLOSE;   /* Applied Price  */
//--- global variables
int      handle=INVALID_HANDLE;  // Indicator handle
int      period_fast=0;          // Fast EMA calculation period
int      period_slow=0;          // Slow EMA calculation period
int      period_signal=0;        // Signal line calculation period
int      ind_digits=0;           // Number of decimal places in the indicator values
string   ind_title;              // Indicator description
//--- variables for the panel
int      mouse_bar_index;        // Index of the bar the data is taken from
CDashboard *panel=NULL;          // Pointer to the panel object
Inicialização
Manipulador OnInit() para inicializar os parâmetros do indicador e criar seu handle:
//+------------------------------------------------------------------+
//| Expert initialization function                                   |
//+------------------------------------------------------------------+
int OnInit()
  {
//--- create timer
   EventSetTimer(60);

//--- Indicator
//--- Set and adjust the calculation period if necessary
   period_fast=int(InpPeriodFast<1 ? 12 : InpPeriodFast);
   period_slow=int(InpPeriodSlow<1 ? 26 : InpPeriodSlow==period_fast ? period_fast+1 : InpPeriodSlow);
   period_signal=int(InpPeriodSignal<1 ? 9 : InpPeriodSignal);
//--- Set the indicator name and the number of decimal places
   ind_title=StringFormat("MACD(%lu,%lu,%lu)",period_fast,period_slow,period_signal);
   ind_digits=Digits()+1;
//--- Create indicator handle
   ResetLastError();
   handle=iMACD(Symbol(),PERIOD_CURRENT,period_fast,period_slow,period_signal,InpAppliedPrice);
   if(handle==INVALID_HANDLE)
     {
      PrintFormat("%s: Failed to create indicator handle %s. Error %ld",__FUNCTION__,ind_title,GetLastError());
      return INIT_FAILED;
     }

//--- Successful initialization
   return(INIT_SUCCEEDED);
  }
Ao usar o painel de informações, cria-se o painel:
//+------------------------------------------------------------------+
//| Expert initialization function                                   |
//+------------------------------------------------------------------+
int OnInit()
  {
//--- create timer
   EventSetTimer(60);

//--- Indicator
//--- Set and adjust the calculation period if necessary
   period_fast=int(InpPeriodFast<1 ? 12 : InpPeriodFast);
   period_slow=int(InpPeriodSlow<1 ? 26 : InpPeriodSlow==period_fast ? period_fast+1 : InpPeriodSlow);
   period_signal=int(InpPeriodSignal<1 ? 9 : InpPeriodSignal);
//--- Set the indicator name and the number of decimal places
   ind_title=StringFormat("MACD(%lu,%lu,%lu)",period_fast,period_slow,period_signal);
   ind_digits=Digits()+1;
//--- Create indicator handle
   ResetLastError();
   handle=iMACD(Symbol(),PERIOD_CURRENT,period_fast,period_slow,period_signal,InpAppliedPrice);
   if(handle==INVALID_HANDLE)
     {
      PrintFormat("%s: Failed to create indicator handle %s. Error %ld",__FUNCTION__,ind_title,GetLastError());
      return INIT_FAILED;
     }

//--- Dashboard
//--- Create the panel
   panel=new CDashboard(1,20,20,199,261);
   if(panel==NULL)
     {
      Print("Error. Failed to create panel object");
      return INIT_FAILED;
     }
//--- Set font parameters
   panel.SetFontParams("Calibri",9);
//--- Display the panel with the "Symbol, Timeframe description" header text
   panel.View(Symbol()+", "+StringSubstr(EnumToString(Period()),7));
//--- Create a table with ID 0 to display bar data in it
   panel.CreateNewTable(0);
//--- Draw a table with ID 0 on the panel background
   panel.DrawGrid(0,2,20,6,2,18,97);

//--- Create a table with ID 1 to display indicator data in it
   panel.CreateNewTable(1);
//--- Get the Y2 table coordinate with ID 0 and
//--- set the Y1 coordinate for the table with ID 1
   int y1=panel.TableY2(0)+22;
//--- Draw a table with ID 1 on the panel background
   panel.DrawGrid(1,2,y1,5,2,18,97);

//--- Display tabular data in the journal
   panel.GridPrint(0,2);
   panel.GridPrint(1,2);
//--- Initialize the variable with the index of the mouse cursor bar
   mouse_bar_index=0;
//--- Display the data of the current bar on the panel
   DrawData(mouse_bar_index,TimeCurrent());

//--- Successful initialization
   return(INIT_SUCCEEDED);
  }
Desinicialização
No manipulador OnDeinit() do EA, libera-se o handle do indicador:
//+------------------------------------------------------------------+
//| Expert deinitialization function                                 |
//+------------------------------------------------------------------+
void OnDeinit(const int reason)
  {
//--- destroy timer
   EventKillTimer();

//--- Release handle of the indicator
   ResetLastError();
   if(!IndicatorRelease(handle))
      PrintFormat("%s: IndicatorRelease failed. Error %ld",__FUNCTION__,GetLastError());
//--- Clear all comments on the chart
   Comment("");
  }
Ao usar o painel de informações, remove-se o objeto do painel criado:
//+------------------------------------------------------------------+
//| Expert deinitialization function                                 |
//+------------------------------------------------------------------+
void OnDeinit(const int reason)
  {
//--- destroy timer
   EventKillTimer();

//--- Release handle of the indicator
   ResetLastError();
   if(!IndicatorRelease(handle))
      PrintFormat("%s: IndicatorRelease failed. Error %ld",__FUNCTION__,GetLastError());
//--- Clear all comments on the chart
   Comment("");

//--- If the panel object exists, delete it
   if(panel!=NULL)
      delete panel;
  }
Recuperação de dados
Funções comuns para recuperar dados através do handle do indicador:
//+------------------------------------------------------------------+
//| Return the indicator data on the specified bar                   |
//+------------------------------------------------------------------+
double IndicatorValue(const int ind_handle,const int index,const int buffer_num)
  {
   double array[1]={0};
   ResetLastError();
   if(CopyBuffer(ind_handle,buffer_num,index,1,array)!=1)
     {
      PrintFormat("%s: CopyBuffer failed. Error %ld",__FUNCTION__,GetLastError());
      return EMPTY_VALUE;
     }
   return array[0];
  }
//+------------------------------------------------------------------+
//| Return the state of the indicator line                           |
//+------------------------------------------------------------------+
ENUM_LINE_STATE LineState(const int ind_handle,const int index,const int buffer_num)
  {
//--- Get the values of the indicator line with the shift (0,1,2) relative to the passed index
   const double value0=IndicatorValue(ind_handle,index,  buffer_num);
   const double value1=IndicatorValue(ind_handle,index+1,buffer_num);
   const double value2=IndicatorValue(ind_handle,index+2,buffer_num);
//--- If at least one of the values could not be obtained, return an undefined value
   if(value0==EMPTY_VALUE || value1==EMPTY_VALUE || value2==EMPTY_VALUE)
      return LINE_STATE_NONE;
//--- Line upward reversal (value2>value1 && value0>value1)
   if(NormalizeDouble(value2-value1,ind_digits)>0 && NormalizeDouble(value0-value1,ind_digits)>0)
      return LINE_STATE_TURN_UP;
//--- Line upward direction (value2<=value1 && value0>value1)
   else if(NormalizeDouble(value2-value1,ind_digits)<=0 && NormalizeDouble(value0-value1,ind_digits)>0)
      return LINE_STATE_UP;
//--- Line upward stop (value2<=value1 && value0==value1)
   else if(NormalizeDouble(value2-value1,ind_digits)<=0 && NormalizeDouble(value0-value1,ind_digits)==0)
      return LINE_STATE_STOP_UP;
//--- Line downward reversal (value2<value1 && value0<value1)
   if(NormalizeDouble(value2-value1,ind_digits)<0 && NormalizeDouble(value0-value1,ind_digits)<0)
      return LINE_STATE_TURN_DOWN;
//--- Line downward direction (value2>=value1 && value0<value1)
   else if(NormalizeDouble(value2-value1,ind_digits)>=0 && NormalizeDouble(value0-value1,ind_digits)<0)
      return LINE_STATE_DOWN;
//--- Line downward stop (value2>=value1 && value0==value1)
   else if(NormalizeDouble(value2-value1,ind_digits)>=0 && NormalizeDouble(value0-value1,ind_digits)==0)
      return LINE_STATE_STOP_DOWN;
//--- Undefined state
   return LINE_STATE_NONE;
  }
//+------------------------------------------------------------------+
//| Return the state of the line relative to the specified level     |
//+------------------------------------------------------------------+
ENUM_LINE_STATE LineStateRelative(const int ind_handle,const int index,const int buffer_num,const double level0,const double level1=EMPTY_VALUE)
  {
//--- Get the values of the indicator line with the shift (0,1) relative to the passed index
   const double value0=IndicatorValue(ind_handle,index,  buffer_num);
   const double value1=IndicatorValue(ind_handle,index+1,buffer_num);
//--- If at least one of the values could not be obtained, return an undefined value
   if(value0==EMPTY_VALUE || value1==EMPTY_VALUE)
      return LINE_STATE_NONE;
//--- Define the second level to compare
   double level=(level1==EMPTY_VALUE ? level0 : level1);
//--- The line is below the level (value1<level && value0<level0)
   if(NormalizeDouble(value1-level,ind_digits)<0 && NormalizeDouble(value0-level0,ind_digits)<0)
      return LINE_STATE_UNDER;
//--- The line is above the level (value1>level && value0>level0)
   if(NormalizeDouble(value1-level,ind_digits)>0 && NormalizeDouble(value0-level0,ind_digits)>0)
      return LINE_STATE_ABOVE;
//--- The line crossed the level upwards (value1<=level && value0>level0)
   if(NormalizeDouble(value1-level,ind_digits)<=0 && NormalizeDouble(value0-level0,ind_digits)>0)
      return LINE_STATE_CROSS_UP;
//--- The line crossed the level downwards (value1>=level && value0<level0)
   if(NormalizeDouble(value1-level,ind_digits)>=0 && NormalizeDouble(value0-level0,ind_digits)<0)
      return LINE_STATE_CROSS_DOWN;
//--- The line touched the level from below (value1<level0 && value0==level0)
   if(NormalizeDouble(value1-level,ind_digits)<0 && NormalizeDouble(value0-level0,ind_digits)==0)
      return LINE_STATE_TOUCH_BELOW;
//--- The line touched the level from above (value1>level0 && value0==level0)
   if(NormalizeDouble(value1-level,ind_digits)>0 && NormalizeDouble(value0-level0,ind_digits)==0)
      return LINE_STATE_TOUCH_BELOW;
//--- Line is equal to the level value (value1==level0 && value0==level0)
   if(NormalizeDouble(value1-level,ind_digits)==0 && NormalizeDouble(value0-level0,ind_digits)==0)
      return LINE_STATE_EQUALS;
//--- Undefined state
   return LINE_STATE_NONE;
  }
//+------------------------------------------------------------------+
//| Return the indicator line state description                      |
//+------------------------------------------------------------------+
string LineStateDescription(const ENUM_LINE_STATE state)
  {
   switch(state)
     {
      case LINE_STATE_UP         :  return "Up";
      case LINE_STATE_STOP_UP    :  return "Stop Up";
      case LINE_STATE_TURN_UP    :  return "Turn Up";
      case LINE_STATE_DOWN       :  return "Down";
      case LINE_STATE_STOP_DOWN  :  return "Stop Down";
      case LINE_STATE_TURN_DOWN  :  return "Turn Down";
      case LINE_STATE_ABOVE      :  return "Above level";
      case LINE_STATE_UNDER      :  return "Under level";
      case LINE_STATE_CROSS_UP   :  return "Crossing Up";
      case LINE_STATE_CROSS_DOWN :  return "Crossing Down";
      case LINE_STATE_TOUCH_BELOW:  return "Touch from Below";
      case LINE_STATE_TOUCH_ABOVE:  return "Touch from Above";
      case LINE_STATE_EQUALS     :  return "Equals";
      default                    :  return "Unknown";
     }
  }
Ao usar o painel de informações, os dados são exibidos no painel por meio de uma função:
//+------------------------------------------------------------------+
//| Display data from the specified timeseries index to the panel    |
//+------------------------------------------------------------------+
void DrawData(const int index,const datetime time)
  {
//--- Declare the variables to receive data in them
   MqlTick  tick={0};
   MqlRates rates[1];

//--- Exit if unable to get the current prices
   if(!SymbolInfoTick(Symbol(),tick))
      return;
//--- Exit if unable to get the bar data by the specified index
   if(CopyRates(Symbol(),PERIOD_CURRENT,index,1,rates)!=1)
      return;

//--- Set font parameters for bar and indicator data headers
   int  size=0;
   uint flags=0;
   uint angle=0;
   string name=panel.FontParams(size,flags,angle);
   panel.SetFontParams(name,9,FW_BOLD);
   panel.DrawText("Bar data ["+(string)index+"]",3,panel.TableY1(0)-16,clrMaroon,panel.Width()-6);
   panel.DrawText("Indicator data ["+(string)index+"]",3,panel.TableY1(1)-16,clrGreen,panel.Width()-6);
//--- Set font parameters for bar and indicator data
   panel.SetFontParams(name,9);

//--- Display the data of the specified bar in table 0 on the panel
   panel.DrawText("Date",  panel.CellX(0,0,0)+2, panel.CellY(0,0,0)+2); panel.DrawText(TimeToString(  rates[0].time,TIME_DATE),     panel.CellX(0,0,1)+2, panel.CellY(0,0,1)+2,clrNONE,90);
   panel.DrawText("Time",  panel.CellX(0,1,0)+2, panel.CellY(0,1,0)+2); panel.DrawText(TimeToString(  rates[0].time,TIME_MINUTES),  panel.CellX(0,1,1)+2, panel.CellY(0,1,1)+2,clrNONE,90);
   panel.DrawText("Open",  panel.CellX(0,2,0)+2, panel.CellY(0,2,0)+2); panel.DrawText(DoubleToString(rates[0].open,Digits()),      panel.CellX(0,2,1)+2, panel.CellY(0,2,1)+2,clrNONE,90);
   panel.DrawText("High",  panel.CellX(0,3,0)+2, panel.CellY(0,3,0)+2); panel.DrawText(DoubleToString(rates[0].high,Digits()),      panel.CellX(0,3,1)+2, panel.CellY(0,3,1)+2,clrNONE,90);
   panel.DrawText("Low",   panel.CellX(0,4,0)+2, panel.CellY(0,4,0)+2); panel.DrawText(DoubleToString(rates[0].low,Digits()),       panel.CellX(0,4,1)+2, panel.CellY(0,4,1)+2,clrNONE,90);
   panel.DrawText("Close", panel.CellX(0,5,0)+2, panel.CellY(0,5,0)+2); panel.DrawText(DoubleToString(rates[0].close,Digits()),     panel.CellX(0,5,1)+2, panel.CellY(0,5,1)+2,clrNONE,90);

//--- Display the indicator data from the specified bar on the panel in table 1
   panel.DrawText(ind_title, panel.CellX(1,0,0)+2, panel.CellY(1,0,0)+2);
   double value=IndicatorValue(handle,index,0);
   string value_str=(value!=EMPTY_VALUE ? DoubleToString(value,ind_digits) : "");
   panel.DrawText(value_str,panel.CellX(1,0,1)+2,panel.CellY(1,0,1)+2,clrNONE,90);
//--- Display the indicator signal line data from the specified bar on the panel in table 1
   panel.DrawText("Signal", panel.CellX(1,1,0)+2, panel.CellY(1,1,0)+2);
   double signal=IndicatorValue(handle,index,1);
   string signal_str=(signal!=EMPTY_VALUE ? DoubleToString(signal,ind_digits) : "");
   panel.DrawText(signal_str,panel.CellX(1,1,1)+2,panel.CellY(1,1,1)+2,clrNONE,90);

//--- Display a description of the indicator line state relative to zero
   panel.DrawText("MACD vs Zero", panel.CellX(1,2,0)+2, panel.CellY(1,2,0)+2);
   ENUM_LINE_STATE state_zero=LineStateRelative(handle,index,0,0);
   string state_zero_str=
     (
      state_zero==LINE_STATE_ABOVE        ?  "MACD > 0"  :
      state_zero==LINE_STATE_UNDER        ?  "MACD < 0"  :
      state_zero==LINE_STATE_TOUCH_ABOVE  ||
      state_zero==LINE_STATE_TOUCH_BELOW  ?  "Touch"     :
      LineStateDescription(state_zero)
     );
//--- The label color changes depending on the value of the line relative to the level
   color clr=(state_zero==LINE_STATE_CROSS_UP ? clrBlue : state_zero==LINE_STATE_CROSS_DOWN ? clrRed : clrNONE);
   panel.DrawText(state_zero_str,panel.CellX(1,2,1)+2,panel.CellY(1,2,1)+2,clr,90);

//--- Display a description of the indicator line state relative to the signal line
   panel.DrawText("MACD vs Signal", panel.CellX(1,3,0)+2, panel.CellY(1,3,0)+2);
   ENUM_LINE_STATE state_signal=LineStateRelative(handle,index,0,signal,IndicatorValue(handle,index+1,1));
   string state_signal_str=(state_signal==LINE_STATE_ABOVE ? "MACD > Signal" : state_signal==LINE_STATE_UNDER ? "MACD < Signal" : LineStateDescription(state_signal));
//--- The label color changes depending on the value of the line relative to the level
   clr=(state_signal==LINE_STATE_CROSS_UP ? clrBlue : state_signal==LINE_STATE_CROSS_DOWN ? clrRed : clrNONE);
   panel.DrawText(state_signal_str,panel.CellX(1,3,1)+2,panel.CellY(1,3,1)+2,clr,90);

//--- Redraw the chart to immediately display all changes on the panel
   ChartRedraw(ChartID());
  }
O painel mostra em cores a proporção do histograma em relação à linha de sinal e em relação ao zero.
Adicionalmente, no manipulador de eventos OnChartEvent() do EA, chama-se o manipulador de eventos do painel e processam-se eventos para recuperar o índice da barra sob o cursor:
//+------------------------------------------------------------------+
//| ChartEvent function                                              |
//+------------------------------------------------------------------+
void OnChartEvent(const int id,
                  const long &lparam,
                  const double &dparam,
                  const string &sparam)
  {
//--- Handling the panel
//--- Call the panel event handler
   panel.OnChartEvent(id,lparam,dparam,sparam);

//--- If the cursor moves or a click is made on the chart
   if(id==CHARTEVENT_MOUSE_MOVE || id==CHARTEVENT_CLICK)
     {
      //--- Declare the variables to record time and price coordinates in them
      datetime time=0;
      double price=0;
      int wnd=0;
      //--- If the cursor coordinates are converted to date and time
      if(ChartXYToTimePrice(ChartID(),(int)lparam,(int)dparam,wnd,time,price))
        {
         //--- write the bar index where the cursor is located to a global variable
         mouse_bar_index=iBarShift(Symbol(),PERIOD_CURRENT,time);
         //--- Display the bar data under the cursor on the panel
         DrawData(mouse_bar_index,time);
        }
     }

//--- If we received a custom event, display the appropriate message in the journal
   if(id>CHARTEVENT_CUSTOM)
     {
      //--- Here we can implement handling a click on the close button on the panel
      PrintFormat("%s: Event id=%ld, object id (lparam): %lu, event message (sparam): %s",__FUNCTION__,id,lparam,sparam);
     }
  }
Após compilar o EA e executá-lo no gráfico, podemos monitorar o estado das linhas do indicador no painel:
O arquivo do EA "TestOscillatorMACD.mq5" pode ser encontrado nos arquivos anexados ao artigo.
Momentum
O indicador técnico Momentum mede a magnitude da mudança de preço de um instrumento financeiro por um determinado período. Existem basicamente duas formas de usar o indicador Momentum:
- Como um oscilador que segue a tendência, similar ao indicador técnico de Convergência/Divergência de Médias Móveis (Moving Average Convergence/Divergence, MACD). Nesse caso, um sinal de compra surge se o indicador Momentum forma um vale e começa a subir; e um sinal de venda quando atinge um pico e vira para baixo. Para determinar com mais precisão os momentos de reversão do indicador, pode-se usar sua média móvel curta.
Valores extremamente altos ou baixos do indicador Momentum sugerem a continuação da tendência atual. Assim, se o indicador atinge valores extremamente altos e depois vira para baixo, espera-se a continuação da alta dos preços. No entanto, não se deve apressar para abrir (ou fechar) posições até que os preços confirmem o sinal do indicador. - Como indicador antecedente, esse método baseia-se na suposição de que a fase final de uma tendência de alta geralmente é acompanhada por um rápido aumento nos preços ( já que todos acreditam em sua continuação) e o fim de um mercado de baixa por uma queda acentuada nos preços ( já que todos querem sair do mercado). Isso, embora ocorra com frequência, não deixa de ser uma generalização exagerada.
A aproximação do mercado a um topo é acompanhada por um salto acentuado no indicador Momentum. Depois, ele começa a cair, enquanto os preços continuam subindo ou se movendo horizontalmente. De forma análoga, na base do mercado, o Momentum cai acentuadamente e depois vira para cima muito antes do início da alta dos preços. Em ambos os casos, são formadas divergências entre o indicador e os preços.
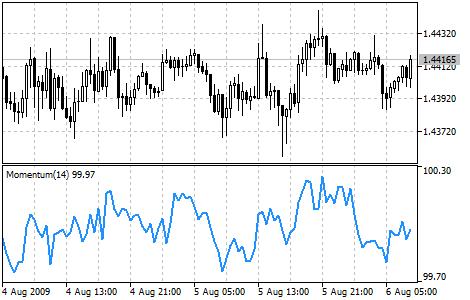
Parâmetros
O indicador tem dois parâmetros ajustáveis:
- Período de cálculo, por padrão — 14,
- Preço de cálculo, por padrão — Close.
Variáveis de entrada e globais para uso do indicador no EA:
//+------------------------------------------------------------------+
//|                                       TestOscillatorMomentum.mq5 |
//|                                  Copyright 2023, MetaQuotes Ltd. |
//|                                             https://www.mql5.com |
//+------------------------------------------------------------------+
#property copyright "Copyright 2023, MetaQuotes Ltd."
#property link      "https://www.mql5.com"
#property version   "1.00"
//--- enums
enum ENUM_LINE_STATE
  {
   LINE_STATE_NONE,        // Undefined state
   LINE_STATE_UP,          // Upward
   LINE_STATE_DOWN,        // Downward
   LINE_STATE_TURN_UP,     // Upward reversal
   LINE_STATE_TURN_DOWN,   // Downward reversal
   LINE_STATE_STOP_UP,     // Upward stop
   LINE_STATE_STOP_DOWN,   // Downward stop
   LINE_STATE_ABOVE,       // Above value
   LINE_STATE_UNDER,       // Below value
   LINE_STATE_CROSS_UP,    // Crossing value upwards
   LINE_STATE_CROSS_DOWN,  // Crossing value downwards
   LINE_STATE_TOUCH_BELOW, // Touching value from below
   LINE_STATE_TOUCH_ABOVE, // Touch value from above
   LINE_STATE_EQUALS,      // Equal to value
  };
//--- input parameters
input uint                 InpPeriod=  14;            /* Period         */
input ENUM_APPLIED_PRICE   InpPrice =  PRICE_CLOSE;   /* Applied Price  */
//--- global variables
int      handle=INVALID_HANDLE;  // Indicator handle
int      period=0;               // Momentum calculation period
int      ind_digits=0;           // Number of decimal places in the indicator values
string   ind_title;              // Indicator description
Ao usar o painel de informações, inclui-se o arquivo da classe do painel e adicionam-se variáveis para trabalhar com ele:
//+------------------------------------------------------------------+
//|                                       TestOscillatorMomentum.mq5 |
//|                                  Copyright 2023, MetaQuotes Ltd. |
//|                                             https://www.mql5.com |
//+------------------------------------------------------------------+
#property copyright "Copyright 2023, MetaQuotes Ltd."
#property link      "https://www.mql5.com"
#property version   "1.00"
//--- includes
#include <Dashboard\Dashboard.mqh>
//--- enums
enum ENUM_LINE_STATE
  {
   LINE_STATE_NONE,        // Undefined state
   LINE_STATE_UP,          // Upward
   LINE_STATE_DOWN,        // Downward
   LINE_STATE_TURN_UP,     // Upward reversal
   LINE_STATE_TURN_DOWN,   // Downward reversal
   LINE_STATE_STOP_UP,     // Upward stop
   LINE_STATE_STOP_DOWN,   // Downward stop
   LINE_STATE_ABOVE,       // Above value
   LINE_STATE_UNDER,       // Below value
   LINE_STATE_CROSS_UP,    // Crossing value upwards
   LINE_STATE_CROSS_DOWN,  // Crossing value downwards
   LINE_STATE_TOUCH_BELOW, // Touching value from below
   LINE_STATE_TOUCH_ABOVE, // Touch value from above
   LINE_STATE_EQUALS,      // Equal to value
  };
//--- input parameters
input uint                 InpPeriod=  14;            /* Period         */
input ENUM_APPLIED_PRICE   InpPrice =  PRICE_CLOSE;   /* Applied Price  */
//--- global variables
int      handle=INVALID_HANDLE;  // Indicator handle
int      period=0;               // Momentum calculation period
int      ind_digits=0;           // Number of decimal places in the indicator values
string   ind_title;              // Indicator description
//--- variables for the panel
int      mouse_bar_index;        // Index of the bar the data is taken from
CDashboard *panel=NULL;          // Pointer to the panel object
Inicialização
Manipulador OnInit() para inicializar os parâmetros do indicador e criar seu handle:
//+------------------------------------------------------------------+
//| Expert initialization function                                   |
//+------------------------------------------------------------------+
int OnInit()
  {
//--- create timer
   EventSetTimer(60);

//--- Indicator
//--- Set and adjust the calculation period if necessary
   period=int(InpPeriod<1 ? 14 : InpPeriod);
//--- Set the indicator name and the number of decimal places
   ind_title=StringFormat("Momentum(%lu)",period);
   ind_digits=2;
//--- Create indicator handle
   ResetLastError();
   handle=iMomentum(Symbol(),PERIOD_CURRENT,period,InpPrice);
   if(handle==INVALID_HANDLE)
     {
      PrintFormat("%s: Failed to create indicator handle %s. Error %ld",__FUNCTION__,ind_title,GetLastError());
      return INIT_FAILED;
     }

//--- Successful initialization
   return(INIT_SUCCEEDED);
  }
Ao usar o painel de informações, cria-se o painel:
//+------------------------------------------------------------------+
//| Expert initialization function                                   |
//+------------------------------------------------------------------+
int OnInit()
  {
//--- create timer
   EventSetTimer(60);

//--- Indicator
//--- Set and adjust the calculation period if necessary
   period=int(InpPeriod<1 ? 14 : InpPeriod);
//--- Set the indicator name and the number of decimal places
   ind_title=StringFormat("Momentum(%lu)",period);
   ind_digits=2;
//--- Create indicator handle
   ResetLastError();
   handle=iMomentum(Symbol(),PERIOD_CURRENT,period,InpPrice);
   if(handle==INVALID_HANDLE)
     {
      PrintFormat("%s: Failed to create indicator handle %s. Error %ld",__FUNCTION__,ind_title,GetLastError());
      return INIT_FAILED;
     }

//--- Dashboard
//--- Create the panel
   panel=new CDashboard(1,20,20,199,225);
   if(panel==NULL)
     {
      Print("Error. Failed to create panel object");
      return INIT_FAILED;
     }
//--- Set font parameters
   panel.SetFontParams("Calibri",9);
//--- Display the panel with the "Symbol, Timeframe description" header text
   panel.View(Symbol()+", "+StringSubstr(EnumToString(Period()),7));
//--- Create a table with ID 0 to display bar data in it
   panel.CreateNewTable(0);
//--- Draw a table with ID 0 on the panel background
   panel.DrawGrid(0,2,20,6,2,18,97);

//--- Create a table with ID 1 to display indicator data in it
   panel.CreateNewTable(1);
//--- Get the Y2 table coordinate with ID 0 and
//--- set the Y1 coordinate for the table with ID 1
   int y1=panel.TableY2(0)+22;
//--- Draw a table with ID 1 on the panel background
   panel.DrawGrid(1,2,y1,3,2,18,97);

//--- Display tabular data in the journal
   panel.GridPrint(0,2);
   panel.GridPrint(1,2);
//--- Initialize the variable with the index of the mouse cursor bar
   mouse_bar_index=0;
//--- Display the data of the current bar on the panel
   DrawData(mouse_bar_index,TimeCurrent());

//--- Successful initialization
   return(INIT_SUCCEEDED);
  }
Desinicialização
No manipulador OnDeinit() do EA, libera-se o handle do indicador:
//+------------------------------------------------------------------+
//| Expert deinitialization function                                 |
//+------------------------------------------------------------------+
void OnDeinit(const int reason)
  {
//--- destroy timer
   EventKillTimer();

//--- Release handle of the indicator
   ResetLastError();
   if(!IndicatorRelease(handle))
      PrintFormat("%s: IndicatorRelease failed. Error %ld",__FUNCTION__,GetLastError());
//--- Clear all comments on the chart
   Comment("");
  }
Ao usar o painel de informações, remove-se o objeto do painel criado:
//+------------------------------------------------------------------+
//| Expert deinitialization function                                 |
//+------------------------------------------------------------------+
void OnDeinit(const int reason)
  {
//--- destroy timer
   EventKillTimer();

//--- Release handle of the indicator
   ResetLastError();
   if(!IndicatorRelease(handle))
      PrintFormat("%s: IndicatorRelease failed. Error %ld",__FUNCTION__,GetLastError());
//--- Clear all comments on the chart
   Comment("");

//--- If the panel object exists, delete it
   if(panel!=NULL)
      delete panel;
  }
Recuperação de dados
Funções comuns para recuperar dados através do handle do indicador:
//+------------------------------------------------------------------+
//| Return the indicator data on the specified bar                   |
//+------------------------------------------------------------------+
double IndicatorValue(const int ind_handle,const int index,const int buffer_num)
  {
   double array[1]={0};
   ResetLastError();
   if(CopyBuffer(ind_handle,buffer_num,index,1,array)!=1)
     {
      PrintFormat("%s: CopyBuffer failed. Error %ld",__FUNCTION__,GetLastError());
      return EMPTY_VALUE;
     }
   return array[0];
  }
//+------------------------------------------------------------------+
//| Return the state of the indicator line                           |
//+------------------------------------------------------------------+
ENUM_LINE_STATE LineState(const int ind_handle,const int index,const int buffer_num)
  {
//--- Get the values of the indicator line with the shift (0,1,2) relative to the passed index
   const double value0=IndicatorValue(ind_handle,index,  buffer_num);
   const double value1=IndicatorValue(ind_handle,index+1,buffer_num);
   const double value2=IndicatorValue(ind_handle,index+2,buffer_num);
//--- If at least one of the values could not be obtained, return an undefined value
   if(value0==EMPTY_VALUE || value1==EMPTY_VALUE || value2==EMPTY_VALUE)
      return LINE_STATE_NONE;
//--- Line upward reversal (value2>value1 && value0>value1)
   if(NormalizeDouble(value2-value1,ind_digits)>0 && NormalizeDouble(value0-value1,ind_digits)>0)
      return LINE_STATE_TURN_UP;
//--- Line upward direction (value2<=value1 && value0>value1)
   else if(NormalizeDouble(value2-value1,ind_digits)<=0 && NormalizeDouble(value0-value1,ind_digits)>0)
      return LINE_STATE_UP;
//--- Line upward stop (value2<=value1 && value0==value1)
   else if(NormalizeDouble(value2-value1,ind_digits)<=0 && NormalizeDouble(value0-value1,ind_digits)==0)
      return LINE_STATE_STOP_UP;
//--- Line downward reversal (value2<value1 && value0<value1)
   if(NormalizeDouble(value2-value1,ind_digits)<0 && NormalizeDouble(value0-value1,ind_digits)<0)
      return LINE_STATE_TURN_DOWN;
//--- Line downward direction (value2>=value1 && value0<value1)
   else if(NormalizeDouble(value2-value1,ind_digits)>=0 && NormalizeDouble(value0-value1,ind_digits)<0)
      return LINE_STATE_DOWN;
//--- Line downward stop (value2>=value1 && value0==value1)
   else if(NormalizeDouble(value2-value1,ind_digits)>=0 && NormalizeDouble(value0-value1,ind_digits)==0)
      return LINE_STATE_STOP_DOWN;
//--- Undefined state
   return LINE_STATE_NONE;
  }
//+------------------------------------------------------------------+
//| Return the state of the line relative to the specified level     |
//+------------------------------------------------------------------+
ENUM_LINE_STATE LineStateRelative(const int ind_handle,const int index,const int buffer_num,const double level0,const double level1=EMPTY_VALUE)
  {
//--- Get the values of the indicator line with the shift (0,1) relative to the passed index
   const double value0=IndicatorValue(ind_handle,index,  buffer_num);
   const double value1=IndicatorValue(ind_handle,index+1,buffer_num);
//--- If at least one of the values could not be obtained, return an undefined value
   if(value0==EMPTY_VALUE || value1==EMPTY_VALUE)
      return LINE_STATE_NONE;
//--- Define the second level to compare
   double level=(level1==EMPTY_VALUE ? level0 : level1);
//--- The line is below the level (value1<level && value0<level0)
   if(NormalizeDouble(value1-level,ind_digits)<0 && NormalizeDouble(value0-level0,ind_digits)<0)
      return LINE_STATE_UNDER;
//--- The line is above the level (value1>level && value0>level0)
   if(NormalizeDouble(value1-level,ind_digits)>0 && NormalizeDouble(value0-level0,ind_digits)>0)
      return LINE_STATE_ABOVE;
//--- The line crossed the level upwards (value1<=level && value0>level0)
   if(NormalizeDouble(value1-level,ind_digits)<=0 && NormalizeDouble(value0-level0,ind_digits)>0)
      return LINE_STATE_CROSS_UP;
//--- The line crossed the level downwards (value1>=level && value0<level0)
   if(NormalizeDouble(value1-level,ind_digits)>=0 && NormalizeDouble(value0-level0,ind_digits)<0)
      return LINE_STATE_CROSS_DOWN;
//--- The line touched the level from below (value1<level0 && value0==level0)
   if(NormalizeDouble(value1-level,ind_digits)<0 && NormalizeDouble(value0-level0,ind_digits)==0)
      return LINE_STATE_TOUCH_BELOW;
//--- The line touched the level from above (value1>level0 && value0==level0)
   if(NormalizeDouble(value1-level,ind_digits)>0 && NormalizeDouble(value0-level0,ind_digits)==0)
      return LINE_STATE_TOUCH_BELOW;
//--- Line is equal to the level value (value1==level0 && value0==level0)
   if(NormalizeDouble(value1-level,ind_digits)==0 && NormalizeDouble(value0-level0,ind_digits)==0)
      return LINE_STATE_EQUALS;
//--- Undefined state
   return LINE_STATE_NONE;
  }
//+------------------------------------------------------------------+
//| Return the indicator line state description                      |
//+------------------------------------------------------------------+
string LineStateDescription(const ENUM_LINE_STATE state)
  {
   switch(state)
     {
      case LINE_STATE_UP         :  return "Up";
      case LINE_STATE_STOP_UP    :  return "Stop Up";
      case LINE_STATE_TURN_UP    :  return "Turn Up";
      case LINE_STATE_DOWN       :  return "Down";
      case LINE_STATE_STOP_DOWN  :  return "Stop Down";
      case LINE_STATE_TURN_DOWN  :  return "Turn Down";
      case LINE_STATE_ABOVE      :  return "Above level";
      case LINE_STATE_UNDER      :  return "Under level";
      case LINE_STATE_CROSS_UP   :  return "Crossing Up";
      case LINE_STATE_CROSS_DOWN :  return "Crossing Down";
      case LINE_STATE_TOUCH_BELOW:  return "Touch from Below";
      case LINE_STATE_TOUCH_ABOVE:  return "Touch from Above";
      case LINE_STATE_EQUALS     :  return "Equals";
      default                    :  return "Unknown";
     }
  }
Ao usar o painel de informações, os dados são exibidos no painel por meio de uma função:
//+------------------------------------------------------------------+
//| Display data from the specified timeseries index to the panel    |
//+------------------------------------------------------------------+
void DrawData(const int index,const datetime time)
  {
//--- Declare the variables to receive data in them
   MqlTick  tick={0};
   MqlRates rates[1];

//--- Exit if unable to get the current prices
   if(!SymbolInfoTick(Symbol(),tick))
      return;
//--- Exit if unable to get the bar data by the specified index
   if(CopyRates(Symbol(),PERIOD_CURRENT,index,1,rates)!=1)
      return;

//--- Set font parameters for bar and indicator data headers
   int  size=0;
   uint flags=0;
   uint angle=0;
   string name=panel.FontParams(size,flags,angle);
   panel.SetFontParams(name,9,FW_BOLD);
   panel.DrawText("Bar data ["+(string)index+"]",3,panel.TableY1(0)-16,clrMaroon,panel.Width()-6);
   panel.DrawText("Indicator data ["+(string)index+"]",3,panel.TableY1(1)-16,clrGreen,panel.Width()-6);
//--- Set font parameters for bar and indicator data
   panel.SetFontParams(name,9);

//--- Display the data of the specified bar in table 0 on the panel
   panel.DrawText("Date",  panel.CellX(0,0,0)+2, panel.CellY(0,0,0)+2); panel.DrawText(TimeToString(  rates[0].time,TIME_DATE),     panel.CellX(0,0,1)+2, panel.CellY(0,0,1)+2,clrNONE,90);
   panel.DrawText("Time",  panel.CellX(0,1,0)+2, panel.CellY(0,1,0)+2); panel.DrawText(TimeToString(  rates[0].time,TIME_MINUTES),  panel.CellX(0,1,1)+2, panel.CellY(0,1,1)+2,clrNONE,90);
   panel.DrawText("Open",  panel.CellX(0,2,0)+2, panel.CellY(0,2,0)+2); panel.DrawText(DoubleToString(rates[0].open,Digits()),      panel.CellX(0,2,1)+2, panel.CellY(0,2,1)+2,clrNONE,90);
   panel.DrawText("High",  panel.CellX(0,3,0)+2, panel.CellY(0,3,0)+2); panel.DrawText(DoubleToString(rates[0].high,Digits()),      panel.CellX(0,3,1)+2, panel.CellY(0,3,1)+2,clrNONE,90);
   panel.DrawText("Low",   panel.CellX(0,4,0)+2, panel.CellY(0,4,0)+2); panel.DrawText(DoubleToString(rates[0].low,Digits()),       panel.CellX(0,4,1)+2, panel.CellY(0,4,1)+2,clrNONE,90);
   panel.DrawText("Close", panel.CellX(0,5,0)+2, panel.CellY(0,5,0)+2); panel.DrawText(DoubleToString(rates[0].close,Digits()),     panel.CellX(0,5,1)+2, panel.CellY(0,5,1)+2,clrNONE,90);

//--- Display the indicator data from the specified bar on the panel in table 1
   panel.DrawText(ind_title, panel.CellX(1,0,0)+2, panel.CellY(1,0,0)+2);
   double value=IndicatorValue(handle,index,0);
   string value_str=(value!=EMPTY_VALUE ? DoubleToString(value,ind_digits) : "");
   panel.DrawText(value_str,panel.CellX(1,0,1)+2,panel.CellY(1,0,1)+2,clrNONE,90);

//--- Display a description of the indicator line state
   panel.DrawText("Line state", panel.CellX(1,1,0)+2, panel.CellY(1,1,0)+2);
   ENUM_LINE_STATE state=LineState(handle,index,0);
   panel.DrawText(LineStateDescription(state),panel.CellX(1,1,1)+2,panel.CellY(1,1,1)+2,clrNONE,90);

//--- Redraw the chart to immediately display all changes on the panel
   ChartRedraw(ChartID());
  }
Adicionalmente, no manipulador de eventos OnChartEvent() do EA, chama-se o manipulador de eventos do painel e processam-se eventos para recuperar o índice da barra sob o cursor:
//+------------------------------------------------------------------+
//| ChartEvent function                                              |
//+------------------------------------------------------------------+
void OnChartEvent(const int id,
                  const long &lparam,
                  const double &dparam,
                  const string &sparam)
  {
//--- Handling the panel
//--- Call the panel event handler
   panel.OnChartEvent(id,lparam,dparam,sparam);

//--- If the cursor moves or a click is made on the chart
   if(id==CHARTEVENT_MOUSE_MOVE || id==CHARTEVENT_CLICK)
     {
      //--- Declare the variables to record time and price coordinates in them
      datetime time=0;
      double price=0;
      int wnd=0;
      //--- If the cursor coordinates are converted to date and time
      if(ChartXYToTimePrice(ChartID(),(int)lparam,(int)dparam,wnd,time,price))
        {
         //--- write the bar index where the cursor is located to a global variable
         mouse_bar_index=iBarShift(Symbol(),PERIOD_CURRENT,time);
         //--- Display the bar data under the cursor on the panel
         DrawData(mouse_bar_index,time);
        }
     }

//--- If we received a custom event, display the appropriate message in the journal
   if(id>CHARTEVENT_CUSTOM)
     {
      //--- Here we can implement handling a click on the close button on the panel
      PrintFormat("%s: Event id=%ld, object id (lparam): %lu, event message (sparam): %s",__FUNCTION__,id,lparam,sparam);
     }
  }
Após compilar o EA e executá-lo no gráfico, podemos monitorar o estado da linha do indicador no painel:
O arquivo do EA "TestOscillatorMomentum.mq5" pode ser encontrado nos arquivos anexados ao artigo.
Oscillator of a Moving Average
O indicador técnico Oscilador de Média Móvel (Oscillator of a Moving Average, OsMA) é a diferença entre o oscilador e sua suavização. Neste caso, a linha principal do MACD é usada como o oscilador, e a linha de sinal como a suavização.
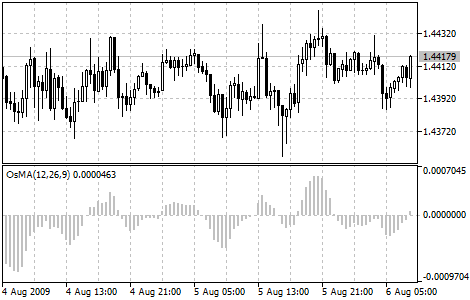
Parâmetros
O indicador tem quatro parâmetros ajustáveis:
- Período de cálculo da EMA rápida do MACD, por padrão — 12,
- Período de cálculo da EMA lenta do MACD, por padrão — 26,
- Período de cálculo da SMA de sinal do MACD, por padrão — 9,
- Preço de cálculo do MACD, por padrão — Close.
Variáveis de entrada e globais para uso do indicador no EA:
//+------------------------------------------------------------------+
//|                                           TestOscillatorOsMA.mq5 |
//|                                  Copyright 2023, MetaQuotes Ltd. |
//|                                             https://www.mql5.com |
//+------------------------------------------------------------------+
#property copyright "Copyright 2023, MetaQuotes Ltd."
#property link      "https://www.mql5.com"
#property version   "1.00"
//--- enums
enum ENUM_LINE_STATE
  {
   LINE_STATE_NONE,        // Undefined state
   LINE_STATE_UP,          // Upward
   LINE_STATE_DOWN,        // Downward
   LINE_STATE_TURN_UP,     // Upward reversal
   LINE_STATE_TURN_DOWN,   // Downward reversal
   LINE_STATE_STOP_UP,     // Upward stop
   LINE_STATE_STOP_DOWN,   // Downward stop
   LINE_STATE_ABOVE,       // Above value
   LINE_STATE_UNDER,       // Below value
   LINE_STATE_CROSS_UP,    // Crossing value upwards
   LINE_STATE_CROSS_DOWN,  // Crossing value downwards
   LINE_STATE_TOUCH_BELOW, // Touching value from below
   LINE_STATE_TOUCH_ABOVE, // Touch value from above
   LINE_STATE_EQUALS,      // Equal to value
  };
//--- input parameters
input uint                 InpPeriodFast  =  12;            /* Fast MA Period */
input uint                 InpPeriodSlow  =  26;            /* Slow MA Period */
input uint                 InpPeriodSignal=  9;             /* MACD SMA       */
input ENUM_APPLIED_PRICE   InpAppliedPrice=  PRICE_CLOSE;   /* Applied Price  */
//--- global variables
int      handle=INVALID_HANDLE;  // Indicator handle
int      period_fast=0;          // Fast EMA calculation period
int      period_slow=0;          // Slow EMA calculation period
int      period_signal=0;        // Signal line calculation period
int      ind_digits=0;           // Number of decimal places in the indicator values
string   ind_title;              // Indicator description
Ao usar o painel de informações, inclui-se o arquivo da classe do painel e adicionam-se variáveis para trabalhar com ele:
//+------------------------------------------------------------------+
//|                                           TestOscillatorOsMA.mq5 |
//|                                  Copyright 2023, MetaQuotes Ltd. |
//|                                             https://www.mql5.com |
//+------------------------------------------------------------------+
#property copyright "Copyright 2023, MetaQuotes Ltd."
#property link      "https://www.mql5.com"
#property version   "1.00"
//--- includes
#include <Dashboard\Dashboard.mqh>
//--- enums
enum ENUM_LINE_STATE
  {
   LINE_STATE_NONE,        // Undefined state
   LINE_STATE_UP,          // Upward
   LINE_STATE_DOWN,        // Downward
   LINE_STATE_TURN_UP,     // Upward reversal
   LINE_STATE_TURN_DOWN,   // Downward reversal
   LINE_STATE_STOP_UP,     // Upward stop
   LINE_STATE_STOP_DOWN,   // Downward stop
   LINE_STATE_ABOVE,       // Above value
   LINE_STATE_UNDER,       // Below value
   LINE_STATE_CROSS_UP,    // Crossing value upwards
   LINE_STATE_CROSS_DOWN,  // Crossing value downwards
   LINE_STATE_TOUCH_BELOW, // Touching value from below
   LINE_STATE_TOUCH_ABOVE, // Touch value from above
   LINE_STATE_EQUALS,      // Equal to value
  };
//--- input parameters
input uint                 InpPeriodFast  =  12;            /* Fast MA Period */
input uint                 InpPeriodSlow  =  26;            /* Slow MA Period */
input uint                 InpPeriodSignal=  9;             /* MACD SMA       */
input ENUM_APPLIED_PRICE   InpAppliedPrice=  PRICE_CLOSE;   /* Applied Price  */
//--- global variables
int      handle=INVALID_HANDLE;  // Indicator handle
int      period_fast=0;          // Fast EMA calculation period
int      period_slow=0;          // Slow EMA calculation period
int      period_signal=0;        // Signal line calculation period
int      ind_digits=0;           // Number of decimal places in the indicator values
string   ind_title;              // Indicator description
//--- variables for the panel
int      mouse_bar_index;        // Index of the bar the data is taken from
CDashboard *panel=NULL;          // Pointer to the panel object
Inicialização
Manipulador OnInit() para inicializar os parâmetros do indicador e criar seu handle:
//+------------------------------------------------------------------+
//| Expert initialization function                                   |
//+------------------------------------------------------------------+
int OnInit()
  {
//--- create timer
   EventSetTimer(60);

//--- Indicator
//--- Set and adjust the calculation period if necessary
   period_fast=int(InpPeriodFast<1 ? 12 : InpPeriodFast);
   period_slow=int(InpPeriodSlow<1 ? 26 : InpPeriodSlow==period_fast ? period_fast+1 : InpPeriodSlow);
   period_signal=int(InpPeriodSignal<1 ? 9 : InpPeriodSignal);
//--- Set the indicator name and the number of decimal places
   ind_title=StringFormat("OsMA(%lu,%lu,%lu)",period_fast,period_slow,period_signal);
   ind_digits=Digits()+2;
//--- Create indicator handle
   ResetLastError();
   handle=iOsMA(Symbol(),PERIOD_CURRENT,period_fast,period_slow,period_signal,InpAppliedPrice);
   if(handle==INVALID_HANDLE)
     {
      PrintFormat("%s: Failed to create indicator handle %s. Error %ld",__FUNCTION__,ind_title,GetLastError());
      return INIT_FAILED;
     }

//--- Successful initialization
   return(INIT_SUCCEEDED);
  }
Ao usar o painel de informações, cria-se o painel:
//+------------------------------------------------------------------+
//| Expert initialization function                                   |
//+------------------------------------------------------------------+
int OnInit()
  {
//--- create timer
   EventSetTimer(60);

//--- Indicator
//--- Set and adjust the calculation period if necessary
   period_fast=int(InpPeriodFast<1 ? 12 : InpPeriodFast);
   period_slow=int(InpPeriodSlow<1 ? 26 : InpPeriodSlow==period_fast ? period_fast+1 : InpPeriodSlow);
   period_signal=int(InpPeriodSignal<1 ? 9 : InpPeriodSignal);
//--- Set the indicator name and the number of decimal places
   ind_title=StringFormat("OsMA(%lu,%lu,%lu)",period_fast,period_slow,period_signal);
   ind_digits=Digits()+2;
//--- Create indicator handle
   ResetLastError();
   handle=iOsMA(Symbol(),PERIOD_CURRENT,period_fast,period_slow,period_signal,InpAppliedPrice);
   if(handle==INVALID_HANDLE)
     {
      PrintFormat("%s: Failed to create indicator handle %s. Error %ld",__FUNCTION__,ind_title,GetLastError());
      return INIT_FAILED;
     }

//--- Dashboard
//--- Create the panel
   panel=new CDashboard(1,20,20,199,225);
   if(panel==NULL)
     {
      Print("Error. Failed to create panel object");
      return INIT_FAILED;
     }
//--- Set font parameters
   panel.SetFontParams("Calibri",9);
//--- Display the panel with the "Symbol, Timeframe description" header text
   panel.View(Symbol()+", "+StringSubstr(EnumToString(Period()),7));
//--- Create a table with ID 0 to display bar data in it
   panel.CreateNewTable(0);
//--- Draw a table with ID 0 on the panel background
   panel.DrawGrid(0,2,20,6,2,18,97);

//--- Create a table with ID 1 to display indicator data in it
   panel.CreateNewTable(1);
//--- Get the Y2 table coordinate with ID 0 and
//--- set the Y1 coordinate for the table with ID 1
   int y1=panel.TableY2(0)+22;
//--- Draw a table with ID 1 on the panel background
   panel.DrawGrid(1,2,y1,3,2,18,97);

//--- Display tabular data in the journal
   panel.GridPrint(0,2);
   panel.GridPrint(1,2);
//--- Initialize the variable with the index of the mouse cursor bar
   mouse_bar_index=0;
//--- Display the data of the current bar on the panel
   DrawData(mouse_bar_index,TimeCurrent());

//--- Successful initialization
   return(INIT_SUCCEEDED);
  }
Desinicialização
No manipulador OnDeinit() do EA, libera-se o handle do indicador:
//+------------------------------------------------------------------+
//| Expert deinitialization function                                 |
//+------------------------------------------------------------------+
void OnDeinit(const int reason)
  {
//--- destroy timer
   EventKillTimer();

//--- Release handle of the indicator
   ResetLastError();
   if(!IndicatorRelease(handle))
      PrintFormat("%s: IndicatorRelease failed. Error %ld",__FUNCTION__,GetLastError());
//--- Clear all comments on the chart
   Comment("");
  }
Ao usar o painel de informações, remove-se o objeto do painel criado:
//+------------------------------------------------------------------+
//| Expert deinitialization function                                 |
//+------------------------------------------------------------------+
void OnDeinit(const int reason)
  {
//--- destroy timer
   EventKillTimer();

//--- Release handle of the indicator
   ResetLastError();
   if(!IndicatorRelease(handle))
      PrintFormat("%s: IndicatorRelease failed. Error %ld",__FUNCTION__,GetLastError());
//--- Clear all comments on the chart
   Comment("");

//--- If the panel object exists, delete it
   if(panel!=NULL)
      delete panel;
  }
Recuperação de dados
Funções comuns para recuperar dados através do handle do indicador:
//+------------------------------------------------------------------+
//| Return the indicator data on the specified bar                   |
//+------------------------------------------------------------------+
double IndicatorValue(const int ind_handle,const int index,const int buffer_num)
  {
   double array[1]={0};
   ResetLastError();
   if(CopyBuffer(ind_handle,buffer_num,index,1,array)!=1)
     {
      PrintFormat("%s: CopyBuffer failed. Error %ld",__FUNCTION__,GetLastError());
      return EMPTY_VALUE;
     }
   return array[0];
  }
//+------------------------------------------------------------------+
//| Return the state of the indicator line                           |
//+------------------------------------------------------------------+
ENUM_LINE_STATE LineState(const int ind_handle,const int index,const int buffer_num)
  {
//--- Get the values of the indicator line with the shift (0,1,2) relative to the passed index
   const double value0=IndicatorValue(ind_handle,index,  buffer_num);
   const double value1=IndicatorValue(ind_handle,index+1,buffer_num);
   const double value2=IndicatorValue(ind_handle,index+2,buffer_num);
//--- If at least one of the values could not be obtained, return an undefined value
   if(value0==EMPTY_VALUE || value1==EMPTY_VALUE || value2==EMPTY_VALUE)
      return LINE_STATE_NONE;
//--- Line upward reversal (value2>value1 && value0>value1)
   if(NormalizeDouble(value2-value1,ind_digits)>0 && NormalizeDouble(value0-value1,ind_digits)>0)
      return LINE_STATE_TURN_UP;
//--- Line upward direction (value2<=value1 && value0>value1)
   else if(NormalizeDouble(value2-value1,ind_digits)<=0 && NormalizeDouble(value0-value1,ind_digits)>0)
      return LINE_STATE_UP;
//--- Line upward stop (value2<=value1 && value0==value1)
   else if(NormalizeDouble(value2-value1,ind_digits)<=0 && NormalizeDouble(value0-value1,ind_digits)==0)
      return LINE_STATE_STOP_UP;
//--- Line downward reversal (value2<value1 && value0<value1)
   if(NormalizeDouble(value2-value1,ind_digits)<0 && NormalizeDouble(value0-value1,ind_digits)<0)
      return LINE_STATE_TURN_DOWN;
//--- Line downward direction (value2>=value1 && value0<value1)
   else if(NormalizeDouble(value2-value1,ind_digits)>=0 && NormalizeDouble(value0-value1,ind_digits)<0)
      return LINE_STATE_DOWN;
//--- Line downward stop (value2>=value1 && value0==value1)
   else if(NormalizeDouble(value2-value1,ind_digits)>=0 && NormalizeDouble(value0-value1,ind_digits)==0)
      return LINE_STATE_STOP_DOWN;
//--- Undefined state
   return LINE_STATE_NONE;
  }
//+------------------------------------------------------------------+
//| Return the state of the line relative to the specified level     |
//+------------------------------------------------------------------+
ENUM_LINE_STATE LineStateRelative(const int ind_handle,const int index,const int buffer_num,const double level0,const double level1=EMPTY_VALUE)
  {
//--- Get the values of the indicator line with the shift (0,1) relative to the passed index
   const double value0=IndicatorValue(ind_handle,index,  buffer_num);
   const double value1=IndicatorValue(ind_handle,index+1,buffer_num);
//--- If at least one of the values could not be obtained, return an undefined value
   if(value0==EMPTY_VALUE || value1==EMPTY_VALUE)
      return LINE_STATE_NONE;
//--- Define the second level to compare
   double level=(level1==EMPTY_VALUE ? level0 : level1);
//--- The line is below the level (value1<level && value0<level0)
   if(NormalizeDouble(value1-level,ind_digits)<0 && NormalizeDouble(value0-level0,ind_digits)<0)
      return LINE_STATE_UNDER;
//--- The line is above the level (value1>level && value0>level0)
   if(NormalizeDouble(value1-level,ind_digits)>0 && NormalizeDouble(value0-level0,ind_digits)>0)
      return LINE_STATE_ABOVE;
//--- The line crossed the level upwards (value1<=level && value0>level0)
   if(NormalizeDouble(value1-level,ind_digits)<=0 && NormalizeDouble(value0-level0,ind_digits)>0)
      return LINE_STATE_CROSS_UP;
//--- The line crossed the level downwards (value1>=level && value0<level0)
   if(NormalizeDouble(value1-level,ind_digits)>=0 && NormalizeDouble(value0-level0,ind_digits)<0)
      return LINE_STATE_CROSS_DOWN;
//--- The line touched the level from below (value1<level0 && value0==level0)
   if(NormalizeDouble(value1-level,ind_digits)<0 && NormalizeDouble(value0-level0,ind_digits)==0)
      return LINE_STATE_TOUCH_BELOW;
//--- The line touched the level from above (value1>level0 && value0==level0)
   if(NormalizeDouble(value1-level,ind_digits)>0 && NormalizeDouble(value0-level0,ind_digits)==0)
      return LINE_STATE_TOUCH_BELOW;
//--- Line is equal to the level value (value1==level0 && value0==level0)
   if(NormalizeDouble(value1-level,ind_digits)==0 && NormalizeDouble(value0-level0,ind_digits)==0)
      return LINE_STATE_EQUALS;
//--- Undefined state
   return LINE_STATE_NONE;
  }
//+------------------------------------------------------------------+
//| Return the indicator line state description                      |
//+------------------------------------------------------------------+
string LineStateDescription(const ENUM_LINE_STATE state)
  {
   switch(state)
     {
      case LINE_STATE_UP         :  return "Up";
      case LINE_STATE_STOP_UP    :  return "Stop Up";
      case LINE_STATE_TURN_UP    :  return "Turn Up";
      case LINE_STATE_DOWN       :  return "Down";
      case LINE_STATE_STOP_DOWN  :  return "Stop Down";
      case LINE_STATE_TURN_DOWN  :  return "Turn Down";
      case LINE_STATE_ABOVE      :  return "Above level";
      case LINE_STATE_UNDER      :  return "Under level";
      case LINE_STATE_CROSS_UP   :  return "Crossing Up";
      case LINE_STATE_CROSS_DOWN :  return "Crossing Down";
      case LINE_STATE_TOUCH_BELOW:  return "Touch from Below";
      case LINE_STATE_TOUCH_ABOVE:  return "Touch from Above";
      case LINE_STATE_EQUALS     :  return "Equals";
      default                    :  return "Unknown";
     }
  }
Ao usar o painel de informações, os dados são exibidos no painel por meio de uma função:
//+------------------------------------------------------------------+
//| Display data from the specified timeseries index to the panel    |
//+------------------------------------------------------------------+
void DrawData(const int index,const datetime time)
  {
//--- Declare the variables to receive data in them
   MqlTick  tick={0};
   MqlRates rates[1];

//--- Exit if unable to get the current prices
   if(!SymbolInfoTick(Symbol(),tick))
      return;
//--- Exit if unable to get the bar data by the specified index
   if(CopyRates(Symbol(),PERIOD_CURRENT,index,1,rates)!=1)
      return;

//--- Set font parameters for bar and indicator data headers
   int  size=0;
   uint flags=0;
   uint angle=0;
   string name=panel.FontParams(size,flags,angle);
   panel.SetFontParams(name,9,FW_BOLD);
   panel.DrawText("Bar data ["+(string)index+"]",3,panel.TableY1(0)-16,clrMaroon,panel.Width()-6);
   panel.DrawText("Indicator data ["+(string)index+"]",3,panel.TableY1(1)-16,clrGreen,panel.Width()-6);
//--- Set font parameters for bar and indicator data
   panel.SetFontParams(name,9);

//--- Display the data of the specified bar in table 0 on the panel
   panel.DrawText("Date",  panel.CellX(0,0,0)+2, panel.CellY(0,0,0)+2); panel.DrawText(TimeToString(  rates[0].time,TIME_DATE),     panel.CellX(0,0,1)+2, panel.CellY(0,0,1)+2,clrNONE,90);
   panel.DrawText("Time",  panel.CellX(0,1,0)+2, panel.CellY(0,1,0)+2); panel.DrawText(TimeToString(  rates[0].time,TIME_MINUTES),  panel.CellX(0,1,1)+2, panel.CellY(0,1,1)+2,clrNONE,90);
   panel.DrawText("Open",  panel.CellX(0,2,0)+2, panel.CellY(0,2,0)+2); panel.DrawText(DoubleToString(rates[0].open,Digits()),      panel.CellX(0,2,1)+2, panel.CellY(0,2,1)+2,clrNONE,90);
   panel.DrawText("High",  panel.CellX(0,3,0)+2, panel.CellY(0,3,0)+2); panel.DrawText(DoubleToString(rates[0].high,Digits()),      panel.CellX(0,3,1)+2, panel.CellY(0,3,1)+2,clrNONE,90);
   panel.DrawText("Low",   panel.CellX(0,4,0)+2, panel.CellY(0,4,0)+2); panel.DrawText(DoubleToString(rates[0].low,Digits()),       panel.CellX(0,4,1)+2, panel.CellY(0,4,1)+2,clrNONE,90);
   panel.DrawText("Close", panel.CellX(0,5,0)+2, panel.CellY(0,5,0)+2); panel.DrawText(DoubleToString(rates[0].close,Digits()),     panel.CellX(0,5,1)+2, panel.CellY(0,5,1)+2,clrNONE,90);

//--- Display the indicator data from the specified bar on the panel in table 1
   panel.DrawText(ind_title, panel.CellX(1,0,0)+2, panel.CellY(1,0,0)+2);
   double value=IndicatorValue(handle,index,0);
   string value_str=(value!=EMPTY_VALUE ? DoubleToString(value,ind_digits) : "");
   panel.DrawText(value_str,panel.CellX(1,0,1)+2,panel.CellY(1,0,1)+2,clrNONE,90);

//--- Display a description of the indicator line state
   panel.DrawText("Line state", panel.CellX(1,1,0)+2, panel.CellY(1,1,0)+2);
   ENUM_LINE_STATE state=LineState(handle,index,0);
//--- The label color changes depending on the value of the line above/below zero
   color clr=(value<0 ? clrRed : value>0 ? clrBlue : clrNONE);
   panel.DrawText(LineStateDescription(state),panel.CellX(1,1,1)+2,panel.CellY(1,1,1)+2,clr,90);

//--- Display a description of the indicator line state relative to zero
   panel.DrawText("OsMA vs Zero", panel.CellX(1,2,0)+2, panel.CellY(1,2,0)+2);
   ENUM_LINE_STATE state_zero=LineStateRelative(handle,index,0,0);
   string state_zero_str=
     (
      state_zero==LINE_STATE_ABOVE        ?  "OsMA > 0"  :
      state_zero==LINE_STATE_UNDER        ?  "OsMA < 0"  :
      state_zero==LINE_STATE_TOUCH_ABOVE  ||
      state_zero==LINE_STATE_TOUCH_BELOW  ?  "Touch"     :
      LineStateDescription(state_zero)
     );
//--- The label color changes depending on the value of the line relative to the level
   clr=(state_zero==LINE_STATE_CROSS_UP ? clrBlue : state_zero==LINE_STATE_CROSS_DOWN ? clrRed : clrNONE);
   panel.DrawText(state_zero_str,panel.CellX(1,2,1)+2,panel.CellY(1,2,1)+2,clr,90);

//--- Redraw the chart to immediately display all changes on the panel
   ChartRedraw(ChartID());
  }
O painel mostra em cores os estados da linha do indicador e sua posição em relação ao zero.
Adicionalmente, no manipulador de eventos OnChartEvent() do EA, chama-se o manipulador de eventos do painel e processam-se eventos para recuperar o índice da barra sob o cursor:
//+------------------------------------------------------------------+
//| ChartEvent function                                              |
//+------------------------------------------------------------------+
void OnChartEvent(const int id,
                  const long &lparam,
                  const double &dparam,
                  const string &sparam)
  {
//--- Handling the panel
//--- Call the panel event handler
   panel.OnChartEvent(id,lparam,dparam,sparam);

//--- If the cursor moves or a click is made on the chart
   if(id==CHARTEVENT_MOUSE_MOVE || id==CHARTEVENT_CLICK)
     {
      //--- Declare the variables to record time and price coordinates in them
      datetime time=0;
      double price=0;
      int wnd=0;
      //--- If the cursor coordinates are converted to date and time
      if(ChartXYToTimePrice(ChartID(),(int)lparam,(int)dparam,wnd,time,price))
        {
         //--- write the bar index where the cursor is located to a global variable
         mouse_bar_index=iBarShift(Symbol(),PERIOD_CURRENT,time);
         //--- Display the bar data under the cursor on the panel
         DrawData(mouse_bar_index,time);
        }
     }

//--- If we received a custom event, display the appropriate message in the journal
   if(id>CHARTEVENT_CUSTOM)
     {
      //--- Here we can implement handling a click on the close button on the panel
      PrintFormat("%s: Event id=%ld, object id (lparam): %lu, event message (sparam): %s",__FUNCTION__,id,lparam,sparam);
     }
  }
Após compilar o EA e executá-lo no gráfico, podemos monitorar o estado da linha do indicador no painel:
O arquivo do EA "TestOscillatorOsMA.mq5" pode ser encontrado nos arquivos anexados ao artigo.
Relative Strength Index
O indicador técnico Índice de Força Relativa (Relative Strength Index, RSI) é um oscilador que segue o preço, variando de 0 a 100. Ao introduzir o Índice de Força Relativa, W. Wilder recomendou usar sua versão de 14 períodos. Versões de 9 e 25 períodos também se tornaram populares posteriormente. Um dos métodos comuns de análise do Índice de Força Relativa é a busca por divergências, onde o preço forma um novo máximo, mas o RSI não consegue superar o nível de seu máximo anterior. Tal divergência indica a possibilidade de uma reversão de preço. Se, em seguida, o indicador vira para baixo e cai abaixo de sua depressão anterior, ele completa o chamado "oscilação defeituosa" (failure swing). Essa "oscilação defeituosa" é considerada uma confirmação de uma reversão de preços iminente.
Ao analisar gráficos, os seguintes sinais do Índice de Força Relativa (RSI) são diferenciados:
- Topos e Fundos
Os topos do indicador RSI geralmente se formam acima de 70 e os fundos abaixo de 30, precedendo frequentemente a formação de topos e fundos no gráfico de preços. - Modelos Gráficos
O RSI muitas vezes forma padrões gráficos, como 'cabeça e ombros' ou triângulos, que podem não ser evidentes no gráfico de preços. - Failure Swing (quebra dos níveis de suporte e resistência)
Ocorre quando o RSI ultrapassa um máximo anterior (pico) ou cai abaixo de um mínimo anterior (vale). - Níveis de Suporte e Resistência
No gráfico do RSI, os níveis de suporte e resistência são ainda mais distintos do que no gráfico de preços. - Divergências
Como mencionado anteriormente, divergências ocorrem quando o preço atinge um novo máximo (mínimo), mas não é confirmado por um novo máximo (mínimo) no gráfico do RSI. Isso geralmente leva a uma correção de preços na direção do movimento do Índice de Força Relativa.
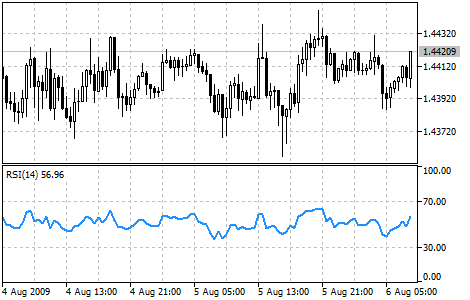
Parâmetros
O indicador tem dois parâmetros ajustáveis:
- Período de cálculo, por padrão — 14,
- Preço de cálculo, por padrão — Close.
Como as áreas de sobrecompra/sobrevenda são usadas para procurar sinais de indicadores, seus valores também serão usados como parâmetros de entrada no Expert Advisor.
Variáveis de entrada e globais para uso do indicador no EA:
//+------------------------------------------------------------------+
//|                                            TestOscillatorRSI.mq5 |
//|                                  Copyright 2023, MetaQuotes Ltd. |
//|                                             https://www.mql5.com |
//+------------------------------------------------------------------+
#property copyright "Copyright 2023, MetaQuotes Ltd."
#property link      "https://www.mql5.com"
#property version   "1.00"
//--- enums
enum ENUM_LINE_STATE
  {
   LINE_STATE_NONE,        // Undefined state
   LINE_STATE_UP,          // Upward
   LINE_STATE_DOWN,        // Downward
   LINE_STATE_TURN_UP,     // Upward reversal
   LINE_STATE_TURN_DOWN,   // Downward reversal
   LINE_STATE_STOP_UP,     // Upward stop
   LINE_STATE_STOP_DOWN,   // Downward stop
   LINE_STATE_ABOVE,       // Above value
   LINE_STATE_UNDER,       // Below value
   LINE_STATE_CROSS_UP,    // Crossing value upwards
   LINE_STATE_CROSS_DOWN,  // Crossing value downwards
   LINE_STATE_TOUCH_BELOW, // Touching value from below
   LINE_STATE_TOUCH_ABOVE, // Touch value from above
   LINE_STATE_EQUALS,      // Equal to value
  };
//--- input parameters
input uint                 InpPeriod=  14;            /* Period         */
input ENUM_APPLIED_PRICE   InpPrice =  PRICE_CLOSE;   /* Applied Price  */
input double               InpOverbough=  70;         /* Overbough level*/
input double               InpOversold =  30;         /* Oversold level */
//--- global variables
int      handle=INVALID_HANDLE;  // Indicator handle
int      period=0;               // RSI calculation period
int      ind_digits=0;           // Number of decimal places in the indicator values
double   overbough=0;            // Overbought level
double   oversold=0;             // Oversold level
string   ind_title;              // Indicator description
Ao usar o painel de informações, inclui-se o arquivo da classe do painel e adicionam-se variáveis para trabalhar com ele:
//+------------------------------------------------------------------+
//|                                            TestOscillatorRSI.mq5 |
//|                                  Copyright 2023, MetaQuotes Ltd. |
//|                                             https://www.mql5.com |
//+------------------------------------------------------------------+
#property copyright "Copyright 2023, MetaQuotes Ltd."
#property link      "https://www.mql5.com"
#property version   "1.00"
//--- includes
#include <Dashboard\Dashboard.mqh>
//--- enums
enum ENUM_LINE_STATE
  {
   LINE_STATE_NONE,        // Undefined state
   LINE_STATE_UP,          // Upward
   LINE_STATE_DOWN,        // Downward
   LINE_STATE_TURN_UP,     // Upward reversal
   LINE_STATE_TURN_DOWN,   // Downward reversal
   LINE_STATE_STOP_UP,     // Upward stop
   LINE_STATE_STOP_DOWN,   // Downward stop
   LINE_STATE_ABOVE,       // Above value
   LINE_STATE_UNDER,       // Below value
   LINE_STATE_CROSS_UP,    // Crossing value upwards
   LINE_STATE_CROSS_DOWN,  // Crossing value downwards
   LINE_STATE_TOUCH_BELOW, // Touching value from below
   LINE_STATE_TOUCH_ABOVE, // Touch value from above
   LINE_STATE_EQUALS,      // Equal to value
  };
//--- input parameters
input uint                 InpPeriod=  14;            /* Period         */
input ENUM_APPLIED_PRICE   InpPrice =  PRICE_CLOSE;   /* Applied Price  */
input double               InpOverbough=  70;         /* Overbough level*/
input double               InpOversold =  30;         /* Oversold level */
//--- global variables
int      handle=INVALID_HANDLE;  // Indicator handle
int      period=0;               // RSI calculation period
int      ind_digits=0;           // Number of decimal places in the indicator values
double   overbough=0;            // Overbought level
double   oversold=0;             // Oversold level
string   ind_title;              // Indicator description
//--- variables for the panel
int      mouse_bar_index;        // Index of the bar the data is taken from
CDashboard *panel=NULL;          // Pointer to the panel object
Inicialização
Manipulador OnInit() para inicializar os parâmetros do indicador e criar seu handle:
//+------------------------------------------------------------------+
//| Expert initialization function                                   |
//+------------------------------------------------------------------+
int OnInit()
  {
//--- create timer
   EventSetTimer(60);

//--- Indicator
//--- Set and adjust the calculation period and levels if necessary
   period=int(InpPeriod<1 ? 14 : InpPeriod<2 ? 2 : InpPeriod);
   overbough=InpOverbough;
   oversold=(InpOversold>=overbough ? overbough-0.01 : InpOversold);
//--- Set the indicator name and the number of decimal places
   ind_title=StringFormat("RSI(%lu)",period);
   ind_digits=2;
//--- Create indicator handle
   ResetLastError();
   handle=iRSI(Symbol(),PERIOD_CURRENT,period,InpPrice);
   if(handle==INVALID_HANDLE)
     {
      PrintFormat("%s: Failed to create indicator handle %s. Error %ld",__FUNCTION__,ind_title,GetLastError());
      return INIT_FAILED;
     }

//--- Successful initialization
   return(INIT_SUCCEEDED);
  }
Ao usar o painel de informações, cria-se o painel:
//+------------------------------------------------------------------+
//| Expert initialization function                                   |
//+------------------------------------------------------------------+
int OnInit()
  {
//--- create timer
   EventSetTimer(60);

//--- Indicator
//--- Set and adjust the calculation period and levels if necessary
   period=int(InpPeriod<1 ? 14 : InpPeriod<2 ? 2 : InpPeriod);
   overbough=InpOverbough;
   oversold=(InpOversold>=overbough ? overbough-0.01 : InpOversold);
//--- Set the indicator name and the number of decimal places
   ind_title=StringFormat("RSI(%lu)",period);
   ind_digits=2;
//--- Create indicator handle
   ResetLastError();
   handle=iRSI(Symbol(),PERIOD_CURRENT,period,InpPrice);
   if(handle==INVALID_HANDLE)
     {
      PrintFormat("%s: Failed to create indicator handle %s. Error %ld",__FUNCTION__,ind_title,GetLastError());
      return INIT_FAILED;
     }

//--- Dashboard
//--- Create the panel
   panel=new CDashboard(1,20,20,229,243);
   if(panel==NULL)
     {
      Print("Error. Failed to create panel object");
      return INIT_FAILED;
     }
//--- Set font parameters
   panel.SetFontParams("Calibri",9);
//--- Display the panel with the "Symbol, Timeframe description" header text
   panel.View(Symbol()+", "+StringSubstr(EnumToString(Period()),7));
//--- Create a table with ID 0 to display bar data in it
   panel.CreateNewTable(0);
//--- Draw a table with ID 0 on the panel background
   panel.DrawGrid(0,2,20,6,2,18,112);

//--- Create a table with ID 1 to display indicator data in it
   panel.CreateNewTable(1);
//--- Get the Y2 table coordinate with ID 0 and
//--- set the Y1 coordinate for the table with ID 1
   int y1=panel.TableY2(0)+22;
//--- Draw a table with ID 1 on the panel background
   panel.DrawGrid(1,2,y1,4,2,18,112);

//--- Display tabular data in the journal
   panel.GridPrint(0,2);
   panel.GridPrint(1,2);
//--- Initialize the variable with the index of the mouse cursor bar
   mouse_bar_index=0;
//--- Display the data of the current bar on the panel
   DrawData(mouse_bar_index,TimeCurrent());

//--- Successful initialization
   return(INIT_SUCCEEDED);
  }
Desinicialização
No manipulador OnDeinit() do EA, libera-se o handle do indicador:
//+------------------------------------------------------------------+
//| Expert deinitialization function                                 |
//+------------------------------------------------------------------+
void OnDeinit(const int reason)
  {
//--- destroy timer
   EventKillTimer();

//--- Release handle of the indicator
   ResetLastError();
   if(!IndicatorRelease(handle))
      PrintFormat("%s: IndicatorRelease failed. Error %ld",__FUNCTION__,GetLastError());
//--- Clear all comments on the chart
   Comment("");
  }
Ao usar o painel de informações, remove-se o objeto do painel criado:
//+------------------------------------------------------------------+
//| Expert deinitialization function                                 |
//+------------------------------------------------------------------+
void OnDeinit(const int reason)
  {
//--- destroy timer
   EventKillTimer();

//--- Release handle of the indicator
   ResetLastError();
   if(!IndicatorRelease(handle))
      PrintFormat("%s: IndicatorRelease failed. Error %ld",__FUNCTION__,GetLastError());
//--- Clear all comments on the chart
   Comment("");

//--- If the panel object exists, delete it
   if(panel!=NULL)
      delete panel;
  }
Recuperação de dados
Funções comuns para recuperar dados através do handle do indicador:
//+------------------------------------------------------------------+
//| Return the indicator data on the specified bar                   |
//+------------------------------------------------------------------+
double IndicatorValue(const int ind_handle,const int index,const int buffer_num)
  {
   double array[1]={0};
   ResetLastError();
   if(CopyBuffer(ind_handle,buffer_num,index,1,array)!=1)
     {
      PrintFormat("%s: CopyBuffer failed. Error %ld",__FUNCTION__,GetLastError());
      return EMPTY_VALUE;
     }
   return array[0];
  }
//+------------------------------------------------------------------+
//| Return the state of the indicator line                           |
//+------------------------------------------------------------------+
ENUM_LINE_STATE LineState(const int ind_handle,const int index,const int buffer_num)
  {
//--- Get the values of the indicator line with the shift (0,1,2) relative to the passed index
   const double value0=IndicatorValue(ind_handle,index,  buffer_num);
   const double value1=IndicatorValue(ind_handle,index+1,buffer_num);
   const double value2=IndicatorValue(ind_handle,index+2,buffer_num);
//--- If at least one of the values could not be obtained, return an undefined value
   if(value0==EMPTY_VALUE || value1==EMPTY_VALUE || value2==EMPTY_VALUE)
      return LINE_STATE_NONE;
//--- Line upward reversal (value2>value1 && value0>value1)
   if(NormalizeDouble(value2-value1,ind_digits)>0 && NormalizeDouble(value0-value1,ind_digits)>0)
      return LINE_STATE_TURN_UP;
//--- Line upward direction (value2<=value1 && value0>value1)
   else if(NormalizeDouble(value2-value1,ind_digits)<=0 && NormalizeDouble(value0-value1,ind_digits)>0)
      return LINE_STATE_UP;
//--- Line upward stop (value2<=value1 && value0==value1)
   else if(NormalizeDouble(value2-value1,ind_digits)<=0 && NormalizeDouble(value0-value1,ind_digits)==0)
      return LINE_STATE_STOP_UP;
//--- Line downward reversal (value2<value1 && value0<value1)
   if(NormalizeDouble(value2-value1,ind_digits)<0 && NormalizeDouble(value0-value1,ind_digits)<0)
      return LINE_STATE_TURN_DOWN;
//--- Line downward direction (value2>=value1 && value0<value1)
   else if(NormalizeDouble(value2-value1,ind_digits)>=0 && NormalizeDouble(value0-value1,ind_digits)<0)
      return LINE_STATE_DOWN;
//--- Line downward stop (value2>=value1 && value0==value1)
   else if(NormalizeDouble(value2-value1,ind_digits)>=0 && NormalizeDouble(value0-value1,ind_digits)==0)
      return LINE_STATE_STOP_DOWN;
//--- Undefined state
   return LINE_STATE_NONE;
  }
//+------------------------------------------------------------------+
//| Return the state of the line relative to the specified level     |
//+------------------------------------------------------------------+
ENUM_LINE_STATE LineStateRelative(const int ind_handle,const int index,const int buffer_num,const double level0,const double level1=EMPTY_VALUE)
  {
//--- Get the values of the indicator line with the shift (0,1) relative to the passed index
   const double value0=IndicatorValue(ind_handle,index,  buffer_num);
   const double value1=IndicatorValue(ind_handle,index+1,buffer_num);
//--- If at least one of the values could not be obtained, return an undefined value
   if(value0==EMPTY_VALUE || value1==EMPTY_VALUE)
      return LINE_STATE_NONE;
//--- Define the second level to compare
   double level=(level1==EMPTY_VALUE ? level0 : level1);
//--- The line is below the level (value1<level && value0<level0)
   if(NormalizeDouble(value1-level,ind_digits)<0 && NormalizeDouble(value0-level0,ind_digits)<0)
      return LINE_STATE_UNDER;
//--- The line is above the level (value1>level && value0>level0)
   if(NormalizeDouble(value1-level,ind_digits)>0 && NormalizeDouble(value0-level0,ind_digits)>0)
      return LINE_STATE_ABOVE;
//--- The line crossed the level upwards (value1<=level && value0>level0)
   if(NormalizeDouble(value1-level,ind_digits)<=0 && NormalizeDouble(value0-level0,ind_digits)>0)
      return LINE_STATE_CROSS_UP;
//--- The line crossed the level downwards (value1>=level && value0<level0)
   if(NormalizeDouble(value1-level,ind_digits)>=0 && NormalizeDouble(value0-level0,ind_digits)<0)
      return LINE_STATE_CROSS_DOWN;
//--- The line touched the level from below (value1<level0 && value0==level0)
   if(NormalizeDouble(value1-level,ind_digits)<0 && NormalizeDouble(value0-level0,ind_digits)==0)
      return LINE_STATE_TOUCH_BELOW;
//--- The line touched the level from above (value1>level0 && value0==level0)
   if(NormalizeDouble(value1-level,ind_digits)>0 && NormalizeDouble(value0-level0,ind_digits)==0)
      return LINE_STATE_TOUCH_BELOW;
//--- Line is equal to the level value (value1==level0 && value0==level0)
   if(NormalizeDouble(value1-level,ind_digits)==0 && NormalizeDouble(value0-level0,ind_digits)==0)
      return LINE_STATE_EQUALS;
//--- Undefined state
   return LINE_STATE_NONE;
  }
//+------------------------------------------------------------------+
//| Return the indicator line state description                      |
//+------------------------------------------------------------------+
string LineStateDescription(const ENUM_LINE_STATE state)
  {
   switch(state)
     {
      case LINE_STATE_UP         :  return "Up";
      case LINE_STATE_STOP_UP    :  return "Stop Up";
      case LINE_STATE_TURN_UP    :  return "Turn Up";
      case LINE_STATE_DOWN       :  return "Down";
      case LINE_STATE_STOP_DOWN  :  return "Stop Down";
      case LINE_STATE_TURN_DOWN  :  return "Turn Down";
      case LINE_STATE_ABOVE      :  return "Above level";
      case LINE_STATE_UNDER      :  return "Under level";
      case LINE_STATE_CROSS_UP   :  return "Crossing Up";
      case LINE_STATE_CROSS_DOWN :  return "Crossing Down";
      case LINE_STATE_TOUCH_BELOW:  return "Touch from Below";
      case LINE_STATE_TOUCH_ABOVE:  return "Touch from Above";
      case LINE_STATE_EQUALS     :  return "Equals";
      default                    :  return "Unknown";
     }
  }
Ao usar o painel de informações, os dados são exibidos no painel por meio de uma função:
//+------------------------------------------------------------------+
//| Display data from the specified timeseries index to the panel    |
//+------------------------------------------------------------------+
void DrawData(const int index,const datetime time)
  {
//--- Declare the variables to receive data in them
   MqlTick  tick={0};
   MqlRates rates[1];

//--- Exit if unable to get the current prices
   if(!SymbolInfoTick(Symbol(),tick))
      return;
//--- Exit if unable to get the bar data by the specified index
   if(CopyRates(Symbol(),PERIOD_CURRENT,index,1,rates)!=1)
      return;

//--- Set font parameters for bar and indicator data headers
   int  size=0;
   uint flags=0;
   uint angle=0;
   string name=panel.FontParams(size,flags,angle);
   panel.SetFontParams(name,9,FW_BOLD);
   panel.DrawText("Bar data ["+(string)index+"]",3,panel.TableY1(0)-16,clrMaroon,panel.Width()-6);
   panel.DrawText("Indicator data ["+(string)index+"]",3,panel.TableY1(1)-16,clrGreen,panel.Width()-6);
//--- Set font parameters for bar and indicator data
   panel.SetFontParams(name,9);

//--- Display the data of the specified bar in table 0 on the panel
   panel.DrawText("Date",  panel.CellX(0,0,0)+2, panel.CellY(0,0,0)+2); panel.DrawText(TimeToString(  rates[0].time,TIME_DATE),     panel.CellX(0,0,1)+2, panel.CellY(0,0,1)+2,clrNONE,90);
   panel.DrawText("Time",  panel.CellX(0,1,0)+2, panel.CellY(0,1,0)+2); panel.DrawText(TimeToString(  rates[0].time,TIME_MINUTES),  panel.CellX(0,1,1)+2, panel.CellY(0,1,1)+2,clrNONE,90);
   panel.DrawText("Open",  panel.CellX(0,2,0)+2, panel.CellY(0,2,0)+2); panel.DrawText(DoubleToString(rates[0].open,Digits()),      panel.CellX(0,2,1)+2, panel.CellY(0,2,1)+2,clrNONE,90);
   panel.DrawText("High",  panel.CellX(0,3,0)+2, panel.CellY(0,3,0)+2); panel.DrawText(DoubleToString(rates[0].high,Digits()),      panel.CellX(0,3,1)+2, panel.CellY(0,3,1)+2,clrNONE,90);
   panel.DrawText("Low",   panel.CellX(0,4,0)+2, panel.CellY(0,4,0)+2); panel.DrawText(DoubleToString(rates[0].low,Digits()),       panel.CellX(0,4,1)+2, panel.CellY(0,4,1)+2,clrNONE,90);
   panel.DrawText("Close", panel.CellX(0,5,0)+2, panel.CellY(0,5,0)+2); panel.DrawText(DoubleToString(rates[0].close,Digits()),     panel.CellX(0,5,1)+2, panel.CellY(0,5,1)+2,clrNONE,90);

//--- Display the indicator data from the specified bar on the panel in table 1
   panel.DrawText(ind_title, panel.CellX(1,0,0)+2, panel.CellY(1,0,0)+2);
   double value=IndicatorValue(handle,index,0);
   string value_str=(value!=EMPTY_VALUE ? DoubleToString(value,ind_digits) : "");
   panel.DrawText(value_str,panel.CellX(1,0,1)+2,panel.CellY(1,0,1)+2,clrNONE,100);

//--- Display a description of the indicator line state relative to the overbought level
   string ovb=StringFormat("%+.2f",overbough);
   panel.DrawText("Overbough", panel.CellX(1,2,0)+2, panel.CellY(1,2,0)+2);
   panel.DrawText(ovb, panel.CellX(1,2,0)+66, panel.CellY(1,2,0)+2);
   ENUM_LINE_STATE state_ovb=LineStateRelative(handle,index,0,overbough);
//--- The label color changes depending on the value of the line relative to the level
   color clr=(state_ovb==LINE_STATE_CROSS_DOWN ? clrRed : clrNONE);
   string ovb_str=(state_ovb==LINE_STATE_ABOVE ? "Inside the area" : LineStateDescription(state_ovb));
   panel.DrawText(ovb_str,panel.CellX(1,2,1)+2,panel.CellY(1,2,1)+2,clr,100);

//--- Display a description of the indicator line state relative to the oversold level
   panel.DrawText("Oversold", panel.CellX(1,3,0)+2, panel.CellY(1,3,0)+2);
   string ovs=StringFormat("%+.2f",oversold);
   panel.DrawText(ovs, panel.CellX(1,3,0)+68, panel.CellY(1,3,0)+2);
   ENUM_LINE_STATE state_ovs=LineStateRelative(handle,index,0,oversold);
//--- The label color changes depending on the value of the line relative to the level
   clr=(state_ovs==LINE_STATE_CROSS_UP ? clrBlue : clrNONE);
   string ovs_str=(state_ovs==LINE_STATE_UNDER ? "Inside the area" : LineStateDescription(state_ovs));
   panel.DrawText(ovs_str,panel.CellX(1,3,1)+2,panel.CellY(1,3,1)+2,clr,100);

//--- Display a description of the indicator line state
   panel.DrawText("Line state", panel.CellX(1,1,0)+2, panel.CellY(1,1,0)+2);
   ENUM_LINE_STATE state=LineState(handle,index,0);
//--- The label color changes depending on the location of the line in the overbought/oversold areas
   clr=(state_ovb==LINE_STATE_ABOVE || state_ovb==LINE_STATE_CROSS_DOWN ? clrRed : state_ovs==LINE_STATE_UNDER || state_ovs==LINE_STATE_CROSS_UP ? clrBlue : clrNONE);
   panel.DrawText(LineStateDescription(state),panel.CellX(1,1,1)+2,panel.CellY(1,1,1)+2,clr,100);

//--- Redraw the chart to immediately display all changes on the panel
   ChartRedraw(ChartID());
  }
O painel mostra em cores o estado da linha em relação aos níveis, se a linha estiver em zonas de sobrecompra/sobrevenda.
Adicionalmente, no manipulador de eventos OnChartEvent() do EA, chama-se o manipulador de eventos do painel e processam-se eventos para recuperar o índice da barra sob o cursor:
//+------------------------------------------------------------------+
//| ChartEvent function                                              |
//+------------------------------------------------------------------+
void OnChartEvent(const int id,
                  const long &lparam,
                  const double &dparam,
                  const string &sparam)
  {
//--- Handling the panel
//--- Call the panel event handler
   panel.OnChartEvent(id,lparam,dparam,sparam);

//--- If the cursor moves or a click is made on the chart
   if(id==CHARTEVENT_MOUSE_MOVE || id==CHARTEVENT_CLICK)
     {
      //--- Declare the variables to record time and price coordinates in them
      datetime time=0;
      double price=0;
      int wnd=0;
      //--- If the cursor coordinates are converted to date and time
      if(ChartXYToTimePrice(ChartID(),(int)lparam,(int)dparam,wnd,time,price))
        {
         //--- write the bar index where the cursor is located to a global variable
         mouse_bar_index=iBarShift(Symbol(),PERIOD_CURRENT,time);
         //--- Display the bar data under the cursor on the panel
         DrawData(mouse_bar_index,time);
        }
     }

//--- If we received a custom event, display the appropriate message in the journal
   if(id>CHARTEVENT_CUSTOM)
     {
      //--- Here we can implement handling a click on the close button on the panel
      PrintFormat("%s: Event id=%ld, object id (lparam): %lu, event message (sparam): %s",__FUNCTION__,id,lparam,sparam);
     }
  }
Após compilar o EA e executá-lo no gráfico, podemos monitorar o estado da linha do indicador no painel:
O arquivo do EA "TestOscillatorRSI.mq5" pode ser encontrado nos arquivos anexados ao artigo.
Relative Vigor Index
O indicador técnico Índice de Vigor Relativo (Relative Vigor Index, RVI) é baseado na ideia de que, em um mercado em alta, o preço de fechamento é geralmente maior do que o preço de abertura. E o contrário é verdadeiro para um mercado em baixa. Assim, o vigor do movimento é estabelecido pela posição em que o preço se encontra no final do período. Para tornar o índice normalizado ao intervalo diário de negociação, a variação do preço é dividida pelo intervalo máximo de preços durante o dia. Para suavizar os cálculos, é utilizada uma média móvel simples. O período considerado ideal é 10. Para eliminar possíveis ambiguidades, é construída uma linha de sinal — a média móvel ponderada simetricamente de 4 períodos dos valores do Índice de Vigor Relativo. O cruzamento das linhas indica a presença de um sinal de compra ou venda.
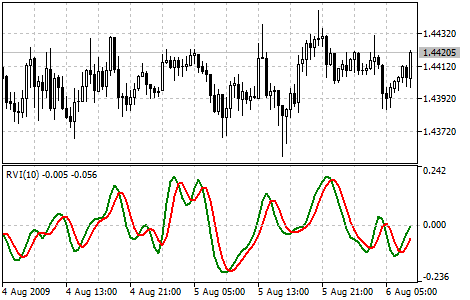
Parâmetros
O indicador tem um parâmetro ajustável, nomeadamente o período de cálculo. O valor padrão é 10.
Variáveis de entrada e globais para uso do indicador no EA:
//+------------------------------------------------------------------+
//|                                            TestOscillatorRVI.mq5 |
//|                                  Copyright 2023, MetaQuotes Ltd. |
//|                                             https://www.mql5.com |
//+------------------------------------------------------------------+
#property copyright "Copyright 2023, MetaQuotes Ltd."
#property link      "https://www.mql5.com"
#property version   "1.00"
//--- enums
enum ENUM_LINE_STATE
  {
   LINE_STATE_NONE,        // Undefined state
   LINE_STATE_UP,          // Upward
   LINE_STATE_DOWN,        // Downward
   LINE_STATE_TURN_UP,     // Upward reversal
   LINE_STATE_TURN_DOWN,   // Downward reversal
   LINE_STATE_STOP_UP,     // Upward stop
   LINE_STATE_STOP_DOWN,   // Downward stop
   LINE_STATE_ABOVE,       // Above value
   LINE_STATE_UNDER,       // Below value
   LINE_STATE_CROSS_UP,    // Crossing value upwards
   LINE_STATE_CROSS_DOWN,  // Crossing value downwards
   LINE_STATE_TOUCH_BELOW, // Touching value from below
   LINE_STATE_TOUCH_ABOVE, // Touch value from above
   LINE_STATE_EQUALS,      // Equal to value
  };
//--- input parameters
input uint  InpPeriod   =  10;   /* Period */
//--- global variables
int      handle=INVALID_HANDLE;  // Indicator handle
int      period=0;               // RVI calculation period
int      ind_digits=0;           // Number of decimal places in the indicator values
string   ind_title;              // Indicator description
Ao usar o painel de informações, inclui-se o arquivo da classe do painel e adicionam-se variáveis para trabalhar com ele:
//+------------------------------------------------------------------+
//|                                            TestOscillatorRVI.mq5 |
//|                                  Copyright 2023, MetaQuotes Ltd. |
//|                                             https://www.mql5.com |
//+------------------------------------------------------------------+
#property copyright "Copyright 2023, MetaQuotes Ltd."
#property link      "https://www.mql5.com"
#property version   "1.00"
//--- includes
#include <Dashboard\Dashboard.mqh>
//--- enums
enum ENUM_LINE_STATE
  {
   LINE_STATE_NONE,        // Undefined state
   LINE_STATE_UP,          // Upward
   LINE_STATE_DOWN,        // Downward
   LINE_STATE_TURN_UP,     // Upward reversal
   LINE_STATE_TURN_DOWN,   // Downward reversal
   LINE_STATE_STOP_UP,     // Upward stop
   LINE_STATE_STOP_DOWN,   // Downward stop
   LINE_STATE_ABOVE,       // Above value
   LINE_STATE_UNDER,       // Below value
   LINE_STATE_CROSS_UP,    // Crossing value upwards
   LINE_STATE_CROSS_DOWN,  // Crossing value downwards
   LINE_STATE_TOUCH_BELOW, // Touching value from below
   LINE_STATE_TOUCH_ABOVE, // Touch value from above
   LINE_STATE_EQUALS,      // Equal to value
  };
//--- input parameters
input uint  InpPeriod   =  10;   /* Period */
//--- global variables
int      handle=INVALID_HANDLE;  // Indicator handle
int      period=0;               // RVI calculation period
int      ind_digits=0;           // Number of decimal places in the indicator values
string   ind_title;              // Indicator description
//--- variables for the panel
int      mouse_bar_index;        // Index of the bar the data is taken from
CDashboard *panel=NULL;          // Pointer to the panel object
Inicialização
Manipulador OnInit() para inicializar os parâmetros do indicador e criar seu handle:
//+------------------------------------------------------------------+
//| Expert initialization function                                   |
//+------------------------------------------------------------------+
int OnInit()
  {
//--- create timer
   EventSetTimer(60);

//--- Indicator
//--- Set and adjust the calculation period if necessary
   period=int(InpPeriod<1 ? 10 : InpPeriod);
//--- Set the indicator name and the number of decimal places
   ind_title=StringFormat("RVI(%lu)",period);
   ind_digits=3;
//--- Create indicator handle
   ResetLastError();
   handle=iRVI(Symbol(),PERIOD_CURRENT,period);
   if(handle==INVALID_HANDLE)
     {
      PrintFormat("%s: Failed to create indicator handle %s. Error %ld",__FUNCTION__,ind_title,GetLastError());
      return INIT_FAILED;
     }

//--- Successful initialization
   return(INIT_SUCCEEDED);
  }
Ao usar o painel de informações, cria-se o painel:
//+------------------------------------------------------------------+
//| Expert initialization function                                   |
//+------------------------------------------------------------------+
int OnInit()
  {
//--- create timer
   EventSetTimer(60);

//--- Indicator
//--- Set and adjust the calculation period if necessary
   period=int(InpPeriod<1 ? 10 : InpPeriod);
//--- Set the indicator name and the number of decimal places
   ind_title=StringFormat("RVI(%lu)",period);
   ind_digits=3;
//--- Create indicator handle
   ResetLastError();
   handle=iRVI(Symbol(),PERIOD_CURRENT,period);
   if(handle==INVALID_HANDLE)
     {
      PrintFormat("%s: Failed to create indicator handle %s. Error %ld",__FUNCTION__,ind_title,GetLastError());
      return INIT_FAILED;
     }

//--- Dashboard
//--- Create the panel
   panel=new CDashboard(1,20,20,199,225);
   if(panel==NULL)
     {
      Print("Error. Failed to create panel object");
      return INIT_FAILED;
     }
//--- Set font parameters
   panel.SetFontParams("Calibri",9);
//--- Display the panel with the "Symbol, Timeframe description" header text
   panel.View(Symbol()+", "+StringSubstr(EnumToString(Period()),7));
//--- Create a table with ID 0 to display bar data in it
   panel.CreateNewTable(0);
//--- Draw a table with ID 0 on the panel background
   panel.DrawGrid(0,2,20,6,2,18,97);

//--- Create a table with ID 1 to display indicator data in it
   panel.CreateNewTable(1);
//--- Get the Y2 table coordinate with ID 0 and
//--- set the Y1 coordinate for the table with ID 1
   int y1=panel.TableY2(0)+22;
//--- Draw a table with ID 1 on the panel background
   panel.DrawGrid(1,2,y1,3,2,18,97);

//--- Display tabular data in the journal
   panel.GridPrint(0,2);
   panel.GridPrint(1,2);
//--- Initialize the variable with the index of the mouse cursor bar
   mouse_bar_index=0;
//--- Display the data of the current bar on the panel
   DrawData(mouse_bar_index,TimeCurrent());

//--- Successful initialization
   return(INIT_SUCCEEDED);
  }
Desinicialização
No manipulador OnDeinit() do EA, libera-se o handle do indicador:
//+------------------------------------------------------------------+
//| Expert deinitialization function                                 |
//+------------------------------------------------------------------+
void OnDeinit(const int reason)
  {
//--- destroy timer
   EventKillTimer();

//--- Release handle of the indicator
   ResetLastError();
   if(!IndicatorRelease(handle))
      PrintFormat("%s: IndicatorRelease failed. Error %ld",__FUNCTION__,GetLastError());
//--- Clear all comments on the chart
   Comment("");
  }
Ao usar o painel de informações, remove-se o objeto do painel criado:
//+------------------------------------------------------------------+
//| Expert deinitialization function                                 |
//+------------------------------------------------------------------+
void OnDeinit(const int reason)
  {
//--- destroy timer
   EventKillTimer();

//--- Release handle of the indicator
   ResetLastError();
   if(!IndicatorRelease(handle))
      PrintFormat("%s: IndicatorRelease failed. Error %ld",__FUNCTION__,GetLastError());
//--- Clear all comments on the chart
   Comment("");

//--- If the panel object exists, delete it
   if(panel!=NULL)
      delete panel;
  }
Recuperação de dados
Funções comuns para recuperar dados através do handle do indicador:
//+------------------------------------------------------------------+
//| Return the indicator data on the specified bar                   |
//+------------------------------------------------------------------+
double IndicatorValue(const int ind_handle,const int index,const int buffer_num)
  {
   double array[1]={0};
   ResetLastError();
   if(CopyBuffer(ind_handle,buffer_num,index,1,array)!=1)
     {
      PrintFormat("%s: CopyBuffer failed. Error %ld",__FUNCTION__,GetLastError());
      return EMPTY_VALUE;
     }
   return array[0];
  }
//+------------------------------------------------------------------+
//| Return the state of the indicator line                           |
//+------------------------------------------------------------------+
ENUM_LINE_STATE LineState(const int ind_handle,const int index,const int buffer_num)
  {
//--- Get the values of the indicator line with the shift (0,1,2) relative to the passed index
   const double value0=IndicatorValue(ind_handle,index,  buffer_num);
   const double value1=IndicatorValue(ind_handle,index+1,buffer_num);
   const double value2=IndicatorValue(ind_handle,index+2,buffer_num);
//--- If at least one of the values could not be obtained, return an undefined value
   if(value0==EMPTY_VALUE || value1==EMPTY_VALUE || value2==EMPTY_VALUE)
      return LINE_STATE_NONE;
//--- Line upward reversal (value2>value1 && value0>value1)
   if(NormalizeDouble(value2-value1,ind_digits)>0 && NormalizeDouble(value0-value1,ind_digits)>0)
      return LINE_STATE_TURN_UP;
//--- Line upward direction (value2<=value1 && value0>value1)
   else if(NormalizeDouble(value2-value1,ind_digits)<=0 && NormalizeDouble(value0-value1,ind_digits)>0)
      return LINE_STATE_UP;
//--- Line upward stop (value2<=value1 && value0==value1)
   else if(NormalizeDouble(value2-value1,ind_digits)<=0 && NormalizeDouble(value0-value1,ind_digits)==0)
      return LINE_STATE_STOP_UP;
//--- Line downward reversal (value2<value1 && value0<value1)
   if(NormalizeDouble(value2-value1,ind_digits)<0 && NormalizeDouble(value0-value1,ind_digits)<0)
      return LINE_STATE_TURN_DOWN;
//--- Line downward direction (value2>=value1 && value0<value1)
   else if(NormalizeDouble(value2-value1,ind_digits)>=0 && NormalizeDouble(value0-value1,ind_digits)<0)
      return LINE_STATE_DOWN;
//--- Line downward stop (value2>=value1 && value0==value1)
   else if(NormalizeDouble(value2-value1,ind_digits)>=0 && NormalizeDouble(value0-value1,ind_digits)==0)
      return LINE_STATE_STOP_DOWN;
//--- Undefined state
   return LINE_STATE_NONE;
  }
//+------------------------------------------------------------------+
//| Return the state of the line relative to the specified level     |
//+------------------------------------------------------------------+
ENUM_LINE_STATE LineStateRelative(const int ind_handle,const int index,const int buffer_num,const double level0,const double level1=EMPTY_VALUE)
  {
//--- Get the values of the indicator line with the shift (0,1) relative to the passed index
   const double value0=IndicatorValue(ind_handle,index,  buffer_num);
   const double value1=IndicatorValue(ind_handle,index+1,buffer_num);
//--- If at least one of the values could not be obtained, return an undefined value
   if(value0==EMPTY_VALUE || value1==EMPTY_VALUE)
      return LINE_STATE_NONE;
//--- Define the second level to compare
   double level=(level1==EMPTY_VALUE ? level0 : level1);
//--- The line is below the level (value1<level && value0<level0)
   if(NormalizeDouble(value1-level,ind_digits)<0 && NormalizeDouble(value0-level0,ind_digits)<0)
      return LINE_STATE_UNDER;
//--- The line is above the level (value1>level && value0>level0)
   if(NormalizeDouble(value1-level,ind_digits)>0 && NormalizeDouble(value0-level0,ind_digits)>0)
      return LINE_STATE_ABOVE;
//--- The line crossed the level upwards (value1<=level && value0>level0)
   if(NormalizeDouble(value1-level,ind_digits)<=0 && NormalizeDouble(value0-level0,ind_digits)>0)
      return LINE_STATE_CROSS_UP;
//--- The line crossed the level downwards (value1>=level && value0<level0)
   if(NormalizeDouble(value1-level,ind_digits)>=0 && NormalizeDouble(value0-level0,ind_digits)<0)
      return LINE_STATE_CROSS_DOWN;
//--- The line touched the level from below (value1<level0 && value0==level0)
   if(NormalizeDouble(value1-level,ind_digits)<0 && NormalizeDouble(value0-level0,ind_digits)==0)
      return LINE_STATE_TOUCH_BELOW;
//--- The line touched the level from above (value1>level0 && value0==level0)
   if(NormalizeDouble(value1-level,ind_digits)>0 && NormalizeDouble(value0-level0,ind_digits)==0)
      return LINE_STATE_TOUCH_BELOW;
//--- Line is equal to the level value (value1==level0 && value0==level0)
   if(NormalizeDouble(value1-level,ind_digits)==0 && NormalizeDouble(value0-level0,ind_digits)==0)
      return LINE_STATE_EQUALS;
//--- Undefined state
   return LINE_STATE_NONE;
  }
//+------------------------------------------------------------------+
//| Return the indicator line state description                      |
//+------------------------------------------------------------------+
string LineStateDescription(const ENUM_LINE_STATE state)
  {
   switch(state)
     {
      case LINE_STATE_UP         :  return "Up";
      case LINE_STATE_STOP_UP    :  return "Stop Up";
      case LINE_STATE_TURN_UP    :  return "Turn Up";
      case LINE_STATE_DOWN       :  return "Down";
      case LINE_STATE_STOP_DOWN  :  return "Stop Down";
      case LINE_STATE_TURN_DOWN  :  return "Turn Down";
      case LINE_STATE_ABOVE      :  return "Above level";
      case LINE_STATE_UNDER      :  return "Under level";
      case LINE_STATE_CROSS_UP   :  return "Crossing Up";
      case LINE_STATE_CROSS_DOWN :  return "Crossing Down";
      case LINE_STATE_TOUCH_BELOW:  return "Touch from Below";
      case LINE_STATE_TOUCH_ABOVE:  return "Touch from Above";
      case LINE_STATE_EQUALS     :  return "Equals";
      default                    :  return "Unknown";
     }
  }
Ao usar o painel de informações, os dados são exibidos no painel por meio de uma função:
//+------------------------------------------------------------------+
//| Display data from the specified timeseries index to the panel    |
//+------------------------------------------------------------------+
void DrawData(const int index,const datetime time)
  {
//--- Declare the variables to receive data in them
   MqlTick  tick={0};
   MqlRates rates[1];

//--- Exit if unable to get the current prices
   if(!SymbolInfoTick(Symbol(),tick))
      return;
//--- Exit if unable to get the bar data by the specified index
   if(CopyRates(Symbol(),PERIOD_CURRENT,index,1,rates)!=1)
      return;

//--- Set font parameters for bar and indicator data headers
   int  size=0;
   uint flags=0;
   uint angle=0;
   string name=panel.FontParams(size,flags,angle);
   panel.SetFontParams(name,9,FW_BOLD);
   panel.DrawText("Bar data ["+(string)index+"]",3,panel.TableY1(0)-16,clrMaroon,panel.Width()-6);
   panel.DrawText("Indicator data ["+(string)index+"]",3,panel.TableY1(1)-16,clrGreen,panel.Width()-6);
//--- Set font parameters for bar and indicator data
   panel.SetFontParams(name,9);

//--- Display the data of the specified bar in table 0 on the panel
   panel.DrawText("Date",  panel.CellX(0,0,0)+2, panel.CellY(0,0,0)+2); panel.DrawText(TimeToString(  rates[0].time,TIME_DATE),     panel.CellX(0,0,1)+2, panel.CellY(0,0,1)+2,clrNONE,90);
   panel.DrawText("Time",  panel.CellX(0,1,0)+2, panel.CellY(0,1,0)+2); panel.DrawText(TimeToString(  rates[0].time,TIME_MINUTES),  panel.CellX(0,1,1)+2, panel.CellY(0,1,1)+2,clrNONE,90);
   panel.DrawText("Open",  panel.CellX(0,2,0)+2, panel.CellY(0,2,0)+2); panel.DrawText(DoubleToString(rates[0].open,Digits()),      panel.CellX(0,2,1)+2, panel.CellY(0,2,1)+2,clrNONE,90);
   panel.DrawText("High",  panel.CellX(0,3,0)+2, panel.CellY(0,3,0)+2); panel.DrawText(DoubleToString(rates[0].high,Digits()),      panel.CellX(0,3,1)+2, panel.CellY(0,3,1)+2,clrNONE,90);
   panel.DrawText("Low",   panel.CellX(0,4,0)+2, panel.CellY(0,4,0)+2); panel.DrawText(DoubleToString(rates[0].low,Digits()),       panel.CellX(0,4,1)+2, panel.CellY(0,4,1)+2,clrNONE,90);
   panel.DrawText("Close", panel.CellX(0,5,0)+2, panel.CellY(0,5,0)+2); panel.DrawText(DoubleToString(rates[0].close,Digits()),     panel.CellX(0,5,1)+2, panel.CellY(0,5,1)+2,clrNONE,90);

//--- Display the indicator data from the specified bar on the panel in table 1
   panel.DrawText(ind_title, panel.CellX(1,0,0)+2, panel.CellY(1,0,0)+2);
   double value=IndicatorValue(handle,index,0);
   string value_str=(value!=EMPTY_VALUE ? DoubleToString(value,ind_digits) : "");
   panel.DrawText(value_str,panel.CellX(1,0,1)+2,panel.CellY(1,0,1)+2,clrNONE,90);
//--- Display the indicator signal line data from the specified bar on the panel in table 1
   panel.DrawText("Signal", panel.CellX(1,1,0)+2, panel.CellY(1,1,0)+2);
   double signal=IndicatorValue(handle,index,1);
   string signal_str=(signal!=EMPTY_VALUE ? DoubleToString(signal,ind_digits) : "");
   panel.DrawText(signal_str,panel.CellX(1,1,1)+2,panel.CellY(1,1,1)+2,clrNONE,90);

//--- Display a description of the indicator line state relative to the signal line
   panel.DrawText("RVI vs Signal", panel.CellX(1,2,0)+2, panel.CellY(1,2,0)+2);
   ENUM_LINE_STATE state_signal=LineStateRelative(handle,index,0,signal,IndicatorValue(handle,index+1,1));
   string state_signal_str=(state_signal==LINE_STATE_ABOVE ? "RVI > Signal" : state_signal==LINE_STATE_UNDER ? "RVI < Signal" : LineStateDescription(state_signal));
//--- The label color changes depending on the value of the line relative to the level
   color clr=(state_signal==LINE_STATE_CROSS_UP ? clrBlue : state_signal==LINE_STATE_CROSS_DOWN ? clrRed : clrNONE);
   panel.DrawText(state_signal_str,panel.CellX(1,2,1)+2,panel.CellY(1,2,1)+2,clr,90);

//--- Redraw the chart to immediately display all changes on the panel
   ChartRedraw(ChartID());
  }
O painel mostra em cores os sinais do indicador - cruzamentos da linha do indicador com a linha de sinal.
Adicionalmente, no manipulador de eventos OnChartEvent() do EA, chama-se o manipulador de eventos do painel e processam-se eventos para recuperar o índice da barra sob o cursor:
//+------------------------------------------------------------------+
//| ChartEvent function                                              |
//+------------------------------------------------------------------+
void OnChartEvent(const int id,
                  const long &lparam,
                  const double &dparam,
                  const string &sparam)
  {
//--- Handling the panel
//--- Call the panel event handler
   panel.OnChartEvent(id,lparam,dparam,sparam);

//--- If the cursor moves or a click is made on the chart
   if(id==CHARTEVENT_MOUSE_MOVE || id==CHARTEVENT_CLICK)
     {
      //--- Declare the variables to record time and price coordinates in them
      datetime time=0;
      double price=0;
      int wnd=0;
      //--- If the cursor coordinates are converted to date and time
      if(ChartXYToTimePrice(ChartID(),(int)lparam,(int)dparam,wnd,time,price))
        {
         //--- write the bar index where the cursor is located to a global variable
         mouse_bar_index=iBarShift(Symbol(),PERIOD_CURRENT,time);
         //--- Display the bar data under the cursor on the panel
         DrawData(mouse_bar_index,time);
        }
     }

//--- If we received a custom event, display the appropriate message in the journal
   if(id>CHARTEVENT_CUSTOM)
     {
      //--- Here we can implement handling a click on the close button on the panel
      PrintFormat("%s: Event id=%ld, object id (lparam): %lu, event message (sparam): %s",__FUNCTION__,id,lparam,sparam);
     }
  }
Após compilar o EA e executá-lo no gráfico, podemos monitorar o estado da linha do indicador no painel:
O arquivo do EA "TestOscillatorRVI.mq5" pode ser encontrado nos arquivos anexados ao artigo.
Stochastic Oscillator
O indicador técnico Oscilador Estocástico (Stochastic Oscillator) compara o preço de fechamento atual com o intervalo de preços durante um período de tempo selecionado. O indicador é representado por duas linhas. A linha principal é chamada de %K. A segunda linha, %D, é uma média móvel da linha %K. Normalmente, %K é representada por uma linha sólida e %D por uma linha pontilhada. Existem três métodos mais comuns de interpretação do Oscilador Estocástico:
- Compre quando o oscilador (%K ou %D) cair abaixo de um nível específico (geralmente 20) e então subir acima dele. Venda quando o oscilador subir acima de um nível específico (geralmente 80) e então cair abaixo dele.
- Compre se a linha %K subir acima da linha %D. Venda se a linha %K cair abaixo da linha %D.
- Monitore as divergências. Por exemplo: os preços formam uma série de novos máximos, mas o Oscilador Estocástico não consegue subir acima de seus máximos anteriores.
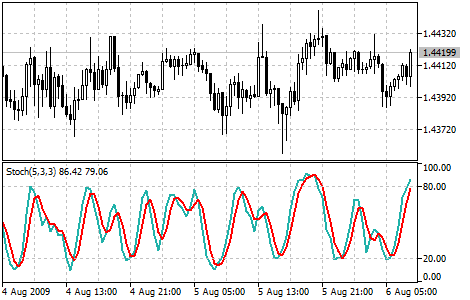
Parâmetros
O indicador tem cinco parâmetros ajustáveis:
- Período de cálculo da linha %K, valor padrão — 5,
- Período de cálculo da linha %D, valor padrão — 3,
- Período de desaceleração, valor padrão — 3,
- Preço de cálculo do estocástico, valor padrão — Low/High,
- Método de cálculo, valor padrão — SMA.
Além desses valores, nos parâmetros de entrada do EA, é necessário especificar os níveis de sobrecompra e sobrevenda.
Variáveis de entrada e globais para uso do indicador no EA:
//+------------------------------------------------------------------+
//|                                          TestOscillatorStoch.mq5 |
//|                                  Copyright 2023, MetaQuotes Ltd. |
//|                                             https://www.mql5.com |
//+------------------------------------------------------------------+
#property copyright "Copyright 2023, MetaQuotes Ltd."
#property link      "https://www.mql5.com"
#property version   "1.00"
//--- enums
enum ENUM_LINE_STATE
  {
   LINE_STATE_NONE,        // Undefined state
   LINE_STATE_UP,          // Upward
   LINE_STATE_DOWN,        // Downward
   LINE_STATE_TURN_UP,     // Upward reversal
   LINE_STATE_TURN_DOWN,   // Downward reversal
   LINE_STATE_STOP_UP,     // Upward stop
   LINE_STATE_STOP_DOWN,   // Downward stop
   LINE_STATE_ABOVE,       // Above value
   LINE_STATE_UNDER,       // Below value
   LINE_STATE_CROSS_UP,    // Crossing value upwards
   LINE_STATE_CROSS_DOWN,  // Crossing value downwards
   LINE_STATE_TOUCH_BELOW, // Touching value from below
   LINE_STATE_TOUCH_ABOVE, // Touch value from above
   LINE_STATE_EQUALS,      // Equal to value
  };
//--- input parameters
input uint           InpPeriodK  =  5;             /* Period %K   */
input uint           InpPeriodD  =  3;             /* Period %D   */
input uint           InpSlowing  =  3;             /* Slowing     */
input ENUM_STO_PRICE InpPrice    =  STO_LOWHIGH;   /* Price       */
input ENUM_MA_METHOD InpMethod   =  MODE_SMA;      /* Method      */
input double         InpOverbough=  80;            /* Overbough level*/
input double         InpOversold =  20;            /* Oversold level */
//--- global variables
int      handle=INVALID_HANDLE;  // Indicator handle
int      period_k=0;             // %K period
int      period_d=0;             // %D period
int      slowing=0;              // Slowing period
int      ind_digits=0;           // Number of decimal places in the indicator values
double   overbough=0;            // Overbought level
double   oversold=0;             // Oversold level
string   ind_title;              // Indicator description
Ao usar o painel de informações, inclui-se o arquivo da classe do painel e adicionam-se variáveis para trabalhar com ele:
//+------------------------------------------------------------------+
//|                                          TestOscillatorStoch.mq5 |
//|                                  Copyright 2023, MetaQuotes Ltd. |
//|                                             https://www.mql5.com |
//+------------------------------------------------------------------+
#property copyright "Copyright 2023, MetaQuotes Ltd."
#property link      "https://www.mql5.com"
#property version   "1.00"
//--- includes
#include <Dashboard\Dashboard.mqh>
//--- enums
enum ENUM_LINE_STATE
  {
   LINE_STATE_NONE,        // Undefined state
   LINE_STATE_UP,          // Upward
   LINE_STATE_DOWN,        // Downward
   LINE_STATE_TURN_UP,     // Upward reversal
   LINE_STATE_TURN_DOWN,   // Downward reversal
   LINE_STATE_STOP_UP,     // Upward stop
   LINE_STATE_STOP_DOWN,   // Downward stop
   LINE_STATE_ABOVE,       // Above value
   LINE_STATE_UNDER,       // Below value
   LINE_STATE_CROSS_UP,    // Crossing value upwards
   LINE_STATE_CROSS_DOWN,  // Crossing value downwards
   LINE_STATE_TOUCH_BELOW, // Touching value from below
   LINE_STATE_TOUCH_ABOVE, // Touch value from above
   LINE_STATE_EQUALS,      // Equal to value
  };
//--- input parameters
input uint           InpPeriodK  =  5;             /* Period %K   */
input uint           InpPeriodD  =  3;             /* Period %D   */
input uint           InpSlowing  =  3;             /* Slowing     */
input ENUM_STO_PRICE InpPrice    =  STO_LOWHIGH;   /* Price       */
input ENUM_MA_METHOD InpMethod   =  MODE_SMA;      /* Method      */
input double         InpOverbough=  80;            /* Overbough level*/
input double         InpOversold =  20;            /* Oversold level */
//--- global variables
int      handle=INVALID_HANDLE;  // Indicator handle
int      period_k=0;             // %K period
int      period_d=0;             // %D period
int      slowing=0;              // Slowing period
int      ind_digits=0;           // Number of decimal places in the indicator values
double   overbough=0;            // Overbought level
double   oversold=0;             // Oversold level
string   ind_title;              // Indicator description
//--- variables for the panel
int      mouse_bar_index;        // Index of the bar the data is taken from
CDashboard *panel=NULL;          // Pointer to the panel object
Inicialização
Manipulador OnInit() para inicializar os parâmetros do indicador e criar seu handle:
//+------------------------------------------------------------------+
//| Expert initialization function                                   |
//+------------------------------------------------------------------+
int OnInit()
  {
//--- create timer
   EventSetTimer(60);

//--- Indicator
//--- Set and adjust the calculation period if necessary
   period_k=int(InpPeriodK<1 ? 5 : InpPeriodK);
   period_d=int(InpPeriodD<1 ? 3 : InpPeriodD);
   slowing =int(InpSlowing<1 ? 3 : InpSlowing);
   overbough=InpOverbough;
   oversold=(InpOversold>=overbough ? overbough-0.01 : InpOversold);
//--- Set the indicator name and the number of decimal places
   ind_title=StringFormat("Stoch(%lu,%lu,%lu)",period_k,period_d,slowing);
   ind_digits=2;
//--- Create indicator handle
   ResetLastError();
   handle=iStochastic(Symbol(),PERIOD_CURRENT,period_k,period_d,slowing,InpMethod,InpPrice);
   if(handle==INVALID_HANDLE)
     {
      PrintFormat("%s: Failed to create indicator handle %s. Error %ld",__FUNCTION__,ind_title,GetLastError());
      return INIT_FAILED;
     }

//--- Successful initialization
   return(INIT_SUCCEEDED);
  }
Ao usar o painel de informações, cria-se o painel:
//+------------------------------------------------------------------+
//| Expert initialization function                                   |
//+------------------------------------------------------------------+
int OnInit()
  {
//--- create timer
   EventSetTimer(60);

//--- Indicator
//--- Set and adjust the calculation period if necessary
   period_k=int(InpPeriodK<1 ? 5 : InpPeriodK);
   period_d=int(InpPeriodD<1 ? 3 : InpPeriodD);
   slowing =int(InpSlowing<1 ? 3 : InpSlowing);
   overbough=InpOverbough;
   oversold=(InpOversold>=overbough ? overbough-0.01 : InpOversold);
//--- Set the indicator name and the number of decimal places
   ind_title=StringFormat("Stoch(%lu,%lu,%lu)",period_k,period_d,slowing);
   ind_digits=2;
//--- Create indicator handle
   ResetLastError();
   handle=iStochastic(Symbol(),PERIOD_CURRENT,period_k,period_d,slowing,InpMethod,InpPrice);
   if(handle==INVALID_HANDLE)
     {
      PrintFormat("%s: Failed to create indicator handle %s. Error %ld",__FUNCTION__,ind_title,GetLastError());
      return INIT_FAILED;
     }

//--- Dashboard
//--- Create the panel
   panel=new CDashboard(1,20,20,229,261);
   if(panel==NULL)
     {
      Print("Error. Failed to create panel object");
      return INIT_FAILED;
     }
//--- Set font parameters
   panel.SetFontParams("Calibri",9);
//--- Display the panel with the "Symbol, Timeframe description" header text
   panel.View(Symbol()+", "+StringSubstr(EnumToString(Period()),7));
//--- Create a table with ID 0 to display bar data in it
   panel.CreateNewTable(0);
//--- Draw a table with ID 0 on the panel background
   panel.DrawGrid(0,2,20,6,2,18,112);

//--- Create a table with ID 1 to display indicator data in it
   panel.CreateNewTable(1);
//--- Get the Y2 table coordinate with ID 0 and
//--- set the Y1 coordinate for the table with ID 1
   int y1=panel.TableY2(0)+22;
//--- Draw a table with ID 1 on the panel background
   panel.DrawGrid(1,2,y1,5,2,18,112);

//--- Display tabular data in the journal
   panel.GridPrint(0,2);
   panel.GridPrint(1,2);
//--- Initialize the variable with the index of the mouse cursor bar
   mouse_bar_index=0;
//--- Display the data of the current bar on the panel
   DrawData(mouse_bar_index,TimeCurrent());

//--- Successful initialization
   return(INIT_SUCCEEDED);
  }
Desinicialização
No manipulador OnDeinit() do EA, libera-se o handle do indicador:
//+------------------------------------------------------------------+
//| Expert deinitialization function                                 |
//+------------------------------------------------------------------+
void OnDeinit(const int reason)
  {
//--- destroy timer
   EventKillTimer();

//--- Release handle of the indicator
   ResetLastError();
   if(!IndicatorRelease(handle))
      PrintFormat("%s: IndicatorRelease failed. Error %ld",__FUNCTION__,GetLastError());
//--- Clear all comments on the chart
   Comment("");
  }
Ao usar o painel de informações, remove-se o objeto do painel criado:
//+------------------------------------------------------------------+
//| Expert deinitialization function                                 |
//+------------------------------------------------------------------+
void OnDeinit(const int reason)
  {
//--- destroy timer
   EventKillTimer();

//--- Release handle of the indicator
   ResetLastError();
   if(!IndicatorRelease(handle))
      PrintFormat("%s: IndicatorRelease failed. Error %ld",__FUNCTION__,GetLastError());
//--- Clear all comments on the chart
   Comment("");

//--- If the panel object exists, delete it
   if(panel!=NULL)
      delete panel;
  }
Recuperação de dados
Funções comuns para recuperar dados através do handle do indicador:
//+------------------------------------------------------------------+
//| Return the indicator data on the specified bar                   |
//+------------------------------------------------------------------+
double IndicatorValue(const int ind_handle,const int index,const int buffer_num)
  {
   double array[1]={0};
   ResetLastError();
   if(CopyBuffer(ind_handle,buffer_num,index,1,array)!=1)
     {
      PrintFormat("%s: CopyBuffer failed. Error %ld",__FUNCTION__,GetLastError());
      return EMPTY_VALUE;
     }
   return array[0];
  }
//+------------------------------------------------------------------+
//| Return the state of the indicator line                           |
//+------------------------------------------------------------------+
ENUM_LINE_STATE LineState(const int ind_handle,const int index,const int buffer_num)
  {
//--- Get the values of the indicator line with the shift (0,1,2) relative to the passed index
   const double value0=IndicatorValue(ind_handle,index,  buffer_num);
   const double value1=IndicatorValue(ind_handle,index+1,buffer_num);
   const double value2=IndicatorValue(ind_handle,index+2,buffer_num);
//--- If at least one of the values could not be obtained, return an undefined value
   if(value0==EMPTY_VALUE || value1==EMPTY_VALUE || value2==EMPTY_VALUE)
      return LINE_STATE_NONE;
//--- Line upward reversal (value2>value1 && value0>value1)
   if(NormalizeDouble(value2-value1,ind_digits)>0 && NormalizeDouble(value0-value1,ind_digits)>0)
      return LINE_STATE_TURN_UP;
//--- Line upward direction (value2<=value1 && value0>value1)
   else if(NormalizeDouble(value2-value1,ind_digits)<=0 && NormalizeDouble(value0-value1,ind_digits)>0)
      return LINE_STATE_UP;
//--- Line upward stop (value2<=value1 && value0==value1)
   else if(NormalizeDouble(value2-value1,ind_digits)<=0 && NormalizeDouble(value0-value1,ind_digits)==0)
      return LINE_STATE_STOP_UP;
//--- Line downward reversal (value2<value1 && value0<value1)
   if(NormalizeDouble(value2-value1,ind_digits)<0 && NormalizeDouble(value0-value1,ind_digits)<0)
      return LINE_STATE_TURN_DOWN;
//--- Line downward direction (value2>=value1 && value0<value1)
   else if(NormalizeDouble(value2-value1,ind_digits)>=0 && NormalizeDouble(value0-value1,ind_digits)<0)
      return LINE_STATE_DOWN;
//--- Line downward stop (value2>=value1 && value0==value1)
   else if(NormalizeDouble(value2-value1,ind_digits)>=0 && NormalizeDouble(value0-value1,ind_digits)==0)
      return LINE_STATE_STOP_DOWN;
//--- Undefined state
   return LINE_STATE_NONE;
  }
//+------------------------------------------------------------------+
//| Return the state of the line relative to the specified level     |
//+------------------------------------------------------------------+
ENUM_LINE_STATE LineStateRelative(const int ind_handle,const int index,const int buffer_num,const double level0,const double level1=EMPTY_VALUE)
  {
//--- Get the values of the indicator line with the shift (0,1) relative to the passed index
   const double value0=IndicatorValue(ind_handle,index,  buffer_num);
   const double value1=IndicatorValue(ind_handle,index+1,buffer_num);
//--- If at least one of the values could not be obtained, return an undefined value
   if(value0==EMPTY_VALUE || value1==EMPTY_VALUE)
      return LINE_STATE_NONE;
//--- Define the second level to compare
   double level=(level1==EMPTY_VALUE ? level0 : level1);
//--- The line is below the level (value1<level && value0<level0)
   if(NormalizeDouble(value1-level,ind_digits)<0 && NormalizeDouble(value0-level0,ind_digits)<0)
      return LINE_STATE_UNDER;
//--- The line is above the level (value1>level && value0>level0)
   if(NormalizeDouble(value1-level,ind_digits)>0 && NormalizeDouble(value0-level0,ind_digits)>0)
      return LINE_STATE_ABOVE;
//--- The line crossed the level upwards (value1<=level && value0>level0)
   if(NormalizeDouble(value1-level,ind_digits)<=0 && NormalizeDouble(value0-level0,ind_digits)>0)
      return LINE_STATE_CROSS_UP;
//--- The line crossed the level downwards (value1>=level && value0<level0)
   if(NormalizeDouble(value1-level,ind_digits)>=0 && NormalizeDouble(value0-level0,ind_digits)<0)
      return LINE_STATE_CROSS_DOWN;
//--- The line touched the level from below (value1<level0 && value0==level0)
   if(NormalizeDouble(value1-level,ind_digits)<0 && NormalizeDouble(value0-level0,ind_digits)==0)
      return LINE_STATE_TOUCH_BELOW;
//--- The line touched the level from above (value1>level0 && value0==level0)
   if(NormalizeDouble(value1-level,ind_digits)>0 && NormalizeDouble(value0-level0,ind_digits)==0)
      return LINE_STATE_TOUCH_BELOW;
//--- Line is equal to the level value (value1==level0 && value0==level0)
   if(NormalizeDouble(value1-level,ind_digits)==0 && NormalizeDouble(value0-level0,ind_digits)==0)
      return LINE_STATE_EQUALS;
//--- Undefined state
   return LINE_STATE_NONE;
  }
//+------------------------------------------------------------------+
//| Return the indicator line state description                      |
//+------------------------------------------------------------------+
string LineStateDescription(const ENUM_LINE_STATE state)
  {
   switch(state)
     {
      case LINE_STATE_UP         :  return "Up";
      case LINE_STATE_STOP_UP    :  return "Stop Up";
      case LINE_STATE_TURN_UP    :  return "Turn Up";
      case LINE_STATE_DOWN       :  return "Down";
      case LINE_STATE_STOP_DOWN  :  return "Stop Down";
      case LINE_STATE_TURN_DOWN  :  return "Turn Down";
      case LINE_STATE_ABOVE      :  return "Above level";
      case LINE_STATE_UNDER      :  return "Under level";
      case LINE_STATE_CROSS_UP   :  return "Crossing Up";
      case LINE_STATE_CROSS_DOWN :  return "Crossing Down";
      case LINE_STATE_TOUCH_BELOW:  return "Touch from Below";
      case LINE_STATE_TOUCH_ABOVE:  return "Touch from Above";
      case LINE_STATE_EQUALS     :  return "Equals";
      default                    :  return "Unknown";
     }
  }
Ao usar o painel de informações, os dados são exibidos no painel por meio de uma função:
//+------------------------------------------------------------------+
//| Display data from the specified timeseries index to the panel    |
//+------------------------------------------------------------------+
void DrawData(const int index,const datetime time)
  {
//--- Declare the variables to receive data in them
   MqlTick  tick={0};
   MqlRates rates[1];

//--- Exit if unable to get the current prices
   if(!SymbolInfoTick(Symbol(),tick))
      return;
//--- Exit if unable to get the bar data by the specified index
   if(CopyRates(Symbol(),PERIOD_CURRENT,index,1,rates)!=1)
      return;

//--- Set font parameters for bar and indicator data headers
   int  size=0;
   uint flags=0;
   uint angle=0;
   string name=panel.FontParams(size,flags,angle);
   panel.SetFontParams(name,9,FW_BOLD);
   panel.DrawText("Bar data ["+(string)index+"]",3,panel.TableY1(0)-16,clrMaroon,panel.Width()-6);
   panel.DrawText("Indicator data ["+(string)index+"]",3,panel.TableY1(1)-16,clrGreen,panel.Width()-6);
//--- Set font parameters for bar and indicator data
   panel.SetFontParams(name,9);

//--- Display the data of the specified bar in table 0 on the panel
   panel.DrawText("Date",  panel.CellX(0,0,0)+2, panel.CellY(0,0,0)+2); panel.DrawText(TimeToString(  rates[0].time,TIME_DATE),     panel.CellX(0,0,1)+2, panel.CellY(0,0,1)+2,clrNONE,90);
   panel.DrawText("Time",  panel.CellX(0,1,0)+2, panel.CellY(0,1,0)+2); panel.DrawText(TimeToString(  rates[0].time,TIME_MINUTES),  panel.CellX(0,1,1)+2, panel.CellY(0,1,1)+2,clrNONE,90);
   panel.DrawText("Open",  panel.CellX(0,2,0)+2, panel.CellY(0,2,0)+2); panel.DrawText(DoubleToString(rates[0].open,Digits()),      panel.CellX(0,2,1)+2, panel.CellY(0,2,1)+2,clrNONE,90);
   panel.DrawText("High",  panel.CellX(0,3,0)+2, panel.CellY(0,3,0)+2); panel.DrawText(DoubleToString(rates[0].high,Digits()),      panel.CellX(0,3,1)+2, panel.CellY(0,3,1)+2,clrNONE,90);
   panel.DrawText("Low",   panel.CellX(0,4,0)+2, panel.CellY(0,4,0)+2); panel.DrawText(DoubleToString(rates[0].low,Digits()),       panel.CellX(0,4,1)+2, panel.CellY(0,4,1)+2,clrNONE,90);
   panel.DrawText("Close", panel.CellX(0,5,0)+2, panel.CellY(0,5,0)+2); panel.DrawText(DoubleToString(rates[0].close,Digits()),     panel.CellX(0,5,1)+2, panel.CellY(0,5,1)+2,clrNONE,90);

//--- Display the indicator data from the specified bar on the panel in table 1
   panel.DrawText(ind_title, panel.CellX(1,0,0)+2, panel.CellY(1,0,0)+2);
   double value=IndicatorValue(handle,index,0);
   string value_str=(value!=EMPTY_VALUE ? DoubleToString(value,ind_digits) : "");
   panel.DrawText(value_str,panel.CellX(1,0,1)+2,panel.CellY(1,0,1)+2,clrNONE,100);
//--- Display the indicator signal line data from the specified bar on the panel in table 1
   panel.DrawText("Signal", panel.CellX(1,1,0)+2, panel.CellY(1,1,0)+2);
   double signal=IndicatorValue(handle,index,1);
   string signal_str=(signal!=EMPTY_VALUE ? DoubleToString(signal,ind_digits) : "");
   panel.DrawText(signal_str,panel.CellX(1,1,1)+2,panel.CellY(1,1,1)+2,clrNONE,100);

//--- Display a description of the indicator line state relative to the signal line
   panel.DrawText("Stoch vs Signal", panel.CellX(1,2,0)+2, panel.CellY(1,2,0)+2);
   ENUM_LINE_STATE state_signal=LineStateRelative(handle,index,0,signal,IndicatorValue(handle,index+1,1));
   string state_signal_str=(state_signal==LINE_STATE_ABOVE ? "Stoch > Signal" : state_signal==LINE_STATE_UNDER ? "Stoch < Signal" : LineStateDescription(state_signal));
//--- The label color changes depending on the value of the line relative to the level
   color clr=(state_signal==LINE_STATE_CROSS_UP ? clrBlue : state_signal==LINE_STATE_CROSS_DOWN ? clrRed : clrNONE);
   panel.DrawText(state_signal_str,panel.CellX(1,2,1)+2,panel.CellY(1,2,1)+2,clr,100);

//--- Display a description of the indicator line state relative to the overbought level
   string ovb=StringFormat("%+.2f",overbough);
   panel.DrawText("Overbough", panel.CellX(1,3,0)+2, panel.CellY(1,3,0)+2);
   panel.DrawText(ovb, panel.CellX(1,3,0)+66, panel.CellY(1,3,0)+2);
   ENUM_LINE_STATE state_ovb=LineStateRelative(handle,index,0,overbough);
//--- The label color changes depending on the value of the line relative to the level
   clr=(state_ovb==LINE_STATE_CROSS_DOWN ? clrRed : clrNONE);
   string ovb_str=(state_ovb==LINE_STATE_ABOVE ? "Inside the area" : LineStateDescription(state_ovb));
   panel.DrawText(ovb_str,panel.CellX(1,3,1)+2,panel.CellY(1,3,1)+2,clr,100);

//--- Display a description of the indicator line state relative to the oversold level
   panel.DrawText("Oversold", panel.CellX(1,4,0)+2, panel.CellY(1,4,0)+2);
   string ovs=StringFormat("%+.2f",oversold);
   panel.DrawText(ovs, panel.CellX(1,4,0)+68, panel.CellY(1,4,0)+2);
   ENUM_LINE_STATE state_ovs=LineStateRelative(handle,index,0,oversold);
//--- The label color changes depending on the value of the line relative to the level
   clr=(state_ovs==LINE_STATE_CROSS_UP ? clrBlue : clrNONE);
   string ovs_str=(state_ovs==LINE_STATE_UNDER ? "Inside the area" : LineStateDescription(state_ovs));
   panel.DrawText(ovs_str,panel.CellX(1,4,1)+2,panel.CellY(1,4,1)+2,clr,100);

//--- Redraw the chart to immediately display all changes on the panel
   ChartRedraw(ChartID());
  }
O painel mostra em cores a condição da linha estocástica, localização nas zonas de sobrecompra/sobrevenda e sinais do indicador.
Adicionalmente, no manipulador de eventos OnChartEvent() do EA, chama-se o manipulador de eventos do painel e processam-se eventos para recuperar o índice da barra sob o cursor:
//+------------------------------------------------------------------+
//| ChartEvent function                                              |
//+------------------------------------------------------------------+
void OnChartEvent(const int id,
                  const long &lparam,
                  const double &dparam,
                  const string &sparam)
  {
//--- Handling the panel
//--- Call the panel event handler
   panel.OnChartEvent(id,lparam,dparam,sparam);

//--- If the cursor moves or a click is made on the chart
   if(id==CHARTEVENT_MOUSE_MOVE || id==CHARTEVENT_CLICK)
     {
      //--- Declare the variables to record time and price coordinates in them
      datetime time=0;
      double price=0;
      int wnd=0;
      //--- If the cursor coordinates are converted to date and time
      if(ChartXYToTimePrice(ChartID(),(int)lparam,(int)dparam,wnd,time,price))
        {
         //--- write the bar index where the cursor is located to a global variable
         mouse_bar_index=iBarShift(Symbol(),PERIOD_CURRENT,time);
         //--- Display the bar data under the cursor on the panel
         DrawData(mouse_bar_index,time);
        }
     }

//--- If we received a custom event, display the appropriate message in the journal
   if(id>CHARTEVENT_CUSTOM)
     {
      //--- Here we can implement handling a click on the close button on the panel
      PrintFormat("%s: Event id=%ld, object id (lparam): %lu, event message (sparam): %s",__FUNCTION__,id,lparam,sparam);
     }
  }
Após compilar o EA e executá-lo no gráfico, podemos monitorar o estado da linha do indicador no painel:
O arquivo do EA "TestOscillatorStoch.mq5" pode ser encontrado nos arquivos anexados ao artigo.
Triple Exponential Average
O indicador técnico Média Tripla Exponencial (Triple Exponential Average, TRIX) foi desenvolvido por Jack Hutson como um oscilador de sobrecompra e sobrevenda. Ele também pode ser aplicado como um indicador de momentum. A tripla suavização serve para eliminar componentes cíclicos no movimento do preço com um período menor do que o período do indicador TRIX.
Como indicador de estado de sobrecompra ou sobrevenda, usa-se a zona (positiva e negativa, respectivamente). Como sinais de compra, usam-se o cruzamento da linha zero de baixo para cima ou divergência "bullish", e para venda – o cruzamento da linha zero de cima para baixo ou divergência "bearish" com os preços. Uma característica distintiva do indicador é a excelente filtragem de ruídos de preço e a ausência de atraso, característica da maioria das médias móveis.
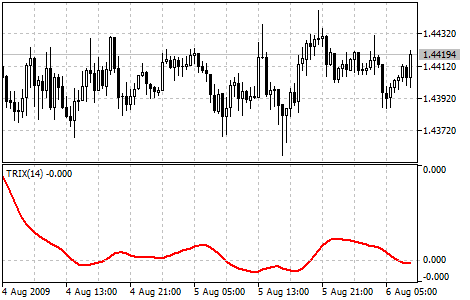
Parâmetros
O indicador tem dois parâmetros ajustáveis:
- Período de cálculo, por padrão — 14,
- Preço de cálculo, por padrão — Close.
Variáveis de entrada e globais para uso do indicador no EA:
//+------------------------------------------------------------------+
//|                                           TestOscillatorTRIX.mq5 |
//|                                  Copyright 2023, MetaQuotes Ltd. |
//|                                             https://www.mql5.com |
//+------------------------------------------------------------------+
#property copyright "Copyright 2023, MetaQuotes Ltd."
#property link      "https://www.mql5.com"
#property version   "1.00"
//--- enums
enum ENUM_LINE_STATE
  {
   LINE_STATE_NONE,        // Undefined state
   LINE_STATE_UP,          // Upward
   LINE_STATE_DOWN,        // Downward
   LINE_STATE_TURN_UP,     // Upward reversal
   LINE_STATE_TURN_DOWN,   // Downward reversal
   LINE_STATE_STOP_UP,     // Upward stop
   LINE_STATE_STOP_DOWN,   // Downward stop
   LINE_STATE_ABOVE,       // Above value
   LINE_STATE_UNDER,       // Below value
   LINE_STATE_CROSS_UP,    // Crossing value upwards
   LINE_STATE_CROSS_DOWN,  // Crossing value downwards
   LINE_STATE_TOUCH_BELOW, // Touching value from below
   LINE_STATE_TOUCH_ABOVE, // Touch value from above
   LINE_STATE_EQUALS,      // Equal to value
  };
//--- input parameters
input uint                 InpPeriod=  14;            /* Period         *///
input ENUM_APPLIED_PRICE   InpPrice =  PRICE_CLOSE;   /* Applied Price  */
//--- global variables
int      handle=INVALID_HANDLE;  // Indicator handle
int      period=0;               // TRIX calculation period
int      ind_digits=0;           // Number of decimal places in the indicator values
string   ind_title;              // Indicator description
Ao usar o painel de informações, inclui-se o arquivo da classe do painel e adicionam-se variáveis para trabalhar com ele:
//+------------------------------------------------------------------+
//|                                           TestOscillatorTRIX.mq5 |
//|                                  Copyright 2023, MetaQuotes Ltd. |
//|                                             https://www.mql5.com |
//+------------------------------------------------------------------+
#property copyright "Copyright 2023, MetaQuotes Ltd."
#property link      "https://www.mql5.com"
#property version   "1.00"
//--- includes
#include <Dashboard\Dashboard.mqh>
//--- enums
enum ENUM_LINE_STATE
  {
   LINE_STATE_NONE,        // Undefined state
   LINE_STATE_UP,          // Upward
   LINE_STATE_DOWN,        // Downward
   LINE_STATE_TURN_UP,     // Upward reversal
   LINE_STATE_TURN_DOWN,   // Downward reversal
   LINE_STATE_STOP_UP,     // Upward stop
   LINE_STATE_STOP_DOWN,   // Downward stop
   LINE_STATE_ABOVE,       // Above value
   LINE_STATE_UNDER,       // Below value
   LINE_STATE_CROSS_UP,    // Crossing value upwards
   LINE_STATE_CROSS_DOWN,  // Crossing value downwards
   LINE_STATE_TOUCH_BELOW, // Touching value from below
   LINE_STATE_TOUCH_ABOVE, // Touch value from above
   LINE_STATE_EQUALS,      // Equal to value
  };
//--- input parameters
input uint                 InpPeriod=  14;            /* Period         *///
input ENUM_APPLIED_PRICE   InpPrice =  PRICE_CLOSE;   /* Applied Price  */
//--- global variables
int      handle=INVALID_HANDLE;  // Indicator handle
int      period=0;               // TRIX calculation period
int      ind_digits=0;           // Number of decimal places in the indicator values
string   ind_title;              // Indicator description
//--- variables for the panel
int      mouse_bar_index;        // Index of the bar the data is taken from
CDashboard *panel=NULL;          // Pointer to the panel object
Inicialização
Manipulador OnInit() para inicializar os parâmetros do indicador e criar seu handle:
//+------------------------------------------------------------------+
//| Expert initialization function                                   |
//+------------------------------------------------------------------+
int OnInit()
  {
//--- create timer
   EventSetTimer(60);

//--- Indicator
//--- Set and adjust the calculation period if necessary
   period=int(InpPeriod<1 ? 14 : InpPeriod<2 ? 2 : InpPeriod);
//--- Set the indicator name and the number of decimal places
   ind_title=StringFormat("TRIX(%lu)",period);
   ind_digits=Digits();
//--- Create indicator handle
   ResetLastError();
   handle=iTriX(Symbol(),PERIOD_CURRENT,period,InpPrice);
   if(handle==INVALID_HANDLE)
     {
      PrintFormat("%s: Failed to create indicator handle %s. Error %ld",__FUNCTION__,ind_title,GetLastError());
      return INIT_FAILED;
     }

//--- Successful initialization
   return(INIT_SUCCEEDED);
  }
Ao usar o painel de informações, cria-se o painel:
//+------------------------------------------------------------------+
//| Expert initialization function                                   |
//+------------------------------------------------------------------+
int OnInit()
  {
//--- create timer
   EventSetTimer(60);

//--- Indicator
//--- Set and adjust the calculation period if necessary
   period=int(InpPeriod<1 ? 14 : InpPeriod<2 ? 2 : InpPeriod);
//--- Set the indicator name and the number of decimal places
   ind_title=StringFormat("TRIX(%lu)",period);
   ind_digits=Digits();
//--- Create indicator handle
   ResetLastError();
   handle=iTriX(Symbol(),PERIOD_CURRENT,period,InpPrice);
   if(handle==INVALID_HANDLE)
     {
      PrintFormat("%s: Failed to create indicator handle %s. Error %ld",__FUNCTION__,ind_title,GetLastError());
      return INIT_FAILED;
     }

//--- Dashboard
//--- Create the panel
   panel=new CDashboard(1,20,20,199,225);
   if(panel==NULL)
     {
      Print("Error. Failed to create panel object");
      return INIT_FAILED;
     }
//--- Set font parameters
   panel.SetFontParams("Calibri",9);
//--- Display the panel with the "Symbol, Timeframe description" header text
   panel.View(Symbol()+", "+StringSubstr(EnumToString(Period()),7));
//--- Create a table with ID 0 to display bar data in it
   panel.CreateNewTable(0);
//--- Draw a table with ID 0 on the panel background
   panel.DrawGrid(0,2,20,6,2,18,97);

//--- Create a table with ID 1 to display indicator data in it
   panel.CreateNewTable(1);
//--- Get the Y2 table coordinate with ID 0 and
//--- set the Y1 coordinate for the table with ID 1
   int y1=panel.TableY2(0)+22;
//--- Draw a table with ID 1 on the panel background
   panel.DrawGrid(1,2,y1,3,2,18,97);

//--- Display tabular data in the journal
   panel.GridPrint(0,2);
   panel.GridPrint(1,2);
//--- Initialize the variable with the index of the mouse cursor bar
   mouse_bar_index=0;
//--- Display the data of the current bar on the panel
   DrawData(mouse_bar_index,TimeCurrent());

//--- Successful initialization
   return(INIT_SUCCEEDED);
  }
Desinicialização
No manipulador OnDeinit() do EA, libera-se o handle do indicador:
//+------------------------------------------------------------------+
//| Expert deinitialization function                                 |
//+------------------------------------------------------------------+
void OnDeinit(const int reason)
  {
//--- destroy timer
   EventKillTimer();

//--- Release handle of the indicator
   ResetLastError();
   if(!IndicatorRelease(handle))
      PrintFormat("%s: IndicatorRelease failed. Error %ld",__FUNCTION__,GetLastError());
//--- Clear all comments on the chart
   Comment("");
  }
Ao usar o painel de informações, remove-se o objeto do painel criado:
//+------------------------------------------------------------------+
//| Expert deinitialization function                                 |
//+------------------------------------------------------------------+
void OnDeinit(const int reason)
  {
//--- destroy timer
   EventKillTimer();

//--- Release handle of the indicator
   ResetLastError();
   if(!IndicatorRelease(handle))
      PrintFormat("%s: IndicatorRelease failed. Error %ld",__FUNCTION__,GetLastError());
//--- Clear all comments on the chart
   Comment("");

//--- If the panel object exists, delete it
   if(panel!=NULL)
      delete panel;
  }
Recuperação de dados
Funções comuns para recuperar dados através do handle do indicador:
//+------------------------------------------------------------------+
//| Return the indicator data on the specified bar                   |
//+------------------------------------------------------------------+
double IndicatorValue(const int ind_handle,const int index,const int buffer_num)
  {
   double array[1]={0};
   ResetLastError();
   if(CopyBuffer(ind_handle,buffer_num,index,1,array)!=1)
     {
      PrintFormat("%s: CopyBuffer failed. Error %ld",__FUNCTION__,GetLastError());
      return EMPTY_VALUE;
     }
   return array[0];
  }
//+------------------------------------------------------------------+
//| Return the state of the indicator line                           |
//+------------------------------------------------------------------+
ENUM_LINE_STATE LineState(const int ind_handle,const int index,const int buffer_num)
  {
//--- Get the values of the indicator line with the shift (0,1,2) relative to the passed index
   const double value0=IndicatorValue(ind_handle,index,  buffer_num);
   const double value1=IndicatorValue(ind_handle,index+1,buffer_num);
   const double value2=IndicatorValue(ind_handle,index+2,buffer_num);
//--- If at least one of the values could not be obtained, return an undefined value
   if(value0==EMPTY_VALUE || value1==EMPTY_VALUE || value2==EMPTY_VALUE)
      return LINE_STATE_NONE;
//--- Line upward reversal (value2>value1 && value0>value1)
   if(NormalizeDouble(value2-value1,ind_digits)>0 && NormalizeDouble(value0-value1,ind_digits)>0)
      return LINE_STATE_TURN_UP;
//--- Line upward direction (value2<=value1 && value0>value1)
   else if(NormalizeDouble(value2-value1,ind_digits)<=0 && NormalizeDouble(value0-value1,ind_digits)>0)
      return LINE_STATE_UP;
//--- Line upward stop (value2<=value1 && value0==value1)
   else if(NormalizeDouble(value2-value1,ind_digits)<=0 && NormalizeDouble(value0-value1,ind_digits)==0)
      return LINE_STATE_STOP_UP;
//--- Line downward reversal (value2<value1 && value0<value1)
   if(NormalizeDouble(value2-value1,ind_digits)<0 && NormalizeDouble(value0-value1,ind_digits)<0)
      return LINE_STATE_TURN_DOWN;
//--- Line downward direction (value2>=value1 && value0<value1)
   else if(NormalizeDouble(value2-value1,ind_digits)>=0 && NormalizeDouble(value0-value1,ind_digits)<0)
      return LINE_STATE_DOWN;
//--- Line downward stop (value2>=value1 && value0==value1)
   else if(NormalizeDouble(value2-value1,ind_digits)>=0 && NormalizeDouble(value0-value1,ind_digits)==0)
      return LINE_STATE_STOP_DOWN;
//--- Undefined state
   return LINE_STATE_NONE;
  }
//+------------------------------------------------------------------+
//| Return the state of the line relative to the specified level     |
//+------------------------------------------------------------------+
ENUM_LINE_STATE LineStateRelative(const int ind_handle,const int index,const int buffer_num,const double level0,const double level1=EMPTY_VALUE)
  {
//--- Get the values of the indicator line with the shift (0,1) relative to the passed index
   const double value0=IndicatorValue(ind_handle,index,  buffer_num);
   const double value1=IndicatorValue(ind_handle,index+1,buffer_num);
//--- If at least one of the values could not be obtained, return an undefined value
   if(value0==EMPTY_VALUE || value1==EMPTY_VALUE)
      return LINE_STATE_NONE;
//--- Define the second level to compare
   double level=(level1==EMPTY_VALUE ? level0 : level1);
//--- The line is below the level (value1<level && value0<level0)
   if(NormalizeDouble(value1-level,ind_digits)<0 && NormalizeDouble(value0-level0,ind_digits)<0)
      return LINE_STATE_UNDER;
//--- The line is above the level (value1>level && value0>level0)
   if(NormalizeDouble(value1-level,ind_digits)>0 && NormalizeDouble(value0-level0,ind_digits)>0)
      return LINE_STATE_ABOVE;
//--- The line crossed the level upwards (value1<=level && value0>level0)
   if(NormalizeDouble(value1-level,ind_digits)<=0 && NormalizeDouble(value0-level0,ind_digits)>0)
      return LINE_STATE_CROSS_UP;
//--- The line crossed the level downwards (value1>=level && value0<level0)
   if(NormalizeDouble(value1-level,ind_digits)>=0 && NormalizeDouble(value0-level0,ind_digits)<0)
      return LINE_STATE_CROSS_DOWN;
//--- The line touched the level from below (value1<level0 && value0==level0)
   if(NormalizeDouble(value1-level,ind_digits)<0 && NormalizeDouble(value0-level0,ind_digits)==0)
      return LINE_STATE_TOUCH_BELOW;
//--- The line touched the level from above (value1>level0 && value0==level0)
   if(NormalizeDouble(value1-level,ind_digits)>0 && NormalizeDouble(value0-level0,ind_digits)==0)
      return LINE_STATE_TOUCH_BELOW;
//--- Line is equal to the level value (value1==level0 && value0==level0)
   if(NormalizeDouble(value1-level,ind_digits)==0 && NormalizeDouble(value0-level0,ind_digits)==0)
      return LINE_STATE_EQUALS;
//--- Undefined state
   return LINE_STATE_NONE;
  }
//+------------------------------------------------------------------+
//| Return the indicator line state description                      |
//+------------------------------------------------------------------+
string LineStateDescription(const ENUM_LINE_STATE state)
  {
   switch(state)
     {
      case LINE_STATE_UP         :  return "Up";
      case LINE_STATE_STOP_UP    :  return "Stop Up";
      case LINE_STATE_TURN_UP    :  return "Turn Up";
      case LINE_STATE_DOWN       :  return "Down";
      case LINE_STATE_STOP_DOWN  :  return "Stop Down";
      case LINE_STATE_TURN_DOWN  :  return "Turn Down";
      case LINE_STATE_ABOVE      :  return "Above level";
      case LINE_STATE_UNDER      :  return "Under level";
      case LINE_STATE_CROSS_UP   :  return "Crossing Up";
      case LINE_STATE_CROSS_DOWN :  return "Crossing Down";
      case LINE_STATE_TOUCH_BELOW:  return "Touch from Below";
      case LINE_STATE_TOUCH_ABOVE:  return "Touch from Above";
      case LINE_STATE_EQUALS     :  return "Equals";
      default                    :  return "Unknown";
     }
  }
Ao usar o painel de informações, os dados são exibidos no painel por meio de uma função:
//+------------------------------------------------------------------+
//| Display data from the specified timeseries index to the panel    |
//+------------------------------------------------------------------+
void DrawData(const int index,const datetime time)
  {
//--- Declare the variables to receive data in them
   MqlTick  tick={0};
   MqlRates rates[1];

//--- Exit if unable to get the current prices
   if(!SymbolInfoTick(Symbol(),tick))
      return;
//--- Exit if unable to get the bar data by the specified index
   if(CopyRates(Symbol(),PERIOD_CURRENT,index,1,rates)!=1)
      return;

//--- Set font parameters for bar and indicator data headers
   int  size=0;
   uint flags=0;
   uint angle=0;
   string name=panel.FontParams(size,flags,angle);
   panel.SetFontParams(name,9,FW_BOLD);
   panel.DrawText("Bar data ["+(string)index+"]",3,panel.TableY1(0)-16,clrMaroon,panel.Width()-6);
   panel.DrawText("Indicator data ["+(string)index+"]",3,panel.TableY1(1)-16,clrGreen,panel.Width()-6);
//--- Set font parameters for bar and indicator data
   panel.SetFontParams(name,9);

//--- Display the data of the specified bar in table 0 on the panel
   panel.DrawText("Date",  panel.CellX(0,0,0)+2, panel.CellY(0,0,0)+2); panel.DrawText(TimeToString(  rates[0].time,TIME_DATE),     panel.CellX(0,0,1)+2, panel.CellY(0,0,1)+2,clrNONE,90);
   panel.DrawText("Time",  panel.CellX(0,1,0)+2, panel.CellY(0,1,0)+2); panel.DrawText(TimeToString(  rates[0].time,TIME_MINUTES),  panel.CellX(0,1,1)+2, panel.CellY(0,1,1)+2,clrNONE,90);
   panel.DrawText("Open",  panel.CellX(0,2,0)+2, panel.CellY(0,2,0)+2); panel.DrawText(DoubleToString(rates[0].open,Digits()),      panel.CellX(0,2,1)+2, panel.CellY(0,2,1)+2,clrNONE,90);
   panel.DrawText("High",  panel.CellX(0,3,0)+2, panel.CellY(0,3,0)+2); panel.DrawText(DoubleToString(rates[0].high,Digits()),      panel.CellX(0,3,1)+2, panel.CellY(0,3,1)+2,clrNONE,90);
   panel.DrawText("Low",   panel.CellX(0,4,0)+2, panel.CellY(0,4,0)+2); panel.DrawText(DoubleToString(rates[0].low,Digits()),       panel.CellX(0,4,1)+2, panel.CellY(0,4,1)+2,clrNONE,90);
   panel.DrawText("Close", panel.CellX(0,5,0)+2, panel.CellY(0,5,0)+2); panel.DrawText(DoubleToString(rates[0].close,Digits()),     panel.CellX(0,5,1)+2, panel.CellY(0,5,1)+2,clrNONE,90);

//--- Display the indicator data from the specified bar on the panel in table 1
   panel.DrawText(ind_title, panel.CellX(1,0,0)+2, panel.CellY(1,0,0)+2);
   double value=IndicatorValue(handle,index,0);
   string value_str=(value!=EMPTY_VALUE ? DoubleToString(value,ind_digits) : "");
   panel.DrawText(value_str,panel.CellX(1,0,1)+2,panel.CellY(1,0,1)+2,clrNONE,90);

//--- Display a description of the indicator line state
   panel.DrawText("Line state", panel.CellX(1,1,0)+2, panel.CellY(1,1,0)+2);
   ENUM_LINE_STATE state=LineState(handle,index,0);
//--- The label color changes depending on the value of the line above/below zero
   color clr=(value<0 ? clrRed : value>0 ? clrBlue : clrNONE);
   panel.DrawText(LineStateDescription(state),panel.CellX(1,1,1)+2,panel.CellY(1,1,1)+2,clr,90);

//--- Display a description of the indicator line state relative to zero
   panel.DrawText("TRIX vs Zero", panel.CellX(1,2,0)+2, panel.CellY(1,2,0)+2);
   ENUM_LINE_STATE state_zero=LineStateRelative(handle,index,0,0);
   string state_zero_str=
     (
      state_zero==LINE_STATE_ABOVE        ?  "TRIX > 0"  :
      state_zero==LINE_STATE_UNDER        ?  "TRIX < 0"  :
      state_zero==LINE_STATE_TOUCH_ABOVE  ||
      state_zero==LINE_STATE_TOUCH_BELOW  ?  "Touch"     :
      LineStateDescription(state_zero)
     );
//--- The label color changes depending on the value of the line relative to the level
   clr=(state_zero==LINE_STATE_CROSS_UP ? clrBlue : state_zero==LINE_STATE_CROSS_DOWN ? clrRed : clrNONE);
   panel.DrawText(state_zero_str,panel.CellX(1,2,1)+2,panel.CellY(1,2,1)+2,clr,90);

//--- Redraw the chart to immediately display all changes on the panel
   ChartRedraw(ChartID());
  }
O painel mostra em cores os estados da linha e sua relação com o zero.
Adicionalmente, no manipulador de eventos OnChartEvent() do EA, chama-se o manipulador de eventos do painel e processam-se eventos para recuperar o índice da barra sob o cursor:
//+------------------------------------------------------------------+
//| ChartEvent function                                              |
//+------------------------------------------------------------------+
void OnChartEvent(const int id,
                  const long &lparam,
                  const double &dparam,
                  const string &sparam)
  {
//--- Handling the panel
//--- Call the panel event handler
   panel.OnChartEvent(id,lparam,dparam,sparam);

//--- If the cursor moves or a click is made on the chart
   if(id==CHARTEVENT_MOUSE_MOVE || id==CHARTEVENT_CLICK)
     {
      //--- Declare the variables to record time and price coordinates in them
      datetime time=0;
      double price=0;
      int wnd=0;
      //--- If the cursor coordinates are converted to date and time
      if(ChartXYToTimePrice(ChartID(),(int)lparam,(int)dparam,wnd,time,price))
        {
         //--- write the bar index where the cursor is located to a global variable
         mouse_bar_index=iBarShift(Symbol(),PERIOD_CURRENT,time);
         //--- Display the bar data under the cursor on the panel
         DrawData(mouse_bar_index,time);
        }
     }

//--- If we received a custom event, display the appropriate message in the journal
   if(id>CHARTEVENT_CUSTOM)
     {
      //--- Here we can implement handling a click on the close button on the panel
      PrintFormat("%s: Event id=%ld, object id (lparam): %lu, event message (sparam): %s",__FUNCTION__,id,lparam,sparam);
     }
  }
Após compilar o EA e executá-lo no gráfico, podemos monitorar o estado da linha do indicador no painel:
O arquivo do EA "TestOscillatorTRIX.mq5" pode ser encontrado nos arquivos anexados ao artigo.
Williams' Percent Range
O indicador técnico Faixa Percentual de Williams (Williams’ Percent Range, %R) é um indicador dinâmico que determina o estado de sobrecompra/sobrevenda. A Faixa Percentual de Williams é muito semelhante ao indicador técnico Oscilador Estocástico. A diferença entre eles está apenas no fato de que o primeiro tem uma escala invertida, enquanto o segundo é construído usando uma suavização interna.
Os valores do indicador no intervalo de -80% a -100% indicam um estado de sobrevenda. Os valores no intervalo de -0% a -20% indicam que o mercado está em sobrecompra. Para construir o indicador Faixa Percentual de Williams em uma escala invertida, seus valores são normalmente atribuídos com um sinal negativo (por exemplo, -30%). Na análise, o sinal negativo pode ser ignorado.
De acordo com a regra comum para todos os indicadores de sobrecompra/sobrevenda, é melhor agir de acordo com seus sinais, aguardando a virada dos preços na direção correspondente. Assim, se o indicador de sobrecompra/sobrevenda indica um estado de sobrecompra, seria prudente esperar a virada dos preços para baixo antes de vender o ativo.
O indicador Faixa Percentual de Williams tem a curiosa habilidade de antecipar misteriosamente as reversões de preços. Quase sempre forma um pico e vira para baixo algum tempo antes de o preço atingir o pico e virar para baixo. Da mesma forma, a Faixa Percentual de Williams geralmente forma um vale e vira para cima antecipadamente.
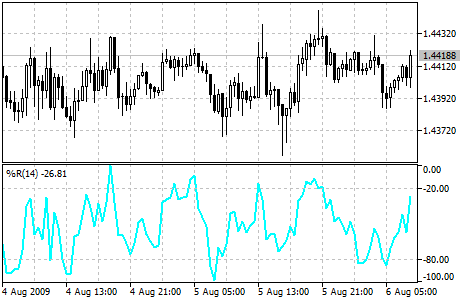
Parâmetros
O indicador tem um parâmetro ajustável, nomeadamente o período de cálculo. O valor padrão é 14.
Como a determinação dos sinais do indicador requer a consideração da posição da linha nas áreas de sobrecompra/sobrevenda, os valores dos níveis devem ser adicionados aos parâmetros de entrada do EA.
Variáveis de entrada e globais para uso do indicador no EA:
//+------------------------------------------------------------------+
//|                                            TestOscillatorWPR.mq5 |
//|                                  Copyright 2023, MetaQuotes Ltd. |
//|                                             https://www.mql5.com |
//+------------------------------------------------------------------+
#property copyright "Copyright 2023, MetaQuotes Ltd."
#property link      "https://www.mql5.com"
#property version   "1.00"
//--- enums
enum ENUM_LINE_STATE
  {
   LINE_STATE_NONE,        // Undefined state
   LINE_STATE_UP,          // Upward
   LINE_STATE_DOWN,        // Downward
   LINE_STATE_TURN_UP,     // Upward reversal
   LINE_STATE_TURN_DOWN,   // Downward reversal
   LINE_STATE_STOP_UP,     // Upward stop
   LINE_STATE_STOP_DOWN,   // Downward stop
   LINE_STATE_ABOVE,       // Above value
   LINE_STATE_UNDER,       // Below value
   LINE_STATE_CROSS_UP,    // Crossing value upwards
   LINE_STATE_CROSS_DOWN,  // Crossing value downwards
   LINE_STATE_TOUCH_BELOW, // Touching value from below
   LINE_STATE_TOUCH_ABOVE, // Touch value from above
   LINE_STATE_EQUALS,      // Equal to value
  };
//--- input parameters
input uint  InpPeriod   =  14;                     /* Period   */
input double               InpOverbough= -20.0;    /* Overbough level*/
input double               InpOversold = -80.0;    /* Oversold level */
//--- global variables
int      handle=INVALID_HANDLE;  // Indicator handle
int      period=0;               // TRIX calculation period
int      ind_digits=0;           // Number of decimal places in the indicator values
double   overbough=0;            // Overbought level
double   oversold=0;             // Oversold level
string   ind_title;              // Indicator description
Ao usar o painel de informações, inclui-se o arquivo da classe do painel e adicionam-se variáveis para trabalhar com ele:
//+------------------------------------------------------------------+
//|                                            TestOscillatorWPR.mq5 |
//|                                  Copyright 2023, MetaQuotes Ltd. |
//|                                             https://www.mql5.com |
//+------------------------------------------------------------------+
#property copyright "Copyright 2023, MetaQuotes Ltd."
#property link      "https://www.mql5.com"
#property version   "1.00"
//--- includes
#include <Dashboard\Dashboard.mqh>
//--- enums
enum ENUM_LINE_STATE
  {
   LINE_STATE_NONE,        // Undefined state
   LINE_STATE_UP,          // Upward
   LINE_STATE_DOWN,        // Downward
   LINE_STATE_TURN_UP,     // Upward reversal
   LINE_STATE_TURN_DOWN,   // Downward reversal
   LINE_STATE_STOP_UP,     // Upward stop
   LINE_STATE_STOP_DOWN,   // Downward stop
   LINE_STATE_ABOVE,       // Above value
   LINE_STATE_UNDER,       // Below value
   LINE_STATE_CROSS_UP,    // Crossing value upwards
   LINE_STATE_CROSS_DOWN,  // Crossing value downwards
   LINE_STATE_TOUCH_BELOW, // Touching value from below
   LINE_STATE_TOUCH_ABOVE, // Touch value from above
   LINE_STATE_EQUALS,      // Equal to value
  };
//--- input parameters
input uint  InpPeriod   =  14;                     /* Period   */
input double               InpOverbough= -20.0;    /* Overbough level*/
input double               InpOversold = -80.0;    /* Oversold level */
//--- global variables
int      handle=INVALID_HANDLE;  // Indicator handle
int      period=0;               // TRIX calculation period
int      ind_digits=0;           // Number of decimal places in the indicator values
double   overbough=0;            // Overbought level
double   oversold=0;             // Oversold level
string   ind_title;              // Indicator description
//--- variables for the panel
int      mouse_bar_index;        // Index of the bar the data is taken from
CDashboard *panel=NULL;          // Pointer to the panel object
Inicialização
Manipulador OnInit() para inicializar os parâmetros do indicador e criar seu handle:
//+------------------------------------------------------------------+
//| Expert initialization function                                   |
//+------------------------------------------------------------------+
int OnInit()
  {
//--- create timer
   EventSetTimer(60);

//--- Indicator
//--- Set and adjust the calculation period and levels if necessary
   period=int(InpPeriod<1 ? 14 : InpPeriod);
   overbough=InpOverbough;
   oversold=(InpOversold>=overbough ? overbough-0.01 : InpOversold);
//--- Set the indicator name and the number of decimal places
   ind_title=StringFormat("%%R(%lu)",period);
   ind_digits=2;
//--- Create indicator handle
   ResetLastError();
   handle=iWPR(Symbol(),PERIOD_CURRENT,period);
   if(handle==INVALID_HANDLE)
     {
      PrintFormat("%s: Failed to create indicator handle %s. Error %ld",__FUNCTION__,ind_title,GetLastError());
      return INIT_FAILED;
     }

//--- Successful initialization
   return(INIT_SUCCEEDED);
  }
Ao usar o painel de informações, cria-se o painel:
//+------------------------------------------------------------------+
//| Expert initialization function                                   |
//+------------------------------------------------------------------+
int OnInit()
  {
//--- create timer
   EventSetTimer(60);

//--- Indicator
//--- Set and adjust the calculation period and levels if necessary
   period=int(InpPeriod<1 ? 14 : InpPeriod);
   overbough=InpOverbough;
   oversold=(InpOversold>=overbough ? overbough-0.01 : InpOversold);
//--- Set the indicator name and the number of decimal places
   ind_title=StringFormat("%%R(%lu)",period);
   ind_digits=2;
//--- Create indicator handle
   ResetLastError();
   handle=iWPR(Symbol(),PERIOD_CURRENT,period);
   if(handle==INVALID_HANDLE)
     {
      PrintFormat("%s: Failed to create indicator handle %s. Error %ld",__FUNCTION__,ind_title,GetLastError());
      return INIT_FAILED;
     }

//--- Dashboard
//--- Create the panel
   panel=new CDashboard(1,20,20,229,243);
   if(panel==NULL)
     {
      Print("Error. Failed to create panel object");
      return INIT_FAILED;
     }
//--- Set font parameters
   panel.SetFontParams("Calibri",9);
//--- Display the panel with the "Symbol, Timeframe description" header text
   panel.View(Symbol()+", "+StringSubstr(EnumToString(Period()),7));
//--- Create a table with ID 0 to display bar data in it
   panel.CreateNewTable(0);
//--- Draw a table with ID 0 on the panel background
   panel.DrawGrid(0,2,20,6,2,18,112);

//--- Create a table with ID 1 to display indicator data in it
   panel.CreateNewTable(1);
//--- Get the Y2 table coordinate with ID 0 and
//--- set the Y1 coordinate for the table with ID 1
   int y1=panel.TableY2(0)+22;
//--- Draw a table with ID 1 on the panel background
   panel.DrawGrid(1,2,y1,4,2,18,112);

//--- Display tabular data in the journal
   panel.GridPrint(0,2);
   panel.GridPrint(1,2);
//--- Initialize the variable with the index of the mouse cursor bar
   mouse_bar_index=0;
//--- Display the data of the current bar on the panel
   DrawData(mouse_bar_index,TimeCurrent());

//--- Successful initialization
   return(INIT_SUCCEEDED);
  }
Desinicialização
No manipulador OnDeinit() do EA, libera-se o handle do indicador:
//+------------------------------------------------------------------+
//| Expert deinitialization function                                 |
//+------------------------------------------------------------------+
void OnDeinit(const int reason)
  {
//--- destroy timer
   EventKillTimer();

//--- Release handle of the indicator
   ResetLastError();
   if(!IndicatorRelease(handle))
      PrintFormat("%s: IndicatorRelease failed. Error %ld",__FUNCTION__,GetLastError());
//--- Clear all comments on the chart
   Comment("");
  }
Ao usar o painel de informações, remove-se o objeto do painel criado:
//+------------------------------------------------------------------+
//| Expert deinitialization function                                 |
//+------------------------------------------------------------------+
void OnDeinit(const int reason)
  {
//--- destroy timer
   EventKillTimer();

//--- Release handle of the indicator
   ResetLastError();
   if(!IndicatorRelease(handle))
      PrintFormat("%s: IndicatorRelease failed. Error %ld",__FUNCTION__,GetLastError());
//--- Clear all comments on the chart
   Comment("");

//--- If the panel object exists, delete it
   if(panel!=NULL)
      delete panel;
  }
Recuperação de dados
Funções comuns para recuperar dados através do handle do indicador:
//+------------------------------------------------------------------+
//| Return the indicator data on the specified bar                   |
//+------------------------------------------------------------------+
double IndicatorValue(const int ind_handle,const int index,const int buffer_num)
  {
   double array[1]={0};
   ResetLastError();
   if(CopyBuffer(ind_handle,buffer_num,index,1,array)!=1)
     {
      PrintFormat("%s: CopyBuffer failed. Error %ld",__FUNCTION__,GetLastError());
      return EMPTY_VALUE;
     }
   return array[0];
  }
//+------------------------------------------------------------------+
//| Return the state of the indicator line                           |
//+------------------------------------------------------------------+
ENUM_LINE_STATE LineState(const int ind_handle,const int index,const int buffer_num)
  {
//--- Get the values of the indicator line with the shift (0,1,2) relative to the passed index
   const double value0=IndicatorValue(ind_handle,index,  buffer_num);
   const double value1=IndicatorValue(ind_handle,index+1,buffer_num);
   const double value2=IndicatorValue(ind_handle,index+2,buffer_num);
//--- If at least one of the values could not be obtained, return an undefined value
   if(value0==EMPTY_VALUE || value1==EMPTY_VALUE || value2==EMPTY_VALUE)
      return LINE_STATE_NONE;
//--- Line upward reversal (value2>value1 && value0>value1)
   if(NormalizeDouble(value2-value1,ind_digits)>0 && NormalizeDouble(value0-value1,ind_digits)>0)
      return LINE_STATE_TURN_UP;
//--- Line upward direction (value2<=value1 && value0>value1)
   else if(NormalizeDouble(value2-value1,ind_digits)<=0 && NormalizeDouble(value0-value1,ind_digits)>0)
      return LINE_STATE_UP;
//--- Line upward stop (value2<=value1 && value0==value1)
   else if(NormalizeDouble(value2-value1,ind_digits)<=0 && NormalizeDouble(value0-value1,ind_digits)==0)
      return LINE_STATE_STOP_UP;
//--- Line downward reversal (value2<value1 && value0<value1)
   if(NormalizeDouble(value2-value1,ind_digits)<0 && NormalizeDouble(value0-value1,ind_digits)<0)
      return LINE_STATE_TURN_DOWN;
//--- Line downward direction (value2>=value1 && value0<value1)
   else if(NormalizeDouble(value2-value1,ind_digits)>=0 && NormalizeDouble(value0-value1,ind_digits)<0)
      return LINE_STATE_DOWN;
//--- Line downward stop (value2>=value1 && value0==value1)
   else if(NormalizeDouble(value2-value1,ind_digits)>=0 && NormalizeDouble(value0-value1,ind_digits)==0)
      return LINE_STATE_STOP_DOWN;
//--- Undefined state
   return LINE_STATE_NONE;
  }
//+------------------------------------------------------------------+
//| Return the state of the line relative to the specified level     |
//+------------------------------------------------------------------+
ENUM_LINE_STATE LineStateRelative(const int ind_handle,const int index,const int buffer_num,const double level0,const double level1=EMPTY_VALUE)
  {
//--- Get the values of the indicator line with the shift (0,1) relative to the passed index
   const double value0=IndicatorValue(ind_handle,index,  buffer_num);
   const double value1=IndicatorValue(ind_handle,index+1,buffer_num);
//--- If at least one of the values could not be obtained, return an undefined value
   if(value0==EMPTY_VALUE || value1==EMPTY_VALUE)
      return LINE_STATE_NONE;
//--- Define the second level to compare
   double level=(level1==EMPTY_VALUE ? level0 : level1);
//--- The line is below the level (value1<level && value0<level0)
   if(NormalizeDouble(value1-level,ind_digits)<0 && NormalizeDouble(value0-level0,ind_digits)<0)
      return LINE_STATE_UNDER;
//--- The line is above the level (value1>level && value0>level0)
   if(NormalizeDouble(value1-level,ind_digits)>0 && NormalizeDouble(value0-level0,ind_digits)>0)
      return LINE_STATE_ABOVE;
//--- The line crossed the level upwards (value1<=level && value0>level0)
   if(NormalizeDouble(value1-level,ind_digits)<=0 && NormalizeDouble(value0-level0,ind_digits)>0)
      return LINE_STATE_CROSS_UP;
//--- The line crossed the level downwards (value1>=level && value0<level0)
   if(NormalizeDouble(value1-level,ind_digits)>=0 && NormalizeDouble(value0-level0,ind_digits)<0)
      return LINE_STATE_CROSS_DOWN;
//--- The line touched the level from below (value1<level0 && value0==level0)
   if(NormalizeDouble(value1-level,ind_digits)<0 && NormalizeDouble(value0-level0,ind_digits)==0)
      return LINE_STATE_TOUCH_BELOW;
//--- The line touched the level from above (value1>level0 && value0==level0)
   if(NormalizeDouble(value1-level,ind_digits)>0 && NormalizeDouble(value0-level0,ind_digits)==0)
      return LINE_STATE_TOUCH_BELOW;
//--- Line is equal to the level value (value1==level0 && value0==level0)
   if(NormalizeDouble(value1-level,ind_digits)==0 && NormalizeDouble(value0-level0,ind_digits)==0)
      return LINE_STATE_EQUALS;
//--- Undefined state
   return LINE_STATE_NONE;
  }
//+------------------------------------------------------------------+
//| Return the indicator line state description                      |
//+------------------------------------------------------------------+
string LineStateDescription(const ENUM_LINE_STATE state)
  {
   switch(state)
     {
      case LINE_STATE_UP         :  return "Up";
      case LINE_STATE_STOP_UP    :  return "Stop Up";
      case LINE_STATE_TURN_UP    :  return "Turn Up";
      case LINE_STATE_DOWN       :  return "Down";
      case LINE_STATE_STOP_DOWN  :  return "Stop Down";
      case LINE_STATE_TURN_DOWN  :  return "Turn Down";
      case LINE_STATE_ABOVE      :  return "Above level";
      case LINE_STATE_UNDER      :  return "Under level";
      case LINE_STATE_CROSS_UP   :  return "Crossing Up";
      case LINE_STATE_CROSS_DOWN :  return "Crossing Down";
      case LINE_STATE_TOUCH_BELOW:  return "Touch from Below";
      case LINE_STATE_TOUCH_ABOVE:  return "Touch from Above";
      case LINE_STATE_EQUALS     :  return "Equals";
      default                    :  return "Unknown";
     }
  }
Ao usar o painel de informações, os dados são exibidos no painel por meio de uma função:
//+------------------------------------------------------------------+
//| Display data from the specified timeseries index to the panel    |
//+------------------------------------------------------------------+
void DrawData(const int index,const datetime time)
  {
//--- Declare the variables to receive data in them
   MqlTick  tick={0};
   MqlRates rates[1];

//--- Exit if unable to get the current prices
   if(!SymbolInfoTick(Symbol(),tick))
      return;
//--- Exit if unable to get the bar data by the specified index
   if(CopyRates(Symbol(),PERIOD_CURRENT,index,1,rates)!=1)
      return;

//--- Set font parameters for bar and indicator data headers
   int  size=0;
   uint flags=0;
   uint angle=0;
   string name=panel.FontParams(size,flags,angle);
   panel.SetFontParams(name,9,FW_BOLD);
   panel.DrawText("Bar data ["+(string)index+"]",3,panel.TableY1(0)-16,clrMaroon,panel.Width()-6);
   panel.DrawText("Indicator data ["+(string)index+"]",3,panel.TableY1(1)-16,clrGreen,panel.Width()-6);
//--- Set font parameters for bar and indicator data
   panel.SetFontParams(name,9);

//--- Display the data of the specified bar in table 0 on the panel
   panel.DrawText("Date",  panel.CellX(0,0,0)+2, panel.CellY(0,0,0)+2); panel.DrawText(TimeToString(  rates[0].time,TIME_DATE),     panel.CellX(0,0,1)+2, panel.CellY(0,0,1)+2,clrNONE,90);
   panel.DrawText("Time",  panel.CellX(0,1,0)+2, panel.CellY(0,1,0)+2); panel.DrawText(TimeToString(  rates[0].time,TIME_MINUTES),  panel.CellX(0,1,1)+2, panel.CellY(0,1,1)+2,clrNONE,90);
   panel.DrawText("Open",  panel.CellX(0,2,0)+2, panel.CellY(0,2,0)+2); panel.DrawText(DoubleToString(rates[0].open,Digits()),      panel.CellX(0,2,1)+2, panel.CellY(0,2,1)+2,clrNONE,90);
   panel.DrawText("High",  panel.CellX(0,3,0)+2, panel.CellY(0,3,0)+2); panel.DrawText(DoubleToString(rates[0].high,Digits()),      panel.CellX(0,3,1)+2, panel.CellY(0,3,1)+2,clrNONE,90);
   panel.DrawText("Low",   panel.CellX(0,4,0)+2, panel.CellY(0,4,0)+2); panel.DrawText(DoubleToString(rates[0].low,Digits()),       panel.CellX(0,4,1)+2, panel.CellY(0,4,1)+2,clrNONE,90);
   panel.DrawText("Close", panel.CellX(0,5,0)+2, panel.CellY(0,5,0)+2); panel.DrawText(DoubleToString(rates[0].close,Digits()),     panel.CellX(0,5,1)+2, panel.CellY(0,5,1)+2,clrNONE,90);

//--- Display the indicator data from the specified bar on the panel in table 1
   panel.DrawText(ind_title, panel.CellX(1,0,0)+2, panel.CellY(1,0,0)+2);
   double value=IndicatorValue(handle,index,0);
   string value_str=(value!=EMPTY_VALUE ? DoubleToString(value,ind_digits) : "");
   panel.DrawText(value_str,panel.CellX(1,0,1)+2,panel.CellY(1,0,1)+2,clrNONE,90);

//--- Get the state of the line and the states relative to the levels
   ENUM_LINE_STATE state=LineState(handle,index,0);
   ENUM_LINE_STATE state_ovb=LineStateRelative(handle,index,0,overbough);
   ENUM_LINE_STATE state_ovs=LineStateRelative(handle,index,0,oversold);

//--- Display a description of the indicator line state relative to the overbought level
   string ovb=StringFormat("%+.2f",overbough);
   panel.DrawText("Overbough", panel.CellX(1,2,0)+2, panel.CellY(1,2,0)+2);
   panel.DrawText(ovb, panel.CellX(1,2,0)+66, panel.CellY(1,2,0)+2);
   color clr=clrNONE;
//--- The label color changes depending on the value of the line relative to the level
   clr=
     (
      state_ovb==LINE_STATE_CROSS_DOWN ||
      (state_ovb==LINE_STATE_ABOVE && state==LINE_STATE_TURN_DOWN) ? clrRed : clrNONE
     );
   string ovb_str=(state_ovb==LINE_STATE_ABOVE ? "Inside the area" : LineStateDescription(state_ovb));
   panel.DrawText(ovb_str,panel.CellX(1,2,1)+2,panel.CellY(1,2,1)+2,clr,90);

//--- Display a description of the indicator line state relative to the oversold level
   panel.DrawText("Oversold", panel.CellX(1,3,0)+2, panel.CellY(1,3,0)+2);
   string ovs=StringFormat("%+.2f",oversold);
   panel.DrawText(ovs, panel.CellX(1,3,0)+68, panel.CellY(1,3,0)+2);
//--- The label color changes depending on the value of the line relative to the level
   clr=
     (
      state_ovs==LINE_STATE_CROSS_UP ||
      (state_ovs==LINE_STATE_UNDER && state==LINE_STATE_TURN_UP) ? clrBlue : clrNONE
     );
   string ovs_str=(state_ovs==LINE_STATE_UNDER ? "Inside the area" : LineStateDescription(state_ovs));
   panel.DrawText(ovs_str,panel.CellX(1,3,1)+2,panel.CellY(1,3,1)+2,clr,90);

//--- Display a description of the indicator line state
   panel.DrawText("Line state", panel.CellX(1,1,0)+2, panel.CellY(1,1,0)+2);
//--- The label color changes depending on the location of the line in the overbought/oversold areas
   clr=(state_ovb==LINE_STATE_ABOVE ? clrOrangeRed : state_ovs==LINE_STATE_UNDER ? clrDodgerBlue : clrNONE);
   panel.DrawText(LineStateDescription(state),panel.CellX(1,1,1)+2,panel.CellY(1,1,1)+2,clr,90);

//--- Redraw the chart to immediately display all changes on the panel
   ChartRedraw(ChartID());
  }
A posição da linha do indicador nas zonas de sobrecompra/sobrevenda, os sinais do indicador e o estado da linha são marcados com cores no painel.
Adicionalmente, no manipulador de eventos OnChartEvent() do EA, chama-se o manipulador de eventos do painel e processam-se eventos para recuperar o índice da barra sob o cursor:
//+------------------------------------------------------------------+
//| ChartEvent function                                              |
//+------------------------------------------------------------------+
void OnChartEvent(const int id,
                  const long &lparam,
                  const double &dparam,
                  const string &sparam)
  {
//--- Handling the panel
//--- Call the panel event handler
   panel.OnChartEvent(id,lparam,dparam,sparam);

//--- If the cursor moves or a click is made on the chart
   if(id==CHARTEVENT_MOUSE_MOVE || id==CHARTEVENT_CLICK)
     {
      //--- Declare the variables to record time and price coordinates in them
      datetime time=0;
      double price=0;
      int wnd=0;
      //--- If the cursor coordinates are converted to date and time
      if(ChartXYToTimePrice(ChartID(),(int)lparam,(int)dparam,wnd,time,price))
        {
         //--- write the bar index where the cursor is located to a global variable
         mouse_bar_index=iBarShift(Symbol(),PERIOD_CURRENT,time);
         //--- Display the bar data under the cursor on the panel
         DrawData(mouse_bar_index,time);
        }
     }

//--- If we received a custom event, display the appropriate message in the journal
   if(id>CHARTEVENT_CUSTOM)
     {
      //--- Here we can implement handling a click on the close button on the panel
      PrintFormat("%s: Event id=%ld, object id (lparam): %lu, event message (sparam): %s",__FUNCTION__,id,lparam,sparam);
     }
  }
Após compilar o EA e executá-lo no gráfico, podemos monitorar o estado da linha do indicador no painel:
O arquivo do EA "TestOscillatorWPR.mq5" pode ser encontrado nos arquivos anexados ao artigo.
Considerações finais
Aqui, consideramos a possibilidade de acoplar indicadores da categoria Osciladores aos Expert Advisors. Com a ajuda do painel de informações, podemos monitorar os valores e sinais dos indicadores obtidos por funções universais comuns. Todos os códigos propostos aqui podem ser facilmente transferidos para os códigos dos EAs e usados "como estão" com a ajuda do recurso Copiar e Colar, ou baixados dos arquivos anexados ao artigo para desenvolvimento independente.
Em seguida, consideraremos outros indicadores do pacote padrão do terminal da mesma maneira.
Traduzido do russo pela MetaQuotes Ltd.
Artigo original: https://www.mql5.com/ru/articles/13244
Aviso: Todos os direitos sobre esses materiais pertencem à MetaQuotes Ltd. É proibida a reimpressão total ou parcial.
Esse artigo foi escrito por um usuário do site e reflete seu ponto de vista pessoal. A MetaQuotes Ltd. não se responsabiliza pela precisão das informações apresentadas nem pelas possíveis consequências decorrentes do uso das soluções, estratégias ou recomendações descritas.

- Aplicativos de negociação gratuitos
- 8 000+ sinais para cópia
- Notícias econômicas para análise dos mercados financeiros
Você concorda com a política do site e com os termos de uso
Fiz algumas brincadeiras e consegui algo
Mas também havia uma tarefa para obter o nome da célula ao clicar nela.
Tudo o que consigo é o seguinte.
--
Existe alguma solução?
Estive brincando e descobri algo
Mas também havia uma tarefa para obter o nome da célula ao clicar nela.
Tudo o que consigo é o seguinte
--
Existe uma solução?
Receio que não haja uma solução simples - são dados desenhados. Portanto, ao clicar na tabela, você precisa rastrear as coordenadas do cursor e determinar em qual célula desenhada ele está.
Receio que não haja uma solução simples - esses são dados desenhados. Portanto, ao clicar na tabela, você precisa rastrear as coordenadas do cursor e determinar em qual célula desenhada ele está localizado.
Em geral, será possível passar por isso.
Desenhei um objeto gráfico paralelo OBJ_RECTANGLE_LABEL com ZORDER = 1 e cor = clrNONE
Funciona bem, obtém o nome da célula. Também colapsa e expande
Obrigado!
Em geral, é possível passar por isso.