
Modelos prontos para integrar indicadores nos Expert Advisors (Parte 2): Indicadores de volume e Bill Williams

Conteúdo
- Introdução
- Indicadores de volume
- Indicadores de Bill Williams
- Accelerator Oscillator
- Alligator
- Awesome Oscillator
- Fractals
- Gator Oscillator
- Market Facilitation Index
- Aprimoramento das classes do painel informativo. Visão geral
- Considerações finais
Introdução
Este artigo é uma continuação do tópico sobre modelos prontos para usar indicadores em Expert Advisors. Hoje, vamos examinar a integração aos EAs e o uso de indicadores de volume e indicadores de Bill Williams. Os dados obtidos dos indicadores serão exibidos, como exemplo, no painel informativo, que criamos no primeiro artigo desta série. O painel também foi aprimorado, e no final do artigo, vamos dar uma breve olhada em suas modificações e aprimoramentos.
Para cada indicador considerado no artigo, serão apresentados modelos prontos para serem usados em nossos programas:
- Variáveis de entrada e globais,
- Inicialização das variáveis e criação do handle do indicador,
- Desinicialização,
- Recuperação de dados no EA a partir do indicador,
- Exemplo de exibição dos dados obtidos no painel informativo.
Indicadores de volume
Os indicadores de volume são aqueles cujos cálculos levam em consideração os volumes. Para o mercado Forex, por volumes se entendem a quantidade de ticks (mudanças de preço) que ocorreram em um intervalo de tempo. Para instrumentos de mercado, os volumes se referem aos volumes de transações realizadas (em contratos ou em termos monetários).
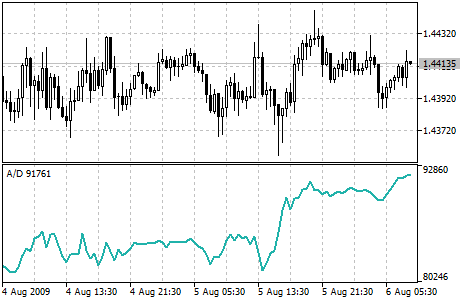
Accumulation/distribution
O indicador técnico Acumulação/Distribuição (Accumulation Distribution, A/D) é determinado pela mudança de preço e volume. O volume atua como um coeficiente de ponderação na mudança de preço — quanto maior o coeficiente (volume), mais significativa é a contribuição da mudança de preço (para esse período) no valor do indicador.
De fato, este indicador é uma variante do indicador Volume de Balanço mais comum (On Balance Volume). Ambos são usados para confirmar mudanças de preço medindo o volume de negociação correspondente.
Um aumento no indicador Accumulation/Distribution (A/D) indica acumulação (compra) do título financeiro, uma vez que a grande maioria do volume de negociação está associada com o movimento ascendente dos preços. Quando o indicador cai, indica distribuição (venda) do título financeiro, pois a grande maioria do volume de negociação está associada com o movimento descendente dos preços.
Divergências entre o indicador Accumulation/Distribution e o preço do título financeiro indicam uma mudança iminente nos preços. Geralmente, em caso de divergência, a tendência de preço muda na direção do movimento do indicador. Logo, se o indicador está aumentando enquanto o preço do título financeiro está caindo, espera-se uma reversão de preço.
Parâmetros
Para criar o handle do indicador, utiliza-se a função iAD():
Retorna o handle do indicador Accumulation/Distribution. Apenas um buffer.
int  iAD(
   string               symbol,             // symbol name
   ENUM_TIMEFRAMES      period,             // period
   ENUM_APPLIED_VOLUME  applied_volume      // type of volume used for calculations
   );
symbol
[in] Nome simbólico do instrumento cujos dados serão usados para calcular o indicador. NULL representa o símbolo atual.
period
[in] O valor do período pode ser um dos valores da enumeração ENUM_TIMEFRAMES, 0 significa o timeframe atual.
applied_volume
[in] Volume utilizado. Pode ser qualquer um dos ENUM_APPLIED_VOLUME.
Retorna o handle do indicador técnico especificado, em caso de falha retorna INVALID_HANDLE. A função IndicatorRelease() é usada para liberar a memória do computador do indicador que não é mais usado; o handle desse indicador é passado para ela.
Para criar o indicador em um EA, declararemos variáveis de entrada e variáveis globais:
//+------------------------------------------------------------------+
//|                                                 TestVolumeAD.mq5 |
//|                                  Copyright 2023, MetaQuotes Ltd. |
//|                                             https://www.mql5.com |
//+------------------------------------------------------------------+
#property copyright "Copyright 2023, MetaQuotes Ltd."
#property link      "https://www.mql5.com"
#property version   "1.00"
//--- enums
enum ENUM_LINE_STATE
  {
   LINE_STATE_NONE,        // Undefined state
   LINE_STATE_UP,          // Upward
   LINE_STATE_DOWN,        // Downward
   LINE_STATE_TURN_UP,     // Upward reversal
   LINE_STATE_TURN_DOWN,   // Downward reversal
   LINE_STATE_STOP_UP,     // Upward stop
   LINE_STATE_STOP_DOWN,   // Downward stop
   LINE_STATE_ABOVE,       // Above value
   LINE_STATE_UNDER,       // Below value
   LINE_STATE_CROSS_UP,    // Crossing value upwards
   LINE_STATE_CROSS_DOWN,  // Crossing value downwards
   LINE_STATE_TOUCH_BELOW, // Touching value from below
   LINE_STATE_TOUCH_ABOVE, // Touch value from above
   LINE_STATE_EQUALS,      // Equal to value
  };
//--- input parameters
input ENUM_APPLIED_VOLUME  InpVolume   =  VOLUME_TICK;   /* Applied Volume */
//--- global variables
int      handle=INVALID_HANDLE;  // Indicator handle
int      ind_digits=0;           // Number of decimal places in the indicator values
string   ind_title;              // Indicator description
A enumeração ENUM_LINE_STATE foi criada para facilitar a obtenção do estado da linha do indicador — sua forma (figura) e localização em relação à linha de outro indicador, ou a algum nível.
Para mais detalhes sobre a enumeração, pode-se ler no artigo anterior na seção de parâmetros do indicador ATR.
Ao usar o painel informativo em um EA, também é necessário declarar variáveis globais e incluir o arquivo de classes do painel:
//+------------------------------------------------------------------+
//|                                                 TestVolumeAD.mq5 |
//|                                  Copyright 2023, MetaQuotes Ltd. |
//|                                             https://www.mql5.com |
//+------------------------------------------------------------------+
#property copyright "Copyright 2023, MetaQuotes Ltd."
#property link      "https://www.mql5.com"
#property version   "1.00"
//--- includes
#include <Dashboard\Dashboard.mqh>
//--- enums
enum ENUM_LINE_STATE
  {
   LINE_STATE_NONE,        // Undefined state
   LINE_STATE_UP,          // Upward
   LINE_STATE_DOWN,        // Downward
   LINE_STATE_TURN_UP,     // Upward reversal
   LINE_STATE_TURN_DOWN,   // Downward reversal
   LINE_STATE_STOP_UP,     // Upward stop
   LINE_STATE_STOP_DOWN,   // Downward stop
   LINE_STATE_ABOVE,       // Above value
   LINE_STATE_UNDER,       // Below value
   LINE_STATE_CROSS_UP,    // Crossing value upwards
   LINE_STATE_CROSS_DOWN,  // Crossing value downwards
   LINE_STATE_TOUCH_BELOW, // Touching value from below
   LINE_STATE_TOUCH_ABOVE, // Touch value from above
   LINE_STATE_EQUALS,      // Equal to value
  };
//--- input parameters
input ENUM_APPLIED_VOLUME  InpVolume   =  VOLUME_TICK;   /* Applied Volume */
//--- global variables
int      handle=INVALID_HANDLE;  // Indicator handle
int      ind_digits=0;           // Number of decimal places in the indicator values
string   ind_title;              // Indicator description
//--- variables for the panel
int      mouse_bar_index;        // Index of the bar the data is taken from
CDashboard *panel=NULL;          // Pointer to the panel object
Inicialização
Configuramos os valores das variáveis globais para o indicador e criamos seu handle:
//+------------------------------------------------------------------+
//| Expert initialization function                                   |
//+------------------------------------------------------------------+
int OnInit()
  {
//--- create timer
   EventSetTimer(60);

//--- Indicator
//--- Set the indicator name and the number of decimal places
   ind_title="A/D";
   ind_digits=0;
//--- Create indicator handle
   ResetLastError();
   handle=iAD(Symbol(),PERIOD_CURRENT,InpVolume);
   if(handle==INVALID_HANDLE)
     {
      PrintFormat("%s: Failed to create indicator handle %s. Error %ld",__FUNCTION__,ind_title,GetLastError());
      return INIT_FAILED;
     }

//--- Successful initialization
   return(INIT_SUCCEEDED);
  }
Ao usar o painel informativo no EA, criamos o painel:
//+------------------------------------------------------------------+
//| Expert initialization function                                   |
//+------------------------------------------------------------------+
int OnInit()
  {
//--- create timer
   EventSetTimer(60);

//--- Indicator
//--- Set the indicator name and the number of decimal places
   ind_title="A/D";
   ind_digits=0;
//--- Create indicator handle
   ResetLastError();
   handle=iAD(Symbol(),PERIOD_CURRENT,InpVolume);
   if(handle==INVALID_HANDLE)
     {
      PrintFormat("%s: Failed to create indicator handle %s. Error %ld",__FUNCTION__,ind_title,GetLastError());
      return INIT_FAILED;
     }

//--- Dashboard
//--- Create the panel
   panel=new CDashboard(1,20,20,199,225);
   if(panel==NULL)
     {
      Print("Error. Failed to create panel object");
      return INIT_FAILED;
     }
//--- Set font parameters
   panel.SetFontParams("Calibri",9);
//--- Display the panel with the "Symbol, Timeframe description" header text
   panel.View(Symbol()+", "+StringSubstr(EnumToString(Period()),7));
//--- Create a table with ID 0 to display bar data in it
   panel.CreateNewTable(0);
//--- Draw a table with ID 0 on the panel background
   panel.DrawGrid(0,2,20,6,2,18,97);

//--- Create a table with ID 1 to display indicator data in it
   panel.CreateNewTable(1);
//--- Get the Y2 table coordinate with ID 0 and
//--- set the Y1 coordinate for the table with ID 1
   int y1=panel.TableY2(0)+22;
//--- Draw a table with ID 1 on the panel background
   panel.DrawGrid(1,2,y1,3,2,18,97);

//--- Display tabular data in the journal
   panel.GridPrint(0,2);
   panel.GridPrint(1,2);
//--- Initialize the variable with the index of the mouse cursor bar
   mouse_bar_index=0;
//--- Display the data of the current bar on the panel
   DrawData(mouse_bar_index,TimeCurrent());

//--- Successful initialization
   return(INIT_SUCCEEDED);
  }
//+------------------------------------------------------------------+
Desinicialização
No manipulador OnDeinit() do EA, liberamos o handle do indicador:
//+------------------------------------------------------------------+
//| Expert deinitialization function                                 |
//+------------------------------------------------------------------+
void OnDeinit(const int reason)
  {
//--- destroy timer
   EventKillTimer();

//--- Release handle of the indicator
   ResetLastError();
   if(!IndicatorRelease(handle))
      PrintFormat("%s: IndicatorRelease failed. Error %ld",__FUNCTION__,GetLastError());
//--- Clear all comments on the chart
   Comment("");
  }
Ao usar o painel informativo, removemos o objeto do painel criado:
//+------------------------------------------------------------------+
//| Expert deinitialization function                                 |
//+------------------------------------------------------------------+
void OnDeinit(const int reason)
  {
//--- destroy timer
   EventKillTimer();

//--- Release handle of the indicator
   ResetLastError();
   if(!IndicatorRelease(handle))
      PrintFormat("%s: IndicatorRelease failed. Error %ld",__FUNCTION__,GetLastError());
//--- Clear all comments on the chart
   Comment("");

//--- If the panel object exists, delete it
   if(panel!=NULL)
      delete panel;
  }
Recuperação de dados
A seguir, são apresentadas funções gerais para acessar dados pelo handle do indicador. As funções foram discutidas no artigo sobre a integração de osciladores aos EAs. As funções apresentadas podem ser usadas "como estão" em seus programas:
//+------------------------------------------------------------------+
//| Return the indicator data on the specified bar                   |
//+------------------------------------------------------------------+
double IndicatorValue(const int ind_handle,const int index,const int buffer_num)
  {
   double array[1]={0};
   ResetLastError();
   if(CopyBuffer(ind_handle,buffer_num,index,1,array)!=1)
     {
      PrintFormat("%s: CopyBuffer failed. Error %ld",__FUNCTION__,GetLastError());
      return EMPTY_VALUE;
     }
   return array[0];
  }
//+------------------------------------------------------------------+
//| Return the state of the indicator line                           |
//+------------------------------------------------------------------+
ENUM_LINE_STATE LineState(const int ind_handle,const int index,const int buffer_num)
  {
//--- Get the values of the indicator line with the shift (0,1,2) relative to the passed index
   const double value0=IndicatorValue(ind_handle,index,  buffer_num);
   const double value1=IndicatorValue(ind_handle,index+1,buffer_num);
   const double value2=IndicatorValue(ind_handle,index+2,buffer_num);
//--- If at least one of the values could not be obtained, return an undefined value
   if(value0==EMPTY_VALUE || value1==EMPTY_VALUE || value2==EMPTY_VALUE)
      return LINE_STATE_NONE;
//--- Line upward reversal (value2>value1 && value0>value1)
   if(NormalizeDouble(value2-value1,ind_digits)>0 && NormalizeDouble(value0-value1,ind_digits)>0)
      return LINE_STATE_TURN_UP;
//--- Line upward direction (value2<=value1 && value0>value1)
   else if(NormalizeDouble(value2-value1,ind_digits)<=0 && NormalizeDouble(value0-value1,ind_digits)>0)
      return LINE_STATE_UP;
//--- Line upward stop (value2<=value1 && value0==value1)
   else if(NormalizeDouble(value2-value1,ind_digits)<=0 && NormalizeDouble(value0-value1,ind_digits)==0)
      return LINE_STATE_STOP_UP;
//--- Line downward reversal (value2<value1 && value0<value1)
   if(NormalizeDouble(value2-value1,ind_digits)<0 && NormalizeDouble(value0-value1,ind_digits)<0)
      return LINE_STATE_TURN_DOWN;
//--- Line downward direction (value2>=value1 && value0<value1)
   else if(NormalizeDouble(value2-value1,ind_digits)>=0 && NormalizeDouble(value0-value1,ind_digits)<0)
      return LINE_STATE_DOWN;
//--- Line downward stop (value2>=value1 && value0==value1)
   else if(NormalizeDouble(value2-value1,ind_digits)>=0 && NormalizeDouble(value0-value1,ind_digits)==0)
      return LINE_STATE_STOP_DOWN;
//--- Undefined state
   return LINE_STATE_NONE;
  }
//+------------------------------------------------------------------+
//| Return the state of the line relative to the specified level     |
//+------------------------------------------------------------------+
ENUM_LINE_STATE LineStateRelative(const int ind_handle,const int index,const int buffer_num,const double level0,const double level1=EMPTY_VALUE)
  {
//--- Get the values of the indicator line with the shift (0,1) relative to the passed index
   const double value0=IndicatorValue(ind_handle,index,  buffer_num);
   const double value1=IndicatorValue(ind_handle,index+1,buffer_num);
//--- If at least one of the values could not be obtained, return an undefined value
   if(value0==EMPTY_VALUE || value1==EMPTY_VALUE)
      return LINE_STATE_NONE;
//--- Define the second level to compare
   double level=(level1==EMPTY_VALUE ? level0 : level1);
//--- The line is below the level (value1<level && value0<level0)
   if(NormalizeDouble(value1-level,ind_digits)<0 && NormalizeDouble(value0-level0,ind_digits)<0)
      return LINE_STATE_UNDER;
//--- The line is above the level (value1>level && value0>level0)
   if(NormalizeDouble(value1-level,ind_digits)>0 && NormalizeDouble(value0-level0,ind_digits)>0)
      return LINE_STATE_ABOVE;
//--- The line crossed the level upwards (value1<=level && value0>level0)
   if(NormalizeDouble(value1-level,ind_digits)<=0 && NormalizeDouble(value0-level0,ind_digits)>0)
      return LINE_STATE_CROSS_UP;
//--- The line crossed the level downwards (value1>=level && value0<level0)
   if(NormalizeDouble(value1-level,ind_digits)>=0 && NormalizeDouble(value0-level0,ind_digits)<0)
      return LINE_STATE_CROSS_DOWN;
//--- The line touched the level from below (value1<level0 && value0==level0)
   if(NormalizeDouble(value1-level,ind_digits)<0 && NormalizeDouble(value0-level0,ind_digits)==0)
      return LINE_STATE_TOUCH_BELOW;
//--- The line touched the level from above (value1>level0 && value0==level0)
   if(NormalizeDouble(value1-level,ind_digits)>0 && NormalizeDouble(value0-level0,ind_digits)==0)
      return LINE_STATE_TOUCH_BELOW;
//--- Line is equal to the level value (value1==level0 && value0==level0)
   if(NormalizeDouble(value1-level,ind_digits)==0 && NormalizeDouble(value0-level0,ind_digits)==0)
      return LINE_STATE_EQUALS;
//--- Undefined state
   return LINE_STATE_NONE;
  }
//+------------------------------------------------------------------+
//| Return the indicator line state description                      |
//+------------------------------------------------------------------+
string LineStateDescription(const ENUM_LINE_STATE state)
  {
   switch(state)
     {
      case LINE_STATE_UP         :  return "Up";
      case LINE_STATE_STOP_UP    :  return "Stop Up";
      case LINE_STATE_TURN_UP    :  return "Turn Up";
      case LINE_STATE_DOWN       :  return "Down";
      case LINE_STATE_STOP_DOWN  :  return "Stop Down";
      case LINE_STATE_TURN_DOWN  :  return "Turn Down";
      case LINE_STATE_ABOVE      :  return "Above level";
      case LINE_STATE_UNDER      :  return "Under level";
      case LINE_STATE_CROSS_UP   :  return "Crossing Up";
      case LINE_STATE_CROSS_DOWN :  return "Crossing Down";
      case LINE_STATE_TOUCH_BELOW:  return "Touch from Below";
      case LINE_STATE_TOUCH_ABOVE:  return "Touch from Above";
      case LINE_STATE_EQUALS     :  return "Equals";
      default                    :  return "Unknown";
     }
  }
Ao usar o painel informativo, os dados são exibidos por meio da função:
//+------------------------------------------------------------------+
//| Display data from the specified timeseries index to the panel    |
//+------------------------------------------------------------------+
void DrawData(const int index,const datetime time)
  {
//--- Declare the variables to receive data in them
   MqlTick  tick={0};
   MqlRates rates[1];

//--- Exit if unable to get the current prices
   if(!SymbolInfoTick(Symbol(),tick))
      return;
//--- Exit if unable to get the bar data by the specified index
   if(CopyRates(Symbol(),PERIOD_CURRENT,index,1,rates)!=1)
      return;

//--- Set font parameters for bar and indicator data headers
   int  size=0;
   uint flags=0;
   uint angle=0;
   string name=panel.FontParams(size,flags,angle);
   panel.SetFontParams(name,9,FW_BOLD);
   panel.DrawText("Bar data ["+(string)index+"]",3,panel.TableY1(0)-16,clrMaroon,panel.Width()-6);
   panel.DrawText("Indicator data ["+(string)index+"]",3,panel.TableY1(1)-16,clrGreen,panel.Width()-6);
//--- Set font parameters for bar and indicator data
   panel.SetFontParams(name,9);

//--- Display the data of the specified bar in table 0 on the panel
   panel.DrawText("Date",  panel.CellX(0,0,0)+2, panel.CellY(0,0,0)+2); panel.DrawText(TimeToString(  rates[0].time,TIME_DATE),     panel.CellX(0,0,1)+2, panel.CellY(0,0,1)+2,clrNONE,90);
   panel.DrawText("Time",  panel.CellX(0,1,0)+2, panel.CellY(0,1,0)+2); panel.DrawText(TimeToString(  rates[0].time,TIME_MINUTES),  panel.CellX(0,1,1)+2, panel.CellY(0,1,1)+2,clrNONE,90);
   panel.DrawText("Open",  panel.CellX(0,2,0)+2, panel.CellY(0,2,0)+2); panel.DrawText(DoubleToString(rates[0].open,Digits()),      panel.CellX(0,2,1)+2, panel.CellY(0,2,1)+2,clrNONE,90);
   panel.DrawText("High",  panel.CellX(0,3,0)+2, panel.CellY(0,3,0)+2); panel.DrawText(DoubleToString(rates[0].high,Digits()),      panel.CellX(0,3,1)+2, panel.CellY(0,3,1)+2,clrNONE,90);
   panel.DrawText("Low",   panel.CellX(0,4,0)+2, panel.CellY(0,4,0)+2); panel.DrawText(DoubleToString(rates[0].low,Digits()),       panel.CellX(0,4,1)+2, panel.CellY(0,4,1)+2,clrNONE,90);
   panel.DrawText("Close", panel.CellX(0,5,0)+2, panel.CellY(0,5,0)+2); panel.DrawText(DoubleToString(rates[0].close,Digits()),     panel.CellX(0,5,1)+2, panel.CellY(0,5,1)+2,clrNONE,90);

//--- Display the indicator data from the specified bar on the panel in table 1
   panel.DrawText(ind_title, panel.CellX(1,0,0)+2, panel.CellY(1,0,0)+2);
   double value=IndicatorValue(handle,index,0);
   string value_str=(value!=EMPTY_VALUE ? DoubleToString(value,ind_digits) : "");
   panel.DrawText(value_str,panel.CellX(1,0,1)+2,panel.CellY(1,0,1)+2,clrNONE,90);

//--- Display a description of the indicator line state
   panel.DrawText("Line state", panel.CellX(1,1,0)+2, panel.CellY(1,1,0)+2);
   ENUM_LINE_STATE state=LineState(handle,index,0);
   panel.DrawText(LineStateDescription(state),panel.CellX(1,1,1)+2,panel.CellY(1,1,1)+2,clrNONE,90);

//--- Redraw the chart to immediately display all changes on the panel
   ChartRedraw(ChartID());
  }
Além disso, ao usar o painel informativo no manipulador de eventos OnChartEvent() do EA, o manipulador de eventos do painel é chamado, e os eventos são processados para obter o índice da barra sob o cursor:
//+------------------------------------------------------------------+
//| ChartEvent function                                              |
//+------------------------------------------------------------------+
void OnChartEvent(const int id,
                  const long &lparam,
                  const double &dparam,
                  const string &sparam)
  {
//--- Handling the panel
//--- Call the panel event handler
   panel.OnChartEvent(id,lparam,dparam,sparam);

//--- If the cursor moves or a click is made on the chart
   if(id==CHARTEVENT_MOUSE_MOVE || id==CHARTEVENT_CLICK)
     {
      //--- Declare the variables to record time and price coordinates in them
      datetime time=0;
      double price=0;
      int wnd=0;
      //--- If the cursor coordinates are converted to date and time
      if(ChartXYToTimePrice(ChartID(),(int)lparam,(int)dparam,wnd,time,price))
        {
         //--- write the bar index where the cursor is located to a global variable
         mouse_bar_index=iBarShift(Symbol(),PERIOD_CURRENT,time);
         //--- Display the bar data under the cursor on the panel
         DrawData(mouse_bar_index,time);
        }
     }

//--- If we received a custom event, display the appropriate message in the journal
   if(id>CHARTEVENT_CUSTOM)
     {
      //--- Here we can implement handling a click on the close button on the panel
      PrintFormat("%s: Event id=%ld, object id (lparam): %lu, event message (sparam): %s",__FUNCTION__,id,lparam,sparam);
     }
  }
Após a compilação e execução do EA no gráfico, podemos monitorar o valor e o estado da linha do indicador no painel informativo:
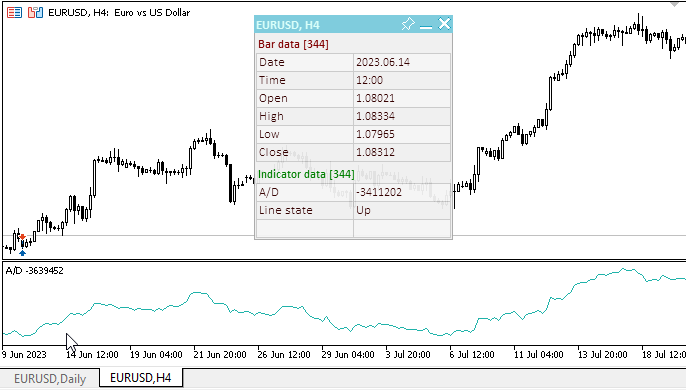
O arquivo do EA de teste "TestVolumeAD.mq5" pode ser consultado nos arquivos anexados ao artigo.
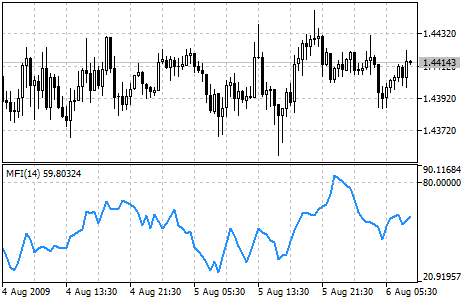
Money Flow Index
O indicador técnico Índice de Fluxo de Dinheiro (Money Flow Index, MFI) mostra a intensidade com a qual o dinheiro é investido em um título financeiro ou retirado dele. A construção e interpretação do indicador são semelhantes às do Índice de Força Relativa (Relative Strength Index, RSI), com a única diferença de que o MFI também leva em conta o volume.
Ao analisar o Índice de Fluxo de Dinheiro, deve-se considerar:
- divergências entre o indicador e o movimento dos preços. Se os preços estão subindo e o valor do Money Flow Index está caindo (ou vice-versa), então há uma grande probabilidade de reversão dos preços;
- um valor do Índice de Fluxo de Dinheiro acima de 80 e abaixo de 20 indica, respectivamente, um potencial pico e fundo do mercado.
Parâmetros
Para criar um handle do indicador, utiliza-se a função iMFI():
int  iMFI(
   string               symbol,             // symbol name
   ENUM_TIMEFRAMES      period,             // period
   int                  ma_period,          // averaging period
   ENUM_APPLIED_VOLUME  applied_volume      // type of volume used for calculations
   );
symbol
[in] Nome simbólico do instrumento cujos dados serão usados para calcular o indicador. NULL representa o símbolo atual.
period
[in] O valor do período pode ser um dos valores da enumeração ENUM_TIMEFRAMES, 0 significa o timeframe atual.
ma_period
[in] Período (número de barras) para o cálculo do indicador.
applied_volume
[in] Volume utilizado. Pode ser qualquer um dos ENUM_APPLIED_VOLUME.
Retorna o handle do indicador técnico especificado, em caso de falha retorna INVALID_HANDLE. A função IndicatorRelease() é usada para liberar a memória do computador do indicador que não é mais usado; o handle desse indicador é passado para ela.
Para criar um indicador no EA declararemos variáveis de entrada e variáveis globais:
//+------------------------------------------------------------------+
//|                                                TestVolumeMFI.mq5 |
//|                                  Copyright 2023, MetaQuotes Ltd. |
//|                                             https://www.mql5.com |
//+------------------------------------------------------------------+
#property copyright "Copyright 2023, MetaQuotes Ltd."
#property link      "https://www.mql5.com"
#property version   "1.00"
//--- enums
enum ENUM_LINE_STATE
  {
   LINE_STATE_NONE,        // Undefined state
   LINE_STATE_UP,          // Upward
   LINE_STATE_DOWN,        // Downward
   LINE_STATE_TURN_UP,     // Upward reversal
   LINE_STATE_TURN_DOWN,   // Downward reversal
   LINE_STATE_STOP_UP,     // Upward stop
   LINE_STATE_STOP_DOWN,   // Downward stop
   LINE_STATE_ABOVE,       // Above value
   LINE_STATE_UNDER,       // Below value
   LINE_STATE_CROSS_UP,    // Crossing value upwards
   LINE_STATE_CROSS_DOWN,  // Crossing value downwards
   LINE_STATE_TOUCH_BELOW, // Touching value from below
   LINE_STATE_TOUCH_ABOVE, // Touch value from above
   LINE_STATE_EQUALS,      // Equal to value
  };
//--- input parameters
input uint                 InpPeriod   =  14;            /* Period         */
input ENUM_APPLIED_VOLUME  InpVolume   =  VOLUME_TICK;   /* Applied Volume */
input double               InpOverbough=  80;            /* Overbough level*/
input double               InpOversold =  20;            /* Oversold level */
//--- global variables
int      handle=INVALID_HANDLE;  // Indicator handle
int      period=0;               // RSI calculation period
int      ind_digits=0;           // Number of decimal places in the indicator values
double   overbough=0;            // Overbought level
double   oversold=0;             // Oversold level
string   ind_title;              // Indicator description
Ao usar um painel informativo no EA, também declaramos variáveis globais para ele e incluímos o arquivo de classes do painel:
//+------------------------------------------------------------------+
//|                                                TestVolumeMFI.mq5 |
//|                                  Copyright 2023, MetaQuotes Ltd. |
//|                                             https://www.mql5.com |
//+------------------------------------------------------------------+
#property copyright "Copyright 2023, MetaQuotes Ltd."
#property link      "https://www.mql5.com"
#property version   "1.00"
//--- includes
#include <Dashboard\Dashboard.mqh>
//--- enums
enum ENUM_LINE_STATE
  {
   LINE_STATE_NONE,        // Undefined state
   LINE_STATE_UP,          // Upward
   LINE_STATE_DOWN,        // Downward
   LINE_STATE_TURN_UP,     // Upward reversal
   LINE_STATE_TURN_DOWN,   // Downward reversal
   LINE_STATE_STOP_UP,     // Upward stop
   LINE_STATE_STOP_DOWN,   // Downward stop
   LINE_STATE_ABOVE,       // Above value
   LINE_STATE_UNDER,       // Below value
   LINE_STATE_CROSS_UP,    // Crossing value upwards
   LINE_STATE_CROSS_DOWN,  // Crossing value downwards
   LINE_STATE_TOUCH_BELOW, // Touching value from below
   LINE_STATE_TOUCH_ABOVE, // Touch value from above
   LINE_STATE_EQUALS,      // Equal to value
  };
//--- input parameters
input uint                 InpPeriod   =  14;            /* Period         */
input ENUM_APPLIED_VOLUME  InpVolume   =  VOLUME_TICK;   /* Applied Volume */
input double               InpOverbough=  80;            /* Overbough level*/
input double               InpOversold =  20;            /* Oversold level */
//--- global variables
int      handle=INVALID_HANDLE;  // Indicator handle
int      period=0;               // RSI calculation period
int      ind_digits=0;           // Number of decimal places in the indicator values
double   overbough=0;            // Overbought level
double   oversold=0;             // Oversold level
string   ind_title;              // Indicator description
//--- variables for the panel
int      mouse_bar_index;        // Index of the bar the data is taken from
CDashboard *panel=NULL;          // Pointer to the panel object
Inicialização
Configuramos os valores das variáveis globais para o indicador e criamos seu handle:
//+------------------------------------------------------------------+
//| Expert initialization function                                   |
//+------------------------------------------------------------------+
int OnInit()
  {
//--- create timer
   EventSetTimer(60);

//--- Indicator
//--- Set and adjust the calculation period and levels if necessary
   period=int(InpPeriod<1 ? 14 : InpPeriod);
   overbough=InpOverbough;
   oversold=(InpOversold>=overbough ? overbough-0.01 : InpOversold);
//--- Set the indicator name and the number of decimal places
   ind_title=StringFormat("MFI(%lu)",period);
   ind_digits=Digits();
//--- Create indicator handle
   ResetLastError();
   handle=iMFI(Symbol(),PERIOD_CURRENT,period,InpVolume);
   if(handle==INVALID_HANDLE)
     {
      PrintFormat("%s: Failed to create indicator handle %s. Error %ld",__FUNCTION__,ind_title,GetLastError());
      return INIT_FAILED;
     }

//--- Successful initialization
   return(INIT_SUCCEEDED);
  }
Ao usar o painel informativo no EA, criamos o painel:
//+------------------------------------------------------------------+
//| Expert initialization function                                   |
//+------------------------------------------------------------------+
int OnInit()
  {
//--- create timer
   EventSetTimer(60);

//--- Indicator
//--- Set and adjust the calculation period and levels if necessary
   period=int(InpPeriod<1 ? 14 : InpPeriod);
   overbough=InpOverbough;
   oversold=(InpOversold>=overbough ? overbough-0.01 : InpOversold);
//--- Set the indicator name and the number of decimal places
   ind_title=StringFormat("MFI(%lu)",period);
   ind_digits=Digits();
//--- Create indicator handle
   ResetLastError();
   handle=iMFI(Symbol(),PERIOD_CURRENT,period,InpVolume);
   if(handle==INVALID_HANDLE)
     {
      PrintFormat("%s: Failed to create indicator handle %s. Error %ld",__FUNCTION__,ind_title,GetLastError());
      return INIT_FAILED;
     }

//--- Dashboard
//--- Create the panel
   panel=new CDashboard(1,20,20,229,243);
   if(panel==NULL)
     {
      Print("Error. Failed to create panel object");
      return INIT_FAILED;
     }
//--- Set font parameters
   panel.SetFontParams("Calibri",9);
//--- Display the panel with the "Symbol, Timeframe description" header text
   panel.View(Symbol()+", "+StringSubstr(EnumToString(Period()),7));
//--- Create a table with ID 0 to display bar data in it
   panel.CreateNewTable(0);
//--- Draw a table with ID 0 on the panel background
   panel.DrawGrid(0,2,20,6,2,18,112);

//--- Create a table with ID 1 to display indicator data in it
   panel.CreateNewTable(1);
//--- Get the Y2 table coordinate with ID 0 and
//--- set the Y1 coordinate for the table with ID 1
   int y1=panel.TableY2(0)+22;
//--- Draw a table with ID 1 on the panel background
   panel.DrawGrid(1,2,y1,4,2,18,112);

//--- Display tabular data in the journal
   panel.GridPrint(0,2);
   panel.GridPrint(1,2);
//--- Initialize the variable with the index of the mouse cursor bar
   mouse_bar_index=0;
//--- Display the data of the current bar on the panel
   DrawData(mouse_bar_index,TimeCurrent());

//--- Successful initialization
   return(INIT_SUCCEEDED);
  }
Desinicialização
No manipulador OnDeinit() do EA, liberamos o handle do indicador:
//+------------------------------------------------------------------+
//| Expert deinitialization function                                 |
//+------------------------------------------------------------------+
void OnDeinit(const int reason)
  {
//--- destroy timer
   EventKillTimer();

//--- Release handle of the indicator
   ResetLastError();
   if(!IndicatorRelease(handle))
      PrintFormat("%s: IndicatorRelease failed. Error %ld",__FUNCTION__,GetLastError());
//--- Clear all comments on the chart
   Comment("");
  }
Ao usar o painel informativo, removemos o objeto do painel criado:
//+------------------------------------------------------------------+
//| Expert deinitialization function                                 |
//+------------------------------------------------------------------+
void OnDeinit(const int reason)
  {
//--- destroy timer
   EventKillTimer();

//--- Release handle of the indicator
   ResetLastError();
   if(!IndicatorRelease(handle))
      PrintFormat("%s: IndicatorRelease failed. Error %ld",__FUNCTION__,GetLastError());
//--- Clear all comments on the chart
   Comment("");

//--- If the panel object exists, delete it
   if(panel!=NULL)
      delete panel;
  }
Recuperação de dados
A seguir, são apresentadas funções gerais para acessar dados pelo handle do indicador. As funções foram discutidas no artigo sobre a integração de osciladores aos EAs. As funções apresentadas podem ser usadas "como estão" em seus programas:
//+------------------------------------------------------------------+
//| Return the indicator data on the specified bar                   |
//+------------------------------------------------------------------+
double IndicatorValue(const int ind_handle,const int index,const int buffer_num)
  {
   double array[1]={0};
   ResetLastError();
   if(CopyBuffer(ind_handle,buffer_num,index,1,array)!=1)
     {
      PrintFormat("%s: CopyBuffer failed. Error %ld",__FUNCTION__,GetLastError());
      return EMPTY_VALUE;
     }
   return array[0];
  }
//+------------------------------------------------------------------+
//| Return the state of the indicator line                           |
//+------------------------------------------------------------------+
ENUM_LINE_STATE LineState(const int ind_handle,const int index,const int buffer_num)
  {
//--- Get the values of the indicator line with the shift (0,1,2) relative to the passed index
   const double value0=IndicatorValue(ind_handle,index,  buffer_num);
   const double value1=IndicatorValue(ind_handle,index+1,buffer_num);
   const double value2=IndicatorValue(ind_handle,index+2,buffer_num);
//--- If at least one of the values could not be obtained, return an undefined value
   if(value0==EMPTY_VALUE || value1==EMPTY_VALUE || value2==EMPTY_VALUE)
      return LINE_STATE_NONE;
//--- Line upward reversal (value2>value1 && value0>value1)
   if(NormalizeDouble(value2-value1,ind_digits)>0 && NormalizeDouble(value0-value1,ind_digits)>0)
      return LINE_STATE_TURN_UP;
//--- Line upward direction (value2<=value1 && value0>value1)
   else if(NormalizeDouble(value2-value1,ind_digits)<=0 && NormalizeDouble(value0-value1,ind_digits)>0)
      return LINE_STATE_UP;
//--- Line upward stop (value2<=value1 && value0==value1)
   else if(NormalizeDouble(value2-value1,ind_digits)<=0 && NormalizeDouble(value0-value1,ind_digits)==0)
      return LINE_STATE_STOP_UP;
//--- Line downward reversal (value2<value1 && value0<value1)
   if(NormalizeDouble(value2-value1,ind_digits)<0 && NormalizeDouble(value0-value1,ind_digits)<0)
      return LINE_STATE_TURN_DOWN;
//--- Line downward direction (value2>=value1 && value0<value1)
   else if(NormalizeDouble(value2-value1,ind_digits)>=0 && NormalizeDouble(value0-value1,ind_digits)<0)
      return LINE_STATE_DOWN;
//--- Line downward stop (value2>=value1 && value0==value1)
   else if(NormalizeDouble(value2-value1,ind_digits)>=0 && NormalizeDouble(value0-value1,ind_digits)==0)
      return LINE_STATE_STOP_DOWN;
//--- Undefined state
   return LINE_STATE_NONE;
  }
//+------------------------------------------------------------------+
//| Return the state of the line relative to the specified level     |
//+------------------------------------------------------------------+
ENUM_LINE_STATE LineStateRelative(const int ind_handle,const int index,const int buffer_num,const double level0,const double level1=EMPTY_VALUE)
  {
//--- Get the values of the indicator line with the shift (0,1) relative to the passed index
   const double value0=IndicatorValue(ind_handle,index,  buffer_num);
   const double value1=IndicatorValue(ind_handle,index+1,buffer_num);
//--- If at least one of the values could not be obtained, return an undefined value
   if(value0==EMPTY_VALUE || value1==EMPTY_VALUE)
      return LINE_STATE_NONE;
//--- Define the second level to compare
   double level=(level1==EMPTY_VALUE ? level0 : level1);
//--- The line is below the level (value1<level && value0<level0)
   if(NormalizeDouble(value1-level,ind_digits)<0 && NormalizeDouble(value0-level0,ind_digits)<0)
      return LINE_STATE_UNDER;
//--- The line is above the level (value1>level && value0>level0)
   if(NormalizeDouble(value1-level,ind_digits)>0 && NormalizeDouble(value0-level0,ind_digits)>0)
      return LINE_STATE_ABOVE;
//--- The line crossed the level upwards (value1<=level && value0>level0)
   if(NormalizeDouble(value1-level,ind_digits)<=0 && NormalizeDouble(value0-level0,ind_digits)>0)
      return LINE_STATE_CROSS_UP;
//--- The line crossed the level downwards (value1>=level && value0<level0)
   if(NormalizeDouble(value1-level,ind_digits)>=0 && NormalizeDouble(value0-level0,ind_digits)<0)
      return LINE_STATE_CROSS_DOWN;
//--- The line touched the level from below (value1<level0 && value0==level0)
   if(NormalizeDouble(value1-level,ind_digits)<0 && NormalizeDouble(value0-level0,ind_digits)==0)
      return LINE_STATE_TOUCH_BELOW;
//--- The line touched the level from above (value1>level0 && value0==level0)
   if(NormalizeDouble(value1-level,ind_digits)>0 && NormalizeDouble(value0-level0,ind_digits)==0)
      return LINE_STATE_TOUCH_BELOW;
//--- Line is equal to the level value (value1==level0 && value0==level0)
   if(NormalizeDouble(value1-level,ind_digits)==0 && NormalizeDouble(value0-level0,ind_digits)==0)
      return LINE_STATE_EQUALS;
//--- Undefined state
   return LINE_STATE_NONE;
  }
//+------------------------------------------------------------------+
//| Return the indicator line state description                      |
//+------------------------------------------------------------------+
string LineStateDescription(const ENUM_LINE_STATE state)
  {
   switch(state)
     {
      case LINE_STATE_UP         :  return "Up";
      case LINE_STATE_STOP_UP    :  return "Stop Up";
      case LINE_STATE_TURN_UP    :  return "Turn Up";
      case LINE_STATE_DOWN       :  return "Down";
      case LINE_STATE_STOP_DOWN  :  return "Stop Down";
      case LINE_STATE_TURN_DOWN  :  return "Turn Down";
      case LINE_STATE_ABOVE      :  return "Above level";
      case LINE_STATE_UNDER      :  return "Under level";
      case LINE_STATE_CROSS_UP   :  return "Crossing Up";
      case LINE_STATE_CROSS_DOWN :  return "Crossing Down";
      case LINE_STATE_TOUCH_BELOW:  return "Touch from Below";
      case LINE_STATE_TOUCH_ABOVE:  return "Touch from Above";
      case LINE_STATE_EQUALS     :  return "Equals";
      default                    :  return "Unknown";
     }
  }
Ao usar o painel informativo, os dados são exibidos por meio da função:
//+------------------------------------------------------------------+
//| Display data from the specified timeseries index to the panel    |
//+------------------------------------------------------------------+
void DrawData(const int index,const datetime time)
  {
//--- Declare the variables to receive data in them
   MqlTick  tick={0};
   MqlRates rates[1];

//--- Exit if unable to get the current prices
   if(!SymbolInfoTick(Symbol(),tick))
      return;
//--- Exit if unable to get the bar data by the specified index
   if(CopyRates(Symbol(),PERIOD_CURRENT,index,1,rates)!=1)
      return;

//--- Set font parameters for bar and indicator data headers
   int  size=0;
   uint flags=0;
   uint angle=0;
   string name=panel.FontParams(size,flags,angle);
   panel.SetFontParams(name,9,FW_BOLD);
   panel.DrawText("Bar data ["+(string)index+"]",3,panel.TableY1(0)-16,clrMaroon,panel.Width()-6);
   panel.DrawText("Indicator data ["+(string)index+"]",3,panel.TableY1(1)-16,clrGreen,panel.Width()-6);
//--- Set font parameters for bar and indicator data
   panel.SetFontParams(name,9);

//--- Display the data of the specified bar in table 0 on the panel
   panel.DrawText("Date",  panel.CellX(0,0,0)+2, panel.CellY(0,0,0)+2); panel.DrawText(TimeToString(  rates[0].time,TIME_DATE),     panel.CellX(0,0,1)+2, panel.CellY(0,0,1)+2,clrNONE,90);
   panel.DrawText("Time",  panel.CellX(0,1,0)+2, panel.CellY(0,1,0)+2); panel.DrawText(TimeToString(  rates[0].time,TIME_MINUTES),  panel.CellX(0,1,1)+2, panel.CellY(0,1,1)+2,clrNONE,90);
   panel.DrawText("Open",  panel.CellX(0,2,0)+2, panel.CellY(0,2,0)+2); panel.DrawText(DoubleToString(rates[0].open,Digits()),      panel.CellX(0,2,1)+2, panel.CellY(0,2,1)+2,clrNONE,90);
   panel.DrawText("High",  panel.CellX(0,3,0)+2, panel.CellY(0,3,0)+2); panel.DrawText(DoubleToString(rates[0].high,Digits()),      panel.CellX(0,3,1)+2, panel.CellY(0,3,1)+2,clrNONE,90);
   panel.DrawText("Low",   panel.CellX(0,4,0)+2, panel.CellY(0,4,0)+2); panel.DrawText(DoubleToString(rates[0].low,Digits()),       panel.CellX(0,4,1)+2, panel.CellY(0,4,1)+2,clrNONE,90);
   panel.DrawText("Close", panel.CellX(0,5,0)+2, panel.CellY(0,5,0)+2); panel.DrawText(DoubleToString(rates[0].close,Digits()),     panel.CellX(0,5,1)+2, panel.CellY(0,5,1)+2,clrNONE,90);

//--- Display the indicator data from the specified bar on the panel in table 1
   panel.DrawText(ind_title, panel.CellX(1,0,0)+2, panel.CellY(1,0,0)+2);
   double value=IndicatorValue(handle,index,0);
   string value_str=(value!=EMPTY_VALUE ? DoubleToString(value,ind_digits) : "");
   panel.DrawText(value_str,panel.CellX(1,0,1)+2,panel.CellY(1,0,1)+2,clrNONE,100);

//--- Display a description of the indicator line state relative to the overbought level
   string ovb=StringFormat("%+.2f",overbough);
   panel.DrawText("Overbough", panel.CellX(1,2,0)+2, panel.CellY(1,2,0)+2);
   panel.DrawText(ovb, panel.CellX(1,2,0)+66, panel.CellY(1,2,0)+2);
   ENUM_LINE_STATE state_ovb=LineStateRelative(handle,index,0,overbough);
//--- The label color changes depending on the value of the line relative to the level
   color clr=(state_ovb==LINE_STATE_CROSS_DOWN ? clrRed : clrNONE);
   string ovb_str=(state_ovb==LINE_STATE_ABOVE ? "Inside the area" : LineStateDescription(state_ovb));
   panel.DrawText(ovb_str,panel.CellX(1,2,1)+2,panel.CellY(1,2,1)+2,clr,100);

//--- Display a description of the indicator line state relative to the oversold level
   panel.DrawText("Oversold", panel.CellX(1,3,0)+2, panel.CellY(1,3,0)+2);
   string ovs=StringFormat("%+.2f",oversold);
   panel.DrawText(ovs, panel.CellX(1,3,0)+68, panel.CellY(1,3,0)+2);
   ENUM_LINE_STATE state_ovs=LineStateRelative(handle,index,0,oversold);
//--- The label color changes depending on the value of the line relative to the level
   clr=(state_ovs==LINE_STATE_CROSS_UP ? clrBlue : clrNONE);
   string ovs_str=(state_ovs==LINE_STATE_UNDER ? "Inside the area" : LineStateDescription(state_ovs));
   panel.DrawText(ovs_str,panel.CellX(1,3,1)+2,panel.CellY(1,3,1)+2,clr,100);

//--- Display a description of the indicator line state
   panel.DrawText("Line state", panel.CellX(1,1,0)+2, panel.CellY(1,1,0)+2);
   ENUM_LINE_STATE state=LineState(handle,index,0);
//--- The label color changes depending on the location of the line in the overbought/oversold areas
   clr=(state_ovb==LINE_STATE_ABOVE || state_ovb==LINE_STATE_CROSS_DOWN ? clrRed : state_ovs==LINE_STATE_UNDER || state_ovs==LINE_STATE_CROSS_UP ? clrBlue : clrNONE);
   panel.DrawText(LineStateDescription(state),panel.CellX(1,1,1)+2,panel.CellY(1,1,1)+2,clr,100);

//--- Redraw the chart to immediately display all changes on the panel
   ChartRedraw(ChartID());
  }
A localização da linha do indicador nas zonas de sobrecompra/sobrevenda é indicada no painel pela cor do texto.
Além disso, ao usar o painel informativo no manipulador de eventos OnChartEvent() do EA, o manipulador de eventos do painel é chamado, e os eventos são processados para obter o índice da barra sob o cursor:
//+------------------------------------------------------------------+
//| ChartEvent function                                              |
//+------------------------------------------------------------------+
void OnChartEvent(const int id,
                  const long &lparam,
                  const double &dparam,
                  const string &sparam)
  {
//--- Handling the panel
//--- Call the panel event handler
   panel.OnChartEvent(id,lparam,dparam,sparam);

//--- If the cursor moves or a click is made on the chart
   if(id==CHARTEVENT_MOUSE_MOVE || id==CHARTEVENT_CLICK)
     {
      //--- Declare the variables to record time and price coordinates in them
      datetime time=0;
      double price=0;
      int wnd=0;
      //--- If the cursor coordinates are converted to date and time
      if(ChartXYToTimePrice(ChartID(),(int)lparam,(int)dparam,wnd,time,price))
        {
         //--- write the bar index where the cursor is located to a global variable
         mouse_bar_index=iBarShift(Symbol(),PERIOD_CURRENT,time);
         //--- Display the bar data under the cursor on the panel
         DrawData(mouse_bar_index,time);
        }
     }

//--- If we received a custom event, display the appropriate message in the journal
   if(id>CHARTEVENT_CUSTOM)
     {
      //--- Here we can implement handling a click on the close button on the panel
      PrintFormat("%s: Event id=%ld, object id (lparam): %lu, event message (sparam): %s",__FUNCTION__,id,lparam,sparam);
     }
  }
Após a compilação e o lançamento do EA no gráfico, é possível controlar o valor e o estado da linha do indicador no painel informativo:
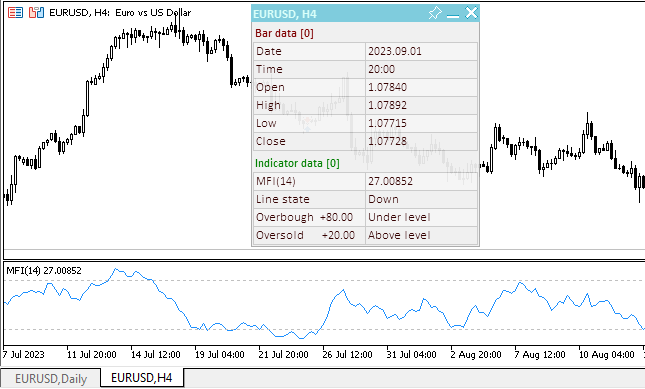
O arquivo do EA de teste "TestVolumeMFI.mq5" pode ser visualizado nos arquivos anexados ao artigo.
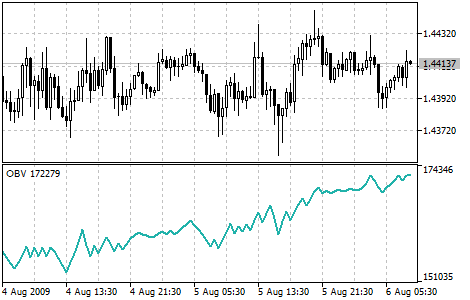
On Balance Volume
O indicador técnico Volume de Balanço (On Balance Volume, OBV) associa o volume à mudança de preço que acompanhou esse volume. A essência deste indicador, inventado por Joseph Granville, é simples. Se o preço de fechamento da barra atual é maior que o fechamento da barra anterior, o volume da barra atual é adicionado ao valor anterior do OBV; se o fechamento da barra atual é menor que o anterior, o volume atual é subtraído do valor anterior do Volume de Balanço.
A interpretação do indicador On Balance Volume se baseia no princípio de que as mudanças no OBV antecedem as mudanças nos preços. De acordo com esse princípio, um aumento no volume de balanço indica que operadores estão investindo no instrumento. Quando, mais tarde, o público geral começa a investir, tanto o preço quanto as leituras do indicador OBV começam a subir rapidamente.
Se o preço avançar à frente do indicador On Balance Volume, surge o chamado "ausência de confirmação". Isso pode ser observado no topo de um mercado em alta (quando o preço sobe sem o correspondente aumento do Volume de Balanço ou à frente dele) ou na base de um mercado em baixa (quando o preço cai sem a correspondente diminuição do Volume de Balanço ou à frente dele).
Pode-se falar de uma tendência ascendente do On Balance Volume se cada novo pico for mais alto que o anterior, e cada nova depressão for mais alta que a anterior. Por analogia, uma tendência descendente do OBV implica uma diminuição sequencial dos picos e depressões. Quando o OBV se move em um corredor horizontal, não formando picos e depressões sequencialmente crescentes ou decrescentes, trata-se de uma tendência indefinida.
Se uma tendência estiver estabelecida, ela permanece em vigor até o momento de uma reversão. A reversão na tendência do indicador On Balance Volume pode ocorrer de duas maneiras. No primeiro caso, a tendência muda de ascendente para descendente, ou de descendente para ascendente.
No segundo caso de mudança de tendência, o OBV passa para uma tendência indefinida e permanece assim por mais de três períodos. Assim, se a tendência de alta muda para indefinida e fica assim apenas por dois períodos, antes de voltar a subir, deve-se considerar que a tendência do OBV foi ascendente durante todo esse tempo.
Quando a tendência do indicador On Balance Volume muda para ascendente ou descendente, ocorre o que é chamado de "breakout" (rompimento). Como os breakouts do indicador geralmente antecedem os breakouts de preço, os investidores devem assumir posições longas em breakouts do OBV para cima e, respectivamente, vender em caso de breakout do OBV para baixo. As posições abertas devem ser mantidas até que a direção da tendência mude.
Parâmetros
Para criar um handle do indicador, usa-se a função iOBV():
Retorna o handle do indicador On Balance Volume. Apenas um buffer.
int  iOBV(
   string                symbol,             // symbol name
   ENUM_TIMEFRAMES       period,             // period
   ENUM_APPLIED_VOLUME   applied_volume      // type of volume used for calculations
   );
[in] Nome simbólico do instrumento cujos dados serão usados para calcular o indicador. NULL representa o símbolo atual.
period
[in] O valor do período pode ser um dos valores da enumeração ENUM_TIMEFRAMES, 0 significa o timeframe atual.
applied_volume
[in] Volume utilizado. Pode ser qualquer um dos valores da enumeração ENUM_APPLIED_VOLUME.
Retorna o handle do indicador técnico especificado, em caso de falha retorna INVALID_HANDLE. A função IndicatorRelease() é usada para liberar a memória do computador do indicador que não é mais usado; o handle desse indicador é passado para ela.
Para criar um indicador no EA, declaramos variáveis de entrada e globais:
//+------------------------------------------------------------------+
//|                                                TestVolumeOBV.mq5 |
//|                                  Copyright 2023, MetaQuotes Ltd. |
//|                                             https://www.mql5.com |
//+------------------------------------------------------------------+
#property copyright "Copyright 2023, MetaQuotes Ltd."
#property link      "https://www.mql5.com"
#property version   "1.00"
//--- enums
enum ENUM_LINE_STATE
  {
   LINE_STATE_NONE,        // Undefined state
   LINE_STATE_UP,          // Upward
   LINE_STATE_DOWN,        // Downward
   LINE_STATE_TURN_UP,     // Upward reversal
   LINE_STATE_TURN_DOWN,   // Downward reversal
   LINE_STATE_STOP_UP,     // Upward stop
   LINE_STATE_STOP_DOWN,   // Downward stop
   LINE_STATE_ABOVE,       // Above value
   LINE_STATE_UNDER,       // Below value
   LINE_STATE_CROSS_UP,    // Crossing value upwards
   LINE_STATE_CROSS_DOWN,  // Crossing value downwards
   LINE_STATE_TOUCH_BELOW, // Touching value from below
   LINE_STATE_TOUCH_ABOVE, // Touch value from above
   LINE_STATE_EQUALS,      // Equal to value
  };
//--- input parameters
input ENUM_APPLIED_VOLUME  InpVolume   =  VOLUME_TICK;   /* Applied Volume */
//--- global variables
int      handle=INVALID_HANDLE;  // Indicator handle
int      ind_digits=0;           // Number of decimal places in the indicator values
string   ind_title;              // Indicator description
Ao usar um painel informativo no EA, também declaramos variáveis globais para ele e incluímos o arquivo de classes do painel:
//+------------------------------------------------------------------+
//|                                                TestVolumeOBV.mq5 |
//|                                  Copyright 2023, MetaQuotes Ltd. |
//|                                             https://www.mql5.com |
//+------------------------------------------------------------------+
#property copyright "Copyright 2023, MetaQuotes Ltd."
#property link      "https://www.mql5.com"
#property version   "1.00"
//--- includes
#include <Dashboard\Dashboard.mqh>
//--- enums
enum ENUM_LINE_STATE
  {
   LINE_STATE_NONE,        // Undefined state
   LINE_STATE_UP,          // Upward
   LINE_STATE_DOWN,        // Downward
   LINE_STATE_TURN_UP,     // Upward reversal
   LINE_STATE_TURN_DOWN,   // Downward reversal
   LINE_STATE_STOP_UP,     // Upward stop
   LINE_STATE_STOP_DOWN,   // Downward stop
   LINE_STATE_ABOVE,       // Above value
   LINE_STATE_UNDER,       // Below value
   LINE_STATE_CROSS_UP,    // Crossing value upwards
   LINE_STATE_CROSS_DOWN,  // Crossing value downwards
   LINE_STATE_TOUCH_BELOW, // Touching value from below
   LINE_STATE_TOUCH_ABOVE, // Touch value from above
   LINE_STATE_EQUALS,      // Equal to value
  };
//--- input parameters
input ENUM_APPLIED_VOLUME  InpVolume   =  VOLUME_TICK;   /* Applied Volume */
//--- global variables
int      handle=INVALID_HANDLE;  // Indicator handle
int      ind_digits=0;           // Number of decimal places in the indicator values
string   ind_title;              // Indicator description
//--- variables for the panel
int      mouse_bar_index;        // Index of the bar the data is taken from
CDashboard *panel=NULL;          // Pointer to the panel object
Inicialização
Configuramos os valores das variáveis globais para o indicador e criamos seu handle:
//+------------------------------------------------------------------+
//| Expert initialization function                                   |
//+------------------------------------------------------------------+
int OnInit()
  {
//--- create timer
   EventSetTimer(60);

//--- Indicator
//--- Set the indicator name and the number of decimal places
   ind_title="OBV";
   ind_digits=0;
//--- Create indicator handle
   ResetLastError();
   handle=iOBV(Symbol(),PERIOD_CURRENT,InpVolume);
   if(handle==INVALID_HANDLE)
     {
      PrintFormat("%s: Failed to create indicator handle %s. Error %ld",__FUNCTION__,ind_title,GetLastError());
      return INIT_FAILED;
     }

//--- Successful initialization
   return(INIT_SUCCEEDED);
  }
Ao usar o painel informativo no EA, criamos o painel:
//+------------------------------------------------------------------+
//| Expert initialization function                                   |
//+------------------------------------------------------------------+
int OnInit()
  {
//--- create timer
   EventSetTimer(60);

//--- Indicator
//--- Set the indicator name and the number of decimal places
   ind_title="OBV";
   ind_digits=0;
//--- Create indicator handle
   ResetLastError();
   handle=iOBV(Symbol(),PERIOD_CURRENT,InpVolume);
   if(handle==INVALID_HANDLE)
     {
      PrintFormat("%s: Failed to create indicator handle %s. Error %ld",__FUNCTION__,ind_title,GetLastError());
      return INIT_FAILED;
     }

//--- Dashboard
//--- Create the panel
   panel=new CDashboard(1,20,20,199,225);
   if(panel==NULL)
     {
      Print("Error. Failed to create panel object");
      return INIT_FAILED;
     }
//--- Set font parameters
   panel.SetFontParams("Calibri",9);
//--- Display the panel with the "Symbol, Timeframe description" header text
   panel.View(Symbol()+", "+StringSubstr(EnumToString(Period()),7));
//--- Create a table with ID 0 to display bar data in it
   panel.CreateNewTable(0);
//--- Draw a table with ID 0 on the panel background
   panel.DrawGrid(0,2,20,6,2,18,97);

//--- Create a table with ID 1 to display indicator data in it
   panel.CreateNewTable(1);
//--- Get the Y2 table coordinate with ID 0 and
//--- set the Y1 coordinate for the table with ID 1
   int y1=panel.TableY2(0)+22;
//--- Draw a table with ID 1 on the panel background
   panel.DrawGrid(1,2,y1,3,2,18,97);

//--- Display tabular data in the journal
   panel.GridPrint(0,2);
   panel.GridPrint(1,2);
//--- Initialize the variable with the index of the mouse cursor bar
   mouse_bar_index=0;
//--- Display the data of the current bar on the panel
   DrawData(mouse_bar_index,TimeCurrent());

//--- Successful initialization
   return(INIT_SUCCEEDED);
  }
Desinicialização
No manipulador OnDeinit() do EA, liberamos o handle do indicador:
//+------------------------------------------------------------------+
//| Expert deinitialization function                                 |
//+------------------------------------------------------------------+
void OnDeinit(const int reason)
  {
//--- destroy timer
   EventKillTimer();

//--- Release handle of the indicator
   ResetLastError();
   if(!IndicatorRelease(handle))
      PrintFormat("%s: IndicatorRelease failed. Error %ld",__FUNCTION__,GetLastError());
//--- Clear all comments on the chart
   Comment("");
  }
Ao usar um painel informativo, removemos o objeto do painel criado:
//+------------------------------------------------------------------+
//| Expert deinitialization function                                 |
//+------------------------------------------------------------------+
void OnDeinit(const int reason)
  {
//--- destroy timer
   EventKillTimer();

//--- Release handle of the indicator
   ResetLastError();
   if(!IndicatorRelease(handle))
      PrintFormat("%s: IndicatorRelease failed. Error %ld",__FUNCTION__,GetLastError());
//--- Clear all comments on the chart
   Comment("");

//--- If the panel object exists, delete it
   if(panel!=NULL)
      delete panel;
  }
Recuperação de dados
A seguir, são apresentadas funções gerais para acessar dados pelo handle do indicador. As funções foram discutidas no artigo sobre a integração de osciladores aos EAs. As funções apresentadas podem ser usadas "como estão" em seus programas:
//+------------------------------------------------------------------+
//| Return the indicator data on the specified bar                   |
//+------------------------------------------------------------------+
double IndicatorValue(const int ind_handle,const int index,const int buffer_num)
  {
   double array[1]={0};
   ResetLastError();
   if(CopyBuffer(ind_handle,buffer_num,index,1,array)!=1)
     {
      PrintFormat("%s: CopyBuffer failed. Error %ld",__FUNCTION__,GetLastError());
      return EMPTY_VALUE;
     }
   return array[0];
  }
//+------------------------------------------------------------------+
//| Return the state of the indicator line                           |
//+------------------------------------------------------------------+
ENUM_LINE_STATE LineState(const int ind_handle,const int index,const int buffer_num)
  {
//--- Get the values of the indicator line with the shift (0,1,2) relative to the passed index
   const double value0=IndicatorValue(ind_handle,index,  buffer_num);
   const double value1=IndicatorValue(ind_handle,index+1,buffer_num);
   const double value2=IndicatorValue(ind_handle,index+2,buffer_num);
//--- If at least one of the values could not be obtained, return an undefined value
   if(value0==EMPTY_VALUE || value1==EMPTY_VALUE || value2==EMPTY_VALUE)
      return LINE_STATE_NONE;
//--- Line upward reversal (value2>value1 && value0>value1)
   if(NormalizeDouble(value2-value1,ind_digits)>0 && NormalizeDouble(value0-value1,ind_digits)>0)
      return LINE_STATE_TURN_UP;
//--- Line upward direction (value2<=value1 && value0>value1)
   else if(NormalizeDouble(value2-value1,ind_digits)<=0 && NormalizeDouble(value0-value1,ind_digits)>0)
      return LINE_STATE_UP;
//--- Line upward stop (value2<=value1 && value0==value1)
   else if(NormalizeDouble(value2-value1,ind_digits)<=0 && NormalizeDouble(value0-value1,ind_digits)==0)
      return LINE_STATE_STOP_UP;
//--- Line downward reversal (value2<value1 && value0<value1)
   if(NormalizeDouble(value2-value1,ind_digits)<0 && NormalizeDouble(value0-value1,ind_digits)<0)
      return LINE_STATE_TURN_DOWN;
//--- Line downward direction (value2>=value1 && value0<value1)
   else if(NormalizeDouble(value2-value1,ind_digits)>=0 && NormalizeDouble(value0-value1,ind_digits)<0)
      return LINE_STATE_DOWN;
//--- Line downward stop (value2>=value1 && value0==value1)
   else if(NormalizeDouble(value2-value1,ind_digits)>=0 && NormalizeDouble(value0-value1,ind_digits)==0)
      return LINE_STATE_STOP_DOWN;
//--- Undefined state
   return LINE_STATE_NONE;
  }
//+------------------------------------------------------------------+
//| Return the state of the line relative to the specified level     |
//+------------------------------------------------------------------+
ENUM_LINE_STATE LineStateRelative(const int ind_handle,const int index,const int buffer_num,const double level0,const double level1=EMPTY_VALUE)
  {
//--- Get the values of the indicator line with the shift (0,1) relative to the passed index
   const double value0=IndicatorValue(ind_handle,index,  buffer_num);
   const double value1=IndicatorValue(ind_handle,index+1,buffer_num);
//--- If at least one of the values could not be obtained, return an undefined value
   if(value0==EMPTY_VALUE || value1==EMPTY_VALUE)
      return LINE_STATE_NONE;
//--- Define the second level to compare
   double level=(level1==EMPTY_VALUE ? level0 : level1);
//--- The line is below the level (value1<level && value0<level0)
   if(NormalizeDouble(value1-level,ind_digits)<0 && NormalizeDouble(value0-level0,ind_digits)<0)
      return LINE_STATE_UNDER;
//--- The line is above the level (value1>level && value0>level0)
   if(NormalizeDouble(value1-level,ind_digits)>0 && NormalizeDouble(value0-level0,ind_digits)>0)
      return LINE_STATE_ABOVE;
//--- The line crossed the level upwards (value1<=level && value0>level0)
   if(NormalizeDouble(value1-level,ind_digits)<=0 && NormalizeDouble(value0-level0,ind_digits)>0)
      return LINE_STATE_CROSS_UP;
//--- The line crossed the level downwards (value1>=level && value0<level0)
   if(NormalizeDouble(value1-level,ind_digits)>=0 && NormalizeDouble(value0-level0,ind_digits)<0)
      return LINE_STATE_CROSS_DOWN;
//--- The line touched the level from below (value1<level0 && value0==level0)
   if(NormalizeDouble(value1-level,ind_digits)<0 && NormalizeDouble(value0-level0,ind_digits)==0)
      return LINE_STATE_TOUCH_BELOW;
//--- The line touched the level from above (value1>level0 && value0==level0)
   if(NormalizeDouble(value1-level,ind_digits)>0 && NormalizeDouble(value0-level0,ind_digits)==0)
      return LINE_STATE_TOUCH_BELOW;
//--- Line is equal to the level value (value1==level0 && value0==level0)
   if(NormalizeDouble(value1-level,ind_digits)==0 && NormalizeDouble(value0-level0,ind_digits)==0)
      return LINE_STATE_EQUALS;
//--- Undefined state
   return LINE_STATE_NONE;
  }
//+------------------------------------------------------------------+
//| Return the indicator line state description                      |
//+------------------------------------------------------------------+
string LineStateDescription(const ENUM_LINE_STATE state)
  {
   switch(state)
     {
      case LINE_STATE_UP         :  return "Up";
      case LINE_STATE_STOP_UP    :  return "Stop Up";
      case LINE_STATE_TURN_UP    :  return "Turn Up";
      case LINE_STATE_DOWN       :  return "Down";
      case LINE_STATE_STOP_DOWN  :  return "Stop Down";
      case LINE_STATE_TURN_DOWN  :  return "Turn Down";
      case LINE_STATE_ABOVE      :  return "Above level";
      case LINE_STATE_UNDER      :  return "Under level";
      case LINE_STATE_CROSS_UP   :  return "Crossing Up";
      case LINE_STATE_CROSS_DOWN :  return "Crossing Down";
      case LINE_STATE_TOUCH_BELOW:  return "Touch from Below";
      case LINE_STATE_TOUCH_ABOVE:  return "Touch from Above";
      case LINE_STATE_EQUALS     :  return "Equals";
      default                    :  return "Unknown";
     }
  }
Ao usar o painel informativo, os dados são exibidos por meio da função:
//+------------------------------------------------------------------+
//| Display data from the specified timeseries index to the panel    |
//+------------------------------------------------------------------+
void DrawData(const int index,const datetime time)
  {
//--- Declare the variables to receive data in them
   MqlTick  tick={0};
   MqlRates rates[1];

//--- Exit if unable to get the current prices
   if(!SymbolInfoTick(Symbol(),tick))
      return;
//--- Exit if unable to get the bar data by the specified index
   if(CopyRates(Symbol(),PERIOD_CURRENT,index,1,rates)!=1)
      return;

//--- Set font parameters for bar and indicator data headers
   int  size=0;
   uint flags=0;
   uint angle=0;
   string name=panel.FontParams(size,flags,angle);
   panel.SetFontParams(name,9,FW_BOLD);
   panel.DrawText("Bar data ["+(string)index+"]",3,panel.TableY1(0)-16,clrMaroon,panel.Width()-6);
   panel.DrawText("Indicator data ["+(string)index+"]",3,panel.TableY1(1)-16,clrGreen,panel.Width()-6);
//--- Set font parameters for bar and indicator data
   panel.SetFontParams(name,9);

//--- Display the data of the specified bar in table 0 on the panel
   panel.DrawText("Date",  panel.CellX(0,0,0)+2, panel.CellY(0,0,0)+2); panel.DrawText(TimeToString(  rates[0].time,TIME_DATE),     panel.CellX(0,0,1)+2, panel.CellY(0,0,1)+2,clrNONE,90);
   panel.DrawText("Time",  panel.CellX(0,1,0)+2, panel.CellY(0,1,0)+2); panel.DrawText(TimeToString(  rates[0].time,TIME_MINUTES),  panel.CellX(0,1,1)+2, panel.CellY(0,1,1)+2,clrNONE,90);
   panel.DrawText("Open",  panel.CellX(0,2,0)+2, panel.CellY(0,2,0)+2); panel.DrawText(DoubleToString(rates[0].open,Digits()),      panel.CellX(0,2,1)+2, panel.CellY(0,2,1)+2,clrNONE,90);
   panel.DrawText("High",  panel.CellX(0,3,0)+2, panel.CellY(0,3,0)+2); panel.DrawText(DoubleToString(rates[0].high,Digits()),      panel.CellX(0,3,1)+2, panel.CellY(0,3,1)+2,clrNONE,90);
   panel.DrawText("Low",   panel.CellX(0,4,0)+2, panel.CellY(0,4,0)+2); panel.DrawText(DoubleToString(rates[0].low,Digits()),       panel.CellX(0,4,1)+2, panel.CellY(0,4,1)+2,clrNONE,90);
   panel.DrawText("Close", panel.CellX(0,5,0)+2, panel.CellY(0,5,0)+2); panel.DrawText(DoubleToString(rates[0].close,Digits()),     panel.CellX(0,5,1)+2, panel.CellY(0,5,1)+2,clrNONE,90);

//--- Display the indicator data from the specified bar on the panel in table 1
   panel.DrawText(ind_title, panel.CellX(1,0,0)+2, panel.CellY(1,0,0)+2);
   double value=IndicatorValue(handle,index,0);
   string value_str=(value!=EMPTY_VALUE ? DoubleToString(value,ind_digits) : "");
   panel.DrawText(value_str,panel.CellX(1,0,1)+2,panel.CellY(1,0,1)+2,clrNONE,90);

//--- Display a description of the indicator line state
   panel.DrawText("Line state", panel.CellX(1,1,0)+2, panel.CellY(1,1,0)+2);
   ENUM_LINE_STATE state=LineState(handle,index,0);
   panel.DrawText(LineStateDescription(state),panel.CellX(1,1,1)+2,panel.CellY(1,1,1)+2,clrNONE,90);

//--- Redraw the chart to immediately display all changes on the panel
   ChartRedraw(ChartID());
  }
Além disso, ao usar o painel informativo no manipulador de eventos OnChartEvent() do EA, o manipulador de eventos do painel é chamado, e os eventos são processados para obter o índice da barra sob o cursor:
//+------------------------------------------------------------------+
//| ChartEvent function                                              |
//+------------------------------------------------------------------+
void OnChartEvent(const int id,
                  const long &lparam,
                  const double &dparam,
                  const string &sparam)
  {
//--- Handling the panel
//--- Call the panel event handler
   panel.OnChartEvent(id,lparam,dparam,sparam);

//--- If the cursor moves or a click is made on the chart
   if(id==CHARTEVENT_MOUSE_MOVE || id==CHARTEVENT_CLICK)
     {
      //--- Declare the variables to record time and price coordinates in them
      datetime time=0;
      double price=0;
      int wnd=0;
      //--- If the cursor coordinates are converted to date and time
      if(ChartXYToTimePrice(ChartID(),(int)lparam,(int)dparam,wnd,time,price))
        {
         //--- write the bar index where the cursor is located to a global variable
         mouse_bar_index=iBarShift(Symbol(),PERIOD_CURRENT,time);
         //--- Display the bar data under the cursor on the panel
         DrawData(mouse_bar_index,time);
        }
     }

//--- If we received a custom event, display the appropriate message in the journal
   if(id>CHARTEVENT_CUSTOM)
     {
      //--- Here we can implement handling a click on the close button on the panel
      PrintFormat("%s: Event id=%ld, object id (lparam): %lu, event message (sparam): %s",__FUNCTION__,id,lparam,sparam);
     }
  }
Após a compilação e execução do EA no gráfico, podemos monitorar o valor e o estado da linha do indicador no painel informativo:
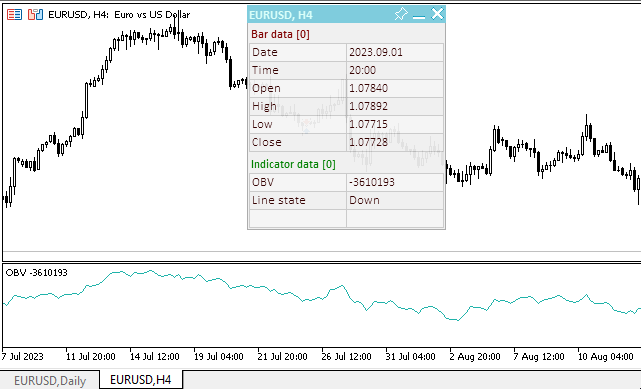
O arquivo do EA de teste "TestVolumeOBV.mq5" pode ser visto nos arquivos anexados ao artigo.
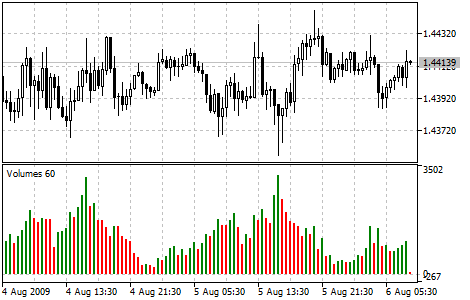
Volumes
Para o mercado Forex, o indicador Volumes representa a quantidade de mudanças de preço durante cada período do timeframe selecionado. Para instrumentos de bolsa, este indicador é um indicador dos volumes realmente negociados (contratos, dinheiro, coisas, etc.).
Parâmetros
Para criar o handle do indicador, é usada a função iVolumes():
Retorna o handle do indicador que mostra os volumes. Apenas um buffer.
int  iVolumes(
   string               symbol,             // symbol name
   ENUM_TIMEFRAMES      period,             // period
   ENUM_APPLIED_VOLUME  applied_volume      // volume type
   )
symbol
[in] Nome simbólico do instrumento cujos dados serão usados para calcular o indicador. NULL significa o símbolo atual.
period
[in] O valor do período pode ser um dos valores da enumeração ENUM_TIMEFRAMES, 0 significa o timeframe atual.
applied_volume
[in] Volume utilizado. Pode ser qualquer um dos valores da enumeração ENUM_APPLIED_VOLUME.
Retorna o handle do indicador técnico especificado, em caso de falha retorna INVALID_HANDLE. A função IndicatorRelease() é usada para liberar a memória do computador do indicador que não é mais usado; o handle desse indicador é passado para ela.
Para criar um indicador no EA, declaramos variáveis de entrada e globais:
//+------------------------------------------------------------------+
//|                                                TestVolumeOBV.mq5 |
//|                                  Copyright 2023, MetaQuotes Ltd. |
//|                                             https://www.mql5.com |
//+------------------------------------------------------------------+
#property copyright "Copyright 2023, MetaQuotes Ltd."
#property link      "https://www.mql5.com"
#property version   "1.00"
//--- enums
enum ENUM_LINE_STATE
  {
   LINE_STATE_NONE,        // Undefined state
   LINE_STATE_UP,          // Upward
   LINE_STATE_DOWN,        // Downward
   LINE_STATE_TURN_UP,     // Upward reversal
   LINE_STATE_TURN_DOWN,   // Downward reversal
   LINE_STATE_STOP_UP,     // Upward stop
   LINE_STATE_STOP_DOWN,   // Downward stop
   LINE_STATE_ABOVE,       // Above value
   LINE_STATE_UNDER,       // Below value
   LINE_STATE_CROSS_UP,    // Crossing value upwards
   LINE_STATE_CROSS_DOWN,  // Crossing value downwards
   LINE_STATE_TOUCH_BELOW, // Touching value from below
   LINE_STATE_TOUCH_ABOVE, // Touch value from above
   LINE_STATE_EQUALS,      // Equal to value
  };
//--- input parameters
input ENUM_APPLIED_VOLUME  InpVolume   =  VOLUME_TICK;   /* Applied Volume */
//--- global variables
int      handle=INVALID_HANDLE;  // Indicator handle
int      ind_digits=0;           // Number of decimal places in the indicator values
string   ind_title;              // Indicator description
Ao usar um painel informativo no EA, também declaramos variáveis globais para ele e incluímos o arquivo de classes do painel:
//+------------------------------------------------------------------+
//|                                                TestVolumeOBV.mq5 |
//|                                  Copyright 2023, MetaQuotes Ltd. |
//|                                             https://www.mql5.com |
//+------------------------------------------------------------------+
#property copyright "Copyright 2023, MetaQuotes Ltd."
#property link      "https://www.mql5.com"
#property version   "1.00"
//--- includes
#include <Dashboard\Dashboard.mqh>
//--- enums
enum ENUM_LINE_STATE
  {
   LINE_STATE_NONE,        // Undefined state
   LINE_STATE_UP,          // Upward
   LINE_STATE_DOWN,        // Downward
   LINE_STATE_TURN_UP,     // Upward reversal
   LINE_STATE_TURN_DOWN,   // Downward reversal
   LINE_STATE_STOP_UP,     // Upward stop
   LINE_STATE_STOP_DOWN,   // Downward stop
   LINE_STATE_ABOVE,       // Above value
   LINE_STATE_UNDER,       // Below value
   LINE_STATE_CROSS_UP,    // Crossing value upwards
   LINE_STATE_CROSS_DOWN,  // Crossing value downwards
   LINE_STATE_TOUCH_BELOW, // Touching value from below
   LINE_STATE_TOUCH_ABOVE, // Touch value from above
   LINE_STATE_EQUALS,      // Equal to value
  };
//--- input parameters
input ENUM_APPLIED_VOLUME  InpVolume   =  VOLUME_TICK;   /* Applied Volume */
//--- global variables
int      handle=INVALID_HANDLE;  // Indicator handle
int      ind_digits=0;           // Number of decimal places in the indicator values
string   ind_title;              // Indicator description
//--- variables for the panel
int      mouse_bar_index;        // Index of the bar the data is taken from
CDashboard *panel=NULL;          // Pointer to the panel object
Inicialização
Configuramos os valores das variáveis globais para o indicador e criamos seu handle:
//+------------------------------------------------------------------+
//| Expert initialization function                                   |
//+------------------------------------------------------------------+
int OnInit()
  {
//--- create timer
   EventSetTimer(60);

//--- Indicator
//--- Set the indicator name and the number of decimal places
   ind_title="Volumes";
   ind_digits=0;
//--- Create indicator handle
   ResetLastError();
   handle=iVolumes(Symbol(),PERIOD_CURRENT,InpVolume);
   if(handle==INVALID_HANDLE)
     {
      PrintFormat("%s: Failed to create indicator handle %s. Error %ld",__FUNCTION__,ind_title,GetLastError());
      return INIT_FAILED;
     }

//--- Successful initialization
   return(INIT_SUCCEEDED);
  }
Ao usar o painel informativo no EA, criamos o painel:
//+------------------------------------------------------------------+
//| Expert initialization function                                   |
//+------------------------------------------------------------------+
int OnInit()
  {
//--- create timer
   EventSetTimer(60);

//--- Indicator
//--- Set the indicator name and the number of decimal places
   ind_title="Volumes";
   ind_digits=0;
//--- Create indicator handle
   ResetLastError();
   handle=iVolumes(Symbol(),PERIOD_CURRENT,InpVolume);
   if(handle==INVALID_HANDLE)
     {
      PrintFormat("%s: Failed to create indicator handle %s. Error %ld",__FUNCTION__,ind_title,GetLastError());
      return INIT_FAILED;
     }

//--- Dashboard
//--- Create the panel
   panel=new CDashboard(1,20,20,199,225);
   if(panel==NULL)
     {
      Print("Error. Failed to create panel object");
      return INIT_FAILED;
     }
//--- Set font parameters
   panel.SetFontParams("Calibri",9);
//--- Display the panel with the "Symbol, Timeframe description" header text
   panel.View(Symbol()+", "+StringSubstr(EnumToString(Period()),7));
//--- Create a table with ID 0 to display bar data in it
   panel.CreateNewTable(0);
//--- Draw a table with ID 0 on the panel background
   panel.DrawGrid(0,2,20,6,2,18,97);

//--- Create a table with ID 1 to display indicator data in it
   panel.CreateNewTable(1);
//--- Get the Y2 table coordinate with ID 0 and
//--- set the Y1 coordinate for the table with ID 1
   int y1=panel.TableY2(0)+22;
//--- Draw a table with ID 1 on the panel background
   panel.DrawGrid(1,2,y1,3,2,18,97);

//--- Display tabular data in the journal
   panel.GridPrint(0,2);
   panel.GridPrint(1,2);
//--- Initialize the variable with the index of the mouse cursor bar
   mouse_bar_index=0;
//--- Display the data of the current bar on the panel
   DrawData(mouse_bar_index,TimeCurrent());

//--- Successful initialization
   return(INIT_SUCCEEDED);
  }
Desinicialização
No manipulador OnDeinit() do EA, liberamos o handle do indicador:
//+------------------------------------------------------------------+
//| Expert deinitialization function                                 |
//+------------------------------------------------------------------+
void OnDeinit(const int reason)
  {
//--- destroy timer
   EventKillTimer();

//--- Release handle of the indicator
   ResetLastError();
   if(!IndicatorRelease(handle))
      PrintFormat("%s: IndicatorRelease failed. Error %ld",__FUNCTION__,GetLastError());
//--- Clear all comments on the chart
   Comment("");
  }
Ao usar o painel informativo, removemos o objeto do painel criado:
//+------------------------------------------------------------------+
//| Expert deinitialization function                                 |
//+------------------------------------------------------------------+
void OnDeinit(const int reason)
  {
//--- destroy timer
   EventKillTimer();

//--- Release handle of the indicator
   ResetLastError();
   if(!IndicatorRelease(handle))
      PrintFormat("%s: IndicatorRelease failed. Error %ld",__FUNCTION__,GetLastError());
//--- Clear all comments on the chart
   Comment("");

//--- If the panel object exists, delete it
   if(panel!=NULL)
      delete panel;
  }
Recuperação de dados
A seguir, são apresentadas funções gerais para acessar dados pelo handle do indicador. As funções foram discutidas no artigo sobre a integração de osciladores aos EAs. As funções apresentadas podem ser usadas "como estão" em seus programas:
//+------------------------------------------------------------------+
//| Return the indicator data on the specified bar                   |
//+------------------------------------------------------------------+
double IndicatorValue(const int ind_handle,const int index,const int buffer_num)
  {
   double array[1]={0};
   ResetLastError();
   if(CopyBuffer(ind_handle,buffer_num,index,1,array)!=1)
     {
      PrintFormat("%s: CopyBuffer failed. Error %ld",__FUNCTION__,GetLastError());
      return EMPTY_VALUE;
     }
   return array[0];
  }
//+------------------------------------------------------------------+
//| Return the state of the indicator line                           |
//+------------------------------------------------------------------+
ENUM_LINE_STATE LineState(const int ind_handle,const int index,const int buffer_num)
  {
//--- Get the values of the indicator line with the shift (0,1,2) relative to the passed index
   const double value0=IndicatorValue(ind_handle,index,  buffer_num);
   const double value1=IndicatorValue(ind_handle,index+1,buffer_num);
   const double value2=IndicatorValue(ind_handle,index+2,buffer_num);
//--- If at least one of the values could not be obtained, return an undefined value
   if(value0==EMPTY_VALUE || value1==EMPTY_VALUE || value2==EMPTY_VALUE)
      return LINE_STATE_NONE;
//--- Line upward reversal (value2>value1 && value0>value1)
   if(NormalizeDouble(value2-value1,ind_digits)>0 && NormalizeDouble(value0-value1,ind_digits)>0)
      return LINE_STATE_TURN_UP;
//--- Line upward direction (value2<=value1 && value0>value1)
   else if(NormalizeDouble(value2-value1,ind_digits)<=0 && NormalizeDouble(value0-value1,ind_digits)>0)
      return LINE_STATE_UP;
//--- Line upward stop (value2<=value1 && value0==value1)
   else if(NormalizeDouble(value2-value1,ind_digits)<=0 && NormalizeDouble(value0-value1,ind_digits)==0)
      return LINE_STATE_STOP_UP;
//--- Line downward reversal (value2<value1 && value0<value1)
   if(NormalizeDouble(value2-value1,ind_digits)<0 && NormalizeDouble(value0-value1,ind_digits)<0)
      return LINE_STATE_TURN_DOWN;
//--- Line downward direction (value2>=value1 && value0<value1)
   else if(NormalizeDouble(value2-value1,ind_digits)>=0 && NormalizeDouble(value0-value1,ind_digits)<0)
      return LINE_STATE_DOWN;
//--- Line downward stop (value2>=value1 && value0==value1)
   else if(NormalizeDouble(value2-value1,ind_digits)>=0 && NormalizeDouble(value0-value1,ind_digits)==0)
      return LINE_STATE_STOP_DOWN;
//--- Undefined state
   return LINE_STATE_NONE;
  }
//+------------------------------------------------------------------+
//| Return the state of the line relative to the specified level     |
//+------------------------------------------------------------------+
ENUM_LINE_STATE LineStateRelative(const int ind_handle,const int index,const int buffer_num,const double level0,const double level1=EMPTY_VALUE)
  {
//--- Get the values of the indicator line with the shift (0,1) relative to the passed index
   const double value0=IndicatorValue(ind_handle,index,  buffer_num);
   const double value1=IndicatorValue(ind_handle,index+1,buffer_num);
//--- If at least one of the values could not be obtained, return an undefined value
   if(value0==EMPTY_VALUE || value1==EMPTY_VALUE)
      return LINE_STATE_NONE;
//--- Define the second level to compare
   double level=(level1==EMPTY_VALUE ? level0 : level1);
//--- The line is below the level (value1<level && value0<level0)
   if(NormalizeDouble(value1-level,ind_digits)<0 && NormalizeDouble(value0-level0,ind_digits)<0)
      return LINE_STATE_UNDER;
//--- The line is above the level (value1>level && value0>level0)
   if(NormalizeDouble(value1-level,ind_digits)>0 && NormalizeDouble(value0-level0,ind_digits)>0)
      return LINE_STATE_ABOVE;
//--- The line crossed the level upwards (value1<=level && value0>level0)
   if(NormalizeDouble(value1-level,ind_digits)<=0 && NormalizeDouble(value0-level0,ind_digits)>0)
      return LINE_STATE_CROSS_UP;
//--- The line crossed the level downwards (value1>=level && value0<level0)
   if(NormalizeDouble(value1-level,ind_digits)>=0 && NormalizeDouble(value0-level0,ind_digits)<0)
      return LINE_STATE_CROSS_DOWN;
//--- The line touched the level from below (value1<level0 && value0==level0)
   if(NormalizeDouble(value1-level,ind_digits)<0 && NormalizeDouble(value0-level0,ind_digits)==0)
      return LINE_STATE_TOUCH_BELOW;
//--- The line touched the level from above (value1>level0 && value0==level0)
   if(NormalizeDouble(value1-level,ind_digits)>0 && NormalizeDouble(value0-level0,ind_digits)==0)
      return LINE_STATE_TOUCH_BELOW;
//--- Line is equal to the level value (value1==level0 && value0==level0)
   if(NormalizeDouble(value1-level,ind_digits)==0 && NormalizeDouble(value0-level0,ind_digits)==0)
      return LINE_STATE_EQUALS;
//--- Undefined state
   return LINE_STATE_NONE;
  }
//+------------------------------------------------------------------+
//| Return the indicator line state description                      |
//+------------------------------------------------------------------+
string LineStateDescription(const ENUM_LINE_STATE state)
  {
   switch(state)
     {
      case LINE_STATE_UP         :  return "Up";
      case LINE_STATE_STOP_UP    :  return "Stop Up";
      case LINE_STATE_TURN_UP    :  return "Turn Up";
      case LINE_STATE_DOWN       :  return "Down";
      case LINE_STATE_STOP_DOWN  :  return "Stop Down";
      case LINE_STATE_TURN_DOWN  :  return "Turn Down";
      case LINE_STATE_ABOVE      :  return "Above level";
      case LINE_STATE_UNDER      :  return "Under level";
      case LINE_STATE_CROSS_UP   :  return "Crossing Up";
      case LINE_STATE_CROSS_DOWN :  return "Crossing Down";
      case LINE_STATE_TOUCH_BELOW:  return "Touch from Below";
      case LINE_STATE_TOUCH_ABOVE:  return "Touch from Above";
      case LINE_STATE_EQUALS     :  return "Equals";
      default                    :  return "Unknown";
     }
  }
Ao usar o painel informativo, os dados são exibidos por meio da função:
//+------------------------------------------------------------------+
//| Display data from the specified timeseries index to the panel    |
//+------------------------------------------------------------------+
void DrawData(const int index,const datetime time)
  {
//--- Declare the variables to receive data in them
   MqlTick  tick={0};
   MqlRates rates[1];

//--- Exit if unable to get the current prices
   if(!SymbolInfoTick(Symbol(),tick))
      return;
//--- Exit if unable to get the bar data by the specified index
   if(CopyRates(Symbol(),PERIOD_CURRENT,index,1,rates)!=1)
      return;

//--- Set font parameters for bar and indicator data headers
   int  size=0;
   uint flags=0;
   uint angle=0;
   string name=panel.FontParams(size,flags,angle);
   panel.SetFontParams(name,9,FW_BOLD);
   panel.DrawText("Bar data ["+(string)index+"]",3,panel.TableY1(0)-16,clrMaroon,panel.Width()-6);
   panel.DrawText("Indicator data ["+(string)index+"]",3,panel.TableY1(1)-16,clrGreen,panel.Width()-6);
//--- Set font parameters for bar and indicator data
   panel.SetFontParams(name,9);

//--- Display the data of the specified bar in table 0 on the panel
   panel.DrawText("Date",  panel.CellX(0,0,0)+2, panel.CellY(0,0,0)+2); panel.DrawText(TimeToString(  rates[0].time,TIME_DATE),     panel.CellX(0,0,1)+2, panel.CellY(0,0,1)+2,clrNONE,90);
   panel.DrawText("Time",  panel.CellX(0,1,0)+2, panel.CellY(0,1,0)+2); panel.DrawText(TimeToString(  rates[0].time,TIME_MINUTES),  panel.CellX(0,1,1)+2, panel.CellY(0,1,1)+2,clrNONE,90);
   panel.DrawText("Open",  panel.CellX(0,2,0)+2, panel.CellY(0,2,0)+2); panel.DrawText(DoubleToString(rates[0].open,Digits()),      panel.CellX(0,2,1)+2, panel.CellY(0,2,1)+2,clrNONE,90);
   panel.DrawText("High",  panel.CellX(0,3,0)+2, panel.CellY(0,3,0)+2); panel.DrawText(DoubleToString(rates[0].high,Digits()),      panel.CellX(0,3,1)+2, panel.CellY(0,3,1)+2,clrNONE,90);
   panel.DrawText("Low",   panel.CellX(0,4,0)+2, panel.CellY(0,4,0)+2); panel.DrawText(DoubleToString(rates[0].low,Digits()),       panel.CellX(0,4,1)+2, panel.CellY(0,4,1)+2,clrNONE,90);
   panel.DrawText("Close", panel.CellX(0,5,0)+2, panel.CellY(0,5,0)+2); panel.DrawText(DoubleToString(rates[0].close,Digits()),     panel.CellX(0,5,1)+2, panel.CellY(0,5,1)+2,clrNONE,90);

//--- Display the indicator data from the specified bar on the panel in table 1
   panel.DrawText(ind_title, panel.CellX(1,0,0)+2, panel.CellY(1,0,0)+2);
   double value0=IndicatorValue(handle,index,  0);
   double value1=IndicatorValue(handle,index+1,0);
   string value_str=(value0!=EMPTY_VALUE ? DoubleToString(value0,ind_digits) : "");
   color clr=(value0>value1 ? clrGreen : value0<value1 ? clrRed : clrNONE);
   panel.DrawText(value_str,panel.CellX(1,0,1)+2,panel.CellY(1,0,1)+2,clrNONE,90);

//--- Display a description of the indicator line state
   panel.DrawText("Line state", panel.CellX(1,1,0)+2, panel.CellY(1,1,0)+2);
   ENUM_LINE_STATE state=LineState(handle,index,0);
   panel.DrawText(LineStateDescription(state),panel.CellX(1,1,1)+2,panel.CellY(1,1,1)+2,clr,90);

//--- Redraw the chart to immediately display all changes on the panel
   ChartRedraw(ChartID());
  }
A cor do texto dos estados no painel corresponde à cor da coluna do indicador sob o cursor.
Além disso, ao usar o painel informativo no manipulador de eventos OnChartEvent() do EA, o manipulador de eventos do painel é chamado, e os eventos são processados para obter o índice da barra sob o cursor:
//+------------------------------------------------------------------+
//| ChartEvent function                                              |
//+------------------------------------------------------------------+
void OnChartEvent(const int id,
                  const long &lparam,
                  const double &dparam,
                  const string &sparam)
  {
//--- Handling the panel
//--- Call the panel event handler
   panel.OnChartEvent(id,lparam,dparam,sparam);

//--- If the cursor moves or a click is made on the chart
   if(id==CHARTEVENT_MOUSE_MOVE || id==CHARTEVENT_CLICK)
     {
      //--- Declare the variables to record time and price coordinates in them
      datetime time=0;
      double price=0;
      int wnd=0;
      //--- If the cursor coordinates are converted to date and time
      if(ChartXYToTimePrice(ChartID(),(int)lparam,(int)dparam,wnd,time,price))
        {
         //--- write the bar index where the cursor is located to a global variable
         mouse_bar_index=iBarShift(Symbol(),PERIOD_CURRENT,time);
         //--- Display the bar data under the cursor on the panel
         DrawData(mouse_bar_index,time);
        }
     }

//--- If we received a custom event, display the appropriate message in the journal
   if(id>CHARTEVENT_CUSTOM)
     {
      //--- Here we can implement handling a click on the close button on the panel
      PrintFormat("%s: Event id=%ld, object id (lparam): %lu, event message (sparam): %s",__FUNCTION__,id,lparam,sparam);
     }
  }
Após a compilação e execução do EA no gráfico, podemos monitorar o valor e o estado da linha do indicador no painel informativo:
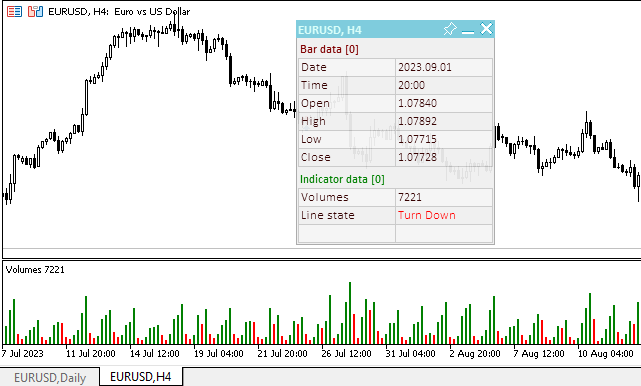
O arquivo do Expert Advisor de teste "TestVolumeVolumes.mq5" pode ser visualizado nos arquivos anexados ao artigo.
Indicadores de Bill Williams
Os indicadores de Bill Williams são destacados em um grupo separado, pois são parte integrante do sistema de negociação descrito em seus livros.
Accelerator Oscillator
O preço é o último elemento a mudar. Antes de o preço mudar, a força motriz do mercado muda, e antes da força motriz mudar de direção, a aceleração da força motriz precisa desacelerar e chegar a zero. Então, ela começa a acelerar na direção oposta até que o preço comece a mudar sua direção.
O indicador técnico Aceleração/Desaceleração (Acceleration/Deceleration, Accelerator/Decelerator Oscillator, AC) mede a aceleração e a desaceleração da força motriz atual. Este indicador mudará de direção antes da mudança da força motriz, que por sua vez mudará de direção antes da mudança do preço. Entender que o AC é um sinal de aviso mais precoce oferece vantagens claras.
A linha zero é, essencialmente, o lugar onde a força motriz está equilibrada com a aceleração. Se o Oscilador de Aceleração/Desaceleração estiver acima de zero, normalmente é mais fácil para a aceleração continuar seu movimento ascendente (e vice-versa, quando abaixo de zero). Ao contrário do Awesome Oscillator, o cruzamento da linha zero não representa um sinal. A única coisa necessária para monitorar o mercado e tomar decisões é prestar atenção na mudança de cor. Para evitar reflexões sérias, é importante lembrar: com o AC, não é aconselhável comprar quando a coluna atual está colorida de vermelho, e não é aconselhável vender quando a coluna atual está colorida de verde.
Se entrar no mercado na direção da força motriz (o indicador de Aceleração/Desaceleração está acima de zero para compras, ou abaixo de zero para vendas), apenas dois pilares verdes são necessários para comprar (dois pilares vermelhos para vender). Se a força motriz for contra a posição aberta (indicador abaixo de zero para compras, ou acima de zero para vendas), é necessário uma confirmação, portanto, um pilar adicional é necessário. Neste caso, é necessário que o indicador mostre três colunas vermelhas acima da linha zero para uma posição curta e três colunas verdes abaixo da linha zero para uma longa.
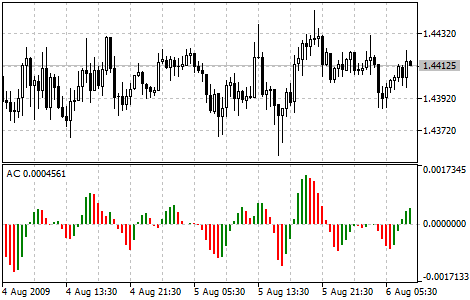
Parâmetros
Para criar um handle do indicador, é utilizada a função iAC():
Cria o indicador Oscilador de Aceleração e retorna seu handle. Apenas um buffer.
int  iAC(
   string           symbol,     // symbol name
   ENUM_TIMEFRAMES  period      // period
   );
symbol
[in] Nome simbólico do instrumento cujos dados serão usados para calcular o indicador. NULL representa o símbolo atual.
period
[in] O valor do período pode ser um dos valores da enumeração ENUM_TIMEFRAMES, 0 significa o timeframe atual.
Retorna o handle do indicador técnico especificado, em caso de falha retorna INVALID_HANDLE. A função IndicatorRelease() é usada para liberar a memória do computador do indicador que não é mais usado; o handle desse indicador é passado para ela.
Para criar o indicador no Expert Advisor, declaramos variáveis globais (o indicador não tem parâmetros de entrada além da configuração das cores das colunas ascendentes e descendentes do histograma):
//+------------------------------------------------------------------+
//|                                               TestWilliamsAC.mq5 |
//|                                  Copyright 2023, MetaQuotes Ltd. |
//|                                             https://www.mql5.com |
//+------------------------------------------------------------------+
#property copyright "Copyright 2023, MetaQuotes Ltd."
#property link      "https://www.mql5.com"
#property version   "1.00"
//--- enums
enum ENUM_LINE_STATE
  {
   LINE_STATE_NONE,        // Undefined state
   LINE_STATE_UP,          // Upward
   LINE_STATE_DOWN,        // Downward
   LINE_STATE_TURN_UP,     // Upward reversal
   LINE_STATE_TURN_DOWN,   // Downward reversal
   LINE_STATE_STOP_UP,     // Upward stop
   LINE_STATE_STOP_DOWN,   // Downward stop
   LINE_STATE_ABOVE,       // Above value
   LINE_STATE_UNDER,       // Below value
   LINE_STATE_CROSS_UP,    // Crossing value upwards
   LINE_STATE_CROSS_DOWN,  // Crossing value downwards
   LINE_STATE_TOUCH_BELOW, // Touching value from below
   LINE_STATE_TOUCH_ABOVE, // Touch value from above
   LINE_STATE_EQUALS,      // Equal to value
  };
//--- global variables
int      handle=INVALID_HANDLE;  // Indicator handle
int      ind_digits=0;           // Number of decimal places in the indicator values
string   ind_title;              // Indicator description
Ao usar um painel informativo no EA, também declaramos variáveis globais para ele e incluímos o arquivo de classes do painel:
//+------------------------------------------------------------------+
//|                                               TestWilliamsAC.mq5 |
//|                                  Copyright 2023, MetaQuotes Ltd. |
//|                                             https://www.mql5.com |
//+------------------------------------------------------------------+
#property copyright "Copyright 2023, MetaQuotes Ltd."
#property link      "https://www.mql5.com"
#property version   "1.00"
//--- includes
#include <Dashboard\Dashboard.mqh>
//--- enums
enum ENUM_LINE_STATE
  {
   LINE_STATE_NONE,        // Undefined state
   LINE_STATE_UP,          // Upward
   LINE_STATE_DOWN,        // Downward
   LINE_STATE_TURN_UP,     // Upward reversal
   LINE_STATE_TURN_DOWN,   // Downward reversal
   LINE_STATE_STOP_UP,     // Upward stop
   LINE_STATE_STOP_DOWN,   // Downward stop
   LINE_STATE_ABOVE,       // Above value
   LINE_STATE_UNDER,       // Below value
   LINE_STATE_CROSS_UP,    // Crossing value upwards
   LINE_STATE_CROSS_DOWN,  // Crossing value downwards
   LINE_STATE_TOUCH_BELOW, // Touching value from below
   LINE_STATE_TOUCH_ABOVE, // Touch value from above
   LINE_STATE_EQUALS,      // Equal to value
  };
//--- global variables
int      handle=INVALID_HANDLE;  // Indicator handle
int      ind_digits=0;           // Number of decimal places in the indicator values
string   ind_title;              // Indicator description
//--- variables for the panel
int      mouse_bar_index;        // Index of the bar the data is taken from
CDashboard *panel=NULL;          // Pointer to the panel object
Inicialização
Configuramos os valores das variáveis globais para o indicador e criamos seu handle:
//+------------------------------------------------------------------+
//| Expert initialization function                                   |
//+------------------------------------------------------------------+
int OnInit()
  {
//--- create timer
   EventSetTimer(60);

//--- Indicator
//--- Set the indicator name and the number of decimal places
   ind_title="AC";
   ind_digits=Digits()+2;
//--- Create indicator handle
   ResetLastError();
   handle=iAC(Symbol(),PERIOD_CURRENT);
   if(handle==INVALID_HANDLE)
     {
      PrintFormat("%s: Failed to create indicator handle %s. Error %ld",__FUNCTION__,ind_title,GetLastError());
      return INIT_FAILED;
     }

//--- Successful initialization
   return(INIT_SUCCEEDED);
  }
Ao usar o painel informativo no EA, criamos o painel:
//+------------------------------------------------------------------+
//| Expert initialization function                                   |
//+------------------------------------------------------------------+
int OnInit()
  {
//--- create timer
   EventSetTimer(60);

//--- Indicator
//--- Set the indicator name and the number of decimal places
   ind_title="AC";
   ind_digits=Digits()+2;
//--- Create indicator handle
   ResetLastError();
   handle=iAC(Symbol(),PERIOD_CURRENT);
   if(handle==INVALID_HANDLE)
     {
      PrintFormat("%s: Failed to create indicator handle %s. Error %ld",__FUNCTION__,ind_title,GetLastError());
      return INIT_FAILED;
     }

//--- Dashboard
//--- Create the panel
   panel=new CDashboard(1,20,20,199,225);
   if(panel==NULL)
     {
      Print("Error. Failed to create panel object");
      return INIT_FAILED;
     }
//--- Set font parameters
   panel.SetFontParams("Calibri",9);
//--- Display the panel with the "Symbol, Timeframe description" header text
   panel.View(Symbol()+", "+StringSubstr(EnumToString(Period()),7));
//--- Create a table with ID 0 to display bar data in it
   panel.CreateNewTable(0);
//--- Draw a table with ID 0 on the panel background
   panel.DrawGrid(0,2,20,6,2,18,97);

//--- Create a table with ID 1 to display indicator data in it
   panel.CreateNewTable(1);
//--- Get the Y2 table coordinate with ID 0 and
//--- set the Y1 coordinate for the table with ID 1
   int y1=panel.TableY2(0)+22;
//--- Draw a table with ID 1 on the panel background
   panel.DrawGrid(1,2,y1,3,2,18,97);

//--- Display tabular data in the journal
   panel.GridPrint(0,2);
   panel.GridPrint(1,2);
//--- Initialize the variable with the index of the mouse cursor bar
   mouse_bar_index=0;
//--- Display the data of the current bar on the panel
   DrawData(mouse_bar_index,TimeCurrent());

//--- Successful initialization
   return(INIT_SUCCEEDED);
  }
Desinicialização
No manipulador OnDeinit() do EA, liberamos o handle do indicador:
//+------------------------------------------------------------------+
//| Expert deinitialization function                                 |
//+------------------------------------------------------------------+
void OnDeinit(const int reason)
  {
//--- destroy timer
   EventKillTimer();

//--- Release handle of the indicator
   ResetLastError();
   if(!IndicatorRelease(handle))
      PrintFormat("%s: IndicatorRelease failed. Error %ld",__FUNCTION__,GetLastError());
//--- Clear all comments on the chart
   Comment("");
  }
Ao usar o painel informativo, removemos o objeto do painel criado:
//+------------------------------------------------------------------+
//| Expert deinitialization function                                 |
//+------------------------------------------------------------------+
void OnDeinit(const int reason)
  {
//--- destroy timer
   EventKillTimer();

//--- Release handle of the indicator
   ResetLastError();
   if(!IndicatorRelease(handle))
      PrintFormat("%s: IndicatorRelease failed. Error %ld",__FUNCTION__,GetLastError());
//--- Clear all comments on the chart
   Comment("");

//--- If the panel object exists, delete it
   if(panel!=NULL)
      delete panel;
  }
Recuperação de dados
A seguir, são apresentadas funções gerais para acessar dados pelo handle do indicador. As funções foram discutidas no artigo sobre a integração de osciladores aos EAs. As funções apresentadas podem ser usadas "como estão" em seus programas:
//+------------------------------------------------------------------+
//| Return the indicator data on the specified bar                   |
//+------------------------------------------------------------------+
double IndicatorValue(const int ind_handle,const int index,const int buffer_num)
  {
   double array[1]={0};
   ResetLastError();
   if(CopyBuffer(ind_handle,buffer_num,index,1,array)!=1)
     {
      PrintFormat("%s: CopyBuffer failed. Error %ld",__FUNCTION__,GetLastError());
      return EMPTY_VALUE;
     }
   return array[0];
  }
//+------------------------------------------------------------------+
//| Return the state of the indicator line                           |
//+------------------------------------------------------------------+
ENUM_LINE_STATE LineState(const int ind_handle,const int index,const int buffer_num)
  {
//--- Get the values of the indicator line with the shift (0,1,2) relative to the passed index
   const double value0=IndicatorValue(ind_handle,index,  buffer_num);
   const double value1=IndicatorValue(ind_handle,index+1,buffer_num);
   const double value2=IndicatorValue(ind_handle,index+2,buffer_num);
//--- If at least one of the values could not be obtained, return an undefined value
   if(value0==EMPTY_VALUE || value1==EMPTY_VALUE || value2==EMPTY_VALUE)
      return LINE_STATE_NONE;
//--- Line upward reversal (value2>value1 && value0>value1)
   if(NormalizeDouble(value2-value1,ind_digits)>0 && NormalizeDouble(value0-value1,ind_digits)>0)
      return LINE_STATE_TURN_UP;
//--- Line upward direction (value2<=value1 && value0>value1)
   else if(NormalizeDouble(value2-value1,ind_digits)<=0 && NormalizeDouble(value0-value1,ind_digits)>0)
      return LINE_STATE_UP;
//--- Line upward stop (value2<=value1 && value0==value1)
   else if(NormalizeDouble(value2-value1,ind_digits)<=0 && NormalizeDouble(value0-value1,ind_digits)==0)
      return LINE_STATE_STOP_UP;
//--- Line downward reversal (value2<value1 && value0<value1)
   if(NormalizeDouble(value2-value1,ind_digits)<0 && NormalizeDouble(value0-value1,ind_digits)<0)
      return LINE_STATE_TURN_DOWN;
//--- Line downward direction (value2>=value1 && value0<value1)
   else if(NormalizeDouble(value2-value1,ind_digits)>=0 && NormalizeDouble(value0-value1,ind_digits)<0)
      return LINE_STATE_DOWN;
//--- Line downward stop (value2>=value1 && value0==value1)
   else if(NormalizeDouble(value2-value1,ind_digits)>=0 && NormalizeDouble(value0-value1,ind_digits)==0)
      return LINE_STATE_STOP_DOWN;
//--- Undefined state
   return LINE_STATE_NONE;
  }
//+------------------------------------------------------------------+
//| Return the state of the line relative to the specified level     |
//+------------------------------------------------------------------+
ENUM_LINE_STATE LineStateRelative(const int ind_handle,const int index,const int buffer_num,const double level0,const double level1=EMPTY_VALUE)
  {
//--- Get the values of the indicator line with the shift (0,1) relative to the passed index
   const double value0=IndicatorValue(ind_handle,index,  buffer_num);
   const double value1=IndicatorValue(ind_handle,index+1,buffer_num);
//--- If at least one of the values could not be obtained, return an undefined value
   if(value0==EMPTY_VALUE || value1==EMPTY_VALUE)
      return LINE_STATE_NONE;
//--- Define the second level to compare
   double level=(level1==EMPTY_VALUE ? level0 : level1);
//--- The line is below the level (value1<level && value0<level0)
   if(NormalizeDouble(value1-level,ind_digits)<0 && NormalizeDouble(value0-level0,ind_digits)<0)
      return LINE_STATE_UNDER;
//--- The line is above the level (value1>level && value0>level0)
   if(NormalizeDouble(value1-level,ind_digits)>0 && NormalizeDouble(value0-level0,ind_digits)>0)
      return LINE_STATE_ABOVE;
//--- The line crossed the level upwards (value1<=level && value0>level0)
   if(NormalizeDouble(value1-level,ind_digits)<=0 && NormalizeDouble(value0-level0,ind_digits)>0)
      return LINE_STATE_CROSS_UP;
//--- The line crossed the level downwards (value1>=level && value0<level0)
   if(NormalizeDouble(value1-level,ind_digits)>=0 && NormalizeDouble(value0-level0,ind_digits)<0)
      return LINE_STATE_CROSS_DOWN;
//--- The line touched the level from below (value1<level0 && value0==level0)
   if(NormalizeDouble(value1-level,ind_digits)<0 && NormalizeDouble(value0-level0,ind_digits)==0)
      return LINE_STATE_TOUCH_BELOW;
//--- The line touched the level from above (value1>level0 && value0==level0)
   if(NormalizeDouble(value1-level,ind_digits)>0 && NormalizeDouble(value0-level0,ind_digits)==0)
      return LINE_STATE_TOUCH_BELOW;
//--- Line is equal to the level value (value1==level0 && value0==level0)
   if(NormalizeDouble(value1-level,ind_digits)==0 && NormalizeDouble(value0-level0,ind_digits)==0)
      return LINE_STATE_EQUALS;
//--- Undefined state
   return LINE_STATE_NONE;
  }
//+------------------------------------------------------------------+
//| Return the indicator line state description                      |
//+------------------------------------------------------------------+
string LineStateDescription(const ENUM_LINE_STATE state)
  {
   switch(state)
     {
      case LINE_STATE_UP         :  return "Up";
      case LINE_STATE_STOP_UP    :  return "Stop Up";
      case LINE_STATE_TURN_UP    :  return "Turn Up";
      case LINE_STATE_DOWN       :  return "Down";
      case LINE_STATE_STOP_DOWN  :  return "Stop Down";
      case LINE_STATE_TURN_DOWN  :  return "Turn Down";
      case LINE_STATE_ABOVE      :  return "Above level";
      case LINE_STATE_UNDER      :  return "Under level";
      case LINE_STATE_CROSS_UP   :  return "Crossing Up";
      case LINE_STATE_CROSS_DOWN :  return "Crossing Down";
      case LINE_STATE_TOUCH_BELOW:  return "Touch from Below";
      case LINE_STATE_TOUCH_ABOVE:  return "Touch from Above";
      case LINE_STATE_EQUALS     :  return "Equals";
      default                    :  return "Unknown";
     }
  }
Ao usar o painel informativo, os dados são exibidos por meio da função:
//+------------------------------------------------------------------+
//| Display data from the specified timeseries index to the panel    |
//+------------------------------------------------------------------+
void DrawData(const int index,const datetime time)
  {
//--- Declare the variables to receive data in them
   MqlTick  tick={0};
   MqlRates rates[1];

//--- Exit if unable to get the current prices
   if(!SymbolInfoTick(Symbol(),tick))
      return;
//--- Exit if unable to get the bar data by the specified index
   if(CopyRates(Symbol(),PERIOD_CURRENT,index,1,rates)!=1)
      return;

//--- Set font parameters for bar and indicator data headers
   int  size=0;
   uint flags=0;
   uint angle=0;
   string name=panel.FontParams(size,flags,angle);
   panel.SetFontParams(name,9,FW_BOLD);
   panel.DrawText("Bar data ["+(string)index+"]",3,panel.TableY1(0)-16,clrMaroon,panel.Width()-6);
   panel.DrawText("Indicator data ["+(string)index+"]",3,panel.TableY1(1)-16,clrGreen,panel.Width()-6);
//--- Set font parameters for bar and indicator data
   panel.SetFontParams(name,9);

//--- Display the data of the specified bar in table 0 on the panel
   panel.DrawText("Date",  panel.CellX(0,0,0)+2, panel.CellY(0,0,0)+2); panel.DrawText(TimeToString(  rates[0].time,TIME_DATE),     panel.CellX(0,0,1)+2, panel.CellY(0,0,1)+2,clrNONE,90);
   panel.DrawText("Time",  panel.CellX(0,1,0)+2, panel.CellY(0,1,0)+2); panel.DrawText(TimeToString(  rates[0].time,TIME_MINUTES),  panel.CellX(0,1,1)+2, panel.CellY(0,1,1)+2,clrNONE,90);
   panel.DrawText("Open",  panel.CellX(0,2,0)+2, panel.CellY(0,2,0)+2); panel.DrawText(DoubleToString(rates[0].open,Digits()),      panel.CellX(0,2,1)+2, panel.CellY(0,2,1)+2,clrNONE,90);
   panel.DrawText("High",  panel.CellX(0,3,0)+2, panel.CellY(0,3,0)+2); panel.DrawText(DoubleToString(rates[0].high,Digits()),      panel.CellX(0,3,1)+2, panel.CellY(0,3,1)+2,clrNONE,90);
   panel.DrawText("Low",   panel.CellX(0,4,0)+2, panel.CellY(0,4,0)+2); panel.DrawText(DoubleToString(rates[0].low,Digits()),       panel.CellX(0,4,1)+2, panel.CellY(0,4,1)+2,clrNONE,90);
   panel.DrawText("Close", panel.CellX(0,5,0)+2, panel.CellY(0,5,0)+2); panel.DrawText(DoubleToString(rates[0].close,Digits()),     panel.CellX(0,5,1)+2, panel.CellY(0,5,1)+2,clrNONE,90);

//--- Display the indicator data from the specified bar on the panel in table 1
   panel.DrawText(ind_title, panel.CellX(1,0,0)+2, panel.CellY(1,0,0)+2);
   double value0=IndicatorValue(handle,index,  0);
   double value1=IndicatorValue(handle,index+1,0);
   string value_str=(value0!=EMPTY_VALUE ? DoubleToString(value0,ind_digits) : "");
   color clr=(value0>value1 ? clrGreen : value0<value1 ? clrRed : clrNONE);
   panel.DrawText(value_str,panel.CellX(1,0,1)+2,panel.CellY(1,0,1)+2,clrNONE,90);

//--- Display a description of the indicator line state
   panel.DrawText("Line state", panel.CellX(1,1,0)+2, panel.CellY(1,1,0)+2);
   ENUM_LINE_STATE state=LineState(handle,index,0);
   panel.DrawText(LineStateDescription(state),panel.CellX(1,1,1)+2,panel.CellY(1,1,1)+2,clr,90);

//--- Redraw the chart to immediately display all changes on the panel
   ChartRedraw(ChartID());
  }
A cor do texto do estado da linha do indicador no painel corresponde à cor das colunas do histograma sob o cursor.
Além disso, ao usar o painel informativo no manipulador de eventos OnChartEvent() do EA, o manipulador de eventos do painel é chamado, e os eventos são processados para obter o índice da barra sob o cursor:
//+------------------------------------------------------------------+
//| ChartEvent function                                              |
//+------------------------------------------------------------------+
void OnChartEvent(const int id,
                  const long &lparam,
                  const double &dparam,
                  const string &sparam)
  {
//--- Handling the panel
//--- Call the panel event handler
   panel.OnChartEvent(id,lparam,dparam,sparam);

//--- If the cursor moves or a click is made on the chart
   if(id==CHARTEVENT_MOUSE_MOVE || id==CHARTEVENT_CLICK)
     {
      //--- Declare the variables to record time and price coordinates in them
      datetime time=0;
      double price=0;
      int wnd=0;
      //--- If the cursor coordinates are converted to date and time
      if(ChartXYToTimePrice(ChartID(),(int)lparam,(int)dparam,wnd,time,price))
        {
         //--- write the bar index where the cursor is located to a global variable
         mouse_bar_index=iBarShift(Symbol(),PERIOD_CURRENT,time);
         //--- Display the bar data under the cursor on the panel
         DrawData(mouse_bar_index,time);
        }
     }

//--- If we received a custom event, display the appropriate message in the journal
   if(id>CHARTEVENT_CUSTOM)
     {
      //--- Here we can implement handling a click on the close button on the panel
      PrintFormat("%s: Event id=%ld, object id (lparam): %lu, event message (sparam): %s",__FUNCTION__,id,lparam,sparam);
     }
  }
Após a compilação e execução do EA no gráfico, podemos monitorar o valor e o estado da linha do indicador no painel informativo:
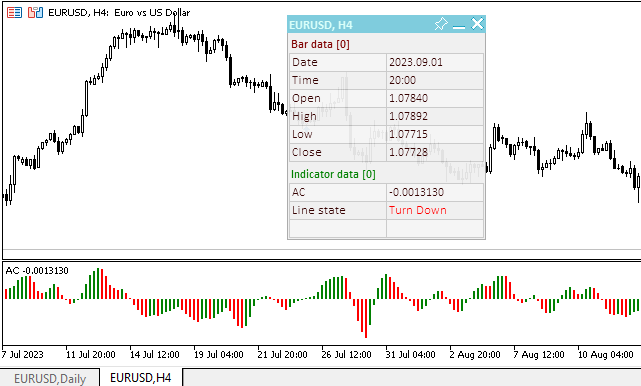
O arquivo do Expert Advisor de teste "TestWilliamsAC.mq5" pode ser visualizado nos arquivos anexados ao artigo.
Alligator
A maior parte do tempo, o mercado não se move para lugar algum. Apenas 15-30% do tempo, o mercado forma alguma tendência, e os traders que não estão no pregão extraem quase todo o seu lucro dos movimentos de tendência. Meu avô frequentemente repetia: "Mesmo uma galinha cega encontrará grãos se for alimentada no mesmo horário". Nós chamamos a negociação seguindo a tendência de "mercado da galinha cega". Embora tenhamos levado anos, finalmente desenvolvemos um indicador que sempre nos permite preparar o terreno até nos encontrarmos no "mercado da galinha cega" e aproveitar a maré.
Bill Williams
O indicador técnico Alligator é uma combinação de Linhas de Balanço (Médias Móveis, Moving Averages), que utiliza geometria fractal e dinâmica não linear.
- A linha azul (Mandíbula do Alligator) é a Linha de Balanço para o período de tempo que foi usado para construir o gráfico (média móvel suavizada de 13 períodos, deslocada por 8 barras para o futuro);
- A linha vermelha (Dentes do Alligator) é a Linha de Balanço para um período de tempo significativo, uma ordem de magnitude abaixo (média móvel suavizada de 8 períodos, deslocada por 5 barras para o futuro);
- A linha verde (Lábios do Alligator) é a Linha de Balanço para um período de tempo significativo, que é ainda uma ordem de magnitude abaixo (média móvel suavizada de 5 períodos, deslocada por 3 barras para o futuro).
Lábios, Dentes e Mandíbula do Alligator mostram a interação entre diferentes períodos de tempo. Como as tendências no mercado podem ser identificadas apenas 15-30% do tempo, é necessário seguir as tendências e não operar nos mercados que mudam apenas dentro de certos períodos de preço.
Quando a Mandíbula, os Dentes e os Lábios estão fechados ou entrelaçados, o Alligator está se preparando para dormir ou já está dormindo. Quando ele dorme, sua fome aumenta — quanto mais tempo ele dorme, mais faminto estará quando acordar. Quando ele acorda, a primeira coisa que faz é abrir sua Boca e começar a bocejar. Então, ele começa a sentir o cheiro da comida: carne de touro ou carne de urso, e começa a caçá-la. Quando o Alligator está completamente saciado, ele começa a perder o interesse pela comida-preço (As Linhas de Balanço convergem) — esse é o momento para fixar os lucros.
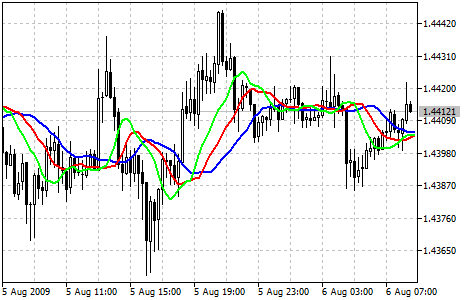
Parâmetros
Para criar um identificador do indicador, é utilizada a função iAlligator():
Retorna um identificador do indicador Alligator.
int  iAlligator(
   string              symbol,            // symbol name
   ENUM_TIMEFRAMES     period,            // period
   int                 jaw_period,        // period for calculating jaws
   int                 jaw_shift,         // horizontal shift of jaws
   int                 teeth_period,      // period for calculating teeth
   int                 teeth_shift,       // horizontal shift of teeth
   int                 lips_period,       // period for calculating lips
   int                 lips_shift,        // horizontal shift of lips
   ENUM_MA_METHOD      ma_method,         // smoothing type
   ENUM_APPLIED_PRICE  applied_price      // price type or handle
   );
symbol
[in] Nome simbólico do instrumento cujos dados serão usados para calcular o indicador. NULL representa o símbolo atual.
period
[in] O valor do período pode ser um dos valores da enumeração ENUM_TIMEFRAMES, 0 significa o timeframe atual.
jaw_period
[in] Período de média da linha azul (mandíbula do Alligator).
jaw_shift
[in] Deslocamento da linha azul em relação ao gráfico de preços.
teeth_period
[in] Período de média da linha vermelha (dentes do Alligator).
teeth_shift
[in] Deslocamento da linha vermelha em relação ao gráfico de preços.
lips_period
[in] Período de média da linha verde (lábios do Alligator).
lips_shift
[in] Deslocamento da linha verde em relação ao gráfico de preços.
ma_method
[in] Método de média. Pode ser qualquer um dos valores do enum ENUM_MA_METHOD.
applied_price
[in] Preço aplicado. Pode ser qualquer uma das constantes de preço ENUM_APPLIED_PRICE ou um identificador de outro indicador.
Retorna o handle do indicador técnico especificado, em caso de falha retorna INVALID_HANDLE. A função IndicatorRelease() é usada para liberar a memória do computador do indicador que não é mais usado; o handle desse indicador é passado para ela.
Números dos buffers: 0 — GATORJAW_LINE, 1 — GATORTEETH_LINE, 2 — GATORLIPS_LINE.
Para criar um indicador no EA, declaramos variáveis de entrada e globais:
//+------------------------------------------------------------------+
//|                                        TestWilliamsAlligator.mq5 |
//|                                  Copyright 2023, MetaQuotes Ltd. |
//|                                             https://www.mql5.com |
//+------------------------------------------------------------------+
#property copyright "Copyright 2023, MetaQuotes Ltd."
#property link      "https://www.mql5.com"
#property version   "1.00"
//--- enums
enum ENUM_LINE_STATE
  {
   LINE_STATE_NONE,        // Undefined state
   LINE_STATE_UP,          // Upward
   LINE_STATE_DOWN,        // Downward
   LINE_STATE_TURN_UP,     // Upward reversal
   LINE_STATE_TURN_DOWN,   // Downward reversal
   LINE_STATE_STOP_UP,     // Upward stop
   LINE_STATE_STOP_DOWN,   // Downward stop
   LINE_STATE_ABOVE,       // Above value
   LINE_STATE_UNDER,       // Below value
   LINE_STATE_CROSS_UP,    // Crossing value upwards
   LINE_STATE_CROSS_DOWN,  // Crossing value downwards
   LINE_STATE_TOUCH_BELOW, // Touching value from below
   LINE_STATE_TOUCH_ABOVE, // Touch value from above
   LINE_STATE_EQUALS,      // Equal to value
  };
//--- input parameters
input uint                 InpPeriodJaws  =  13;            /* Jaws Period    */
input int                  InpShiftJaws   =  8;             /* Jaws Shift     */
input uint                 InpPeriodTeeth =  8;             /* Teeth Period   */
input int                  InpShiftTeeth  =  5;             /* Teeth Shift    */
input uint                 InpPeriodLips  =  5;             /* Lips Period    */
input int                  InpShiftLips   =  3;             /* Lips Shift     */
input ENUM_MA_METHOD       InpMethod      =  MODE_SMMA;     /* Smoothed       */
input ENUM_APPLIED_PRICE   InpAppliedPrice=  PRICE_MEDIAN;  /* Applied Price  */
//--- global variables
int      handle=INVALID_HANDLE;  // Indicator handle
int      period_jaws=0;          // Jaws line calculation period
int      period_teeth=0;         // Teeth line calculation period
int      period_lips=0;          // Lips line calculation period
int      ind_digits=0;           // Number of decimal places in the indicator values
string   ind_title;              // Indicator description
Ao usar um painel informativo no EA, também declaramos variáveis globais para ele e incluímos o arquivo de classes do painel:
//+------------------------------------------------------------------+
//|                                        TestWilliamsAlligator.mq5 |
//|                                  Copyright 2023, MetaQuotes Ltd. |
//|                                             https://www.mql5.com |
//+------------------------------------------------------------------+
#property copyright "Copyright 2023, MetaQuotes Ltd."
#property link      "https://www.mql5.com"
#property version   "1.00"
//--- includes
#include <Dashboard\Dashboard.mqh>
//--- enums
enum ENUM_LINE_STATE
  {
   LINE_STATE_NONE,        // Undefined state
   LINE_STATE_UP,          // Upward
   LINE_STATE_DOWN,        // Downward
   LINE_STATE_TURN_UP,     // Upward reversal
   LINE_STATE_TURN_DOWN,   // Downward reversal
   LINE_STATE_STOP_UP,     // Upward stop
   LINE_STATE_STOP_DOWN,   // Downward stop
   LINE_STATE_ABOVE,       // Above value
   LINE_STATE_UNDER,       // Below value
   LINE_STATE_CROSS_UP,    // Crossing value upwards
   LINE_STATE_CROSS_DOWN,  // Crossing value downwards
   LINE_STATE_TOUCH_BELOW, // Touching value from below
   LINE_STATE_TOUCH_ABOVE, // Touch value from above
   LINE_STATE_EQUALS,      // Equal to value
  };
//--- input parameters
input uint                 InpPeriodJaws  =  13;            /* Jaws Period    */
input int                  InpShiftJaws   =  8;             /* Jaws Shift     */
input uint                 InpPeriodTeeth =  8;             /* Teeth Period   */
input int                  InpShiftTeeth  =  5;             /* Teeth Shift    */
input uint                 InpPeriodLips  =  5;             /* Lips Period    */
input int                  InpShiftLips   =  3;             /* Lips Shift     */
input ENUM_MA_METHOD       InpMethod      =  MODE_SMMA;     /* Smoothed       */
input ENUM_APPLIED_PRICE   InpAppliedPrice=  PRICE_MEDIAN;  /* Applied Price  */
//--- global variables
int      handle=INVALID_HANDLE;  // Indicator handle
int      period_jaws=0;          // Jaws line calculation period
int      period_teeth=0;         // Teeth line calculation period
int      period_lips=0;          // Lips line calculation period
int      ind_digits=0;           // Number of decimal places in the indicator values
string   ind_title;              // Indicator description
//--- variables for the panel
int      mouse_bar_index;        // Index of the bar the data is taken from
CDashboard *panel=NULL;          // Pointer to the panel object
Inicialização
Configuramos os valores das variáveis globais para o indicador e criamos seu handle:
//+------------------------------------------------------------------+
//| Expert initialization function                                   |
//+------------------------------------------------------------------+
int OnInit()
  {
//--- create timer
   EventSetTimer(60);

//--- Indicator
//--- Set and adjust the calculation period if necessary
   period_jaws=int(InpPeriodJaws<1 ? 13 : InpPeriodJaws);
   period_teeth=int(InpPeriodTeeth<1 ? 8 : InpPeriodTeeth);
   period_lips=int(InpPeriodLips<1 ? 5 : InpPeriodLips);
//--- Set the indicator name and the number of decimal places
   ind_title=StringFormat("Alligator(%lu,%lu,%lu)",period_jaws,period_teeth,period_lips);
   ind_digits=Digits();
//--- Create indicator handle
   ResetLastError();
   handle=iAlligator(Symbol(),PERIOD_CURRENT,period_jaws,InpShiftJaws,period_teeth,InpShiftTeeth,period_lips,InpShiftLips,InpMethod,InpAppliedPrice);
   if(handle==INVALID_HANDLE)
     {
      PrintFormat("%s: Failed to create indicator handle %s. Error %ld",__FUNCTION__,ind_title,GetLastError());
      return INIT_FAILED;
     }

//--- Successful initialization
   return(INIT_SUCCEEDED);
  }
Ao usar o painel informativo no EA, criamos o painel:
//+------------------------------------------------------------------+
//| Expert initialization function                                   |
//+------------------------------------------------------------------+
int OnInit()
  {
//--- create timer
   EventSetTimer(60);

//--- Indicator
//--- Set and adjust the calculation period if necessary
   period_jaws=int(InpPeriodJaws<1 ? 13 : InpPeriodJaws);
   period_teeth=int(InpPeriodTeeth<1 ? 8 : InpPeriodTeeth);
   period_lips=int(InpPeriodLips<1 ? 5 : InpPeriodLips);
//--- Set the indicator name and the number of decimal places
   ind_title=StringFormat("Alligator(%lu,%lu,%lu)",period_jaws,period_teeth,period_lips);
   ind_digits=Digits();
//--- Create indicator handle
   ResetLastError();
   handle=iAlligator(Symbol(),PERIOD_CURRENT,period_jaws,InpShiftJaws,period_teeth,InpShiftTeeth,period_lips,InpShiftLips,InpMethod,InpAppliedPrice);
   if(handle==INVALID_HANDLE)
     {
      PrintFormat("%s: Failed to create indicator handle %s. Error %ld",__FUNCTION__,ind_title,GetLastError());
      return INIT_FAILED;
     }

//--- Dashboard
//--- Create the panel
   panel=new CDashboard(1,20,20,199,261);
   if(panel==NULL)
     {
      Print("Error. Failed to create panel object");
      return INIT_FAILED;
     }
//--- Set font parameters
   panel.SetFontParams("Calibri",9);
//--- Display the panel with the "Symbol, Timeframe description" header text
   panel.View(Symbol()+", "+StringSubstr(EnumToString(Period()),7));
//--- Create a table with ID 0 to display bar data in it
   panel.CreateNewTable(0);
//--- Draw a table with ID 0 on the panel background
   panel.DrawGrid(0,2,20,6,2,18,97);

//--- Create a table with ID 1 to display indicator data in it
   panel.CreateNewTable(1);
//--- Get the Y2 table coordinate with ID 0 and
//--- set the Y1 coordinate for the table with ID 1
   int y1=panel.TableY2(0)+22;
//--- Draw a table with ID 1 on the panel background
   panel.DrawGrid(1,2,y1,5,2,18,97);

//--- Display tabular data in the journal
   panel.GridPrint(0,2);
   panel.GridPrint(1,2);
//--- Initialize the variable with the index of the mouse cursor bar
   mouse_bar_index=0;
//--- Display the data of the current bar on the panel
   DrawData(mouse_bar_index,TimeCurrent());

//--- Successful initialization
   return(INIT_SUCCEEDED);
  }
Desinicialização
No manipulador OnDeinit() do EA, liberamos o handle do indicador:
//+------------------------------------------------------------------+
//| Expert deinitialization function                                 |
//+------------------------------------------------------------------+
void OnDeinit(const int reason)
  {
//--- destroy timer
   EventKillTimer();

//--- Release handle of the indicator
   ResetLastError();
   if(!IndicatorRelease(handle))
      PrintFormat("%s: IndicatorRelease failed. Error %ld",__FUNCTION__,GetLastError());
//--- Clear all comments on the chart
   Comment("");
  }
Ao usar o painel informativo, removemos o objeto do painel criado:
//+------------------------------------------------------------------+
//| Expert deinitialization function                                 |
//+------------------------------------------------------------------+
void OnDeinit(const int reason)
  {
//--- destroy timer
   EventKillTimer();

//--- Release handle of the indicator
   ResetLastError();
   if(!IndicatorRelease(handle))
      PrintFormat("%s: IndicatorRelease failed. Error %ld",__FUNCTION__,GetLastError());
//--- Clear all comments on the chart
   Comment("");

//--- If the panel object exists, delete it
   if(panel!=NULL)
      delete panel;
  }
Recuperação de dados
A seguir, são apresentadas funções gerais para acessar dados pelo handle do indicador. As funções foram discutidas no artigo sobre a integração de osciladores aos EAs. As funções apresentadas podem ser usadas "como estão" em seus programas:
//+------------------------------------------------------------------+
//| Return the indicator data on the specified bar                   |
//+------------------------------------------------------------------+
double IndicatorValue(const int ind_handle,const int index,const int buffer_num)
  {
   double array[1]={0};
   ResetLastError();
   if(CopyBuffer(ind_handle,buffer_num,index,1,array)!=1)
     {
      PrintFormat("%s: CopyBuffer failed. Error %ld",__FUNCTION__,GetLastError());
      return EMPTY_VALUE;
     }
   return array[0];
  }
//+------------------------------------------------------------------+
//| Return the state of the indicator line                           |
//+------------------------------------------------------------------+
ENUM_LINE_STATE LineState(const int ind_handle,const int index,const int buffer_num)
  {
//--- Get the values of the indicator line with the shift (0,1,2) relative to the passed index
   const double value0=IndicatorValue(ind_handle,index,  buffer_num);
   const double value1=IndicatorValue(ind_handle,index+1,buffer_num);
   const double value2=IndicatorValue(ind_handle,index+2,buffer_num);
//--- If at least one of the values could not be obtained, return an undefined value
   if(value0==EMPTY_VALUE || value1==EMPTY_VALUE || value2==EMPTY_VALUE)
      return LINE_STATE_NONE;
//--- Line upward reversal (value2>value1 && value0>value1)
   if(NormalizeDouble(value2-value1,ind_digits)>0 && NormalizeDouble(value0-value1,ind_digits)>0)
      return LINE_STATE_TURN_UP;
//--- Line upward direction (value2<=value1 && value0>value1)
   else if(NormalizeDouble(value2-value1,ind_digits)<=0 && NormalizeDouble(value0-value1,ind_digits)>0)
      return LINE_STATE_UP;
//--- Line upward stop (value2<=value1 && value0==value1)
   else if(NormalizeDouble(value2-value1,ind_digits)<=0 && NormalizeDouble(value0-value1,ind_digits)==0)
      return LINE_STATE_STOP_UP;
//--- Line downward reversal (value2<value1 && value0<value1)
   if(NormalizeDouble(value2-value1,ind_digits)<0 && NormalizeDouble(value0-value1,ind_digits)<0)
      return LINE_STATE_TURN_DOWN;
//--- Line downward direction (value2>=value1 && value0<value1)
   else if(NormalizeDouble(value2-value1,ind_digits)>=0 && NormalizeDouble(value0-value1,ind_digits)<0)
      return LINE_STATE_DOWN;
//--- Line downward stop (value2>=value1 && value0==value1)
   else if(NormalizeDouble(value2-value1,ind_digits)>=0 && NormalizeDouble(value0-value1,ind_digits)==0)
      return LINE_STATE_STOP_DOWN;
//--- Undefined state
   return LINE_STATE_NONE;
  }
//+------------------------------------------------------------------+
//| Return the state of the line relative to the specified level     |
//+------------------------------------------------------------------+
ENUM_LINE_STATE LineStateRelative(const int ind_handle,const int index,const int buffer_num,const double level0,const double level1=EMPTY_VALUE)
  {
//--- Get the values of the indicator line with the shift (0,1) relative to the passed index
   const double value0=IndicatorValue(ind_handle,index,  buffer_num);
   const double value1=IndicatorValue(ind_handle,index+1,buffer_num);
//--- If at least one of the values could not be obtained, return an undefined value
   if(value0==EMPTY_VALUE || value1==EMPTY_VALUE)
      return LINE_STATE_NONE;
//--- Define the second level to compare
   double level=(level1==EMPTY_VALUE ? level0 : level1);
//--- The line is below the level (value1<level && value0<level0)
   if(NormalizeDouble(value1-level,ind_digits)<0 && NormalizeDouble(value0-level0,ind_digits)<0)
      return LINE_STATE_UNDER;
//--- The line is above the level (value1>level && value0>level0)
   if(NormalizeDouble(value1-level,ind_digits)>0 && NormalizeDouble(value0-level0,ind_digits)>0)
      return LINE_STATE_ABOVE;
//--- The line crossed the level upwards (value1<=level && value0>level0)
   if(NormalizeDouble(value1-level,ind_digits)<=0 && NormalizeDouble(value0-level0,ind_digits)>0)
      return LINE_STATE_CROSS_UP;
//--- The line crossed the level downwards (value1>=level && value0<level0)
   if(NormalizeDouble(value1-level,ind_digits)>=0 && NormalizeDouble(value0-level0,ind_digits)<0)
      return LINE_STATE_CROSS_DOWN;
//--- The line touched the level from below (value1<level0 && value0==level0)
   if(NormalizeDouble(value1-level,ind_digits)<0 && NormalizeDouble(value0-level0,ind_digits)==0)
      return LINE_STATE_TOUCH_BELOW;
//--- The line touched the level from above (value1>level0 && value0==level0)
   if(NormalizeDouble(value1-level,ind_digits)>0 && NormalizeDouble(value0-level0,ind_digits)==0)
      return LINE_STATE_TOUCH_BELOW;
//--- Line is equal to the level value (value1==level0 && value0==level0)
   if(NormalizeDouble(value1-level,ind_digits)==0 && NormalizeDouble(value0-level0,ind_digits)==0)
      return LINE_STATE_EQUALS;
//--- Undefined state
   return LINE_STATE_NONE;
  }
//+------------------------------------------------------------------+
//| Return the indicator line state description                      |
//+------------------------------------------------------------------+
string LineStateDescription(const ENUM_LINE_STATE state)
  {
   switch(state)
     {
      case LINE_STATE_UP         :  return "Up";
      case LINE_STATE_STOP_UP    :  return "Stop Up";
      case LINE_STATE_TURN_UP    :  return "Turn Up";
      case LINE_STATE_DOWN       :  return "Down";
      case LINE_STATE_STOP_DOWN  :  return "Stop Down";
      case LINE_STATE_TURN_DOWN  :  return "Turn Down";
      case LINE_STATE_ABOVE      :  return "Above level";
      case LINE_STATE_UNDER      :  return "Under level";
      case LINE_STATE_CROSS_UP   :  return "Crossing Up";
      case LINE_STATE_CROSS_DOWN :  return "Crossing Down";
      case LINE_STATE_TOUCH_BELOW:  return "Touch from Below";
      case LINE_STATE_TOUCH_ABOVE:  return "Touch from Above";
      case LINE_STATE_EQUALS     :  return "Equals";
      default                    :  return "Unknown";
     }
  }
Ao usar o painel informativo, os dados são exibidos por meio da função:
//+------------------------------------------------------------------+
//| Display data from the specified timeseries index to the panel    |
//+------------------------------------------------------------------+
void DrawData(const int index,const datetime time)
  {
//--- Declare the variables to receive data in them
   MqlTick  tick={0};
   MqlRates rates[1];

//--- Exit if unable to get the current prices
   if(!SymbolInfoTick(Symbol(),tick))
      return;
//--- Exit if unable to get the bar data by the specified index
   if(CopyRates(Symbol(),PERIOD_CURRENT,index,1,rates)!=1)
      return;

//--- Set font parameters for bar and indicator data headers
   int  size=0;
   uint flags=0;
   uint angle=0;
   string name=panel.FontParams(size,flags,angle);
   panel.SetFontParams(name,9,FW_BOLD);
   panel.DrawText("Bar data ["+(string)index+"]",3,panel.TableY1(0)-16,clrMaroon,panel.Width()-6);
   panel.DrawText("Indicator data ["+(string)index+"]",3,panel.TableY1(1)-16,clrGreen,panel.Width()-6);
//--- Set font parameters for bar and indicator data
   panel.SetFontParams(name,9);

//--- Display the data of the specified bar in table 0 on the panel
   panel.DrawText("Date",  panel.CellX(0,0,0)+2, panel.CellY(0,0,0)+2); panel.DrawText(TimeToString(  rates[0].time,TIME_DATE),     panel.CellX(0,0,1)+2, panel.CellY(0,0,1)+2,clrNONE,90);
   panel.DrawText("Time",  panel.CellX(0,1,0)+2, panel.CellY(0,1,0)+2); panel.DrawText(TimeToString(  rates[0].time,TIME_MINUTES),  panel.CellX(0,1,1)+2, panel.CellY(0,1,1)+2,clrNONE,90);
   panel.DrawText("Open",  panel.CellX(0,2,0)+2, panel.CellY(0,2,0)+2); panel.DrawText(DoubleToString(rates[0].open,Digits()),      panel.CellX(0,2,1)+2, panel.CellY(0,2,1)+2,clrNONE,90);
   panel.DrawText("High",  panel.CellX(0,3,0)+2, panel.CellY(0,3,0)+2); panel.DrawText(DoubleToString(rates[0].high,Digits()),      panel.CellX(0,3,1)+2, panel.CellY(0,3,1)+2,clrNONE,90);
   panel.DrawText("Low",   panel.CellX(0,4,0)+2, panel.CellY(0,4,0)+2); panel.DrawText(DoubleToString(rates[0].low,Digits()),       panel.CellX(0,4,1)+2, panel.CellY(0,4,1)+2,clrNONE,90);
   panel.DrawText("Close", panel.CellX(0,5,0)+2, panel.CellY(0,5,0)+2); panel.DrawText(DoubleToString(rates[0].close,Digits()),     panel.CellX(0,5,1)+2, panel.CellY(0,5,1)+2,clrNONE,90);

//--- Get the indicator lines data
   double value_jaws=IndicatorValue(handle,index,GATORJAW_LINE);
   double value_teeth=IndicatorValue(handle,index,GATORTEETH_LINE);
   double value_lips=IndicatorValue(handle,index,GATORLIPS_LINE);

//--- Display the Jaws line data from the specified bar on the panel in table 1
   string jaws_str=StringFormat("Jaws(%lu)",period_jaws);
   panel.DrawText(jaws_str, panel.CellX(1,0,0)+2, panel.CellY(1,0,0)+2);
   string value_str=(value_jaws!=EMPTY_VALUE ? DoubleToString(value_jaws,ind_digits) : "");
   panel.DrawText(value_str,panel.CellX(1,0,1)+2,panel.CellY(1,0,1)+2,clrNONE,90);
//--- Display the Teeth line data from the specified bar on the panel in table 1
   string teeth_str=StringFormat("Teeth(%lu)",period_teeth);
   panel.DrawText(teeth_str, panel.CellX(1,1,0)+2, panel.CellY(1,1,0)+2);
   value_str=(value_teeth!=EMPTY_VALUE ? DoubleToString(value_teeth,ind_digits) : "");
   panel.DrawText(value_str,panel.CellX(1,1,1)+2,panel.CellY(1,1,1)+2,clrNONE,90);
//--- Display the Lips line data from the specified bar on the panel in table 1
   string lips_str=StringFormat("Lips(%lu)",period_jaws);
   panel.DrawText(lips_str, panel.CellX(1,2,0)+2, panel.CellY(1,2,0)+2);
   value_str=(value_lips!=EMPTY_VALUE ? DoubleToString(value_lips,ind_digits) : "");
   panel.DrawText(value_str,panel.CellX(1,2,1)+2,panel.CellY(1,2,1)+2,clrNONE,90);

//--- Display a description of the Teeth line state relative to the Jaws line
   panel.DrawText("Teeth vs Jaws", panel.CellX(1,3,0)+2, panel.CellY(1,3,0)+2);
   ENUM_LINE_STATE state_tj=LineStateRelative(handle,index,1,value_jaws,IndicatorValue(handle,index+1,GATORJAW_LINE));
   string state_tj_str=
     (
      state_tj==LINE_STATE_ABOVE        ?  "Teeth > Jaws"  :
      state_tj==LINE_STATE_UNDER        ?  "Teeth < Jaws"  :
      state_tj==LINE_STATE_TOUCH_ABOVE  ||
      state_tj==LINE_STATE_TOUCH_BELOW  ?  "Touch"     :
      LineStateDescription(state_tj)
     );
//--- The label color changes depending on the value of the line relative to the level
   color clr=(state_tj==LINE_STATE_CROSS_UP || state_tj==LINE_STATE_ABOVE  ? clrBlue : state_tj==LINE_STATE_CROSS_DOWN || state_tj==LINE_STATE_UNDER ? clrRed : clrNONE);
   panel.DrawText(state_tj_str,panel.CellX(1,3,1)+2,panel.CellY(1,3,1)+2,clr,90);

//--- Display a description of the Lips line state relative to the Teeth line
   panel.DrawText("Lips vs Teeth", panel.CellX(1,4,0)+2, panel.CellY(1,4,0)+2);
   ENUM_LINE_STATE state_lt=LineStateRelative(handle,index,2,value_teeth,IndicatorValue(handle,index+1,GATORTEETH_LINE));
   string state_lt_str=
     (
      state_lt==LINE_STATE_ABOVE        ?  "Lips > Teeth"  :
      state_lt==LINE_STATE_UNDER        ?  "Lips < Teeth"  :
      state_lt==LINE_STATE_TOUCH_ABOVE  ||
      state_lt==LINE_STATE_TOUCH_BELOW  ?  "Touch"     :
      LineStateDescription(state_lt)
     );
//--- The label color changes depending on the value of the line relative to the level
   clr=(state_lt==LINE_STATE_CROSS_UP || state_lt==LINE_STATE_ABOVE  ? clrBlue : state_lt==LINE_STATE_CROSS_DOWN || state_lt==LINE_STATE_UNDER ? clrRed : clrNONE);
   panel.DrawText(state_lt_str,panel.CellX(1,4,1)+2,panel.CellY(1,4,1)+2,clr,90);

//--- Redraw the chart to immediately display all changes on the panel
   ChartRedraw(ChartID());
  }
Além dos valores das linhas do indicador nos barras sob o cursor, o painel exibe os estados das relações das linhas Teeth — Jaws e das linhas Lips — Teeth. Seus relacionamentos são exibidos em texto, e os arranjos mútuos são marcados pela cor do texto exibido.
Além disso, ao usar o painel informativo no manipulador de eventos OnChartEvent() do EA, o manipulador de eventos do painel é chamado, e os eventos são processados para obter o índice da barra sob o cursor:
//+------------------------------------------------------------------+
//| ChartEvent function                                              |
//+------------------------------------------------------------------+
void OnChartEvent(const int id,
                  const long &lparam,
                  const double &dparam,
                  const string &sparam)
  {
//--- Handling the panel
//--- Call the panel event handler
   panel.OnChartEvent(id,lparam,dparam,sparam);

//--- If the cursor moves or a click is made on the chart
   if(id==CHARTEVENT_MOUSE_MOVE || id==CHARTEVENT_CLICK)
     {
      //--- Declare the variables to record time and price coordinates in them
      datetime time=0;
      double price=0;
      int wnd=0;
      //--- If the cursor coordinates are converted to date and time
      if(ChartXYToTimePrice(ChartID(),(int)lparam,(int)dparam,wnd,time,price))
        {
         //--- write the bar index where the cursor is located to a global variable
         mouse_bar_index=iBarShift(Symbol(),PERIOD_CURRENT,time);
         //--- Display the bar data under the cursor on the panel
         DrawData(mouse_bar_index,time);
        }
     }

//--- If we received a custom event, display the appropriate message in the journal
   if(id>CHARTEVENT_CUSTOM)
     {
      //--- Here we can implement handling a click on the close button on the panel
      PrintFormat("%s: Event id=%ld, object id (lparam): %lu, event message (sparam): %s",__FUNCTION__,id,lparam,sparam);
     }
  }
Após a compilação e execução do EA no gráfico, podemos monitorar o valor e o estado da linha do indicador no painel informativo:
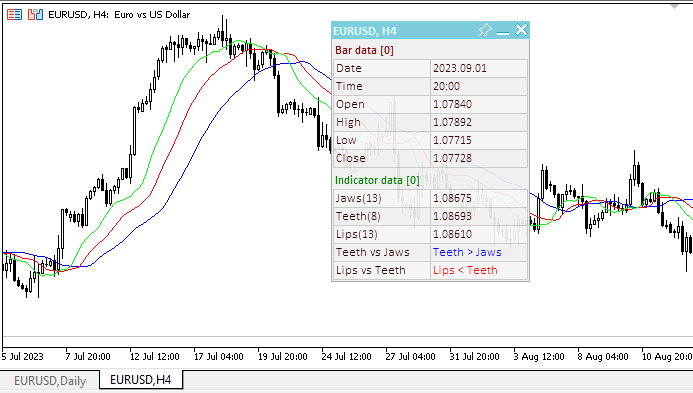
O arquivo do Expert Advisor de teste "TestWilliamsAlligator.mq5" pode ser visualizado nos arquivos anexados ao artigo.
Awesome Oscillator
O indicador técnico Oscilador Maravilhoso de Bill Williams (Awesome Oscillator, AO) é uma média móvel simples de 34 períodos, construída sobre os pontos médios dos barras (H+L)/2, que é subtraída de uma média móvel simples de 5 períodos, construída sobre os pontos centrais das barras (H+L)/2. Ele nos diz exatamente o que está acontecendo no momento atual com a força motriz do mercado.
Sinais de compra
- o sinal "Prato" é formado quando a histograma muda de direção de descendente para ascendente. A segunda coluna é inferior à primeira e é pintada de vermelho. A terceira coluna é superior à segunda e é verde;
- para a formação do sinal "Prato", é necessário, pelo menos, três colunas da histograma.
Lembre-se que, ao usar o sinal de compra "Prato", todas as colunas do Awesome Oscillator devem estar acima da linha zero.
"Cruzamento da linha zero" é um sinal de compra que se forma quando a histograma passa de valores negativos para positivos. Nesse caso:
- para que este sinal seja formado, são necessárias apenas duas colunas;
- a primeira coluna deve estar abaixo da linha zero, a segunda coluna deve cruzar a linha zero (transição de um valor negativo para um positivo);
- não é possível a presença simultânea de um sinal de compra e de venda.
"Duas Barras" é o único sinal de compra que pode ser formado quando os valores do histograma estão abaixo da linha zero. Aqui é necessário lembrar o seguinte:
- o sinal é formado quando você tem um pico voltado para baixo (o mínimo mais baixo), que está abaixo da linha zero, seguido por outro pico voltado para baixo, que é mais alto (um número negativo menor em valor absoluto, portanto, está mais próximo à linha zero) do que o pico anterior voltado para baixo;
- o histograma deve estar abaixo da linha zero entre os dois picos. Se o histograma cruzar a linha zero entre os picos, o sinal de compra não é válido. No entanto, é criado um sinal de compra "Cruzamento da linha zero";
- cada novo pico do histograma deve ser mais alto (um número negativo menor em valor absoluto, que está mais próximo à linha zero) do que o pico anterior;
- se um pico adicional, mais alto (que está mais próximo à linha zero) é formado e o histograma não cruzou a linha zero, então um sinal de compra adicional é formado.
Sinais de venda
"Os sinais de venda do Oscilador Incrível são idênticos aos sinais de compra. O sinal 'Prato' é invertido e está abaixo de zero. A 'Cruzamento da linha zero' é descendente — a primeira barra está acima de zero, a segunda abaixo. E os 'dois picos' estão acima da linha zero e também são invertidos.
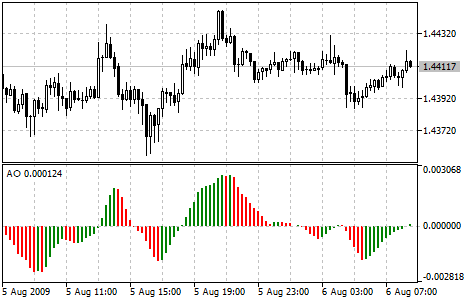
Parâmetros
Para criar um manipulador do indicador, utiliza-se a função iAO():
Retorna um manipulador do indicador Oscilador Incrível. Apenas um buffer.
int  iAO(
   string           symbol,     // symbol name
   ENUM_TIMEFRAMES  period      // period
   );
symbol
[in] Nome simbólico do instrumento cujos dados serão usados para calcular o indicador. NULL representa o símbolo atual.
period
[in] O valor do período pode ser um dos valores da enumeração ENUM_TIMEFRAMES, 0 significa o timeframe atual.
Retorna o handle do indicador técnico especificado, em caso de falha retorna INVALID_HANDLE. A função IndicatorRelease() é usada para liberar a memória do computador do indicador que não é mais usado; o handle desse indicador é passado para ela.
Para criar um indicador no EA, declaramos variáveis de entrada e globais:
//+------------------------------------------------------------------+
//|                                               TestWilliamsAO.mq5 |
//|                                  Copyright 2023, MetaQuotes Ltd. |
//|                                             https://www.mql5.com |
//+------------------------------------------------------------------+
#property copyright "Copyright 2023, MetaQuotes Ltd."
#property link      "https://www.mql5.com"
#property version   "1.00"
//--- enums
enum ENUM_LINE_STATE
  {
   LINE_STATE_NONE,        // Undefined state
   LINE_STATE_UP,          // Upward
   LINE_STATE_DOWN,        // Downward
   LINE_STATE_TURN_UP,     // Upward reversal
   LINE_STATE_TURN_DOWN,   // Downward reversal
   LINE_STATE_STOP_UP,     // Upward stop
   LINE_STATE_STOP_DOWN,   // Downward stop
   LINE_STATE_ABOVE,       // Above value
   LINE_STATE_UNDER,       // Below value
   LINE_STATE_CROSS_UP,    // Crossing value upwards
   LINE_STATE_CROSS_DOWN,  // Crossing value downwards
   LINE_STATE_TOUCH_BELOW, // Touching value from below
   LINE_STATE_TOUCH_ABOVE, // Touch value from above
   LINE_STATE_EQUALS,      // Equal to value
  };
//--- global variables
int      handle=INVALID_HANDLE;  // Indicator handle
int      ind_digits=0;           // Number of decimal places in the indicator values
string   ind_title;              // Indicator description
Ao usar um painel informativo no EA, também declaramos variáveis globais para ele e incluímos o arquivo de classes do painel:
//+------------------------------------------------------------------+
//|                                               TestWilliamsAO.mq5 |
//|                                  Copyright 2023, MetaQuotes Ltd. |
//|                                             https://www.mql5.com |
//+------------------------------------------------------------------+
#property copyright "Copyright 2023, MetaQuotes Ltd."
#property link      "https://www.mql5.com"
#property version   "1.00"
//--- includes
#include <Dashboard\Dashboard.mqh>
//--- enums
enum ENUM_LINE_STATE
  {
   LINE_STATE_NONE,        // Undefined state
   LINE_STATE_UP,          // Upward
   LINE_STATE_DOWN,        // Downward
   LINE_STATE_TURN_UP,     // Upward reversal
   LINE_STATE_TURN_DOWN,   // Downward reversal
   LINE_STATE_STOP_UP,     // Upward stop
   LINE_STATE_STOP_DOWN,   // Downward stop
   LINE_STATE_ABOVE,       // Above value
   LINE_STATE_UNDER,       // Below value
   LINE_STATE_CROSS_UP,    // Crossing value upwards
   LINE_STATE_CROSS_DOWN,  // Crossing value downwards
   LINE_STATE_TOUCH_BELOW, // Touching value from below
   LINE_STATE_TOUCH_ABOVE, // Touch value from above
   LINE_STATE_EQUALS,      // Equal to value
  };
//--- global variables
int      handle=INVALID_HANDLE;  // Indicator handle
int      ind_digits=0;           // Number of decimal places in the indicator values
string   ind_title;              // Indicator description
//--- variables for the panel
int      mouse_bar_index;        // Index of the bar the data is taken from
CDashboard *panel=NULL;          // Pointer to the panel object
Inicialização
Configuramos os valores das variáveis globais para o indicador e criamos seu handle:
//+------------------------------------------------------------------+
//| Expert initialization function                                   |
//+------------------------------------------------------------------+
int OnInit()
  {
//--- create timer
   EventSetTimer(60);

//--- Indicator
//--- Set the indicator name and the number of decimal places
   ind_title="AO";
   ind_digits=Digits()+1;
//--- Create indicator handle
   ResetLastError();
   handle=iAO(Symbol(),PERIOD_CURRENT);
   if(handle==INVALID_HANDLE)
     {
      PrintFormat("%s: Failed to create indicator handle %s. Error %ld",__FUNCTION__,ind_title,GetLastError());
      return INIT_FAILED;
     }

//--- Successful initialization
   return(INIT_SUCCEEDED);
  }
Ao usar o painel informativo no EA, criamos o painel:
//+------------------------------------------------------------------+
//| Expert initialization function                                   |
//+------------------------------------------------------------------+
int OnInit()
  {
//--- create timer
   EventSetTimer(60);

//--- Indicator
//--- Set the indicator name and the number of decimal places
   ind_title="AO";
   ind_digits=Digits()+1;
//--- Create indicator handle
   ResetLastError();
   handle=iAO(Symbol(),PERIOD_CURRENT);
   if(handle==INVALID_HANDLE)
     {
      PrintFormat("%s: Failed to create indicator handle %s. Error %ld",__FUNCTION__,ind_title,GetLastError());
      return INIT_FAILED;
     }

//--- Dashboard
//--- Create the panel
   panel=new CDashboard(1,20,20,199,225);
   if(panel==NULL)
     {
      Print("Error. Failed to create panel object");
      return INIT_FAILED;
     }
//--- Set font parameters
   panel.SetFontParams("Calibri",9);
//--- Display the panel with the "Symbol, Timeframe description" header text
   panel.View(Symbol()+", "+StringSubstr(EnumToString(Period()),7));
//--- Create a table with ID 0 to display bar data in it
   panel.CreateNewTable(0);
//--- Draw a table with ID 0 on the panel background
   panel.DrawGrid(0,2,20,6,2,18,97);

//--- Create a table with ID 1 to display indicator data in it
   panel.CreateNewTable(1);
//--- Get the Y2 table coordinate with ID 0 and
//--- set the Y1 coordinate for the table with ID 1
   int y1=panel.TableY2(0)+22;
//--- Draw a table with ID 1 on the panel background
   panel.DrawGrid(1,2,y1,3,2,18,97);

//--- Display tabular data in the journal
   panel.GridPrint(0,2);
   panel.GridPrint(1,2);
//--- Initialize the variable with the index of the mouse cursor bar
   mouse_bar_index=0;
//--- Display the data of the current bar on the panel
   DrawData(mouse_bar_index,TimeCurrent());

//--- Successful initialization
   return(INIT_SUCCEEDED);
  }
Desinicialização
No manipulador OnDeinit() do EA, liberamos o handle do indicador:
//+------------------------------------------------------------------+
//| Expert deinitialization function                                 |
//+------------------------------------------------------------------+
void OnDeinit(const int reason)
  {
//--- destroy timer
   EventKillTimer();

//--- Release handle of the indicator
   ResetLastError();
   if(!IndicatorRelease(handle))
      PrintFormat("%s: IndicatorRelease failed. Error %ld",__FUNCTION__,GetLastError());
//--- Clear all comments on the chart
   Comment("");
  }
Ao usar o painel informativo, removemos o objeto do painel criado:
//+------------------------------------------------------------------+
//| Expert deinitialization function                                 |
//+------------------------------------------------------------------+
void OnDeinit(const int reason)
  {
//--- destroy timer
   EventKillTimer();

//--- Release handle of the indicator
   ResetLastError();
   if(!IndicatorRelease(handle))
      PrintFormat("%s: IndicatorRelease failed. Error %ld",__FUNCTION__,GetLastError());
//--- Clear all comments on the chart
   Comment("");

//--- If the panel object exists, delete it
   if(panel!=NULL)
      delete panel;
  }
Recuperação de dados
A seguir, são apresentadas funções gerais para acessar dados pelo handle do indicador. As funções foram discutidas no artigo sobre a integração de osciladores aos EAs. As funções apresentadas podem ser usadas "como estão" em seus programas:
//+------------------------------------------------------------------+
//| Return the indicator data on the specified bar                   |
//+------------------------------------------------------------------+
double IndicatorValue(const int ind_handle,const int index,const int buffer_num)
  {
   double array[1]={0};
   ResetLastError();
   if(CopyBuffer(ind_handle,buffer_num,index,1,array)!=1)
     {
      PrintFormat("%s: CopyBuffer failed. Error %ld",__FUNCTION__,GetLastError());
      return EMPTY_VALUE;
     }
   return array[0];
  }
//+------------------------------------------------------------------+
//| Return the state of the indicator line                           |
//+------------------------------------------------------------------+
ENUM_LINE_STATE LineState(const int ind_handle,const int index,const int buffer_num)
  {
//--- Get the values of the indicator line with the shift (0,1,2) relative to the passed index
   const double value0=IndicatorValue(ind_handle,index,  buffer_num);
   const double value1=IndicatorValue(ind_handle,index+1,buffer_num);
   const double value2=IndicatorValue(ind_handle,index+2,buffer_num);
//--- If at least one of the values could not be obtained, return an undefined value
   if(value0==EMPTY_VALUE || value1==EMPTY_VALUE || value2==EMPTY_VALUE)
      return LINE_STATE_NONE;
//--- Line upward reversal (value2>value1 && value0>value1)
   if(NormalizeDouble(value2-value1,ind_digits)>0 && NormalizeDouble(value0-value1,ind_digits)>0)
      return LINE_STATE_TURN_UP;
//--- Line upward direction (value2<=value1 && value0>value1)
   else if(NormalizeDouble(value2-value1,ind_digits)<=0 && NormalizeDouble(value0-value1,ind_digits)>0)
      return LINE_STATE_UP;
//--- Line upward stop (value2<=value1 && value0==value1)
   else if(NormalizeDouble(value2-value1,ind_digits)<=0 && NormalizeDouble(value0-value1,ind_digits)==0)
      return LINE_STATE_STOP_UP;
//--- Line downward reversal (value2<value1 && value0<value1)
   if(NormalizeDouble(value2-value1,ind_digits)<0 && NormalizeDouble(value0-value1,ind_digits)<0)
      return LINE_STATE_TURN_DOWN;
//--- Line downward direction (value2>=value1 && value0<value1)
   else if(NormalizeDouble(value2-value1,ind_digits)>=0 && NormalizeDouble(value0-value1,ind_digits)<0)
      return LINE_STATE_DOWN;
//--- Line downward stop (value2>=value1 && value0==value1)
   else if(NormalizeDouble(value2-value1,ind_digits)>=0 && NormalizeDouble(value0-value1,ind_digits)==0)
      return LINE_STATE_STOP_DOWN;
//--- Undefined state
   return LINE_STATE_NONE;
  }
//+------------------------------------------------------------------+
//| Return the state of the line relative to the specified level     |
//+------------------------------------------------------------------+
ENUM_LINE_STATE LineStateRelative(const int ind_handle,const int index,const int buffer_num,const double level0,const double level1=EMPTY_VALUE)
  {
//--- Get the values of the indicator line with the shift (0,1) relative to the passed index
   const double value0=IndicatorValue(ind_handle,index,  buffer_num);
   const double value1=IndicatorValue(ind_handle,index+1,buffer_num);
//--- If at least one of the values could not be obtained, return an undefined value
   if(value0==EMPTY_VALUE || value1==EMPTY_VALUE)
      return LINE_STATE_NONE;
//--- Define the second level to compare
   double level=(level1==EMPTY_VALUE ? level0 : level1);
//--- The line is below the level (value1<level && value0<level0)
   if(NormalizeDouble(value1-level,ind_digits)<0 && NormalizeDouble(value0-level0,ind_digits)<0)
      return LINE_STATE_UNDER;
//--- The line is above the level (value1>level && value0>level0)
   if(NormalizeDouble(value1-level,ind_digits)>0 && NormalizeDouble(value0-level0,ind_digits)>0)
      return LINE_STATE_ABOVE;
//--- The line crossed the level upwards (value1<=level && value0>level0)
   if(NormalizeDouble(value1-level,ind_digits)<=0 && NormalizeDouble(value0-level0,ind_digits)>0)
      return LINE_STATE_CROSS_UP;
//--- The line crossed the level downwards (value1>=level && value0<level0)
   if(NormalizeDouble(value1-level,ind_digits)>=0 && NormalizeDouble(value0-level0,ind_digits)<0)
      return LINE_STATE_CROSS_DOWN;
//--- The line touched the level from below (value1<level0 && value0==level0)
   if(NormalizeDouble(value1-level,ind_digits)<0 && NormalizeDouble(value0-level0,ind_digits)==0)
      return LINE_STATE_TOUCH_BELOW;
//--- The line touched the level from above (value1>level0 && value0==level0)
   if(NormalizeDouble(value1-level,ind_digits)>0 && NormalizeDouble(value0-level0,ind_digits)==0)
      return LINE_STATE_TOUCH_BELOW;
//--- Line is equal to the level value (value1==level0 && value0==level0)
   if(NormalizeDouble(value1-level,ind_digits)==0 && NormalizeDouble(value0-level0,ind_digits)==0)
      return LINE_STATE_EQUALS;
//--- Undefined state
   return LINE_STATE_NONE;
  }
//+------------------------------------------------------------------+
//| Return the indicator line state description                      |
//+------------------------------------------------------------------+
string LineStateDescription(const ENUM_LINE_STATE state)
  {
   switch(state)
     {
      case LINE_STATE_UP         :  return "Up";
      case LINE_STATE_STOP_UP    :  return "Stop Up";
      case LINE_STATE_TURN_UP    :  return "Turn Up";
      case LINE_STATE_DOWN       :  return "Down";
      case LINE_STATE_STOP_DOWN  :  return "Stop Down";
      case LINE_STATE_TURN_DOWN  :  return "Turn Down";
      case LINE_STATE_ABOVE      :  return "Above level";
      case LINE_STATE_UNDER      :  return "Under level";
      case LINE_STATE_CROSS_UP   :  return "Crossing Up";
      case LINE_STATE_CROSS_DOWN :  return "Crossing Down";
      case LINE_STATE_TOUCH_BELOW:  return "Touch from Below";
      case LINE_STATE_TOUCH_ABOVE:  return "Touch from Above";
      case LINE_STATE_EQUALS     :  return "Equals";
      default                    :  return "Unknown";
     }
  }
Ao usar o painel informativo, os dados são exibidos por meio da função:
//+------------------------------------------------------------------+
//| Display data from the specified timeseries index to the panel    |
//+------------------------------------------------------------------+
void DrawData(const int index,const datetime time)
  {
//--- Declare the variables to receive data in them
   MqlTick  tick={0};
   MqlRates rates[1];

//--- Exit if unable to get the current prices
   if(!SymbolInfoTick(Symbol(),tick))
      return;
//--- Exit if unable to get the bar data by the specified index
   if(CopyRates(Symbol(),PERIOD_CURRENT,index,1,rates)!=1)
      return;

//--- Set font parameters for bar and indicator data headers
   int  size=0;
   uint flags=0;
   uint angle=0;
   string name=panel.FontParams(size,flags,angle);
   panel.SetFontParams(name,9,FW_BOLD);
   panel.DrawText("Bar data ["+(string)index+"]",3,panel.TableY1(0)-16,clrMaroon,panel.Width()-6);
   panel.DrawText("Indicator data ["+(string)index+"]",3,panel.TableY1(1)-16,clrGreen,panel.Width()-6);
//--- Set font parameters for bar and indicator data
   panel.SetFontParams(name,9);

//--- Display the data of the specified bar in table 0 on the panel
   panel.DrawText("Date",  panel.CellX(0,0,0)+2, panel.CellY(0,0,0)+2); panel.DrawText(TimeToString(  rates[0].time,TIME_DATE),     panel.CellX(0,0,1)+2, panel.CellY(0,0,1)+2,clrNONE,90);
   panel.DrawText("Time",  panel.CellX(0,1,0)+2, panel.CellY(0,1,0)+2); panel.DrawText(TimeToString(  rates[0].time,TIME_MINUTES),  panel.CellX(0,1,1)+2, panel.CellY(0,1,1)+2,clrNONE,90);
   panel.DrawText("Open",  panel.CellX(0,2,0)+2, panel.CellY(0,2,0)+2); panel.DrawText(DoubleToString(rates[0].open,Digits()),      panel.CellX(0,2,1)+2, panel.CellY(0,2,1)+2,clrNONE,90);
   panel.DrawText("High",  panel.CellX(0,3,0)+2, panel.CellY(0,3,0)+2); panel.DrawText(DoubleToString(rates[0].high,Digits()),      panel.CellX(0,3,1)+2, panel.CellY(0,3,1)+2,clrNONE,90);
   panel.DrawText("Low",   panel.CellX(0,4,0)+2, panel.CellY(0,4,0)+2); panel.DrawText(DoubleToString(rates[0].low,Digits()),       panel.CellX(0,4,1)+2, panel.CellY(0,4,1)+2,clrNONE,90);
   panel.DrawText("Close", panel.CellX(0,5,0)+2, panel.CellY(0,5,0)+2); panel.DrawText(DoubleToString(rates[0].close,Digits()),     panel.CellX(0,5,1)+2, panel.CellY(0,5,1)+2,clrNONE,90);

//--- Display the indicator data from the specified bar on the panel in table 1
   panel.DrawText(ind_title, panel.CellX(1,0,0)+2, panel.CellY(1,0,0)+2);
   double value0=IndicatorValue(handle,index,  0);
   double value1=IndicatorValue(handle,index+1,0);
   string value_str=(value0!=EMPTY_VALUE ? DoubleToString(value0,ind_digits) : "");
   color clr=(value0>value1 ? clrGreen : value0<value1 ? clrRed : clrNONE);
   panel.DrawText(value_str,panel.CellX(1,0,1)+2,panel.CellY(1,0,1)+2,clrNONE,90);

//--- Display a description of the indicator line state
   panel.DrawText("Line state", panel.CellX(1,1,0)+2, panel.CellY(1,1,0)+2);
   ENUM_LINE_STATE state=LineState(handle,index,0);
   panel.DrawText(LineStateDescription(state),panel.CellX(1,1,1)+2,panel.CellY(1,1,1)+2,clr,90);

//--- Display a description of the indicator line state relative to zero
   panel.DrawText("AO vs Zero", panel.CellX(1,2,0)+2, panel.CellY(1,2,0)+2);
   ENUM_LINE_STATE state_zero=LineStateRelative(handle,index,0,0);
   string state_zero_str=
     (
      state_zero==LINE_STATE_ABOVE        ?  "AO > 0"  :
      state_zero==LINE_STATE_UNDER        ?  "AO < 0"  :
      state_zero==LINE_STATE_TOUCH_ABOVE  ||
      state_zero==LINE_STATE_TOUCH_BELOW  ?  "Touch"     :
      LineStateDescription(state_zero)
     );
//--- The label color changes depending on the value of the line relative to the level
   clr=(state_zero==LINE_STATE_CROSS_UP ? clrGreen : state_zero==LINE_STATE_CROSS_DOWN ? clrRed : clrNONE);
   panel.DrawText(state_zero_str,panel.CellX(1,2,1)+2,panel.CellY(1,2,1)+2,clr,90);

//--- Redraw the chart to immediately display all changes on the panel
   ChartRedraw(ChartID());
  }
Além da descrição do estado da linha do indicador, que tem a cor da barra do histograma sob o cursor, o estado de sua localização em relação a zero é exibido no painel. A cruzamento da linha do indicador da linha zero para cima é marcado com texto verde, e para baixo, com texto vermelho.
Além disso, ao usar o painel informativo no manipulador de eventos OnChartEvent() do EA, o manipulador de eventos do painel é chamado, e os eventos são processados para obter o índice da barra sob o cursor:
//+------------------------------------------------------------------+
//| ChartEvent function                                              |
//+------------------------------------------------------------------+
void OnChartEvent(const int id,
                  const long &lparam,
                  const double &dparam,
                  const string &sparam)
  {
//--- Handling the panel
//--- Call the panel event handler
   panel.OnChartEvent(id,lparam,dparam,sparam);

//--- If the cursor moves or a click is made on the chart
   if(id==CHARTEVENT_MOUSE_MOVE || id==CHARTEVENT_CLICK)
     {
      //--- Declare the variables to record time and price coordinates in them
      datetime time=0;
      double price=0;
      int wnd=0;
      //--- If the cursor coordinates are converted to date and time
      if(ChartXYToTimePrice(ChartID(),(int)lparam,(int)dparam,wnd,time,price))
        {
         //--- write the bar index where the cursor is located to a global variable
         mouse_bar_index=iBarShift(Symbol(),PERIOD_CURRENT,time);
         //--- Display the bar data under the cursor on the panel
         DrawData(mouse_bar_index,time);
        }
     }

//--- If we received a custom event, display the appropriate message in the journal
   if(id>CHARTEVENT_CUSTOM)
     {
      //--- Here we can implement handling a click on the close button on the panel
      PrintFormat("%s: Event id=%ld, object id (lparam): %lu, event message (sparam): %s",__FUNCTION__,id,lparam,sparam);
     }
  }
Após a compilação e execução do EA no gráfico, podemos monitorar o valor e o estado da linha do indicador no painel informativo:
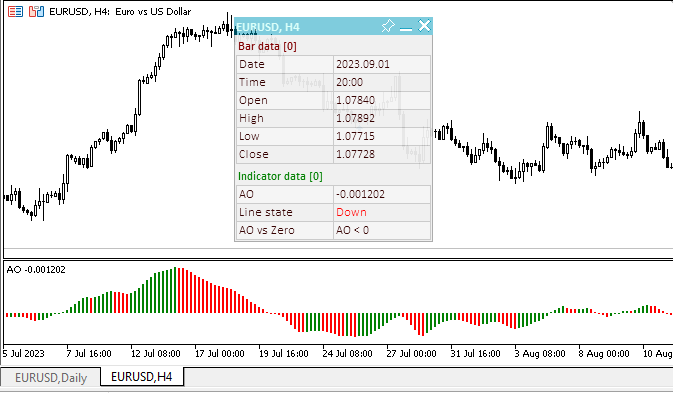
O arquivo do EA de teste "TestWilliamsAO.mq5" pode ser visto nos arquivos anexados ao artigo.
Fractals
Todos os mercados são caracterizados pelo fato de que, na maior parte do tempo, os preços neles não mudam significativamente e apenas durante um curto período de tempo (15-30 por cento) são observadas mudanças de tendência. Os períodos mais favoráveis para a obtenção de lucro são aqueles em que os preços nos mercados mudam de acordo com uma determinada tendência.
Fractais (Fractals) são um dos cinco indicadores do sistema de negociação de Bill Williams, permitindo detectar o fundo ou o topo. A definição técnica de um fractal ascendente é uma série de no mínimo cinco barras consecutivas, onde antes do máximo mais alto e depois dele, existem duas barras com máximos mais baixos. A configuração oposta (uma série de cinco barras, na qual antes do mínimo mais baixo e depois dele, existem duas barras com mínimos mais altos) corresponde ao fractal para baixo. No gráfico, os fractais têm valores High e Low e são marcados com setas para cima ou para baixo.
Os sinais do indicador técnico Fractals devem ser filtrados com a ajuda do indicador técnico Alligator. Em outras palavras, não se deve efetuar uma operação de compra se o fractal estiver abaixo dos Dentes do Alligator, e não se deve efetuar uma operação de venda se o fractal estiver acima dos Dentes do Alligator. Após o sinal do fractal ser formado e ter força, o que é determinado pela sua posição fora da Boca do Alligator, ele permanece como sinal até que seja invalidado, ou até que um sinal de fractal mais recente surja.
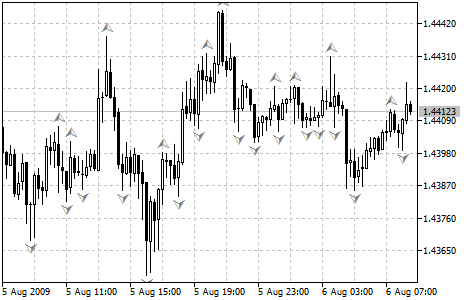
Parâmetros
Para criar um identificador do indicador, utiliza-se a função iFractals():
Retorna o identificador do indicador Fractals.
int  iFractals(
   string           symbol,     // symbol name
   ENUM_TIMEFRAMES  period      // period
   );
symbol
[in] Nome simbólico do instrumento cujos dados serão usados para calcular o indicador. NULL representa o símbolo atual.
period
[in] O valor do período pode ser um dos valores da enumeração ENUM_TIMEFRAMES, 0 significa o timeframe atual.
Valor retornado
Retorna o handle do indicador técnico especificado, em caso de falha retorna INVALID_HANDLE. A função IndicatorRelease() é usada para liberar a memória do computador do indicador que não é mais usado; o handle desse indicador é passado para ela.
Números dos buffers: 0 — UPPER_LINE, 1 — LOWER_LINE.
Para criar um indicador no EA, declaramos variáveis de entrada e globais:
//+------------------------------------------------------------------+
//|                                         TestWilliamsFractals.mq5 |
//|                                  Copyright 2023, MetaQuotes Ltd. |
//|                                             https://www.mql5.com |
//+------------------------------------------------------------------+
#property copyright "Copyright 2023, MetaQuotes Ltd."
#property link      "https://www.mql5.com"
#property version   "1.00"
//--- global variables
int      handle=INVALID_HANDLE;  // Indicator handle
int      ind_digits=0;           // Number of decimal places in the indicator values
string   ind_title;              // Indicator description
Ao usar um painel informativo no EA, também declaramos variáveis globais para ele e incluímos o arquivo de classes do painel:
//+------------------------------------------------------------------+
//|                                         TestWilliamsFractals.mq5 |
//|                                  Copyright 2023, MetaQuotes Ltd. |
//|                                             https://www.mql5.com |
//+------------------------------------------------------------------+
#property copyright "Copyright 2023, MetaQuotes Ltd."
#property link      "https://www.mql5.com"
#property version   "1.00"
//--- includes
#include <Dashboard\Dashboard.mqh>
//--- global variables
int      handle=INVALID_HANDLE;  // Indicator handle
int      ind_digits=0;           // Number of decimal places in the indicator values
string   ind_title;              // Indicator description
//--- variables for the panel
int      mouse_bar_index;        // Index of the bar the data is taken from
CDashboard *panel=NULL;          // Pointer to the panel object
Inicialização
Configuramos os valores das variáveis globais para o indicador e criamos seu handle:
//+------------------------------------------------------------------+
//| Expert initialization function                                   |
//+------------------------------------------------------------------+
int OnInit()
  {
//--- create timer
   EventSetTimer(60);

//--- Indicator
//--- Set the indicator name and the number of decimal places
   ind_title="Fractals";
   ind_digits=Digits();
//--- Create indicator handle
   ResetLastError();
   handle=iFractals(Symbol(),PERIOD_CURRENT);
   if(handle==INVALID_HANDLE)
     {
      PrintFormat("%s: Failed to create indicator handle %s. Error %ld",__FUNCTION__,ind_title,GetLastError());
      return INIT_FAILED;
     }

//--- Successful initialization
   return(INIT_SUCCEEDED);
  }
Ao usar o painel informativo no EA, criamos o painel:
//+------------------------------------------------------------------+
//| Expert initialization function                                   |
//+------------------------------------------------------------------+
int OnInit()
  {
//--- create timer
   EventSetTimer(60);

//--- Indicator
//--- Set the indicator name and the number of decimal places
   ind_title="Fractals";
   ind_digits=Digits();
//--- Create indicator handle
   ResetLastError();
   handle=iFractals(Symbol(),PERIOD_CURRENT);
   if(handle==INVALID_HANDLE)
     {
      PrintFormat("%s: Failed to create indicator handle %s. Error %ld",__FUNCTION__,ind_title,GetLastError());
      return INIT_FAILED;
     }

//--- Dashboard
//--- Create the panel
   panel=new CDashboard(1,20,20,199,225);
   if(panel==NULL)
     {
      Print("Error. Failed to create panel object");
      return INIT_FAILED;
     }
//--- Set font parameters
   panel.SetFontParams("Calibri",9);
//--- Display the panel with the "Symbol, Timeframe description" header text
   panel.View(Symbol()+", "+StringSubstr(EnumToString(Period()),7));
//--- Create a table with ID 0 to display bar data in it
   panel.CreateNewTable(0);
//--- Draw a table with ID 0 on the panel background
   panel.DrawGrid(0,2,20,6,2,18,97);

//--- Create a table with ID 1 to display indicator data in it
   panel.CreateNewTable(1);
//--- Get the Y2 table coordinate with ID 0 and
//--- set the Y1 coordinate for the table with ID 1
   int y1=panel.TableY2(0)+22;
//--- Draw a table with ID 1 on the panel background
   panel.DrawGrid(1,2,y1,3,2,18,97);

//--- Display tabular data in the journal
   panel.GridPrint(0,2);
   panel.GridPrint(1,2);
//--- Initialize the variable with the index of the mouse cursor bar
   mouse_bar_index=0;
//--- Display the data of the current bar on the panel
   DrawData(mouse_bar_index,TimeCurrent());

//--- Successful initialization
   return(INIT_SUCCEEDED);
  }
Desinicialização
No manipulador OnDeinit() do EA, liberamos o handle do indicador:
//+------------------------------------------------------------------+
//| Expert deinitialization function                                 |
//+------------------------------------------------------------------+
void OnDeinit(const int reason)
  {
//--- destroy timer
   EventKillTimer();

//--- Release handle of the indicator
   ResetLastError();
   if(!IndicatorRelease(handle))
      PrintFormat("%s: IndicatorRelease failed. Error %ld",__FUNCTION__,GetLastError());
//--- Clear all comments on the chart
   Comment("");
  }
Ao usar o painel informativo, removemos o objeto do painel criado:
//+------------------------------------------------------------------+
//| Expert deinitialization function                                 |
//+------------------------------------------------------------------+
void OnDeinit(const int reason)
  {
//--- destroy timer
   EventKillTimer();

//--- Release handle of the indicator
   ResetLastError();
   if(!IndicatorRelease(handle))
      PrintFormat("%s: IndicatorRelease failed. Error %ld",__FUNCTION__,GetLastError());
//--- Clear all comments on the chart
   Comment("");

//--- If the panel object exists, delete it
   if(panel!=NULL)
      delete panel;
  }
Recuperação de dados
A seguir, são apresentadas funções gerais para acessar dados pelo handle do indicador. As funções foram discutidas no artigo sobre a integração de osciladores aos EAs. As funções apresentadas podem ser usadas "como estão" em seus programas:
//+------------------------------------------------------------------+
//| Return the indicator data on the specified bar                   |
//+------------------------------------------------------------------+
double IndicatorValue(const int ind_handle,const int index,const int buffer_num)
  {
   double array[1]={0};
   ResetLastError();
   if(CopyBuffer(ind_handle,buffer_num,index,1,array)!=1)
     {
      PrintFormat("%s: CopyBuffer failed. Error %ld",__FUNCTION__,GetLastError());
      return EMPTY_VALUE;
     }
   return array[0];
  }
//+------------------------------------------------------------------+
//| Return the state of the indicator line                           |
//+------------------------------------------------------------------+
ENUM_LINE_STATE LineState(const int ind_handle,const int index,const int buffer_num)
  {
//--- Get the values of the indicator line with the shift (0,1,2) relative to the passed index
   const double value0=IndicatorValue(ind_handle,index,  buffer_num);
   const double value1=IndicatorValue(ind_handle,index+1,buffer_num);
   const double value2=IndicatorValue(ind_handle,index+2,buffer_num);
//--- If at least one of the values could not be obtained, return an undefined value
   if(value0==EMPTY_VALUE || value1==EMPTY_VALUE || value2==EMPTY_VALUE)
      return LINE_STATE_NONE;
//--- Line upward reversal (value2>value1 && value0>value1)
   if(NormalizeDouble(value2-value1,ind_digits)>0 && NormalizeDouble(value0-value1,ind_digits)>0)
      return LINE_STATE_TURN_UP;
//--- Line upward direction (value2<=value1 && value0>value1)
   else if(NormalizeDouble(value2-value1,ind_digits)<=0 && NormalizeDouble(value0-value1,ind_digits)>0)
      return LINE_STATE_UP;
//--- Line upward stop (value2<=value1 && value0==value1)
   else if(NormalizeDouble(value2-value1,ind_digits)<=0 && NormalizeDouble(value0-value1,ind_digits)==0)
      return LINE_STATE_STOP_UP;
//--- Line downward reversal (value2<value1 && value0<value1)
   if(NormalizeDouble(value2-value1,ind_digits)<0 && NormalizeDouble(value0-value1,ind_digits)<0)
      return LINE_STATE_TURN_DOWN;
//--- Line downward direction (value2>=value1 && value0<value1)
   else if(NormalizeDouble(value2-value1,ind_digits)>=0 && NormalizeDouble(value0-value1,ind_digits)<0)
      return LINE_STATE_DOWN;
//--- Line downward stop (value2>=value1 && value0==value1)
   else if(NormalizeDouble(value2-value1,ind_digits)>=0 && NormalizeDouble(value0-value1,ind_digits)==0)
      return LINE_STATE_STOP_DOWN;
//--- Undefined state
   return LINE_STATE_NONE;
  }
//+------------------------------------------------------------------+
//| Return the state of the line relative to the specified level     |
//+------------------------------------------------------------------+
ENUM_LINE_STATE LineStateRelative(const int ind_handle,const int index,const int buffer_num,const double level0,const double level1=EMPTY_VALUE)
  {
//--- Get the values of the indicator line with the shift (0,1) relative to the passed index
   const double value0=IndicatorValue(ind_handle,index,  buffer_num);
   const double value1=IndicatorValue(ind_handle,index+1,buffer_num);
//--- If at least one of the values could not be obtained, return an undefined value
   if(value0==EMPTY_VALUE || value1==EMPTY_VALUE)
      return LINE_STATE_NONE;
//--- Define the second level to compare
   double level=(level1==EMPTY_VALUE ? level0 : level1);
//--- The line is below the level (value1<level && value0<level0)
   if(NormalizeDouble(value1-level,ind_digits)<0 && NormalizeDouble(value0-level0,ind_digits)<0)
      return LINE_STATE_UNDER;
//--- The line is above the level (value1>level && value0>level0)
   if(NormalizeDouble(value1-level,ind_digits)>0 && NormalizeDouble(value0-level0,ind_digits)>0)
      return LINE_STATE_ABOVE;
//--- The line crossed the level upwards (value1<=level && value0>level0)
   if(NormalizeDouble(value1-level,ind_digits)<=0 && NormalizeDouble(value0-level0,ind_digits)>0)
      return LINE_STATE_CROSS_UP;
//--- The line crossed the level downwards (value1>=level && value0<level0)
   if(NormalizeDouble(value1-level,ind_digits)>=0 && NormalizeDouble(value0-level0,ind_digits)<0)
      return LINE_STATE_CROSS_DOWN;
//--- The line touched the level from below (value1<level0 && value0==level0)
   if(NormalizeDouble(value1-level,ind_digits)<0 && NormalizeDouble(value0-level0,ind_digits)==0)
      return LINE_STATE_TOUCH_BELOW;
//--- The line touched the level from above (value1>level0 && value0==level0)
   if(NormalizeDouble(value1-level,ind_digits)>0 && NormalizeDouble(value0-level0,ind_digits)==0)
      return LINE_STATE_TOUCH_BELOW;
//--- Line is equal to the level value (value1==level0 && value0==level0)
   if(NormalizeDouble(value1-level,ind_digits)==0 && NormalizeDouble(value0-level0,ind_digits)==0)
      return LINE_STATE_EQUALS;
//--- Undefined state
   return LINE_STATE_NONE;
  }
//+------------------------------------------------------------------+
//| Return the indicator line state description                      |
//+------------------------------------------------------------------+
string LineStateDescription(const ENUM_LINE_STATE state)
  {
   switch(state)
     {
      case LINE_STATE_UP         :  return "Up";
      case LINE_STATE_STOP_UP    :  return "Stop Up";
      case LINE_STATE_TURN_UP    :  return "Turn Up";
      case LINE_STATE_DOWN       :  return "Down";
      case LINE_STATE_STOP_DOWN  :  return "Stop Down";
      case LINE_STATE_TURN_DOWN  :  return "Turn Down";
      case LINE_STATE_ABOVE      :  return "Above level";
      case LINE_STATE_UNDER      :  return "Under level";
      case LINE_STATE_CROSS_UP   :  return "Crossing Up";
      case LINE_STATE_CROSS_DOWN :  return "Crossing Down";
      case LINE_STATE_TOUCH_BELOW:  return "Touch from Below";
      case LINE_STATE_TOUCH_ABOVE:  return "Touch from Above";
      case LINE_STATE_EQUALS     :  return "Equals";
      default                    :  return "Unknown";
     }
  }
Ao usar o painel informativo, os dados são exibidos por meio da função:
//+------------------------------------------------------------------+
//| Display data from the specified timeseries index to the panel    |
//+------------------------------------------------------------------+
void DrawData(const int index,const datetime time)
  {
//--- Declare the variables to receive data in them
   MqlTick  tick={0};
   MqlRates rates[1];

//--- Exit if unable to get the current prices
   if(!SymbolInfoTick(Symbol(),tick))
      return;
//--- Exit if unable to get the bar data by the specified index
   if(CopyRates(Symbol(),PERIOD_CURRENT,index,1,rates)!=1)
      return;

//--- Set font parameters for bar and indicator data headers
   int  size=0;
   uint flags=0;
   uint angle=0;
   string name=panel.FontParams(size,flags,angle);
   panel.SetFontParams(name,9,FW_BOLD);
   panel.DrawText("Bar data ["+(string)index+"]",3,panel.TableY1(0)-16,clrMaroon,panel.Width()-6);
   panel.DrawText("Indicator data ["+(string)index+"]",3,panel.TableY1(1)-16,clrGreen,panel.Width()-6);
//--- Set font parameters for bar and indicator data
   panel.SetFontParams(name,9);

//--- Display the data of the specified bar in table 0 on the panel
   panel.DrawText("Date",  panel.CellX(0,0,0)+2, panel.CellY(0,0,0)+2); panel.DrawText(TimeToString(  rates[0].time,TIME_DATE),     panel.CellX(0,0,1)+2, panel.CellY(0,0,1)+2,clrNONE,90);
   panel.DrawText("Time",  panel.CellX(0,1,0)+2, panel.CellY(0,1,0)+2); panel.DrawText(TimeToString(  rates[0].time,TIME_MINUTES),  panel.CellX(0,1,1)+2, panel.CellY(0,1,1)+2,clrNONE,90);
   panel.DrawText("Open",  panel.CellX(0,2,0)+2, panel.CellY(0,2,0)+2); panel.DrawText(DoubleToString(rates[0].open,Digits()),      panel.CellX(0,2,1)+2, panel.CellY(0,2,1)+2,clrNONE,90);
   panel.DrawText("High",  panel.CellX(0,3,0)+2, panel.CellY(0,3,0)+2); panel.DrawText(DoubleToString(rates[0].high,Digits()),      panel.CellX(0,3,1)+2, panel.CellY(0,3,1)+2,clrNONE,90);
   panel.DrawText("Low",   panel.CellX(0,4,0)+2, panel.CellY(0,4,0)+2); panel.DrawText(DoubleToString(rates[0].low,Digits()),       panel.CellX(0,4,1)+2, panel.CellY(0,4,1)+2,clrNONE,90);
   panel.DrawText("Close", panel.CellX(0,5,0)+2, panel.CellY(0,5,0)+2); panel.DrawText(DoubleToString(rates[0].close,Digits()),     panel.CellX(0,5,1)+2, panel.CellY(0,5,1)+2,clrNONE,90);

//--- Display the indicator data from the specified bar on the panel in table 1 (upper fractal)
   panel.DrawText(ind_title+" Up", panel.CellX(1,0,0)+2, panel.CellY(1,0,0)+2);
   double value0=IndicatorValue(handle,index,UPPER_LINE);
   string value_str0=(value0!=EMPTY_VALUE ? DoubleToString(value0,ind_digits) : " ");
   panel.DrawText(value_str0,panel.CellX(1,0,1)+2,panel.CellY(1,0,1)+2,clrNONE,90);

//--- Display the indicator data from the specified bar on the panel in table 1 (lower fractal)
   panel.DrawText(ind_title+" Down", panel.CellX(1,1,0)+2, panel.CellY(1,1,0)+2);
   double value1=IndicatorValue(handle,index,LOWER_LINE);
   string value_str1=(value1!=EMPTY_VALUE ? DoubleToString(value1,ind_digits) : " ");
   panel.DrawText(value_str1,panel.CellX(1,1,1)+2,panel.CellY(1,1,1)+2,clrNONE,90);

//--- Redraw the chart to immediately display all changes on the panel
   ChartRedraw(ChartID());
  }
Além disso, ao usar o painel informativo no manipulador de eventos OnChartEvent() do EA, o manipulador de eventos do painel é chamado, e os eventos são processados para obter o índice da barra sob o cursor:
//+------------------------------------------------------------------+
//| ChartEvent function                                              |
//+------------------------------------------------------------------+
void OnChartEvent(const int id,
                  const long &lparam,
                  const double &dparam,
                  const string &sparam)
  {
//--- Handling the panel
//--- Call the panel event handler
   panel.OnChartEvent(id,lparam,dparam,sparam);

//--- If the cursor moves or a click is made on the chart
   if(id==CHARTEVENT_MOUSE_MOVE || id==CHARTEVENT_CLICK)
     {
      //--- Declare the variables to record time and price coordinates in them
      datetime time=0;
      double price=0;
      int wnd=0;
      //--- If the cursor coordinates are converted to date and time
      if(ChartXYToTimePrice(ChartID(),(int)lparam,(int)dparam,wnd,time,price))
        {
         //--- write the bar index where the cursor is located to a global variable
         mouse_bar_index=iBarShift(Symbol(),PERIOD_CURRENT,time);
         //--- Display the bar data under the cursor on the panel
         DrawData(mouse_bar_index,time);
        }
     }

//--- If we received a custom event, display the appropriate message in the journal
   if(id>CHARTEVENT_CUSTOM)
     {
      //--- Here we can implement handling a click on the close button on the panel
      PrintFormat("%s: Event id=%ld, object id (lparam): %lu, event message (sparam): %s",__FUNCTION__,id,lparam,sparam);
     }
  }
Após a compilação e execução do EA no gráfico, podemos controlar os valores dos buffers do indicador no painel informativo:
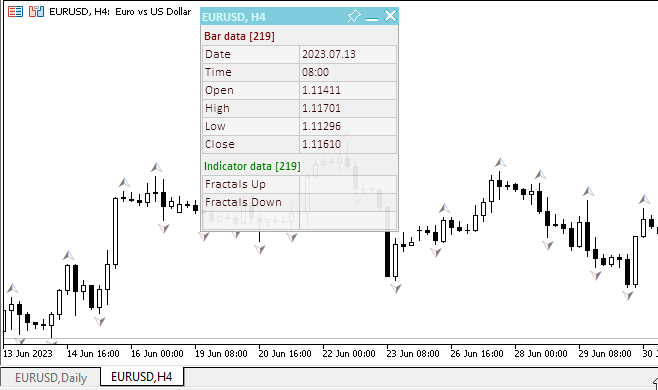
O arquivo do EA de teste "TestWilliamsFractals.mq5" pode ser visto nos arquivos anexados ao artigo.
Gator Oscillator
O Gator Oscillator é baseado no Alligator e mostra o grau de convergência/divergência de suas linhas de balanço (média móvel suavizada). A histograma superior é a diferença absoluta entre os valores da linha azul e da linha vermelha. A histograma inferior é a diferença absoluta entre os valores da linha vermelha e da linha verde, mas com um sinal negativo, porque o histograma é desenhada de cima para baixo.
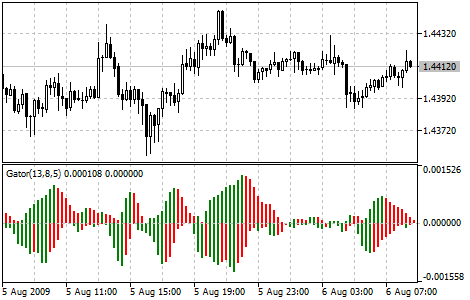
Parâmetros
Para criar um identificador do indicador, utiliza-se a função iGator():
Retorna o identificador do indicador Gator. O oscilador mostra a diferença entre a linha azul e a linha vermelha do Alligator (histograma superior) e a diferença entre a linha vermelha e a linha verde (histograma inferior).
int  iGator(
   string              symbol,            // symbol name
   ENUM_TIMEFRAMES     period,            // period
   int                 jaw_period,        // period for calculating jaws
   int                 jaw_shift,         // horizontal shift of jaws
   int                 teeth_period,      // period for calculating teeth
   int                 teeth_shift,       // teeth shift
   int                 lips_period,       // period for calculating lips
   int                 lips_shift,        // horizontal shift of lips
   ENUM_MA_METHOD      ma_method,         // smoothing type
   ENUM_APPLIED_PRICE  applied_price      // price type or handle
   );
symbol
[in] Nome simbólico do instrumento cujos dados serão usados para calcular o indicador. NULL representa o símbolo atual.
period
[in] O valor do período pode ser um dos valores da enumeração ENUM_TIMEFRAMES, 0 significa o timeframe atual.
jaw_period
[in] Período de média da linha azul (mandíbula do Alligator).
jaw_shift
[in] Deslocamento da linha azul do Alligator em relação ao gráfico de preços. Não está diretamente relacionado ao deslocamento visual da histograma do indicador.
teeth_period
[in] Período de média da linha vermelha (dentes do Alligator).
teeth_shift
[in] Deslocamento da linha vermelha do Alligator em relação ao gráfico de preços. Não está diretamente relacionado ao deslocamento visual da histograma do indicador.
lips_period
[in] Período de média da linha verde (lábios do Alligator).
lips_shift
[in] Deslocamento da linha verde do Alligator em relação ao gráfico de preços. Não está diretamente relacionado ao deslocamento visual da histograma do indicador.
ma_method
[in] Método de média. Pode ser qualquer um dos valores de ENUM_MA_METHOD.
applied_price
[in] Preço aplicado. Pode ser qualquer uma das constantes de preço de ENUM_APPLIED_PRICE ou o identificador de outro indicador.
Retorna o handle do indicador técnico especificado, em caso de falha retorna INVALID_HANDLE. A função IndicatorRelease() é usada para liberar a memória do computador do indicador que não é mais usado; o handle desse indicador é passado para ela.
Números dos buffers: 0 — UPPER_HISTOGRAM, 1- buffer de cor da histograma superior, 2 — LOWER_HISTOGRAM, 3- buffer de cor da histograma inferior.
Para criar um indicador no EA, declaramos variáveis de entrada e globais:
//+------------------------------------------------------------------+
//|                                            TestWilliamsGator.mq5 |
//|                                  Copyright 2023, MetaQuotes Ltd. |
//|                                             https://www.mql5.com |
//+------------------------------------------------------------------+
#property copyright "Copyright 2023, MetaQuotes Ltd."
#property link      "https://www.mql5.com"
#property version   "1.00"
//--- enums
enum ENUM_LINE_STATE
  {
   LINE_STATE_NONE,        // Undefined state
   LINE_STATE_UP,          // Upward
   LINE_STATE_DOWN,        // Downward
   LINE_STATE_TURN_UP,     // Upward reversal
   LINE_STATE_TURN_DOWN,   // Downward reversal
   LINE_STATE_STOP_UP,     // Upward stop
   LINE_STATE_STOP_DOWN,   // Downward stop
   LINE_STATE_ABOVE,       // Above value
   LINE_STATE_UNDER,       // Below value
   LINE_STATE_CROSS_UP,    // Crossing value upwards
   LINE_STATE_CROSS_DOWN,  // Crossing value downwards
   LINE_STATE_TOUCH_BELOW, // Touching value from below
   LINE_STATE_TOUCH_ABOVE, // Touch value from above
   LINE_STATE_EQUALS,      // Equal to value
  };
//--- input parameters
input uint                 InpPeriodJaws  =  13;            /* Jaws Period    */
input int                  InpShiftJaws   =  8;             /* Jaws Shift     */
input uint                 InpPeriodTeeth =  8;             /* Teeth Period   */
input int                  InpShiftTeeth  =  5;             /* Teeth Shift    */
input uint                 InpPeriodLips  =  5;             /* Lips Period    */
input int                  InpShiftLips   =  3;             /* Lips Shift     */
input ENUM_MA_METHOD       InpMethod      =  MODE_SMMA;     /* Smoothed       */
input ENUM_APPLIED_PRICE   InpAppliedPrice=  PRICE_MEDIAN;  /* Applied Price  */
//--- global variables
int      handle=INVALID_HANDLE;  // Indicator handle
int      period_jaws=0;          // Jaws line calculation period
int      period_teeth=0;         // Teeth line calculation period
int      period_lips=0;          // Lips line calculation period
int      ind_digits=0;           // Number of decimal places in the indicator values
string   ind_title;              // Indicator description
Ao usar um painel informativo no EA, também declaramos variáveis globais para ele e incluímos o arquivo de classes do painel:
//+------------------------------------------------------------------+
//|                                            TestWilliamsGator.mq5 |
//|                                  Copyright 2023, MetaQuotes Ltd. |
//|                                             https://www.mql5.com |
//+------------------------------------------------------------------+
#property copyright "Copyright 2023, MetaQuotes Ltd."
#property link      "https://www.mql5.com"
#property version   "1.00"
//--- includes
#include <Dashboard\Dashboard.mqh>
//--- enums
enum ENUM_LINE_STATE
  {
   LINE_STATE_NONE,        // Undefined state
   LINE_STATE_UP,          // Upward
   LINE_STATE_DOWN,        // Downward
   LINE_STATE_TURN_UP,     // Upward reversal
   LINE_STATE_TURN_DOWN,   // Downward reversal
   LINE_STATE_STOP_UP,     // Upward stop
   LINE_STATE_STOP_DOWN,   // Downward stop
   LINE_STATE_ABOVE,       // Above value
   LINE_STATE_UNDER,       // Below value
   LINE_STATE_CROSS_UP,    // Crossing value upwards
   LINE_STATE_CROSS_DOWN,  // Crossing value downwards
   LINE_STATE_TOUCH_BELOW, // Touching value from below
   LINE_STATE_TOUCH_ABOVE, // Touch value from above
   LINE_STATE_EQUALS,      // Equal to value
  };
//--- input parameters
input uint                 InpPeriodJaws  =  13;            /* Jaws Period    */
input int                  InpShiftJaws   =  8;             /* Jaws Shift     */
input uint                 InpPeriodTeeth =  8;             /* Teeth Period   */
input int                  InpShiftTeeth  =  5;             /* Teeth Shift    */
input uint                 InpPeriodLips  =  5;             /* Lips Period    */
input int                  InpShiftLips   =  3;             /* Lips Shift     */
input ENUM_MA_METHOD       InpMethod      =  MODE_SMMA;     /* Smoothed       */
input ENUM_APPLIED_PRICE   InpAppliedPrice=  PRICE_MEDIAN;  /* Applied Price  */
//--- global variables
int      handle=INVALID_HANDLE;  // Indicator handle
int      period_jaws=0;          // Jaws line calculation period
int      period_teeth=0;         // Teeth line calculation period
int      period_lips=0;          // Lips line calculation period
int      ind_digits=0;           // Number of decimal places in the indicator values
string   ind_title;              // Indicator description
//--- variables for the panel
int      mouse_bar_index;        // Index of the bar the data is taken from
CDashboard *panel=NULL;          // Pointer to the panel object
Inicialização
Configuramos os valores das variáveis globais para o indicador e criamos seu handle:
//+------------------------------------------------------------------+
//| Expert initialization function                                   |
//+------------------------------------------------------------------+
int OnInit()
  {
//--- create timer
   EventSetTimer(60);

//--- Indicator
//--- Set and adjust the calculation period if necessary
   period_jaws=int(InpPeriodJaws<1 ? 13 : InpPeriodJaws);
   period_teeth=int(InpPeriodTeeth<1 ? 8 : InpPeriodTeeth);
   period_lips=int(InpPeriodLips<1 ? 5 : InpPeriodLips);
//--- Set the indicator name and the number of decimal places
   ind_title=StringFormat("Gator(%lu,%lu,%lu)",period_jaws,period_teeth,period_lips);
   ind_digits=Digits()+1;
//--- Create indicator handle
   ResetLastError();
   handle=iGator(Symbol(),PERIOD_CURRENT,period_jaws,InpShiftJaws,period_teeth,InpShiftTeeth,period_lips,InpShiftLips,InpMethod,InpAppliedPrice);
   if(handle==INVALID_HANDLE)
     {
      PrintFormat("%s: Failed to create indicator handle %s. Error %ld",__FUNCTION__,ind_title,GetLastError());
      return INIT_FAILED;
     }

//--- Successful initialization
   return(INIT_SUCCEEDED);
  }
Ao usar o painel informativo no EA, criamos o painel:
//+------------------------------------------------------------------+
//| Expert initialization function                                   |
//+------------------------------------------------------------------+
int OnInit()
  {
//--- create timer
   EventSetTimer(60);

//--- Indicator
//--- Set and adjust the calculation period if necessary
   period_jaws=int(InpPeriodJaws<1 ? 13 : InpPeriodJaws);
   period_teeth=int(InpPeriodTeeth<1 ? 8 : InpPeriodTeeth);
   period_lips=int(InpPeriodLips<1 ? 5 : InpPeriodLips);
//--- Set the indicator name and the number of decimal places
   ind_title=StringFormat("Gator(%lu,%lu,%lu)",period_jaws,period_teeth,period_lips);
   ind_digits=Digits()+1;
//--- Create indicator handle
   ResetLastError();
   handle=iGator(Symbol(),PERIOD_CURRENT,period_jaws,InpShiftJaws,period_teeth,InpShiftTeeth,period_lips,InpShiftLips,InpMethod,InpAppliedPrice);
   if(handle==INVALID_HANDLE)
     {
      PrintFormat("%s: Failed to create indicator handle %s. Error %ld",__FUNCTION__,ind_title,GetLastError());
      return INIT_FAILED;
     }

//--- Dashboard
//--- Create the panel
   panel=new CDashboard(1,20,20,229,225);
   if(panel==NULL)
     {
      Print("Error. Failed to create panel object");
      return INIT_FAILED;
     }
//--- Set font parameters
   panel.SetFontParams("Calibri",9);
//--- Display the panel with the "Symbol, Timeframe description" header text
   panel.View(Symbol()+", "+StringSubstr(EnumToString(Period()),7));
//--- Create a table with ID 0 to display bar data in it
   panel.CreateNewTable(0);
//--- Draw a table with ID 0 on the panel background
   panel.DrawGrid(0,2,20,6,2,18,112);

//--- Create a table with ID 1 to display indicator data in it
   panel.CreateNewTable(1);
//--- Get the Y2 table coordinate with ID 0 and
//--- set the Y1 coordinate for the table with ID 1
   int y1=panel.TableY2(0)+22;
//--- Draw a table with ID 1 on the panel background
   panel.DrawGrid(1,2,y1,3,2,18,112);

//--- Display tabular data in the journal
   panel.GridPrint(0,2);
   panel.GridPrint(1,2);
//--- Initialize the variable with the index of the mouse cursor bar
   mouse_bar_index=0;
//--- Display the data of the current bar on the panel
   DrawData(mouse_bar_index,TimeCurrent());

//--- Successful initialization
   return(INIT_SUCCEEDED);
  }
Desinicialização
No manipulador OnDeinit() do EA, liberamos o handle do indicador:
//+------------------------------------------------------------------+
//| Expert deinitialization function                                 |
//+------------------------------------------------------------------+
void OnDeinit(const int reason)
  {
//--- destroy timer
   EventKillTimer();

//--- Release handle of the indicator
   ResetLastError();
   if(!IndicatorRelease(handle))
      PrintFormat("%s: IndicatorRelease failed. Error %ld",__FUNCTION__,GetLastError());
//--- Clear all comments on the chart
   Comment("");
  }
Ao usar o painel informativo, removemos o objeto do painel criado:
//+------------------------------------------------------------------+
//| Expert deinitialization function                                 |
//+------------------------------------------------------------------+
void OnDeinit(const int reason)
  {
//--- destroy timer
   EventKillTimer();

//--- Release handle of the indicator
   ResetLastError();
   if(!IndicatorRelease(handle))
      PrintFormat("%s: IndicatorRelease failed. Error %ld",__FUNCTION__,GetLastError());
//--- Clear all comments on the chart
   Comment("");

//--- If the panel object exists, delete it
   if(panel!=NULL)
      delete panel;
  }
Recuperação de dados
A seguir, são apresentadas funções gerais para acessar dados pelo handle do indicador. As funções foram discutidas no artigo sobre a integração de osciladores aos EAs. As funções apresentadas podem ser usadas "como estão" em seus programas:
//+------------------------------------------------------------------+
//| Return the indicator data on the specified bar                   |
//+------------------------------------------------------------------+
double IndicatorValue(const int ind_handle,const int index,const int buffer_num)
  {
   double array[1]={0};
   ResetLastError();
   if(CopyBuffer(ind_handle,buffer_num,index,1,array)!=1)
     {
      PrintFormat("%s: CopyBuffer failed. Error %ld",__FUNCTION__,GetLastError());
      return EMPTY_VALUE;
     }
   return array[0];
  }
//+------------------------------------------------------------------+
//| Return the state of the indicator line                           |
//+------------------------------------------------------------------+
ENUM_LINE_STATE LineState(const int ind_handle,const int index,const int buffer_num)
  {
//--- Get the values of the indicator line with the shift (0,1,2) relative to the passed index
   const double value0=IndicatorValue(ind_handle,index,  buffer_num);
   const double value1=IndicatorValue(ind_handle,index+1,buffer_num);
   const double value2=IndicatorValue(ind_handle,index+2,buffer_num);
//--- If at least one of the values could not be obtained, return an undefined value
   if(value0==EMPTY_VALUE || value1==EMPTY_VALUE || value2==EMPTY_VALUE)
      return LINE_STATE_NONE;
//--- Line upward reversal (value2>value1 && value0>value1)
   if(NormalizeDouble(value2-value1,ind_digits)>0 && NormalizeDouble(value0-value1,ind_digits)>0)
      return LINE_STATE_TURN_UP;
//--- Line upward direction (value2<=value1 && value0>value1)
   else if(NormalizeDouble(value2-value1,ind_digits)<=0 && NormalizeDouble(value0-value1,ind_digits)>0)
      return LINE_STATE_UP;
//--- Line upward stop (value2<=value1 && value0==value1)
   else if(NormalizeDouble(value2-value1,ind_digits)<=0 && NormalizeDouble(value0-value1,ind_digits)==0)
      return LINE_STATE_STOP_UP;
//--- Line downward reversal (value2<value1 && value0<value1)
   if(NormalizeDouble(value2-value1,ind_digits)<0 && NormalizeDouble(value0-value1,ind_digits)<0)
      return LINE_STATE_TURN_DOWN;
//--- Line downward direction (value2>=value1 && value0<value1)
   else if(NormalizeDouble(value2-value1,ind_digits)>=0 && NormalizeDouble(value0-value1,ind_digits)<0)
      return LINE_STATE_DOWN;
//--- Line downward stop (value2>=value1 && value0==value1)
   else if(NormalizeDouble(value2-value1,ind_digits)>=0 && NormalizeDouble(value0-value1,ind_digits)==0)
      return LINE_STATE_STOP_DOWN;
//--- Undefined state
   return LINE_STATE_NONE;
  }
//+------------------------------------------------------------------+
//| Return the state of the line relative to the specified level     |
//+------------------------------------------------------------------+
ENUM_LINE_STATE LineStateRelative(const int ind_handle,const int index,const int buffer_num,const double level0,const double level1=EMPTY_VALUE)
  {
//--- Get the values of the indicator line with the shift (0,1) relative to the passed index
   const double value0=IndicatorValue(ind_handle,index,  buffer_num);
   const double value1=IndicatorValue(ind_handle,index+1,buffer_num);
//--- If at least one of the values could not be obtained, return an undefined value
   if(value0==EMPTY_VALUE || value1==EMPTY_VALUE)
      return LINE_STATE_NONE;
//--- Define the second level to compare
   double level=(level1==EMPTY_VALUE ? level0 : level1);
//--- The line is below the level (value1<level && value0<level0)
   if(NormalizeDouble(value1-level,ind_digits)<0 && NormalizeDouble(value0-level0,ind_digits)<0)
      return LINE_STATE_UNDER;
//--- The line is above the level (value1>level && value0>level0)
   if(NormalizeDouble(value1-level,ind_digits)>0 && NormalizeDouble(value0-level0,ind_digits)>0)
      return LINE_STATE_ABOVE;
//--- The line crossed the level upwards (value1<=level && value0>level0)
   if(NormalizeDouble(value1-level,ind_digits)<=0 && NormalizeDouble(value0-level0,ind_digits)>0)
      return LINE_STATE_CROSS_UP;
//--- The line crossed the level downwards (value1>=level && value0<level0)
   if(NormalizeDouble(value1-level,ind_digits)>=0 && NormalizeDouble(value0-level0,ind_digits)<0)
      return LINE_STATE_CROSS_DOWN;
//--- The line touched the level from below (value1<level0 && value0==level0)
   if(NormalizeDouble(value1-level,ind_digits)<0 && NormalizeDouble(value0-level0,ind_digits)==0)
      return LINE_STATE_TOUCH_BELOW;
//--- The line touched the level from above (value1>level0 && value0==level0)
   if(NormalizeDouble(value1-level,ind_digits)>0 && NormalizeDouble(value0-level0,ind_digits)==0)
      return LINE_STATE_TOUCH_BELOW;
//--- Line is equal to the level value (value1==level0 && value0==level0)
   if(NormalizeDouble(value1-level,ind_digits)==0 && NormalizeDouble(value0-level0,ind_digits)==0)
      return LINE_STATE_EQUALS;
//--- Undefined state
   return LINE_STATE_NONE;
  }
//+------------------------------------------------------------------+
//| Return the indicator line state description                      |
//+------------------------------------------------------------------+
string LineStateDescription(const ENUM_LINE_STATE state)
  {
   switch(state)
     {
      case LINE_STATE_UP         :  return "Up";
      case LINE_STATE_STOP_UP    :  return "Stop Up";
      case LINE_STATE_TURN_UP    :  return "Turn Up";
      case LINE_STATE_DOWN       :  return "Down";
      case LINE_STATE_STOP_DOWN  :  return "Stop Down";
      case LINE_STATE_TURN_DOWN  :  return "Turn Down";
      case LINE_STATE_ABOVE      :  return "Above level";
      case LINE_STATE_UNDER      :  return "Under level";
      case LINE_STATE_CROSS_UP   :  return "Crossing Up";
      case LINE_STATE_CROSS_DOWN :  return "Crossing Down";
      case LINE_STATE_TOUCH_BELOW:  return "Touch from Below";
      case LINE_STATE_TOUCH_ABOVE:  return "Touch from Above";
      case LINE_STATE_EQUALS     :  return "Equals";
      default                    :  return "Unknown";
     }
  }
Ao usar o painel informativo, os dados são exibidos por meio da função:
//+------------------------------------------------------------------+
//| Display data from the specified timeseries index to the panel    |
//+------------------------------------------------------------------+
void DrawData(const int index,const datetime time)
  {
//--- Declare the variables to receive data in them
   MqlTick  tick={0};
   MqlRates rates[1];

//--- Exit if unable to get the current prices
   if(!SymbolInfoTick(Symbol(),tick))
      return;
//--- Exit if unable to get the bar data by the specified index
   if(CopyRates(Symbol(),PERIOD_CURRENT,index,1,rates)!=1)
      return;

//--- Set font parameters for bar and indicator data headers
   int  size=0;
   uint flags=0;
   uint angle=0;
   string name=panel.FontParams(size,flags,angle);
   panel.SetFontParams(name,9,FW_BOLD);
   panel.DrawText("Bar data ["+(string)index+"]",3,panel.TableY1(0)-16,clrMaroon,panel.Width()-6);
   panel.DrawText("Indicator data ["+(string)index+"]",3,panel.TableY1(1)-16,clrGreen,panel.Width()-6);
//--- Set font parameters for bar and indicator data
   panel.SetFontParams(name,9);

//--- Display the data of the specified bar in table 0 on the panel
   panel.DrawText("Date",  panel.CellX(0,0,0)+2, panel.CellY(0,0,0)+2); panel.DrawText(TimeToString(  rates[0].time,TIME_DATE),     panel.CellX(0,0,1)+2, panel.CellY(0,0,1)+2,clrNONE,90);
   panel.DrawText("Time",  panel.CellX(0,1,0)+2, panel.CellY(0,1,0)+2); panel.DrawText(TimeToString(  rates[0].time,TIME_MINUTES),  panel.CellX(0,1,1)+2, panel.CellY(0,1,1)+2,clrNONE,90);
   panel.DrawText("Open",  panel.CellX(0,2,0)+2, panel.CellY(0,2,0)+2); panel.DrawText(DoubleToString(rates[0].open,Digits()),      panel.CellX(0,2,1)+2, panel.CellY(0,2,1)+2,clrNONE,90);
   panel.DrawText("High",  panel.CellX(0,3,0)+2, panel.CellY(0,3,0)+2); panel.DrawText(DoubleToString(rates[0].high,Digits()),      panel.CellX(0,3,1)+2, panel.CellY(0,3,1)+2,clrNONE,90);
   panel.DrawText("Low",   panel.CellX(0,4,0)+2, panel.CellY(0,4,0)+2); panel.DrawText(DoubleToString(rates[0].low,Digits()),       panel.CellX(0,4,1)+2, panel.CellY(0,4,1)+2,clrNONE,90);
   panel.DrawText("Close", panel.CellX(0,5,0)+2, panel.CellY(0,5,0)+2); panel.DrawText(DoubleToString(rates[0].close,Digits()),     panel.CellX(0,5,1)+2, panel.CellY(0,5,1)+2,clrNONE,90);

//--- Get the indicator buffers data
   double value0=IndicatorValue(handle,index,UPPER_HISTOGRAM); // Upper histogram
   double value1=IndicatorValue(handle,index,1);               // Upper histogram color buffer
   double value2=IndicatorValue(handle,index,LOWER_HISTOGRAM); // Lower histogram
   double value3=IndicatorValue(handle,index,3);               // Lower histogram color buffer
   color clr=clrNONE;
//--- Display the upper histogram data from the specified bar on the panel in table 1
   panel.DrawText(ind_title+" Up", panel.CellX(1,0,0)+2, panel.CellY(1,0,0)+2);
   string value_str=(value0!=EMPTY_VALUE ? DoubleToString(value0,ind_digits) : "");
   clr=(value1>0 ? clrRed : clrGreen);
   panel.DrawText(value_str,panel.CellX(1,0,1)+2,panel.CellY(1,0,1)+2,clr,100);

//--- Display the lower histogram data from the specified bar on the panel in table 1
   panel.DrawText(ind_title+" Down", panel.CellX(1,1,0)+2, panel.CellY(1,1,0)+2);
   value_str=(value2!=EMPTY_VALUE ? DoubleToString(value2,ind_digits) : "");
   clr=(value3>0 ? clrRed : clrGreen);
   panel.DrawText(value_str,panel.CellX(1,1,1)+2,panel.CellY(1,1,1)+2,clr,100);

//--- Redraw the chart to immediately display all changes on the panel
   ChartRedraw(ChartID());
  }
A cor do texto, que descreve os valores dos buffers do indicador, tem a cor correspondente à coluna do histograma do indicador.
Além disso, ao usar o painel informativo no manipulador de eventos OnChartEvent() do EA, o manipulador de eventos do painel é chamado, e os eventos são processados para obter o índice da barra sob o cursor:
//+------------------------------------------------------------------+
//| ChartEvent function                                              |
//+------------------------------------------------------------------+
void OnChartEvent(const int id,
                  const long &lparam,
                  const double &dparam,
                  const string &sparam)
  {
//--- Handling the panel
//--- Call the panel event handler
   panel.OnChartEvent(id,lparam,dparam,sparam);

//--- If the cursor moves or a click is made on the chart
   if(id==CHARTEVENT_MOUSE_MOVE || id==CHARTEVENT_CLICK)
     {
      //--- Declare the variables to record time and price coordinates in them
      datetime time=0;
      double price=0;
      int wnd=0;
      //--- If the cursor coordinates are converted to date and time
      if(ChartXYToTimePrice(ChartID(),(int)lparam,(int)dparam,wnd,time,price))
        {
         //--- write the bar index where the cursor is located to a global variable
         mouse_bar_index=iBarShift(Symbol(),PERIOD_CURRENT,time);
         //--- Display the bar data under the cursor on the panel
         DrawData(mouse_bar_index,time);
        }
     }

//--- If we received a custom event, display the appropriate message in the journal
   if(id>CHARTEVENT_CUSTOM)
     {
      //--- Here we can implement handling a click on the close button on the panel
      PrintFormat("%s: Event id=%ld, object id (lparam): %lu, event message (sparam): %s",__FUNCTION__,id,lparam,sparam);
     }
  }
Após a compilação e execução do EA no gráfico, podemos monitorar o valor e o estado da linha do indicador no painel informativo:
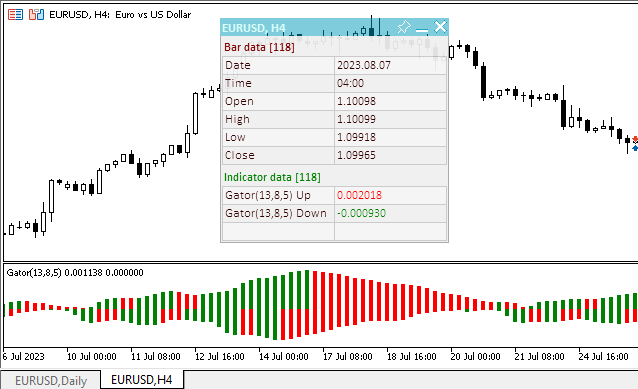
O arquivo do EA de teste "TestWilliamsGator.mq5" pode ser visualizado nos arquivos anexados ao artigo.
Market Facilitation Index
O indicador técnico Índice de Facilitação de Mercado (Market Facilitation Index, BW MFI) mostra a mudança de preço por tick. Os valores absolutos do indicador em si não significam nada, apenas as mudanças do indicador são significativas. Bill Williams atribui grande importância às mudanças do indicador e volume:
- O indicador Market Facilitation Index aumentou e o volume aumentou — isso indica que: a) um número cada vez maior de participantes está entrando no mercado (o volume está aumentando), b) os recém-chegados estão abrindo posições na direção da barra, ou seja, o movimento começou e está ganhando velocidade.
- O indicador Market Facilitation Index caiu e o volume caiu. Isso indica a perda de interesse dos participantes do mercado.
- O indicador Market Facilitation Index aumentou, mas o volume caiu. O mercado não é suportado pelo volume por parte dos traders, e o preço muda devido às especulações dos traders "de chão" (intermediários — corretoras e dealers).
- O indicador Market Facilitation Index caiu, mas o volume aumentou. Está ocorrendo uma batalha entre touros e ursos, com um grande volume de compras e vendas, mas com um movimento de preço insignificante devido às forças aproximadamente iguais. Uma das duas partes opostas (compradores contra vendedores) vencerá. Normalmente, uma quebra dessa barra indica se essa barra continua a tendência ou se a tendência é anulada. Bill Williams chama essa barra de "agachamento".
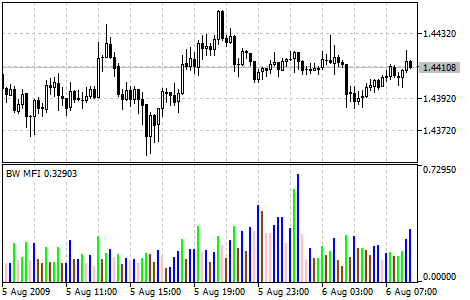
Parâmetros
Para criar um handle do indicador, é usada a função iBWMFI():
Retorna o handle do indicador Market Facilitation Index. Apenas um buffer.
int  iBWMFI(
   string               symbol,             // symbol name
   ENUM_TIMEFRAMES      period,             // period
   ENUM_APPLIED_VOLUME  applied_volume      // type of volume used for calculations
   );
symbol
[in] Nome simbólico do instrumento cujos dados serão usados para calcular o indicador. NULL representa o símbolo atual.
period
[in] O valor do período pode ser um dos valores da enumeração ENUM_TIMEFRAMES, 0 significa o timeframe atual.
applied_volume
[in] Volume utilizado. Pode ser qualquer um dos valores da enumeração ENUM_APPLIED_VOLUME.
Retorna o handle do indicador técnico especificado, em caso de falha retorna INVALID_HANDLE. A função IndicatorRelease() é usada para liberar a memória do computador do indicador que não é mais usado; o handle desse indicador é passado para ela.
Para criar um indicador no EA, declaramos variáveis de entrada e globais:
//+------------------------------------------------------------------+
//|                                            TestWilliamsBWMFI.mq5 |
//|                                  Copyright 2023, MetaQuotes Ltd. |
//|                                             https://www.mql5.com |
//+------------------------------------------------------------------+
#property copyright "Copyright 2023, MetaQuotes Ltd."
#property link      "https://www.mql5.com"
#property version   "1.00"
//--- enums
enum ENUM_LINE_STATE
  {
   LINE_STATE_NONE,        // Undefined state
   LINE_STATE_UP,          // Upward
   LINE_STATE_DOWN,        // Downward
   LINE_STATE_TURN_UP,     // Upward reversal
   LINE_STATE_TURN_DOWN,   // Downward reversal
   LINE_STATE_STOP_UP,     // Upward stop
   LINE_STATE_STOP_DOWN,   // Downward stop
   LINE_STATE_ABOVE,       // Above value
   LINE_STATE_UNDER,       // Below value
   LINE_STATE_CROSS_UP,    // Crossing value upwards
   LINE_STATE_CROSS_DOWN,  // Crossing value downwards
   LINE_STATE_TOUCH_BELOW, // Touching value from below
   LINE_STATE_TOUCH_ABOVE, // Touch value from above
   LINE_STATE_EQUALS,      // Equal to value
  };
//--- input parameters
input ENUM_APPLIED_VOLUME  InpVolume   =  VOLUME_TICK;   /* Applied Volume */
//--- global variables
int      handle=INVALID_HANDLE;  // Indicator handle
int      ind_digits=0;           // Number of decimal places in the indicator values
string   ind_title;              // Indicator description
Ao usar um painel informativo no EA, também declaramos variáveis globais para ele e incluímos o arquivo de classes do painel:
//+------------------------------------------------------------------+
//|                                            TestWilliamsBWMFI.mq5 |
//|                                  Copyright 2023, MetaQuotes Ltd. |
//|                                             https://www.mql5.com |
//+------------------------------------------------------------------+
#property copyright "Copyright 2023, MetaQuotes Ltd."
#property link      "https://www.mql5.com"
#property version   "1.00"
//--- includes
#include <Dashboard\Dashboard.mqh>
//--- enums
enum ENUM_LINE_STATE
  {
   LINE_STATE_NONE,        // Undefined state
   LINE_STATE_UP,          // Upward
   LINE_STATE_DOWN,        // Downward
   LINE_STATE_TURN_UP,     // Upward reversal
   LINE_STATE_TURN_DOWN,   // Downward reversal
   LINE_STATE_STOP_UP,     // Upward stop
   LINE_STATE_STOP_DOWN,   // Downward stop
   LINE_STATE_ABOVE,       // Above value
   LINE_STATE_UNDER,       // Below value
   LINE_STATE_CROSS_UP,    // Crossing value upwards
   LINE_STATE_CROSS_DOWN,  // Crossing value downwards
   LINE_STATE_TOUCH_BELOW, // Touching value from below
   LINE_STATE_TOUCH_ABOVE, // Touch value from above
   LINE_STATE_EQUALS,      // Equal to value
  };
//--- input parameters
input ENUM_APPLIED_VOLUME  InpVolume   =  VOLUME_TICK;   /* Applied Volume */
//--- global variables
int      handle=INVALID_HANDLE;  // Indicator handle
int      ind_digits=0;           // Number of decimal places in the indicator values
string   ind_title;              // Indicator description
//--- variables for the panel
int      mouse_bar_index;        // Index of the bar the data is taken from
CDashboard *panel=NULL;          // Pointer to the panel object
Inicialização
Configuramos os valores das variáveis globais para o indicador e criamos seu handle:
//+------------------------------------------------------------------+
//| Expert initialization function                                   |
//+------------------------------------------------------------------+
int OnInit()
  {
//--- create timer
   EventSetTimer(60);

//--- Indicator
//--- Set the indicator name and the number of decimal places
   ind_title="BW MFI";
   ind_digits=Digits();
//--- Create indicator handle
   ResetLastError();
   handle=iBWMFI(Symbol(),PERIOD_CURRENT,InpVolume);
   if(handle==INVALID_HANDLE)
     {
      PrintFormat("%s: Failed to create indicator handle %s. Error %ld",__FUNCTION__,ind_title,GetLastError());
      return INIT_FAILED;
     }

//--- Successful initialization
   return(INIT_SUCCEEDED);
  }
Ao usar o painel informativo no EA, criamos o painel:
//+------------------------------------------------------------------+
//| Expert initialization function                                   |
//+------------------------------------------------------------------+
int OnInit()
  {
//--- create timer
   EventSetTimer(60);

//--- Indicator
//--- Set the indicator name and the number of decimal places
   ind_title="BW MFI";
   ind_digits=Digits();
//--- Create indicator handle
   ResetLastError();
   handle=iBWMFI(Symbol(),PERIOD_CURRENT,InpVolume);
   if(handle==INVALID_HANDLE)
     {
      PrintFormat("%s: Failed to create indicator handle %s. Error %ld",__FUNCTION__,ind_title,GetLastError());
      return INIT_FAILED;
     }

//--- Dashboard
//--- Create the panel
   panel=new CDashboard(1,20,20,199,225);
   if(panel==NULL)
     {
      Print("Error. Failed to create panel object");
      return INIT_FAILED;
     }
//--- Set font parameters
   panel.SetFontParams("Calibri",9);
//--- Display the panel with the "Symbol, Timeframe description" header text
   panel.View(Symbol()+", "+StringSubstr(EnumToString(Period()),7));
//--- Create a table with ID 0 to display bar data in it
   panel.CreateNewTable(0);
//--- Draw a table with ID 0 on the panel background
   panel.DrawGrid(0,2,20,6,2,18,97);

//--- Create a table with ID 1 to display indicator data in it
   panel.CreateNewTable(1);
//--- Get the Y2 table coordinate with ID 0 and
//--- set the Y1 coordinate for the table with ID 1
   int y1=panel.TableY2(0)+22;
//--- Draw a table with ID 1 on the panel background
   panel.DrawGrid(1,2,y1,3,2,18,97);

//--- Display tabular data in the journal
   panel.GridPrint(0,2);
   panel.GridPrint(1,2);
//--- Initialize the variable with the index of the mouse cursor bar
   mouse_bar_index=0;
//--- Display the data of the current bar on the panel
   DrawData(mouse_bar_index,TimeCurrent());

//--- Successful initialization
   return(INIT_SUCCEEDED);
  }
Desinicialização
No manipulador OnDeinit() do EA, liberamos o handle do indicador:
//+------------------------------------------------------------------+
//| Expert deinitialization function                                 |
//+------------------------------------------------------------------+
void OnDeinit(const int reason)
  {
//--- destroy timer
   EventKillTimer();

//--- Release handle of the indicator
   ResetLastError();
   if(!IndicatorRelease(handle))
      PrintFormat("%s: IndicatorRelease failed. Error %ld",__FUNCTION__,GetLastError());
//--- Clear all comments on the chart
   Comment("");
  }
Ao usar o painel informativo, removemos o objeto do painel criado:
//+------------------------------------------------------------------+
//| Expert deinitialization function                                 |
//+------------------------------------------------------------------+
void OnDeinit(const int reason)
  {
//--- destroy timer
   EventKillTimer();

//--- Release handle of the indicator
   ResetLastError();
   if(!IndicatorRelease(handle))
      PrintFormat("%s: IndicatorRelease failed. Error %ld",__FUNCTION__,GetLastError());
//--- Clear all comments on the chart
   Comment("");

//--- If the panel object exists, delete it
   if(panel!=NULL)
      delete panel;
  }
Recuperação de dados
A seguir, são apresentadas funções gerais para acessar dados pelo handle do indicador. As funções foram discutidas no artigo sobre a integração de osciladores aos EAs. As funções apresentadas podem ser usadas "como estão" em seus programas:
//+------------------------------------------------------------------+
//| Return the indicator data on the specified bar                   |
//+------------------------------------------------------------------+
double IndicatorValue(const int ind_handle,const int index,const int buffer_num)
  {
   double array[1]={0};
   ResetLastError();
   if(CopyBuffer(ind_handle,buffer_num,index,1,array)!=1)
     {
      PrintFormat("%s: CopyBuffer failed. Error %ld",__FUNCTION__,GetLastError());
      return EMPTY_VALUE;
     }
   return array[0];
  }
//+------------------------------------------------------------------+
//| Return the state of the indicator line                           |
//+------------------------------------------------------------------+
ENUM_LINE_STATE LineState(const int ind_handle,const int index,const int buffer_num)
  {
//--- Get the values of the indicator line with the shift (0,1,2) relative to the passed index
   const double value0=IndicatorValue(ind_handle,index,  buffer_num);
   const double value1=IndicatorValue(ind_handle,index+1,buffer_num);
   const double value2=IndicatorValue(ind_handle,index+2,buffer_num);
//--- If at least one of the values could not be obtained, return an undefined value
   if(value0==EMPTY_VALUE || value1==EMPTY_VALUE || value2==EMPTY_VALUE)
      return LINE_STATE_NONE;
//--- Line upward reversal (value2>value1 && value0>value1)
   if(NormalizeDouble(value2-value1,ind_digits)>0 && NormalizeDouble(value0-value1,ind_digits)>0)
      return LINE_STATE_TURN_UP;
//--- Line upward direction (value2<=value1 && value0>value1)
   else if(NormalizeDouble(value2-value1,ind_digits)<=0 && NormalizeDouble(value0-value1,ind_digits)>0)
      return LINE_STATE_UP;
//--- Line upward stop (value2<=value1 && value0==value1)
   else if(NormalizeDouble(value2-value1,ind_digits)<=0 && NormalizeDouble(value0-value1,ind_digits)==0)
      return LINE_STATE_STOP_UP;
//--- Line downward reversal (value2<value1 && value0<value1)
   if(NormalizeDouble(value2-value1,ind_digits)<0 && NormalizeDouble(value0-value1,ind_digits)<0)
      return LINE_STATE_TURN_DOWN;
//--- Line downward direction (value2>=value1 && value0<value1)
   else if(NormalizeDouble(value2-value1,ind_digits)>=0 && NormalizeDouble(value0-value1,ind_digits)<0)
      return LINE_STATE_DOWN;
//--- Line downward stop (value2>=value1 && value0==value1)
   else if(NormalizeDouble(value2-value1,ind_digits)>=0 && NormalizeDouble(value0-value1,ind_digits)==0)
      return LINE_STATE_STOP_DOWN;
//--- Undefined state
   return LINE_STATE_NONE;
  }
//+------------------------------------------------------------------+
//| Return the state of the line relative to the specified level     |
//+------------------------------------------------------------------+
ENUM_LINE_STATE LineStateRelative(const int ind_handle,const int index,const int buffer_num,const double level0,const double level1=EMPTY_VALUE)
  {
//--- Get the values of the indicator line with the shift (0,1) relative to the passed index
   const double value0=IndicatorValue(ind_handle,index,  buffer_num);
   const double value1=IndicatorValue(ind_handle,index+1,buffer_num);
//--- If at least one of the values could not be obtained, return an undefined value
   if(value0==EMPTY_VALUE || value1==EMPTY_VALUE)
      return LINE_STATE_NONE;
//--- Define the second level to compare
   double level=(level1==EMPTY_VALUE ? level0 : level1);
//--- The line is below the level (value1<level && value0<level0)
   if(NormalizeDouble(value1-level,ind_digits)<0 && NormalizeDouble(value0-level0,ind_digits)<0)
      return LINE_STATE_UNDER;
//--- The line is above the level (value1>level && value0>level0)
   if(NormalizeDouble(value1-level,ind_digits)>0 && NormalizeDouble(value0-level0,ind_digits)>0)
      return LINE_STATE_ABOVE;
//--- The line crossed the level upwards (value1<=level && value0>level0)
   if(NormalizeDouble(value1-level,ind_digits)<=0 && NormalizeDouble(value0-level0,ind_digits)>0)
      return LINE_STATE_CROSS_UP;
//--- The line crossed the level downwards (value1>=level && value0<level0)
   if(NormalizeDouble(value1-level,ind_digits)>=0 && NormalizeDouble(value0-level0,ind_digits)<0)
      return LINE_STATE_CROSS_DOWN;
//--- The line touched the level from below (value1<level0 && value0==level0)
   if(NormalizeDouble(value1-level,ind_digits)<0 && NormalizeDouble(value0-level0,ind_digits)==0)
      return LINE_STATE_TOUCH_BELOW;
//--- The line touched the level from above (value1>level0 && value0==level0)
   if(NormalizeDouble(value1-level,ind_digits)>0 && NormalizeDouble(value0-level0,ind_digits)==0)
      return LINE_STATE_TOUCH_BELOW;
//--- Line is equal to the level value (value1==level0 && value0==level0)
   if(NormalizeDouble(value1-level,ind_digits)==0 && NormalizeDouble(value0-level0,ind_digits)==0)
      return LINE_STATE_EQUALS;
//--- Undefined state
   return LINE_STATE_NONE;
  }
//+------------------------------------------------------------------+
//| Return the indicator line state description                      |
//+------------------------------------------------------------------+
string LineStateDescription(const ENUM_LINE_STATE state)
  {
   switch(state)
     {
      case LINE_STATE_UP         :  return "Up";
      case LINE_STATE_STOP_UP    :  return "Stop Up";
      case LINE_STATE_TURN_UP    :  return "Turn Up";
      case LINE_STATE_DOWN       :  return "Down";
      case LINE_STATE_STOP_DOWN  :  return "Stop Down";
      case LINE_STATE_TURN_DOWN  :  return "Turn Down";
      case LINE_STATE_ABOVE      :  return "Above level";
      case LINE_STATE_UNDER      :  return "Under level";
      case LINE_STATE_CROSS_UP   :  return "Crossing Up";
      case LINE_STATE_CROSS_DOWN :  return "Crossing Down";
      case LINE_STATE_TOUCH_BELOW:  return "Touch from Below";
      case LINE_STATE_TOUCH_ABOVE:  return "Touch from Above";
      case LINE_STATE_EQUALS     :  return "Equals";
      default                    :  return "Unknown";
     }
  }
Ao usar o painel informativo, os dados são exibidos por meio da função:
//+------------------------------------------------------------------+
//| Display data from the specified timeseries index to the panel    |
//+------------------------------------------------------------------+
void DrawData(const int index,const datetime time)
  {
//--- Declare the variables to receive data in them
   MqlTick  tick={0};
   MqlRates rates[1];

//--- Exit if unable to get the current prices
   if(!SymbolInfoTick(Symbol(),tick))
      return;
//--- Exit if unable to get the bar data by the specified index
   if(CopyRates(Symbol(),PERIOD_CURRENT,index,1,rates)!=1)
      return;

//--- Set font parameters for bar and indicator data headers
   int  size=0;
   uint flags=0;
   uint angle=0;
   string name=panel.FontParams(size,flags,angle);
   panel.SetFontParams(name,9,FW_BOLD);
   panel.DrawText("Bar data ["+(string)index+"]",3,panel.TableY1(0)-16,clrMaroon,panel.Width()-6);
   panel.DrawText("Indicator data ["+(string)index+"]",3,panel.TableY1(1)-16,clrGreen,panel.Width()-6);
//--- Set font parameters for bar and indicator data
   panel.SetFontParams(name,9);

//--- Display the data of the specified bar in table 0 on the panel
   panel.DrawText("Date",  panel.CellX(0,0,0)+2, panel.CellY(0,0,0)+2); panel.DrawText(TimeToString(  rates[0].time,TIME_DATE),     panel.CellX(0,0,1)+2, panel.CellY(0,0,1)+2,clrNONE,90);
   panel.DrawText("Time",  panel.CellX(0,1,0)+2, panel.CellY(0,1,0)+2); panel.DrawText(TimeToString(  rates[0].time,TIME_MINUTES),  panel.CellX(0,1,1)+2, panel.CellY(0,1,1)+2,clrNONE,90);
   panel.DrawText("Open",  panel.CellX(0,2,0)+2, panel.CellY(0,2,0)+2); panel.DrawText(DoubleToString(rates[0].open,Digits()),      panel.CellX(0,2,1)+2, panel.CellY(0,2,1)+2,clrNONE,90);
   panel.DrawText("High",  panel.CellX(0,3,0)+2, panel.CellY(0,3,0)+2); panel.DrawText(DoubleToString(rates[0].high,Digits()),      panel.CellX(0,3,1)+2, panel.CellY(0,3,1)+2,clrNONE,90);
   panel.DrawText("Low",   panel.CellX(0,4,0)+2, panel.CellY(0,4,0)+2); panel.DrawText(DoubleToString(rates[0].low,Digits()),       panel.CellX(0,4,1)+2, panel.CellY(0,4,1)+2,clrNONE,90);
   panel.DrawText("Close", panel.CellX(0,5,0)+2, panel.CellY(0,5,0)+2); panel.DrawText(DoubleToString(rates[0].close,Digits()),     panel.CellX(0,5,1)+2, panel.CellY(0,5,1)+2,clrNONE,90);

//--- Display the indicator data from the specified bar on the panel in table 1
   panel.DrawText(ind_title, panel.CellX(1,0,0)+2, panel.CellY(1,0,0)+2);
   double value=IndicatorValue(handle,index,0);
   string value_str=(value!=EMPTY_VALUE ? DoubleToString(value,ind_digits) : "");
   panel.DrawText(value_str,panel.CellX(1,0,1)+2,panel.CellY(1,0,1)+2,clrNONE,90);

//--- Create Volumes indicator handle
   static bool create=false;
   static int hv=INVALID_HANDLE;
   if(!create)
     {
      ResetLastError();
      hv=iVolumes(Symbol(),PERIOD_CURRENT,InpVolume);
      if(hv==INVALID_HANDLE)
        {
         PrintFormat("%s: Failed to create indicator handle Volumes. Error %ld",__FUNCTION__,GetLastError());
         return;
        }
      create=true;
     }

//--- Get Volumes indicator status
   ENUM_LINE_STATE state_vol=LineState(hv,index,0);
//--- Display a description of the indicator line state
   panel.DrawText("BW MFI State", panel.CellX(1,1,0)+2, panel.CellY(1,1,0)+2);
   ENUM_LINE_STATE state=LineState(handle,index,0);
   color clr=clrNONE;
   string state_str=LineStateDescription(state);
   if((state==LINE_STATE_UP || state==LINE_STATE_TURN_UP) && (state_vol==LINE_STATE_UP || state_vol==LINE_STATE_TURN_UP))
     {
      state_str="MFI Up, Vol Up";
      clr=clrGreen;
     }
   if((state==LINE_STATE_DOWN || state==LINE_STATE_TURN_DOWN) && (state_vol==LINE_STATE_DOWN || state_vol==LINE_STATE_TURN_DOWN))
     {
      state_str="MFI Dn, Vol Dn";
      clr=clrSaddleBrown;
     }
   if((state==LINE_STATE_UP || state==LINE_STATE_TURN_UP) && (state_vol==LINE_STATE_DOWN || state_vol==LINE_STATE_TURN_DOWN))
     {
      state_str="MFI Up, Vol Dn";
      clr=clrBlue;
     }
   if((state==LINE_STATE_DOWN || state==LINE_STATE_TURN_DOWN) && (state_vol==LINE_STATE_UP || state_vol==LINE_STATE_TURN_UP))
     {
      state_str="MFI Dn, Vol Up";
      clr=clrLightCoral;
     }

//--- Set font parameters for indicator state data (bold font)
   name=panel.FontParams(size,flags,angle);
   panel.SetFontParams(name,9,FW_BOLD);
   panel.DrawText(state_str,panel.CellX(1,1,1)+2,panel.CellY(1,1,1)+2,clr,90);
//--- Restore the normal thickness of the panel font
   panel.SetFontParams(name,9);

//--- Redraw the chart to immediately display all changes on the panel
   ChartRedraw(ChartID());
  }
Aqui, vale ressaltar que a obtenção de dados do indicador BW MFI é possível de maneira convencional — através das funções universais fornecidas aqui. No entanto, para a interpretação das leituras das colunas do indicador, é necessário outro indicador — o indicador de volumes (Volumes), pois para a coloração das colunas do histograma, dois indicadores são comparados — o valor da coluna do histograma e o valor do volume em relação aos seus valores anteriores. Para obter o volume na função, cria-se um handle do indicador Volumes (uma vez na primeira chamada), e então são comparados os estados das linhas do indicador BW MFI e Volumes. A descrição de relação mútua entre eles é exibida no painel em forma de texto.
Além disso, ao usar o painel informativo no manipulador de eventos OnChartEvent() do EA, o manipulador de eventos do painel é chamado, e os eventos são processados para obter o índice da barra sob o cursor:
//+------------------------------------------------------------------+
//| ChartEvent function                                              |
//+------------------------------------------------------------------+
void OnChartEvent(const int id,
                  const long &lparam,
                  const double &dparam,
                  const string &sparam)
  {
//--- Handling the panel
//--- Call the panel event handler
   panel.OnChartEvent(id,lparam,dparam,sparam);

//--- If the cursor moves or a click is made on the chart
   if(id==CHARTEVENT_MOUSE_MOVE || id==CHARTEVENT_CLICK)
     {
      //--- Declare the variables to record time and price coordinates in them
      datetime time=0;
      double price=0;
      int wnd=0;
      //--- If the cursor coordinates are converted to date and time
      if(ChartXYToTimePrice(ChartID(),(int)lparam,(int)dparam,wnd,time,price))
        {
         //--- write the bar index where the cursor is located to a global variable
         mouse_bar_index=iBarShift(Symbol(),PERIOD_CURRENT,time);
         //--- Display the bar data under the cursor on the panel
         DrawData(mouse_bar_index,time);
        }
     }

//--- If we received a custom event, display the appropriate message in the journal
   if(id>CHARTEVENT_CUSTOM)
     {
      //--- Here we can implement handling a click on the close button on the panel
      PrintFormat("%s: Event id=%ld, object id (lparam): %lu, event message (sparam): %s",__FUNCTION__,id,lparam,sparam);
     }
  }
Após a compilação e execução do EA no gráfico, podemos monitorar o valor e o estado da linha do indicador no painel informativo:
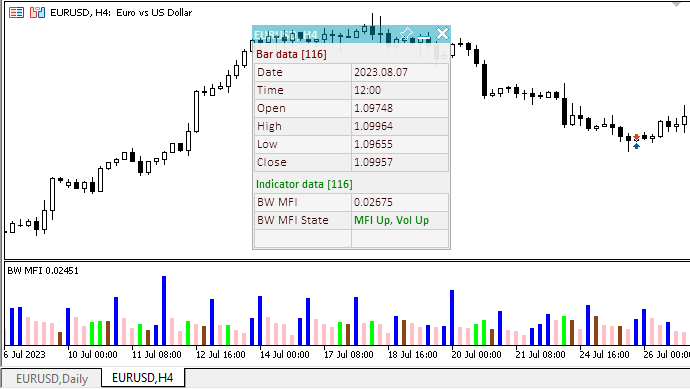
O arquivo do Expert Advisor de teste "TestWilliamsBWMFI.mq5" pode ser visto nos arquivos anexados ao artigo.
Aprimoramento das classes do painel informativo. Visão geral
Para os Expert Advisors de teste nesta série de artigos, é utilizado um painel informativo criado no primeiro artigo da série. No painel, era possível criar uma tabela, cujas coordenadas no painel podiam exibir dados. Agora, as classes do painel foram aprimoradas — é possível criar qualquer número de tabelas para colocar os dados nelas. Também foi corrigida uma falha que ocorria quando, ao minimizar o painel, mudar o timeframe e expandir novamente o painel, os dados desenhados no painel não eram exibidos até a próxima minimização/expansão do painel. Vamos revisar brevemente as alterações introduzidas. Não para treinamento, mas como uma visão geral rápida - para não voltarmos ao tema das alterações feitas nas classes do painel.
Agora, cada tabela criada no painel pode retornar suas coordenadas: X1, Y1 - canto superior esquerdo, X2 e Y2 - canto inferior direito. Cada tabela recebe seu próprio identificador e nome, pelos quais se pode referir a elas para obter dados.
Na classe de dados de tabela CTableData, variáveis privadas foram adicionadas e métodos públicos para registrar e retornar esses valores:
//+------------------------------------------------------------------+
//| Table data class                                                 |
//+------------------------------------------------------------------+
class CTableData : public CObject
  {
private:
   CArrayObj         m_list_rows;               // List of rows
   uint              m_id;                      // Table ID
   int               m_x1;                      // X1 coordinate
   int               m_y1;                      // Y1 coordinate
   int               m_x2;                      // X2 coordinate
   int               m_y2;                      // Y2 coordinate
   int               m_w;                       // Width
   int               m_h;                       // Height
   string            m_name;                    // Table name
public:
//--- Set table name
   void              SetName(const string name) { this.m_name=name;              }
//--- Return table (1) ID and (2) name
   uint              ID(void)             const { return this.m_id;              }
   string            Name(void)           const { return this.m_name;            }

//--- Set coordinate (1) X1, (2) X2
   void              SetX1(const uint x1)       { this.m_x1=(int)x1;             }
   void              SetX2(const uint x2)       { this.m_x2=(int)x2;             }
//--- Set coordinate (1) Y1, (2) Y2
   void              SetY1(const uint y1)       { this.m_y1=(int)y1;             }
   void              SetY2(const uint y2)       { this.m_y2=(int)y2;             }
//--- Set table coordinates
   void              SetCoords(const int x1,const int y1,const int x2,const int y2)
                       {
                        this.SetX1(x1);
                        this.SetY1(y1);
                        this.SetX2(x2);
                        this.SetY2(y2);
                       }

//--- Return coordinate (1) X1, (2) X2
   int               X1(void)             const { return this.m_x1;              }
   int               X2(void)             const { return this.m_x2;              }
//--- Return coordinate (1) Y1, (2) Y2
   int               Y1(void)             const { return this.m_y1;              }
   int               Y2(void)             const { return this.m_y2;              }

//--- Return (1) width and (2) height
   int               Width(void)          const { return this.m_x2-this.m_x1+1;  }
   int               Height(void)         const { return this.m_y2-this.m_y1+1;  }

//--- Return the list of table rows
Um método público foi adicionado, para retornar o número de células na linha especificada:
   int               ColumnsInRow(const int row_index)
                       {
                        //--- If there is no row in the list, return 0
                        if(this.RowsTotal()==0)
                           return 0;
                        //--- Get a pointer to the specified row and return the number of cells in it
                        CTableRow *row=this.GetRow(row_index);
                        return(row!=NULL ? row.CellsTotal() : 0);
                       }
//--- Return the total number of cells in the table
Um método público foi adicionado, para retornar o número total de células na tabela:
//--- Return the total number of cells in the table
   int               CellsTotal(void)
                       {
                        //--- If there is no row in the list, return 0
                        if(this.RowsTotal()==0)
                           return 0;
                        //---
                        int num=0;
                        int total=this.RowsTotal();
                        for(int i=0;i<total;i++)
                           num+=this.ColumnsInRow(i);
                        return num;
                       }
//--- Clear lists of rows and table cells
Anteriormente, simplesmente retornava-se o número de colunas na primeira linha da tabela, assumindo que seu número era igual em cada linha. Agora é possível obter o número total de células na tabela - pelo número de células colocadas em cada linha da tabela. Pode-se obter o número de células na linha especificada. Dessa forma, é possível criar tabelas não uniformes, nas quais o número de colunas (células) é o mesmo para cada linha. A criação de tabelas com diferentes números de células nas linhas não foi testada devido à falta de demanda nas tarefas atuais. Provavelmente, serão necessárias modificações adicionais. Mas, por enquanto, não há necessidade de tais tabelas.
Um método virtual Compare foi adicionado à classe, permitindo comparar tabelas por identificadores (modo de comparação mode = 0) ou por nomes (mode != 0):
//--- Virtual method for comparing two objects
   virtual int       Compare(const CObject *node,const int mode=0) const
                       {
                        const CTableData *compared=node;
                        if(mode==0)
                           return(this.ID()>compared.ID() ? 1 : this.ID()<compared.ID() ? -1 : 0);
                        else
                           return(this.Name()==compared.Name() ? 0 : this.Name()>compared.Name() ? 1 : -1);
                       }
No construtor paramétrico da classe, agora é passado o identificador da tabela criada:
//--- Constructor/destructor
                     CTableData(const uint id) : m_id(id){ this.m_list_rows.Clear(); this.m_name="";  }
                    ~CTableData(void)                    { this.m_list_rows.Clear();                  }
Se anteriormente na classe do painel foi declarado um objeto de dados da tabela, agora é declarada uma lista, na qual serão colocados ponteiros para as tabelas criadas no painel.
//+------------------------------------------------------------------+
//| Dashboard class                                                  |
//+------------------------------------------------------------------+
class CDashboard : public CObject
  {
private:
   CCanvas           m_canvas;                  // Canvas
   CCanvas           m_workspace;               // Work space
   CArrayObj         m_list_table;              // List of tables
   ENUM_PROGRAM_TYPE m_program_type;            // Program type
   ENUM_MOUSE_STATE  m_mouse_state;             // Mouse button status
Para a criação de nomes de arquivos para salvar os pixels de fundo e da área de trabalho em arquivo, na seção privada são declaradas variáveis:
   string            m_name_gv_m;               // Name of the global terminal variable storing the collapsed panel flag

   string            m_name_gv_u;               // Name of the global terminal variable storing the flag of the pinned panel
   string            m_filename_bg;             // File name to save background pixels
   string            m_filename_ws;             // File name for saving work space pixels

   uint              m_array_wpx[];             // Array of pixels to save/restore the workspace
   uint              m_array_ppx[];             // Array of pixels to save/restore the panel background
Métodos foram adicionados e aprimorados para trabalhar com as fontes do painel, para criar e obter tabelas e suas coordenadas:
//--- Set default panel font parameters
   void              SetFontParams(const string name,const int size,const uint flags=0,const uint angle=0);
//--- Return the specified dashboard font parameters
   string            FontParams(int &size,uint &flags,uint &angle);
//--- Return the specified panel (1) font, (2) size and font flags
   string            FontName(void)    const { return this.m_workspace.FontNameGet();  }
   int               FontSize(void)    const { return this.m_workspace.FontSizeGet();  }
   uint              FontFlags(void)   const { return this.m_workspace.FontFlagsGet(); }
//--- Display a text message at the specified coordinates
   void              DrawText(const string text,const int x,const int y,const color clr=clrNONE,const int width=WRONG_VALUE,const int height=WRONG_VALUE);
//--- Create a new table
   bool              CreateNewTable(const int id=WRONG_VALUE);
//--- Return tabular data object by (1) ID and (2) name
   CTableData       *GetTable(const uint id);
   CTableData       *GetTable(const string name);
//--- Draw a (1) background grid (2) with automatic cell size
   void              DrawGrid(const uint table_id,const uint x,const uint y,const uint rows,const uint columns,const uint row_size,const uint col_size,const color line_color=clrNONE,bool alternating_color=true);
   void              DrawGridAutoFill(const uint table_id,const uint border,const uint rows,const uint columns,const color line_color=clrNONE,bool alternating_color=true);
//--- Print grid data (line intersection coordinates)
   void              GridPrint(const uint table_id,const uint indent=0)
                       {
                        CTableData *table=this.GetTable(table_id);
                        if(table==NULL)
                          {
                           ::PrintFormat("%s: Error. Failed to get table object with id %lu",__FUNCTION__,table_id);
                           return;
                          }
                        table.Print(indent);
                       }
//--- Write the X and Y coordinate values of the specified table cell to variables
   void              CellXY(const uint table_id,const uint row,const uint column, int &x, int &y)
                       {
                        CTableData *table=this.GetTable(table_id);
                        if(table==NULL)
                          {
                           ::PrintFormat("%s: Error. Failed to get table object with id %lu",__FUNCTION__,table_id);
                           return;
                          }
                        table.CellXY(row,column,x,y);
                       }
//--- Return the (1) X and (2) Y coordinate of the specified table cell
   int               CellX(const uint table_id,const uint row,const uint column)
                       {
                        CTableData *table=this.GetTable(table_id);
                        if(table==NULL)
                          {
                           ::PrintFormat("%s: Error. Failed to get table object with id %lu",__FUNCTION__,table_id);
                           return WRONG_VALUE;
                          }
                        return table.CellX(row,column);
                       }
   int               CellY(const uint table_id,const uint row,const uint column)
                       {
                        CTableData *table=this.GetTable(table_id);
                        if(table==NULL)
                          {
                           ::PrintFormat("%s: Error. Failed to get table object with id %lu",__FUNCTION__,table_id);
                           return WRONG_VALUE;
                          }
                        return table.CellY(row,column);
                       }
//--- Write X1 and Y1, X2 and Y2 coordinate values of the specified table to the variables
   void              TableCoords(const uint table_id,int &x1,int &y1,int &x2,int &y2)
                       {
                        x1=y1=x2=y2=WRONG_VALUE;
                        CTableData *table=this.GetTable(table_id);
                        if(table==NULL)
                           return;
                        x1=table.X1();
                        y1=table.Y1();
                        x2=table.X2();
                        y2=table.Y2();
                       }

//--- Return the (1) X1, (2) Y1, (3) X2 and (4) Y2 coordinate of the specified table
   int               TableX1(const uint table_id)
                       {
                        CTableData *table=this.GetTable(table_id);
                        return(table!=NULL ? table.X1() : WRONG_VALUE);
                       }
   int               TableY1(const uint table_id)
                       {
                        CTableData *table=this.GetTable(table_id);
                        return(table!=NULL ? table.Y1() : WRONG_VALUE);
                       }
   int               TableX2(const uint table_id)
                       {
                        CTableData *table=this.GetTable(table_id);
                        return(table!=NULL ? table.X2() : WRONG_VALUE);
                       }
   int               TableY2(const uint table_id)
                       {
                        CTableData *table=this.GetTable(table_id);
                        return(table!=NULL ? table.Y2() : WRONG_VALUE);
                       }

//--- Event handler
   void              OnChartEvent(const int id,const long &lparam,const double &dparam,const string &sparam);
//--- Constructor/destructor
                     CDashboard(const uint id,const int x,const int y, const int w,const int h,const int wnd=-1);
                    ~CDashboard();
No construtor da classe são criados nomes de arquivos para salvar o fundo e a área de trabalho:
//--- Set the names of global terminal variables to store panel coordinates, collapsed/expanded state and pinning
   this.m_name_gv_x=this.m_program_name+"_id_"+(string)this.m_id+"_"+(string)this.m_chart_id+"_X";
   this.m_name_gv_y=this.m_program_name+"_id_"+(string)this.m_id+"_"+(string)this.m_chart_id+"_Y";
   this.m_name_gv_m=this.m_program_name+"_id_"+(string)this.m_id+"_"+(string)this.m_chart_id+"_Minimize";
   this.m_name_gv_u=this.m_program_name+"_id_"+(string)this.m_id+"_"+(string)this.m_chart_id+"_Unpin";

//--- Set file names for saving background and work space pixels
   this.m_filename_bg=this.m_program_name+"\\Dashboard"+(string)this.m_id+"\\background.bin";
   this.m_filename_ws=this.m_program_name+"\\Dashboard"+(string)this.m_id+"\\workspace.bin";
No final do construtor, se o painel estiver minimizado, os dados dos arquivos são carregados para os arrays de pixels de fundo e da área de trabalho:
//--- If the panel collapse flag is set, load the background and work space pixels from the files into arrays
   if(this.m_minimized)
     {
      if(::FileIsExist(this.m_filename_bg))
         this.FileLoadBackground();
      if(::FileIsExist(this.m_filename_ws))
         this.FileLoadWorkspace();
     }
  }
Dessa forma, se anteriormente os pixels eram salvos em arquivos e o painel é criado em modo minimizado, então a aparência do painel é carregada dos arquivos, enquanto o painel é desenhado em modo minimizado. Quando é expandido, sua aparência é obtida dos arrays de pixels preenchidos a partir dos arquivos.
No destrutor, se o painel estiver minimizado, antes de excluir os objetos do painel, é necessário expandi-lo, salvar os dados dos pixels em arquivos e minimizá-lo novamente. Após isso, os objetos do painel podem ser deletados — sua aparência já está salva nos arquivos para restauração a partir deles na próxima criação no construtor:
//+------------------------------------------------------------------+
//| Destructor                                                       |
//+------------------------------------------------------------------+
CDashboard::~CDashboard()
  {
//--- Write the current values to global terminal variables
   ::GlobalVariableSet(this.m_name_gv_x,this.m_x);
   ::GlobalVariableSet(this.m_name_gv_y,this.m_y);
   ::GlobalVariableSet(this.m_name_gv_m,this.m_minimized);
   ::GlobalVariableSet(this.m_name_gv_u,this.m_movable);

//--- If the panel is collapsed,
//--- expand the panel, save the appearance into pixel arrays and collapse the panel
   if(this.m_minimized)
     {
      this.Expand();
      this.SaveBackground();
      this.SaveWorkspace();
      this.Collapse();
     }
//--- otherwise, if the panel is expanded,
//--- save the appearance into pixel arrays
   else
     {
      this.SaveBackground();
      this.SaveWorkspace();
     }
//--- Save pixel arrays to files
   this.FileSaveBackground();
   this.FileSaveWorkspace();

//--- Delete panel objects
   this.m_canvas.Destroy();
   this.m_workspace.Destroy();
  }
No bloco de processamento de clique no botão de minimizar/expandido, verificamos a flag e salvamos o fundo e a área de trabalho em arrays de pixels caso o painel esteja expandido:
      //--- If the panel collapse/expand button is pressed
      else if(state==MOUSE_STATE_PRESSED_INSIDE_MINIMIZE)
        {
         //--- Disable chart scrolling, right-click menu and crosshair
         this.SetChartsTool(false);
         //--- If the panel is not collapsed, save the background and work space into pixel arrays
         if(!this.m_minimized)
           {
            this.SaveWorkspace();
            this.SaveBackground();
           }
         //--- "flip" the panel collapse flag,
         this.m_minimized=!this.m_minimized;
         //--- redraw the panel taking into account the new state of the flag,
         this.Draw(this.m_title);
         //--- redraw the panel header area
         this.RedrawHeaderArea();
         //--- If the panel is pinned and expanded, move it to the stored location coordinates
         if(this.m_minimized && !this.m_movable)
            this.Move(this.m_x_dock,this.m_y_dock);
         //--- Update the canvas with chart redrawing and
         this.m_canvas.Update();
         //--- write the state of the panel expand flag to the global terminal variable
         ::GlobalVariableSet(this.m_name_gv_m,this.m_minimized);
        }
Do método de minimização do painel foram removidas as linhas de salvamento do array de pixels — agora o salvamento dos pixels é feito apenas ao pressionar o botão de minimizar/expandido:
//+------------------------------------------------------------------+
//| Collapse the panel                                               |
//+------------------------------------------------------------------+
void CDashboard::Collapse(void)
  {
//--- Save the pixels of the working space and the panel background into arrays
   this.SaveWorkspace();
   this.SaveBackground();
//--- Remember the current height of the panel
   int h=this.m_h;
//--- Change the dimensions (height) of the canvas and working space
   if(!this.SetSizes(this.m_canvas.Width(),this.m_header_h))
      return;
//--- Draw the header area
   this.DrawHeaderArea(this.m_title);
//--- Return the saved panel height to the variable
   this.m_h=h;
  }
Implementação do método que retorna os parâmetros de fonte definidos para o painel:
//+------------------------------------------------------------------+
//| Return the specified dashboard font parameters                   |
//+------------------------------------------------------------------+
string CDashboard::FontParams(int &size,uint &flags,uint &angle)
  {
   size=this.m_workspace.FontSizeGet();
   flags=this.m_workspace.FontFlagsGet();
   angle=this.m_workspace.FontAngleGet();
   return this.m_workspace.FontNameGet();
  }
O método retorna o nome da fonte, e as variáveis passadas por referência recebem o tamanho da fonte, seus flags e ângulo.
No método de desenho do texto, agora é passado também a cor do texto desenhado. Por padrão — clrNONE, o que significa a cor de texto previamente estabelecida:
//+------------------------------------------------------------------+
//| Display a text message at the specified coordinates              |
//+------------------------------------------------------------------+
void CDashboard::DrawText(const string text,const int x,const int y,const color clr=clrNONE,const int width=WRONG_VALUE,const int height=WRONG_VALUE)
  {
//--- Declare variables to record the text width and height in them
   int w=width;
   int h=height;
//--- If the width and height of the text passed to the method have zero values,
//--- then the entire working space is completely cleared using the transparent color
   if(width==0 && height==0)
      this.m_workspace.Erase(0x00FFFFFF);
//--- Otherwise
   else
     {
      //--- If the passed width and height have default values (-1), we get its width and height from the text
      if(width==WRONG_VALUE && height==WRONG_VALUE)
         this.m_workspace.TextSize(text,w,h);
      //--- otherwise,
      else
        {
         //--- if the width passed to the method has the default value (-1) - get the width from the text, or
         //--- if the width passed to the method has a value greater than zero, use the width passed to the method, or
         //--- if the width passed to the method has a zero value, use the value 1 for the width
         w=(width ==WRONG_VALUE ? this.m_workspace.TextWidth(text)  : width>0  ? width  : 1);
         //--- if the height passed to the method has a default value (-1), get the height from the text, or
         //--- if the height passed to the method has a value greater than zero, use the height passed to the method, or
         //--- if the height passed to the method has a zero value, use value 1 for the height
         h=(height==WRONG_VALUE ? this.m_workspace.TextHeight(text) : height>0 ? height : 1);
        }
      //--- Fill the space according to the specified coordinates and the resulting width and height with a transparent color (erase the previous entry)
      this.m_workspace.FillRectangle(x,y,x+w,y+h,0x00FFFFFF);
     }
//--- Display the text to the space cleared of previous text and update the working space without redrawing the screen
   this.m_workspace.TextOut(x,y,text,::ColorToARGB(clr==clrNONE ? this.m_fore_color : clr));
   this.m_workspace.Update(false);
  }
Implementação dos métodos para criar uma nova tabela e obter dados da tabela pelo identificador e nome da tabela:
//+------------------------------------------------------------------+
//| Create a new table                                               |
//+------------------------------------------------------------------+
bool CDashboard::CreateNewTable(const int id=WRONG_VALUE)
  {
   uint num=(id>WRONG_VALUE ? id : this.m_list_table.Total());
   CTableData *table=new CTableData(num);
   this.m_list_table.Sort();
   if(this.m_list_table.Search(table)!=WRONG_VALUE)
     {
      PrintFormat("%s: Error. Table with id %lu already exists in the list",__FUNCTION__,num);
      delete table;
      return false;
     }
   if(!this.m_list_table.Add(table))
     {
      PrintFormat("%s: Error. Failed to add table with id %lu to the list",__FUNCTION__,num);
      delete table;
      return false;
     }
   return true;
  }
//+------------------------------------------------------------------+
//| Return tabular data object by ID                                 |
//+------------------------------------------------------------------+
CTableData *CDashboard::GetTable(const uint id)
  {
   if(this.m_list_table.Total()==0)
     {
      PrintFormat("%s: Error. The list of tables is empty. First you need to create a table using CreateNewTable",__FUNCTION__);
      .return NULL;
     }
   CTableData *table=new CTableData(id);
   if(table==NULL)
     {
      ::PrintFormat("%s: Error. Failed to create table object with id %lu",__FUNCTION__,id);
      .return NULL;
     }
   this.m_list_table.Sort();
   int index=this.m_list_table.Search(table);
   delete table;
   return this.m_list_table.At(index);
  }
//+------------------------------------------------------------------+
//| Return tabular data object by name                               |
//+------------------------------------------------------------------+
CTableData *CDashboard::GetTable(const string name)
  {
   if(this.m_list_table.Total()==0)
     {
      PrintFormat("%s: Error. The list of tables is empty. First you need to create a table using CreateNewTable",__FUNCTION__);
      .return NULL;
     }
   CTableData *table=new CTableData(0);
   if(table==NULL)
     {
      ::PrintFormat("%s: Error. Failed to create table object");
      .return NULL;
     }
   table.SetName(name);
   this.m_list_table.Sort(1);
   int index=this.m_list_table.Search(table);
   delete table;
   return this.m_list_table.At(index);
  }
Alterações nos métodos de desenho de tabelas:
//+------------------------------------------------------------------+
//| Draw the background grid                                         |
//+------------------------------------------------------------------+
void CDashboard::DrawGrid(const uint table_id,
                          const uint x,const uint y,const uint rows,const uint columns,const uint row_size,const uint col_size,
                          const color line_color=clrNONE,bool alternating_color=true)
  {
//--- Get a table object by ID
   CTableData *table=this.GetTable(table_id);
   if(table==NULL)
     {
      PrintFormat("%s: Error. Failed to get table object with id %lu",__FUNCTION__,table_id);
      return;
     }
//--- Clear all lists of the tabular data object (remove cells from rows and all rows)
   table.Clear();
//--- Line height cannot be less than 2
   int row_h=int(row_size<2 ? 2 : row_size);
//--- Column width cannot be less than 2
   int col_w=int(col_size<2 ? 2 : col_size);

//--- The X1 (left) coordinate of the table cannot be less than 1 (to leave one pixel around the perimeter of the panel for the frame)
   int x1=int(x<1 ? 1 : x);
//--- Calculate the X2 coordinate (right) depending on the number of columns and their width
   int x2=x1+col_w*int(columns>0 ? columns : 1);
//--- The Y1 coordinate is located under the panel title area
   int y1=this.m_header_h+(int)y;
//--- Calculate the Y2 coordinate (bottom) depending on the number of lines and their height
   int y2=y1+row_h*int(rows>0 ? rows : 1);
//--- Set table coordinates
   table.SetCoords(x1,y1-this.m_header_h,x2,y2-this.m_header_h);

//--- Get the color of the table grid lines, either by default or passed to the method
   color clr=(line_color==clrNONE ? C'200,200,200' : line_color);
//--- If the initial X coordinate is greater than 1, draw a table frame
//--- (in case of the coordinate 1, the table frame is the panel frame)
   if(x1>1)
      this.m_canvas.Rectangle(x1,y1,x2,y2,::ColorToARGB(clr,this.m_alpha));
//--- In the loop by table rows,
   for(int i=0;i<(int)rows;i++)
     {
      //--- calculate the Y coordinate of the next horizontal grid line (Y coordinate of the next table row)
      int row_y=y1+row_h*i;
      //--- if the flag of "alternating" line colors is passed and the line is even
      if(alternating_color && i%2==0)
        {
         //--- lighten the table background color and draw a background rectangle
         color new_color=this.NewColor(clr,45,45,45);
         this.m_canvas.FillRectangle(x1+1,row_y+1,x2-1,row_y+row_h-1,::ColorToARGB(new_color,this.m_alpha));
        }
      //--- Draw a table grid horizontal line
      this.m_canvas.Line(x1,row_y,x2,row_y,::ColorToARGB(clr,this.m_alpha));

      //--- Create a new table row object
      CTableRow *row_obj=new CTableRow(i);
      if(row_obj==NULL)
        {
         ::PrintFormat("%s: Failed to create table row object at index %lu",(string)__FUNCTION__,i);
         continue;
        }
      //--- Add it to the list of rows of the tabular data object
      //--- (if adding an object failed, delete the created object)
      if(!table.AddRow(row_obj))
         delete row_obj;
      //--- Set its Y coordinate in the created row object taking into account the offset from the panel title
      row_obj.SetY(row_y-this.m_header_h);
     }

//--- In the loop by table columns,
   for(int i=0;i<(int)columns;i++)
     {
      //--- calculate the X coordinate of the next vertical grid line (X coordinate of the next table row)
      int col_x=x1+col_w*i;
      //--- If the grid line goes beyond the panel, interrupt the loop
      if(x1==1 && col_x>=x1+m_canvas.Width()-2)
         break;
      //--- Draw a vertical line of the table grid
      this.m_canvas.Line(col_x,y1,col_x,y2,::ColorToARGB(clr,this.m_alpha));

      //--- Get the number of created rows from the table data object
      int total=table.RowsTotal();
      //--- In the loop by table rows
      for(int j=0;j<total;j++)
        {
         //--- get the next row
         CTableRow *row=table.GetRow(j);
         if(row==NULL)
            continue;
         //--- Create a new table cell
         CTableCell *cell=new CTableCell(row.Row(),i);
         if(cell==NULL)
           {
            ::PrintFormat("%s: Failed to create table cell object at index %lu",(string)__FUNCTION__,i);
            continue;
           }
         //--- Add the created cell to the row
         //--- (if adding an object failed, delete the created object)
         if(!row.AddCell(cell))
           {
            delete cell;
            continue;
           }
         //--- In the created cell object, set its X coordinate and the Y coordinate from the row object
         cell.SetXY(col_x,row.Y());
        }
     }
//--- Update the canvas without redrawing the chart
   this.m_canvas.Update(false);
  }
//+------------------------------------------------------------------+
//| Draws the background grid with automatic cell sizing             |
//+------------------------------------------------------------------+
void CDashboard::DrawGridAutoFill(const uint table_id,const uint border,const uint rows,const uint columns,const color line_color=clrNONE,bool alternating_color=true)
  {
//--- Get a table object by ID
   CTableData *table=this.GetTable(table_id);
   if(table==NULL)
     {
      PrintFormat("%s: Error. Failed to get table object with id %lu",__FUNCTION__,table_id);
      return;
     }
//--- X1 (left) table coordinate
   int x1=(int)border;
//--- X2 (right) table coordinate
   int x2=this.m_canvas.Width()-(int)border-1;
//--- Y1 (upper) table coordinate
   int y1=this.m_header_h+(int)border;
//--- Y2 (lower) table coordinate
   int y2=this.m_canvas.Height()-(int)border-1;
//--- Set table coordinates
   table.SetCoords(x1,y1,x2,y2);

//--- Get the color of the table grid lines, either by default or passed to the method
   color clr=(line_color==clrNONE ? C'200,200,200' : line_color);
//--- If the offset from the edge of the panel is greater than zero, draw a table border,
//--- otherwise, the panel border is used as the table border
   if(border>0)
      this.m_canvas.Rectangle(x1,y1,x2,y2,::ColorToARGB(clr,this.m_alpha));

//--- Height of the entire table grid
   int greed_h=y2-y1;
//--- Calculate the row height depending on the table height and the number of rows
   int row_h=(int)::round((double)greed_h/(double)rows);
//--- In the loop based on the number of rows
   for(int i=0;i<(int)rows;i++)
     {
      //--- calculate the Y coordinate of the next horizontal grid line (Y coordinate of the next table row)
      int row_y=y1+row_h*i;
      //--- if the flag of "alternating" line colors is passed and the line is even
      if(alternating_color && i%2==0)
        {
         //--- lighten the table background color and draw a background rectangle
         color new_color=this.NewColor(clr,45,45,45);
         this.m_canvas.FillRectangle(x1+1,row_y+1,x2-1,row_y+row_h-1,::ColorToARGB(new_color,this.m_alpha));
        }
      //--- Draw a table grid horizontal line
      this.m_canvas.Line(x1,row_y,x2,row_y,::ColorToARGB(clr,this.m_alpha));

      //--- Create a new table row object
      CTableRow *row_obj=new CTableRow(i);
      if(row_obj==NULL)
        {
         ::PrintFormat("%s: Failed to create table row object at index %lu",(string)__FUNCTION__,i);
         continue;
        }
      //--- Add it to the list of rows of the tabular data object
      //--- (if adding an object failed, delete the created object)
      if(!table.AddRow(row_obj))
         delete row_obj;
      //--- Set its Y coordinate in the created row object taking into account the offset from the panel title
      row_obj.SetY(row_y-this.m_header_h);
     }

//--- Table grid width
   int greed_w=x2-x1;
//--- Calculate the column width depending on the table width and the number of columns
   int col_w=(int)::round((double)greed_w/(double)columns);
//--- In the loop by table columns,
   for(int i=0;i<(int)columns;i++)
     {
      //--- calculate the X coordinate of the next vertical grid line (X coordinate of the next table row)
      int col_x=x1+col_w*i;
      //--- If this is not the very first vertical line, draw it
      //--- (the first vertical line is either the table frame or the panel frame)
      if(i>0)
         this.m_canvas.Line(col_x,y1,col_x,y2,::ColorToARGB(clr,this.m_alpha));

      //--- Get the number of created rows from the table data object
      int total=table.RowsTotal();
      //--- In the loop by table rows
      for(int j=0;j<total;j++)
        {
         //--- get the next row
         CTableRow *row=table.GetRow(j);
         if(row==NULL)
            continue;
         //--- Create a new table cell
         CTableCell *cell=new CTableCell(row.Row(),i);
         if(cell==NULL)
           {
            ::PrintFormat("%s: Failed to create table cell object at index %lu",(string)__FUNCTION__,i);
            continue;
           }
         //--- Add the created cell to the row
         //--- (if adding an object failed, delete the created object)
         if(!row.AddCell(cell))
           {
            delete cell;
            continue;
           }
         //--- In the created cell object, set its X coordinate and the Y coordinate from the row object
         cell.SetXY(col_x,row.Y());
        }
     }
//--- Update the canvas without redrawing the chart
   this.m_canvas.Update(false);
  }
Nos métodos para salvar pixels em arquivo e carregá-los de um arquivo, agora são usados nomes de arquivos previamente criados no construtor:
//+------------------------------------------------------------------+
//| Save the pixel array of the working space to a file              |
//+------------------------------------------------------------------+
bool CDashboard::FileSaveWorkspace(void)
  {
//--- If the saved array is empty, inform of that and return 'false'
   if(this.m_array_wpx.Size()==0)
     {
      ::PrintFormat("%s: Error. The workspace pixel array is empty.",__FUNCTION__);
      return false;
     }
//--- If the array could not be saved to a file, report this and return 'false'
   if(!::FileSave(this.m_filename_ws,this.m_array_wpx))
     {
      ::PrintFormat("%s: FileSave '%s' failed. Error %lu",__FUNCTION__,this.m_filename_ws,::GetLastError());
      return false;
     }
//--- Successful, return 'true'
   return true;
  }
//+------------------------------------------------------------------+
//| Save the pixel array of the panel background to a file           |
//+------------------------------------------------------------------+
bool CDashboard::FileSaveBackground(void)
  {
//--- If the saved array is empty, inform of that and return 'false'
   if(this.m_array_ppx.Size()==0)
     {
      ::PrintFormat("%s: Error. The background pixel array is empty.",__FUNCTION__);
      return false;
     }
//--- If the array could not be saved to a file, report this and return 'false'
   if(!::FileSave(this.m_filename_bg,this.m_array_ppx))
     {
      ::PrintFormat("%s: FileSave '%s' failed. Error %lu",__FUNCTION__,this.m_filename_bg,::GetLastError());
      return false;
     }
//--- Successful, return 'true'
   return true;
  }
//+------------------------------------------------------------------+
//| Upload the array of working space pixels from a file             |
//+------------------------------------------------------------------+
bool CDashboard::FileLoadWorkspace(void)
  {
//--- If failed to upload data from the file into the array, report this and return 'false'
   if(::FileLoad(this.m_filename_ws,this.m_array_wpx)==WRONG_VALUE)
     {
      ::PrintFormat("%s: FileLoad '%s' failed. Error %lu",__FUNCTION__,this.m_filename_ws,::GetLastError());
      return false;
     }
//--- Successful, return 'true'
   return true;
  }
//+------------------------------------------------------------------+
//| Upload the array of panel background pixels from a file          |
//+------------------------------------------------------------------+
bool CDashboard::FileLoadBackground(void)
  {
   if(::FileLoad(this.m_filename_bg,this.m_array_ppx)==WRONG_VALUE)
     {
      ::PrintFormat("%s: FileLoad '%s' failed. Error %lu",__FUNCTION__,this.m_filename_bg,::GetLastError());
      return false;
     }
//--- Successful, return 'true'
   return true;
  }
Considerações finais
Neste artigo, examinamos a integração de indicadores de volume e de Bill Williams aos EAs. Todos os códigos apresentados no artigo podem ser usados "como estão" para inseri-los no código de seus programas. A seguir, consideraremos a última categoria de indicadores, nomeadamente os de tendência, para sua integração e uso em EAs.
Todos os arquivos (de EAs de teste e classes de painel) podem ser baixados da lista de arquivos anexados ao artigo. A classe do painel deve estar localizada em \MQL5\Include\Dashboard\Dashboard.mqh.
Traduzido do russo pela MetaQuotes Ltd.
Artigo original: https://www.mql5.com/ru/articles/13277
Aviso: Todos os direitos sobre esses materiais pertencem à MetaQuotes Ltd. É proibida a reimpressão total ou parcial.
Esse artigo foi escrito por um usuário do site e reflete seu ponto de vista pessoal. A MetaQuotes Ltd. não se responsabiliza pela precisão das informações apresentadas nem pelas possíveis consequências decorrentes do uso das soluções, estratégias ou recomendações descritas.

- Aplicativos de negociação gratuitos
- 8 000+ sinais para cópia
- Notícias econômicas para análise dos mercados financeiros
Você concorda com a política do site e com os termos de uso
Um detalhe: no livro de Bill Williams, a frase sobre uma galinha cega diz:
"Até mesmo uma galinha cega encontrará uma espiga de milho de vez em quando."
Aqui diz:
"Até mesmo uma galinha cega encontrará seus milhos, se for alimentada sempre ao mesmo tempo." Mas pode ser um efeito de tradução russo/inglês.
Bill Williams está realmente prosperando, suponho, com alguma "tendência contemporânea de hipnose em massa" em seu livro, exagerando as três curvas de médias móveis do indicador Alligator para que tenham relação com:
"Ciência do Caos, juntamente com a física quântica, holografia, cibernética, dinâmica não linear, teoria da informação e geometria fractal". Mas seu discurso sobre o caos é um pouco exagerado. O livro também contém grande sabedoria. Independentemente disso, o Alligator é uma combinação conveniente de MAs.
"Ciência do Caos, juntamente com a física quântica, holografia, cibernética, dinâmica não linear, teoria da informação e geometria fractal". Mas seu discurso sobre o caos é um pouco exagerado. O livro também contém grande sabedoria. Independentemente disso, o Alligator é uma combinação conveniente de MAs.
Obrigado pela avaliação.
Não li os trabalhos de Williams, portanto não direi exatamente como e o que ele disse.
Bem, você pode falar e escrever muito. Mas o mais importante é fazer isso. E, melhor ainda, fazer direito)
Se você minimizar o painel e mudar o período de tempo, poderá ver a grade.
Como corrigir isso?
Vídeo, pressione para reproduzir
-
Vídeo, pressione para reproduzir
-
Em algum lugar mais abaixo, há mais artigos que usam essa biblioteca. Lá, ela foi bastante aprimorada. Use a versão mais recente dessa biblioteca. Não sei dizer exatamente em qual artigo ela foi usada pela última vez. Mas você pode encontrá-la nas listas de meus artigos. O último artigo em que a biblioteca foi usada é a versão mais recente dessa biblioteca. Você deve verificar com ela. Ainda não posso, por boas razões.