指標やEAのデータを表示するダッシュボードの作成

内容
はじめに
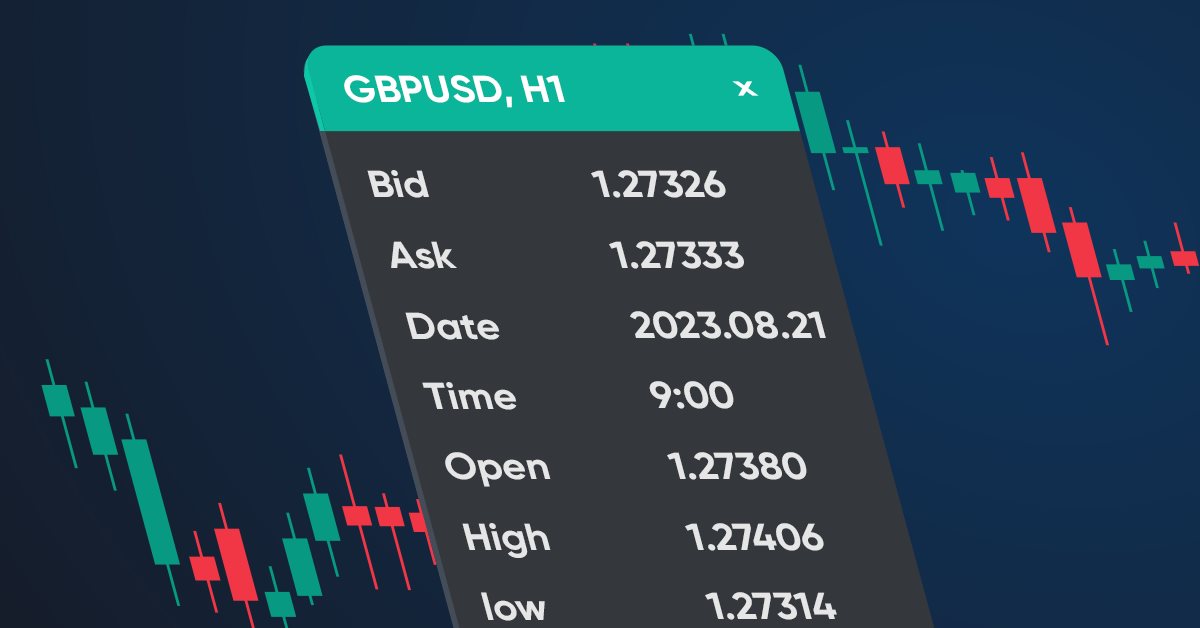
今回は開発者が指定したデータを表示できるダッシュボードを作成してみます。デバッガーで値を追跡するよりもパネル上で必要な値を確認する方が便利であるため、このようなパネルは、チャート上にデータを視覚的に表示したり、視覚的にデバッグしたりするのに便利です。いくつかのデータ値に応じて戦略がデバッグされている場合のことです。
ターミナルデータウィンドウのプロトタイプの形式でパネルを作成し、同じデータを入力します。
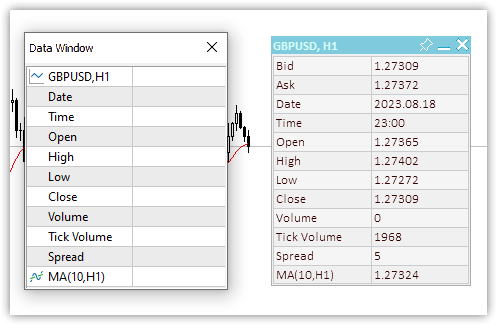
図1:データウィンドウとダッシュボード
カスタムパネルを使用すると、必要な量の必要なデータをパネルに追加したり、署名したり、プログラムコードの読み取り値を表示および更新したりすることができます。
マウスを使用してチャート上でパネルを移動したり、希望のチャート位置にドッキングしたり、折りたたんだり展開したりできる必要があります。パネル上にデータを配置する際に便利なように、指定した行数と列数で表を表示できるようになります。このテーブルのデータはジャーナル(各テーブルセルのX座標とY座標)に表示され、このデータが配置される行と列のインデックスを示すためにプログラムで取得できます。または、テキストやデータを表示するときに、単純に座標を出力し、必要な座標をコードに入力できます。最初の方法は完全に自動化されているため、より便利です。パネルにはアクティブな[閉じる]ボタンもありますが、その処理は制御プログラムに委任します。閉じるボタンの押下にどのように反応するかを決定するのはプログラム開発者のみです。ボタンをクリックすると、カスタムイベントがプログラムイベントハンドラに送信されます。開発者は独自の判断で処理できます。
表形式のデータを取得するためのクラス
視覚的または仮想的に事前に決定された座標に従ってパネル上にデータを配置すると便利なので、まず、表形式のデータを配置するためのクラスを作成します。テーブルは単純なグリッドとして表すことができ、その線の交点がテーブルのセルの座標になります。このような座標に任意の視覚データを配置することが可能になります。テーブルには特定の数の行(横線)があり、各行には特定の数のセル(縦線)があります。単純なグリッドテーブルでは、すべての行に同じ数のセルがあります。
これに基づいて、次の3つのクラスが必要です。
- テーブルセルクラス
- テーブル行クラス
- テーブルクラス
テーブルセルクラスには、テーブル内の行インデックスと列インデックス、およびパネル内のテーブルセルの視覚的な位置の座標(パネルの左上隅にあるテーブル原点を基準としたX座標とY座標)が含まれます。
テーブルの行クラスにはテーブルのセルクラスが含まれます。1行に必要な数のセルを作成できます。
テーブルクラスにはテーブル行のリストが含まれます。テーブル内の行を必要な数だけ作成および追加できます。
3つのクラスすべてを簡単に見てみましょう。
テーブルセルクラス
//+------------------------------------------------------------------+
//| Table cell class                                                 |
//+------------------------------------------------------------------+
class CTableCell : public CObject
  {
private:
   int               m_row;                     // Row
   int               m_col;                     // Column
   int               m_x;                       // X coordinate
   int               m_y;                       // Y coordinate
public:
//--- Methods of setting values
   void              SetRow(const uint row)     { this.m_row=(int)row;  }
   void              SetColumn(const uint col)  { this.m_col=(int)col;  }
   void              SetX(const uint x)         { this.m_x=(int)x;      }
   void              SetY(const uint y)         { this.m_y=(int)y;      }
   void              SetXY(const uint x,const uint y)
                       {
                        this.m_x=(int)x;
                        this.m_y=(int)y;
                       }
//--- Methods of obtaining values
   int               Row(void)            const { return this.m_row;    }
   int               Column(void)         const { return this.m_col;    }
   int               X(void)              const { return this.m_x;      }
   int               Y(void)              const { return this.m_y;      }
//--- Virtual method for comparing two objects
   virtual int       Compare(const CObject *node,const int mode=0) const
                       {
                        const CTableCell *compared=node;
                        return(this.Column()>compared.Column() ? 1 : this.Column()<compared.Column() ? -1 : 0);
                       }
//--- Constructor/destructor
                     CTableCell(const int row,const int column) : m_row(row),m_col(column){}
                    ~CTableCell(void){}
  };
このクラスは、MQL5標準ライブラリのCArrayObjリストに適合するため、MQL5標準ライブラリを構築するための基本クラスから継承されます。リストには、CObjectオブジェクトまたは基本CObjectから継承されたオブジェクトのみを含めることができます。
すべての変数とメソッドの機能は非常に透過的で、理解しやすいです。変数はテーブルの行(Row)と列(Column)の値を格納するために使用され、座標はパネル内のテーブルセルの左上隅の相対座標です。これらの座標を使用して、何かを描画したり、パネル上に配置したりできます。
Compare仮想メソッドは、2つのテーブルセルオブジェクトを検索して比較するために必要です。メソッドは基本CObjectクラスで宣言されます。
   //--- method of comparing the objects
   virtual int       Compare(const CObject *node,const int mode=0) const { return(0);      }
nullを返すため、継承されたクラスでオーバーライドする必要があります。
テーブルのセルはテーブルの行に(つまり視覚的に水平に)追加されるため、検索と比較は水平のセル番号、つまり列の値によって実行する必要があります。これは、ここでオーバーライドされた仮想Compareメソッドがおこなうこととまったく同じです。
//--- Virtual method for comparing two objects
   virtual int       Compare(const CObject *node,const int mode=0) const
                       {
                        const CTableCell *compared=node;
                        return(this.Column()>compared.Column() ? 1 : this.Column()<compared.Column() ? -1 : 0);
                       }
現在のオブジェクトの列値が比較対象のオブジェクト(メソッドに渡されるポインタ)の値より大きい場合、1が返されます。列の値が比較対象の列の値より小さい場合は、-1が返されます。それ以外の場合は0が返されます。したがって、メソッドによって返されるゼロ値は、比較されるオブジェクトの値が等しいことを示します。
テーブル行クラス
セルオブジェクトがテーブルの行に追加されます。行内のセルが水平方向に隣り合って配置されている場合、テーブル内の行は垂直方向に上下に配置されます。
ここで必要なのはパネル上の行インデックスとそのY座標だけです。
//+------------------------------------------------------------------+
//| Table row class                                                  |
//+------------------------------------------------------------------+
class CTableRow : public CObject
  {
private:
  CArrayObj          m_list_cell;               // Cell list
  int                m_row;                     // Row index
  int                m_y;                       // Y coordinate
public:
//--- Return the list of table cells in a row
   CArrayObj        *GetListCell(void)       { return &this.m_list_cell;         }
//--- Return (1) the number of table cells in a row (2) the row index in the table
   int               CellsTotal(void)  const { return this.m_list_cell.Total();  }
   int               Row(void)         const { return this.m_row;                }
//--- (1) Set and (2) return the Y row coordinate
   void              SetY(const int y)       { this.m_y=y;                       }
   int               Y(void)           const { return this.m_y;                  }
//--- Add a new table cell to the row
   bool              AddCell(CTableCell *cell)
                       {
                        this.m_list_cell.Sort();
                        if(this.m_list_cell.Search(cell)!=WRONG_VALUE)
                          {
                           ::PrintFormat("%s: Table cell with index %lu is already in the list",__FUNCTION__,cell.Column());
                           return false;
                          }
                        if(!this.m_list_cell.InsertSort(cell))
                          {
                           ::PrintFormat("%s: Failed to add table cell with index %lu to list",__FUNCTION__,cell.Column());
                           return false;
                          }
                        return true;
                       }
//--- Return the pointer to the specified cell in the row
   CTableCell       *GetCell(const int column)
                       {
                        const CTableCell *obj=new CTableCell(this.m_row,column);
                        int index=this.m_list_cell.Search(obj);
                        delete obj;
                        return this.m_list_cell.At(index);
                       }
//--- Virtual method for comparing two objects
   virtual int       Compare(const CObject *node,const int mode=0) const
                       {
                        const CTableRow *compared=node;
                        return(this.Row()>compared.Row() ? 1 : this.Row()<compared.Row() ? -1 : 0);
                       }
//--- Constructor/destructor
                     CTableRow(const int row) : m_row(row)  { this.m_list_cell.Clear();   }
                    ~CTableRow(void)                        { this.m_list_cell.Clear();   }
  };
新しく追加されたセルオブジェクトを含むCArrayObjリストがクラスで宣言されます。
Compare仮想メソッドでは、新しい行を追加するときに行インデックスだけで検索する必要があるため、行インデックス値(Row)によってオブジェクトを比較します。そのようなインデックスを持つ行が見つからない場合、検索メソッド(Search)は-1を返します。それ以外の場合はリスト内で見つかったオブジェクト位置のインデックスを返します。SearchメソッドはCArrayObjクラスで宣言および実装されます。
//+------------------------------------------------------------------+
//| Search of position of element in a sorted array                  |
//+------------------------------------------------------------------+
int CArrayObj::Search(const CObject *element) const
  {
   int pos;
//--- check
   if(m_data_total==0 || !CheckPointer(element) || m_sort_mode==-1)
      return(-1);
//--- search
   pos=QuickSearch(element);
   if(m_data[pos].Compare(element,m_sort_mode)==0)
      return(pos);
//--- not found
   return(-1);
  }
ご覧のとおり、これは2つのオブジェクトを比較する仮想Compareメソッドを使用して、オブジェクトが等しいかどうかを判断します。
新しいセルをリストに追加するメソッド
//--- Add a new table cell to the row
   bool              AddCell(CTableCell *cell)
                       {
                        this.m_list_cell.Sort();
                        if(this.m_list_cell.Search(cell)!=WRONG_VALUE)
                          {
                           ::PrintFormat("%s: Table cell with index %lu is already in the list",__FUNCTION__,cell.Column());
                           return false;
                          }
                        if(!this.m_list_cell.InsertSort(cell))
                          {
                           ::PrintFormat("%s: Failed to add table cell with index %lu to list",__FUNCTION__,cell.Column());
                           return false;
                          }
                        return true;
                       }
セルは厳密に列番号(Column)に従ってリスト内に次々と配置され、並び替え順に追加するため、リストには並び替え済みリストフラグが最初に設定されている必要があります。検索で-1が返されない場合、そのようなオブジェクトはすでにリストに存在します。適切なメッセージがログに送信され、falseが返されます。オブジェクトポインタをリストに追加できなかった場合、そのことも通知してfalseを返します。すべてOKの場合はtrueを返します。
行内の指定されたセルへのポインタを返すメソッド
//--- Return the pointer to the specified cell in the row
   CTableCell       *GetCell(const int column)
                       {
                        const CTableCell *obj=new CTableCell(this.m_row,column);
                        int index=this.m_list_cell.Search(obj);
                        delete obj;
                        return this.m_list_cell.At(index);
                       }
標準ライブラリのCArrayObjクラスのSearchメソッドは、ポインタがメソッドに渡されるオブジェクトのインスタンスに基づいて、リスト内で等しいかどうかを検索します。したがって、ここでは、コンストラクタでメソッドに渡される列番号を指定して新しい一時オブジェクトを作成し、リスト内のオブジェクトインデックスを取得するか、そのようなパラメータを持つオブジェクトがリスト内に見つからない場合は-1を取得します。また、必ず一時オブジェクトを削除し、リスト内で見つかったオブジェクトへのポインタを返します。
オブジェクトが見つからず、インデックスが-1に等しい場合、CArrayObjクラスのAtメソッドはNULLを返します。
テーブルクラス
テーブルは行のリストで構成され、行のリストはセルのリストで構成されます。つまり、表形式のデータクラスには、作成される行と、テーブルの行とセルを追加および受信するためのメソッドが配置されるCArrayObjオブジェクトのみが含まれます。
//+------------------------------------------------------------------+
//| Table data class                                                 |
//+------------------------------------------------------------------+
class CTableData : public CObject
  {
private:
   CArrayObj         m_list_rows;               // List of rows
public:
//--- Return the list of table rows
   CArrayObj        *GetListRows(void)       { return &this.m_list_rows;   }
//--- Add a new row to the table
   bool              AddRow(CTableRow *row)
                       {
                        //--- Set the sorted list flag
                        this.m_list_rows.Sort();
                        //--- If such an object is already in the list (the search returns the object index, not -1),
                        //--- inform of that in the journal and return 'false'
                        if(this.m_list_rows.Search(row)!=WRONG_VALUE)
                          {
                           ::PrintFormat("%s: Table row with index %lu is already in the list",__FUNCTION__,row.Row());
                           return false;
                          }
                        //--- If failed to add the pointer to the sorted list, inform of that and return 'false'
                        if(!this.m_list_rows.InsertSort(row))
                          {
                           ::PrintFormat("%s: Failed to add table cell with index %lu to list",__FUNCTION__,row.Row());
                           return false;
                          }
                        //--- Successful - return 'true'
                        return true;
                       }
//--- Return the pointer to the (1) specified row and (2) specified cell in the specified table row
   CTableRow        *GetRow(const int index) { return this.m_list_rows.At(index);   }
   CTableCell       *GetCell(const int row,const int column)
                       {
                        //--- Get a pointer to a string object in a list of strings
                        CTableRow *row_obj=this.GetRow(row);
                        //--- If failed to get the object, return NULL
                        if(row_obj==NULL)
                           .return NULL;
                        //--- Get the pointer to the cell object in the row by a column number and
                        CTableCell *cell=row_obj.GetCell(column);
                        //--- return the result (object pointer or NULL)
                        return cell;
                       }
//--- Write the X and Y coordinates of the specified table cell into the variables passed to the method
   void              CellXY(const uint row,const uint column, int &x, int &y)
                       {
                        x=WRONG_VALUE;
                        y=WRONG_VALUE;
                        CTableCell *cell=this.GetCell(row,column);
                        if(cell==NULL)
                           return;
                        x=cell.X();
                        y=cell.Y();
                       }
//--- Return the X coordinate of the specified table cell
   int               CellX(const uint row,const uint column)
                       {
                        CTableCell *cell=this.GetCell(row,column);
                        return(cell!=NULL ? cell.X() : WRONG_VALUE);
                       }
//--- Return the Y coordinate of the specified table cell
   int               CellY(const uint row,const uint column)
                       {
                        CTableCell *cell=this.GetCell(row,column);
                        return(cell!=NULL ? cell.Y() : WRONG_VALUE);
                       }
//--- Return the number of table (1) rows and (2) columns
   int               RowsTotal(void)            { return this.m_list_rows.Total();  }
   int               ColumnsTotal(void)
                       {
                        //--- If there is no row in the list, return 0
                        if(this.RowsTotal()==0)
                           return 0;
                        //--- Get a pointer to the first row and return the number of cells in it
                        CTableRow *row=this.GetRow(0);
                        return(row!=NULL ? row.CellsTotal() : 0);
                       }
//--- Return the total number of cells in the table
   int               CellsTotal(void){ return this.RowsTotal()*this.ColumnsTotal(); }
//--- Clear lists of rows and table cells
   void              Clear(void)
                       {
                        //--- In the loop by the number of rows in the list of table rows,
                        for(int i=0;i<this.m_list_rows.Total();i++)
                          {
                           //--- get the pointer to the next row
                           CTableRow *row=this.m_list_rows.At(i);
                           if(row==NULL)
                              continue;
                           //--- get cell list from the obtained row object,
                           CArrayObj *list_cell=row.GetListCell();
                           //--- clear cell list
                           if(list_cell!=NULL)
                              list_cell.Clear();
                          }
                        //--- Clear cell list
                        this.m_list_rows.Clear();
                       }
//--- Print the table cell data in the journal
   void              Print(const uint indent=0)
                       {
                        //--- Print the header in the journal
                        ::PrintFormat("Table: Rows: %lu, Columns: %lu",this.RowsTotal(),this.ColumnsTotal());
                        //--- In the loop by table rows
                        for(int r=0;r<this.RowsTotal();r++)
                           //--- in the loop by the next row cells,
                           for(int c=0;c<this.ColumnsTotal();c++)
                             {
                              //--- get the pointer to the next cell and display its data in the journal
                              CTableCell *cell=this.GetCell(r,c);
                              if(cell!=NULL)
                                 ::PrintFormat("%*s%-5s %-4lu %-8s %-6lu %-8s %-6lu %-8s %-4lu",indent,"","Row",r,"Column",c,"Cell X:",cell.X(),"Cell Y:",cell.Y());
                             }
                       }
//--- Constructor/destructor
                     CTableData(void)  { this.m_list_rows.Clear();   }
                    ~CTableData(void)  { this.m_list_rows.Clear();   }
  };
ここにあるほぼすべてのメソッドはコード内でコメントされています。テーブル内の行と列の数、およびテーブルのセルの合計数を返すメソッドのみに注目します。
行数は行リストのサイズです。テーブルの正確な行数を取得します。
int RowsTotal(void) { return this.m_list_rows.Total(); }
行とは異なり、ここでの列の数は、その数が各行で同じであるという前提でのみ返されます。したがって、最初の行(リスト内のインデックスが0の行)のセルの数のみが返されます。
   int               ColumnsTotal(void)
                       {
                        //--- If there is no row in the list, return 0
                        if(this.RowsTotal()==0)
                           return 0;
                        //--- Get a pointer to the first row and return the number of cells in it
                        CTableRow *row=this.GetRow(0);
                        return(row!=NULL ? row.CellsTotal() : 0);
                       }
このクラスを展開して終了する場合、指定された行のセル数を返すメソッドを追加できます。したがって、テーブル内の行の(正確な)数を乗算してテーブル内のセルの総数を返さないようにすることができます。最初の行のセルの数でテーブルを計算します(上記の仮定を使用)。
int CellsTotal(void){ return this.RowsTotal()*this.ColumnsTotal(); }
このバージョンの表形式データクラスの正確な計算にはこれで十分であり、まだ物事を複雑にする必要はありません。これらは情報パネルクラスの単なる補助クラスであり、表形式(格子)マークアップを使用してパネルにデータを配置します。
ダッシュボードクラス
考えられるすべてのマウスの状態を定義してみましょう。
- マウスのボタン(左、右)が押されていない
- パネルウィンドウの外側でマウスボタンが押されている
- パネルウィンドウ内でマウスボタンが押されている
- パネルウィンドウのタイトル内でマウスボタンが押される
- 「閉じる」コントロール要素上でマウスボタンが押されている
- 「折りたたみ/展開」コントロール要素上でマウスボタンが押されている
- 「ピン」コントロール要素上でマウスボタンが押されている
- マウスカーソルがパネルウィンドウの外にある
- マウスカーソルがパネルウィンドウ内にある
- マウスカーソルがパネルウィンドウのタイトル内にある
- マウスカーソルが「閉じる」コントロール要素内にある
- マウスカーソルが「折りたたみ/展開」コントロール要素内にある
- マウスカーソルが「ピン」コントロール要素内にある
対応する列挙を作成しましょう。
enum ENUM_MOUSE_STATE
  {
   MOUSE_STATE_NOT_PRESSED,
   MOUSE_STATE_PRESSED_OUTSIDE_WINDOW,
   MOUSE_STATE_PRESSED_INSIDE_WINDOW,
   MOUSE_STATE_PRESSED_INSIDE_HEADER,
   MOUSE_STATE_PRESSED_INSIDE_CLOSE,
   MOUSE_STATE_PRESSED_INSIDE_MINIMIZE,
   MOUSE_STATE_PRESSED_INSIDE_PIN,
   MOUSE_STATE_OUTSIDE_WINDOW,
   MOUSE_STATE_INSIDE_WINDOW,
   MOUSE_STATE_INSIDE_HEADER,
   MOUSE_STATE_INSIDE_CLOSE,
   MOUSE_STATE_INSIDE_MINIMIZE,
   MOUSE_STATE_INSIDE_PIN
  };
現時点では、パネルのコントロール要素上でマウスボタンを押したままにするかクリックするかの追跡が実装されています。つまり、最初の押下が状態を固定するためのトリガーとなります。ただし、Windowsアプリケーションでは、このようなトリガーはボタンが押された後にボタンを放すこと、つまりクリックです。長押しすると、オブジェクトをドラッグできます。しかし今のところ、最初の押下はクリックまたは長押しのいずれかとみなされ、単純な解決策で十分です。パネルをさらに開発すると、上記の動作に合わせてマウスボタンの処理を補足できるようになります。
CDashboard情報パネルクラスは、パネルデザインとコントロール要素が描画されるキャンバス(背景)と、パネル上に配置されたデータが描画される作業領域の2つの要素で構成されます。作業スペースは常に完全に透明になり、キャンバスにはヘッダーとその他すべてに対して個別の透明度の値が設定されます。
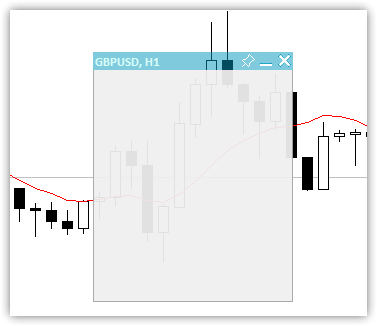
図2:タイトルの透明度が異なるキャンバスと枠のあるフィールドのみ
タイトルの下の枠で囲まれた領域は、作業領域を配置するために使用されます。この領域は完全に透明で、データテキストが含まれています。さらに、タイトルの下のキャンバス領域は視覚的なデザインに使用される場合があります。この場合、テーブルがその上に描画されます。
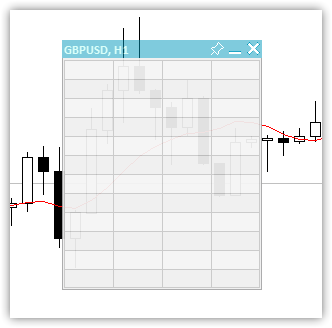
図3:12行4列の表
データを含む作業領域が、デザインされたキャンバスの上に重ねられます。その結果、本格的なパネルが得られます。
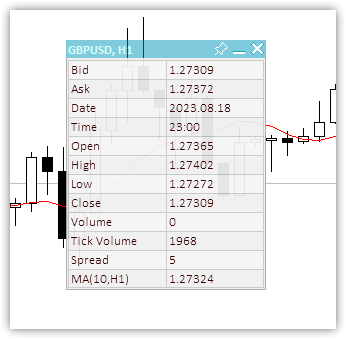
図4:12x2の背景テーブルとその上にデータが表示されたパネル
いくつかのパネルパラメータの値をグローバル端末変数に保存します。これにより、パネルはその状態を記憶し、再起動時にそれらの状態(X座標とY座標、最小化された状態、パネルの移動可能フラグ)を復元します。折りたたまれたフォームでチャート上にパネルを固定すると、この固定位置が保存され、次回固定パネルを折りたたんだときに、そのパネルが保存された場所に表示されます。
図5:パネルが折りたたまれたフォームで固定されている場合、パネルはアンカーの位置を「記憶」する
折りたたまれたパネルのバインド位置を記憶するには、パネルを折りたたんでバインド位置に移動し、ピンで固定する必要があることがわかります。パネルが折りたたまれた状態で固定されると、その位置が記憶されます。その後、展開したり、固定を解除したり、移動したりできます。パネルを保存したバインド位置に戻すには、パネルを固定して折りたたむ必要があります。固定しないと、パネルは現在の位置で折りたたまれます。
クラス本体
//+------------------------------------------------------------------+
//| Dashboard class                                                  |
//+------------------------------------------------------------------+
class CDashboard : public CObject
  {
private:
   CCanvas           m_canvas;                  // Canvas
   CCanvas           m_workspace;               // Work space
   CTableData        m_table_data;              // Table cell array
   ENUM_PROGRAM_TYPE m_program_type;            // Program type
   ENUM_MOUSE_STATE  m_mouse_state;             // Mouse button status
   uint              m_id;                      // Object ID
   long              m_chart_id;                // ChartID
   int               m_chart_w;                 // Chart width
   int               m_chart_h;                 // Chart height
   int               m_x;                       // X coordinate
   int               m_y;                       // Y coordinate
   int               m_w;                       // Width
   int               m_h;                       // Height
   int               m_x_dock;                  // X coordinate of the pinned collapsed panel
   int               m_y_dock;                  // Y coordinate of the pinned collapsed panel

   bool              m_header;                  // Header presence flag
   bool              m_butt_close;              // Close button presence flag
   bool              m_butt_minimize;           // Collapse/expand button presence flag
   bool              m_butt_pin;                // Pin button presence flag
   bool              m_wider_wnd;               // Flag for exceeding the horizontal size of the window width panel
   bool              m_higher_wnd;              // Flag for exceeding the vertical size of the window height panel
   bool              m_movable;                 // Panel movability flag
   int               m_header_h;                // Header height
   int               m_wnd;                     // Chart subwindow index

   uchar             m_header_alpha;            // Header transparency
   uchar             m_header_alpha_c;          // Current header transparency
   color             m_header_back_color;       // Header background color
   color             m_header_back_color_c;     // Current header background color
   color             m_header_fore_color;       // Header text color
   color             m_header_fore_color_c;     // Current header text color
   color             m_header_border_color;     // Header border color
   color             m_header_border_color_c;   // Current header border color

   color             m_butt_close_back_color;   // Close button background color
   color             m_butt_close_back_color_c; // Current close button background color
   color             m_butt_close_fore_color;   // Close button icon color
   color             m_butt_close_fore_color_c; // Current close button color

   color             m_butt_min_back_color;     // Expand/collapse button background color
   color             m_butt_min_back_color_c;   // Current expand/collapse button background color
   color             m_butt_min_fore_color;     // Expand/collapse button icon color
   color             m_butt_min_fore_color_c;   // Current expand/collapse button icon color

   color             m_butt_pin_back_color;     // Pin button background color
   color             m_butt_pin_back_color_c;   // Current pin button background color
   color             m_butt_pin_fore_color;     // Pin button icon color
   color             m_butt_pin_fore_color_c;   // Current pin button icon color

   uchar             m_alpha;                   // Panel transparency
   uchar             m_alpha_c;                 // Current panel transparency
   uchar             m_fore_alpha;              // Text transparency
   uchar             m_fore_alpha_c;            // Current text transparency
   color             m_back_color;              // Background color

   color             m_back_color_c;            // Current background color

   color             m_fore_color;              // Text color
   color             m_fore_color_c;            // Current text color
   color             m_border_color;            // Border color
   color             m_border_color_c;          // Current border color

   string            m_title;                   // Title text
   string            m_title_font;              // Title font
   int               m_title_font_size;         // Title font size
   string            m_font;                    // Font
   int               m_font_size;               // Font size

   bool              m_minimized;               // Collapsed panel window flag
   string            m_program_name;            // Program name
   string            m_name_gv_x;               // Name of the global terminal variable storing the X coordinate
   string            m_name_gv_y;               // Name of the global terminal variable storing the Y coordinate
   string            m_name_gv_m;               // Name of the global terminal variable storing the collapsed panel flag

   string            m_name_gv_u;               // Name of the global terminal variable storing the flag of the pinned panel

   uint              m_array_wpx[];             // Array of pixels to save/restore the workspace
   uint              m_array_ppx[];             // Array of pixels to save/restore the panel background

//--- Return the flag that the panel exceeds (1) the height and (2) the width of the corresponding chart size
   bool              HigherWnd(void)      const { return(this.m_h+2>this.m_chart_h);   }
   bool              WiderWnd(void)       const { return(this.m_w+2>this.m_chart_w);   }
//--- Enable/disable modes of working with the chart
   void              SetChartsTool(const bool flag);

//--- Save (1) the working space and (2) the panel background to the pixel array
   void              SaveWorkspace(void);
   void              SaveBackground(void);
//--- Restore (1) the working space and (2) the panel background from the pixel array
   void              RestoreWorkspace(void);
   void              RestoreBackground(void);

//--- Save the pixel array (1) of the working space and the (2) panel background to the file
   bool              FileSaveWorkspace(void);
   bool              FileSaveBackground(void);
//--- Load the pixel array of the (1) working space and (2) the panel background from the file
   bool              FileLoadWorkspace(void);
   bool              FileLoadBackground(void);

//--- Return the subwindow index
   int               GetSubWindow(void) const
                       {
                        return(this.m_program_type==PROGRAM_EXPERT || this.m_program_type==PROGRAM_SCRIPT ? 0 : ::ChartWindowFind());
                       }

protected:
//--- (1) Hide, (2) show and (3) bring the panel to the foreground
   void              Hide(const bool redraw=false);
   void              Show(const bool redraw=false);
   void              BringToTop(void);
//--- Return the chart ID
   long              ChartID(void)        const { return this.m_chart_id;              }
//--- Draw the header area
   void              DrawHeaderArea(const string title);
//--- Redraw the header area using a new color and text values
   void              RedrawHeaderArea(const color new_color=clrNONE,const string title="",const color title_new_color=clrNONE,const ushort new_alpha=USHORT_MAX);
//--- Draw the panel frame
   void              DrawFrame(void);
//--- (1) Draw and (2) redraw the panel closing button
   void              DrawButtonClose(void);
   void              RedrawButtonClose(const color new_back_color=clrNONE,const color new_fore_color=clrNONE,const ushort new_alpha=USHORT_MAX);
//--- (1) Draw and (2) redraw the panel collapse/expand button
   void              DrawButtonMinimize(void);
   void              RedrawButtonMinimize(const color new_back_color=clrNONE,const color new_fore_color=clrNONE,const ushort new_alpha=USHORT_MAX);
//--- (1) Draw and (2) redraw the panel pin button
   void              DrawButtonPin(void);
   void              RedrawButtonPin(const color new_back_color=clrNONE,const color new_fore_color=clrNONE,const ushort new_alpha=USHORT_MAX);

//--- Return the flag for working in the visual tester
   bool              IsVisualMode(void) const
                       { return (bool)::MQLInfoInteger(MQL_VISUAL_MODE);               }
//--- Return the timeframe description
   string            TimeframeDescription(const ENUM_TIMEFRAMES timeframe) const
                       { return ::StringSubstr(EnumToString(timeframe),7);             }

//--- Return the state of mouse buttons
   ENUM_MOUSE_STATE  MouseButtonState(const int x,const int y,bool pressed);
//--- Shift the panel to new coordinates
   void              Move(int x,int y);

//--- Convert RGB to color
   color             RGBToColor(const double r,const double g,const double b) const;
//--- Write RGB component values to variables
   void              ColorToRGB(const color clr,double &r,double &g,double &b);
//--- Return (1) Red, (2) Green, (3) Blue color components
   double            GetR(const color clr)      { return clr&0xff ;                    }
   double            GetG(const color clr)      { return(clr>>8)&0xff;                 }
   double            GetB(const color clr)      { return(clr>>16)&0xff;                }
//--- Return a new color
   color             NewColor(color base_color, int shift_red, int shift_green, int shift_blue);

//--- Draw a panel
   void              Draw(const string title);
//--- (1) Collapse and (2) expand the panel
   void              Collapse(void);
   void              Expand(void);

//--- Set the (1) X and (2) Y panel coordinates
   bool              SetCoordX(const int coord_x);
   bool              SetCoordY(const int coord_y);
//--- Set the panel (1) width and (2) height
   bool              SetWidth(const int width,const bool redraw=false);
   bool              SetHeight(const int height,const bool redraw=false);

public:
//--- Display the panel
   void              View(const string title)   { this.Draw(title);                    }
//--- Return the (1) CCanvas object, (2) working space, (3) object ID
   CCanvas          *Canvas(void)               { return &this.m_canvas;               }
   CCanvas          *Workspace(void)            { return &this.m_workspace;            }
   uint              ID(void)                   { return this.m_id;                    }

//--- Return the panel (1) X and (2) Y coordinates
   int               CoordX(void)         const { return this.m_x;                     }
   int               CoordY(void)         const { return this.m_y;                     }
//--- Return the panel (1) width and (2) height
   int               Width(void)          const { return this.m_w;                     }
   int               Height(void)         const { return this.m_h;                     }

//--- Return the (1) width, (2) height and (3) size of the specified text
   int               TextWidth(const string text)
                       { return this.m_workspace.TextWidth(text);                      }
   int               TextHeight(const string text)
                       { return this.m_workspace.TextHeight(text);                     }
   void              TextSize(const string text,int &width,int &height)
                       { this.m_workspace.TextSize(text,width,height);                 }

//--- Set the close button (1) presence, (2) absence flag
   void              SetButtonCloseOn(void);
   void              SetButtonCloseOff(void);
//--- Set the collapse/expand button (1) presence, (2) absence flag
   void              SetButtonMinimizeOn(void);
   void              SetButtonMinimizeOff(void);

//--- Set the panel coordinates
   bool              SetCoords(const int x,const int y);
//--- Set the panel size
   bool              SetSizes(const int w,const int h,const bool update=false);
//--- Set panel coordinates and size
   bool              SetParams(const int x,const int y,const int w,const int h,const bool update=false);

//--- Set the transparency of the panel (1) header and (2) working space
   void              SetHeaderTransparency(const uchar value);
   void              SetTransparency(const uchar value);
//--- Set default panel font parameters
   void              SetFontParams(const string name,const int size,const uint flags=0,const uint angle=0);
//--- Display a text message at the specified coordinates
   void              DrawText(const string text,const int x,const int y,const int width=WRONG_VALUE,const int height=WRONG_VALUE);
//--- Draw a (1) background grid (2) with automatic cell size
   void              DrawGrid(const uint x,const uint y,const uint rows,const uint columns,const uint row_size,const uint col_size,const color line_color=clrNONE,bool alternating_color=true);
   void              DrawGridAutoFill(const uint border,const uint rows,const uint columns,const color line_color=clrNONE,bool alternating_color=true);
//--- Print grid data (line intersection coordinates)
   void              GridPrint(const uint indent=0)   { this.m_table_data.Print(indent);  }
//--- Write the X and Y coordinate values of the specified table cell to variables
   void              CellXY(const uint row,const uint column, int &x, int &y) { this.m_table_data.CellXY(row,column,x,y);  }
//--- Return the (1) X and (2) Y coordinate of the specified table cell
   int               CellX(const uint row,const uint column)         { return this.m_table_data.CellX(row,column);         }
   int               CellY(const uint row,const uint column)         { return this.m_table_data.CellY(row,column);         }

//--- Event handler
   void              OnChartEvent(const int id,const long &lparam,const double &dparam,const string &sparam);
//--- Constructor/destructor
                     CDashboard(const uint id,const int x,const int y, const int w,const int h,const int wnd=-1);
                    ~CDashboard();
  };
宣言された変数とクラスメソッドは、コード内で詳細にコメントされています。いくつかのメソッドの実装を見てみましょう。
クラスコンストラクタ
//+------------------------------------------------------------------+
//| Constructor                                                      |
//+------------------------------------------------------------------+
CDashboard::CDashboard(const uint id,const int x,const int y, const int w,const int h,const int wnd=-1) :
                        m_id(id),
                        m_chart_id(::ChartID()),
                        m_program_type((ENUM_PROGRAM_TYPE)::MQLInfoInteger(MQL_PROGRAM_TYPE)),
                        m_program_name(::MQLInfoString(MQL_PROGRAM_NAME)),
                        m_wnd(wnd==-1 ? GetSubWindow() : wnd),
                        m_chart_w((int)::ChartGetInteger(m_chart_id,CHART_WIDTH_IN_PIXELS,m_wnd)),
                        m_chart_h((int)::ChartGetInteger(m_chart_id,CHART_HEIGHT_IN_PIXELS,m_wnd)),
                        m_mouse_state(MOUSE_STATE_NOT_PRESSED),
                        m_x(x),
                        m_y(::ChartGetInteger(m_chart_id,CHART_SHOW_ONE_CLICK) ? (y<79 ? 79 : y) : y),
                        m_w(w),
                        m_h(h),
                        m_x_dock(m_x),
                        m_y_dock(m_y),
                        m_header(true),
                        m_butt_close(true),
                        m_butt_minimize(true),
                        m_butt_pin(true),
                        m_header_h(18),

                        //--- Panel header implementation
                        m_header_alpha(128),
                        m_header_alpha_c(m_header_alpha),
                        m_header_back_color(C'0,153,188'),
                        m_header_back_color_c(m_header_back_color),
                        m_header_fore_color(C'182,255,244'),
                        m_header_fore_color_c(m_header_fore_color),
                        m_header_border_color(C'167,167,168'),
                        m_header_border_color_c(m_header_border_color),
                        m_title("Dashboard"),
                        m_title_font("Calibri"),
                        m_title_font_size(-100),

                        //--- close button
                        m_butt_close_back_color(C'0,153,188'),
                        m_butt_close_back_color_c(m_butt_close_back_color),
                        m_butt_close_fore_color(clrWhite),
                        m_butt_close_fore_color_c(m_butt_close_fore_color),

                        //--- collapse/expand button
                        m_butt_min_back_color(C'0,153,188'),
                        m_butt_min_back_color_c(m_butt_min_back_color),
                        m_butt_min_fore_color(clrWhite),
                        m_butt_min_fore_color_c(m_butt_min_fore_color),

                        //--- pin button
                        m_butt_pin_back_color(C'0,153,188'),
                        m_butt_pin_back_color_c(m_butt_min_back_color),
                        m_butt_pin_fore_color(clrWhite),
                        m_butt_pin_fore_color_c(m_butt_min_fore_color),

                        //--- Panel implementation
                        m_alpha(240),
                        m_alpha_c(m_alpha),
                        m_fore_alpha(255),
                        m_fore_alpha_c(m_fore_alpha),
                        m_back_color(C'240,240,240'),
                        m_back_color_c(m_back_color),
                        m_fore_color(C'53,0,0'),
                        m_fore_color_c(m_fore_color),
                        m_border_color(C'167,167,168'),
                        m_border_color_c(m_border_color),
                        m_font("Calibri"),
                        m_font_size(-100),

                        m_minimized(false),
                        m_movable(true)
  {
//--- Set the permission for the chart to send messages about events of moving and pressing mouse buttons,
//--- mouse scroll events, as well as graphical object creation/deletion
   ::ChartSetInteger(this.m_chart_id,CHART_EVENT_MOUSE_MOVE,true);
   ::ChartSetInteger(this.m_chart_id,CHART_EVENT_MOUSE_WHEEL,true);
   ::ChartSetInteger(this.m_chart_id,CHART_EVENT_OBJECT_CREATE,true);
   ::ChartSetInteger(this.m_chart_id,CHART_EVENT_OBJECT_DELETE,true);

//--- Set the names of global terminal variables to store panel coordinates, collapsed/expanded state and pinning
   this.m_name_gv_x=this.m_program_name+"_id_"+(string)this.m_id+"_"+(string)this.m_chart_id+"_X";
   this.m_name_gv_y=this.m_program_name+"_id_"+(string)this.m_id+"_"+(string)this.m_chart_id+"_Y";
   this.m_name_gv_m=this.m_program_name+"_id_"+(string)this.m_id+"_"+(string)this.m_chart_id+"_Minimize";
   this.m_name_gv_u=this.m_program_name+"_id_"+(string)this.m_id+"_"+(string)this.m_chart_id+"_Unpin";

//--- If a global variable does not exist, create it and write the current value,
//--- otherwise - read the value from the terminal global variable into it
//--- X coordinate
   if(!::GlobalVariableCheck(this.m_name_gv_x))
      ::GlobalVariableSet(this.m_name_gv_x,this.m_x);
   else
      this.m_x=(int)::GlobalVariableGet(this.m_name_gv_x);
//--- Y coordinate
   if(!::GlobalVariableCheck(this.m_name_gv_y))
      ::GlobalVariableSet(this.m_name_gv_y,this.m_y);
   else
      this.m_y=(int)::GlobalVariableGet(this.m_name_gv_y);
//--- Collapsed/expanded
   if(!::GlobalVariableCheck(this.m_name_gv_m))
      ::GlobalVariableSet(this.m_name_gv_m,this.m_minimized);
   else
      this.m_minimized=(int)::GlobalVariableGet(this.m_name_gv_m);
//--- Collapsed/not collapsed
   if(!::GlobalVariableCheck(this.m_name_gv_u))
      ::GlobalVariableSet(this.m_name_gv_u,this.m_movable);
   else
      this.m_movable=(int)::GlobalVariableGet(this.m_name_gv_u);

//--- Set the flags for the size of the panel exceeding the size of the chart window
   this.m_higher_wnd=this.HigherWnd();
   this.m_wider_wnd=this.WiderWnd();

//--- If the panel graphical resource is created,
   if(this.m_canvas.CreateBitmapLabel(this.m_chart_id,this.m_wnd,"P"+(string)this.m_id,this.m_x,this.m_y,this.m_w,this.m_h,COLOR_FORMAT_ARGB_NORMALIZE))
     {
      //--- set the canvas font and fill the canvas with the transparent color
      this.m_canvas.FontSet(this.m_title_font,this.m_title_font_size,FW_BOLD);
      this.m_canvas.Erase(0x00FFFFFF);
     }
//--- otherwise - report unsuccessful object creation to the journal
   else
      ::PrintFormat("%s: Error. CreateBitmapLabel for canvas failed",(string)__FUNCTION__);

//--- If a working space of a graphical resource is created,
   if(this.m_workspace.CreateBitmapLabel(this.m_chart_id,this.m_wnd,"W"+(string)this.m_id,this.m_x+1,this.m_y+this.m_header_h,this.m_w-2,this.m_h-this.m_header_h-1,COLOR_FORMAT_ARGB_NORMALIZE))
     {
      //--- set the font for the working area and fill it with the transparent color
      this.m_workspace.FontSet(this.m_font,this.m_font_size);
      this.m_workspace.Erase(0x00FFFFFF);
     }
//--- otherwise - report unsuccessful object creation to the journal
   else
      ::PrintFormat("%s: Error. CreateBitmapLabel for workspace failed",(string)__FUNCTION__);
  }
このクラスには1つのパラメトリックコンストラクタと、デフォルトで作成される1つのコンストラクタがあります。当然のことながら、興味があるのはパラメトリックコンストラクタだけです。クラスオブジェクトを作成する際に使用します。一意のオブジェクトID、パネルの初期座標、その幅と高さ、パネルが配置されるサブウィンドウのインデックスは、仮パラメータを介してコンストラクタに渡されます。
クラスが一意の名前を持つオブジェクトを作成できるようにするには、一意のパネルIDが必要です。1つのチャート上のパネルで複数の指標を使用する場合、オブジェクト名の競合を避けるために、この一意の番号が必要になります。この一意の番号は、パネルオブジェクトの作成時にその名前に追加されます。IDの一意性は再現可能である必要があります。新しい起動のたびに、番号は前回の起動時と同じである必要があります。例えば、GetTickCount()はIDには適していません。
サブウィンドウのインデックスがデフォルト(-1)で設定されている場合は、プログラムによって検索されます。それ以外の場合は、パラメータで指定されたインデックスが使用されます。
デフォルトのパラメータはコンストラクタの初期化リストに設定されます。ビジュアルを担当する一部のパラメータは、デフォルト値と現在のプロパティ値の2つの変数を特徴としています。これは、例えば、そのようなパラメータが担当するパネルの領域上にマウスを移動するときなど、対話型の変更に必要です。
コンストラクタ本体には、グローバル端末変数の値が含まれます。キャンバスとパネル作業領域という2つのグラフィカルオブジェクトが作成されます。
コンストラクタコードはすべて詳細にコメントされています。
クラスデストラクタ
//+------------------------------------------------------------------+
//| Destructor                                                       |
//+------------------------------------------------------------------+
CDashboard::~CDashboard()
  {
//--- Write the current values to global terminal variables
   ::GlobalVariableSet(this.m_name_gv_x,this.m_x);
   ::GlobalVariableSet(this.m_name_gv_y,this.m_y);
   ::GlobalVariableSet(this.m_name_gv_m,this.m_minimized);
   ::GlobalVariableSet(this.m_name_gv_u,this.m_movable);
//--- Delete panel objects
   this.m_canvas.Destroy();
   this.m_workspace.Destroy();
  }
ここでは、まず座標とフラグをグローバル端末変数にリセットし、次にキャンバスと作業スペースオブジェクトを削除します。
カーソルとマウスボタンを使用してパネルを操作するには、パネルとそのコントロール要素に対するカーソルの位置を知る必要があります。カーソルが移動すると、その座標とクラスイベントハンドラ内のボタンの状態を追跡できます。クラスイベントハンドラには、標準のOnChartEventハンドラと同じパラメータがあります。
void  OnChartEvent()
   const int       id,       // event ID
   const long&     lparam,   // long type event parameter
   const double&   dparam,   // double type event parameter
   const string&   sparam    // string type event parameter
   );
パラメータ
ID
[in] ENUM_CHART_EVENT列挙のイベントID
lparam
[in] long型イベントパラメータ
dparam
[in] double型イベントパラメータ
sparam
[in] string型イベントパラメータ
戻り値
戻り値なし
メモ
事前定義されたOnChartEvent()関数を使用して処理できるイベントは11種類あります。カスタムイベントには、CHARTEVENT_CUSTOMからCHARTEVENT_CUSTOM_LASTまでの65535個のIDが提供されます。カスタムイベントを生成するには、EventChartCustom()関数を使用します。
ENUM_CHART_EVENT列挙からのイベントの短い説明は次の通りです。
- CHARTEVENT_KEYDOWN:チャートウィンドウにフォーカスがある場合にキーボードのキーを押す
- CHARTEVENT_MOUSE_MOVE:マウスの移動とマウスボタンのクリック(CHART_EVENT_MOUSE_MOVE=trueがチャートに設定されている場合)
- CHARTEVENT_OBJECT_CREATE:グラフィカルオブジェクトを作成する(CHART_EVENT_OBJECT_CREATE=trueがチャートに設定されている場合)
- CHARTEVENT_OBJECT_CHANGE:プロパティダイアログでオブジェクトのプロパティを変更する
- CHARTEVENT_OBJECT_DELETE:グラフィカルオブジェクトを削除する(CHART_EVENT_OBJECT_DELETE=trueがチャートに設定されている場合)
- CHARTEVENT_CLICK:チャートをクリックする
- CHARTEVENT_OBJECT_CLICK:チャートに属するグラフィックオブジェクトをマウスでクリックする
- CHARTEVENT_OBJECT_DRAG:マウスを使用してグラフィカルオブジェクトをドラッグする
- CHARTEVENT_OBJECT_ENDEDIT:グラフィカルオブジェクト(OBJ_EDIT)の編集入力ボックスでテキストの編集を終了する
- CHARTEVENT_CHART_CHANGE:チャートを変更する
- CHARTEVENT_CUSTOM+n:カスタムイベントID。nは0~65535。CHARTEVENT_CUSTOM_LASTには、受け入れ可能な最後のカスタムイベントID(CHARTEVENT_CUSTOM+65535)が含まれる
lparamパラメータにはX座標、dparamにはY座標が含まれ、sparamにはマウスボタンの状態を決定するためのフラグ値の組み合わせが含まれます。これらすべてのパラメータは、パネルとその要素の座標を基準にして受信および処理する必要があります。状態は決定され、クラスイベントハンドラに送信され、そこでこれらすべての状態に対する反応が指定されます。
パネルに対するカーソルとマウスボタンの状態を返すメソッド
//+------------------------------------------------------------------+
//| Returns the state of the mouse cursor and button                 |
//+------------------------------------------------------------------+
ENUM_MOUSE_STATE CDashboard::MouseButtonState(const int x,const int y,bool pressed)
  {
//--- If the button is pressed
   if(pressed)
     {
      //--- If the state has already been saved, exit
      if(this.m_mouse_state!=MOUSE_STATE_NOT_PRESSED)
         return this.m_mouse_state;
      //--- If the button is pressed inside the window
      if(x>this.m_x && x<this.m_x+this.m_w && y>this.m_y && y<this.m_y+this.m_h)
        {
         //--- If the button is pressed inside the header
         if(y>this.m_y && y<=this.m_y+this.m_header_h)
           {
            //--- Bring the panel to the foreground
            this.BringToTop();
            //--- Coordinates of the close, collapse/expand and pin buttons
            int wc=(this.m_butt_close ? this.m_header_h : 0);
            int wm=(this.m_butt_minimize ? this.m_header_h : 0);
            int wp=(this.m_butt_pin ? this.m_header_h : 0);
            //--- If the close button is pressed, return this state
            if(x>this.m_x+this.m_w-wc)
               return MOUSE_STATE_PRESSED_INSIDE_CLOSE;
            //--- If the collapse/expand button is pressed, return this state
            if(x>this.m_x+this.m_w-wc-wm)
               return MOUSE_STATE_PRESSED_INSIDE_MINIMIZE;
            //--- If the pin button is pressed, return this state
            if(x>this.m_x+this.m_w-wc-wm-wp)
               return MOUSE_STATE_PRESSED_INSIDE_PIN;
            //--- If the button is not pressed on the control buttons of the panel, record and return the state of the button press inside the header
            this.m_mouse_state=MOUSE_STATE_PRESSED_INSIDE_HEADER;
            return this.m_mouse_state;
           }
         //--- If a button inside the window is pressed, write the state to a variable and return it
         else if(y>this.m_y+this.m_header_h && y<this.m_y+this.m_h)
           {
            this.m_mouse_state=MOUSE_STATE_PRESSED_INSIDE_WINDOW;
            return this.m_mouse_state;
           }
        }
      //--- The button is pressed outside the window - write the state to a variable and return it
      else
        {
         this.m_mouse_state=MOUSE_STATE_PRESSED_OUTSIDE_WINDOW;
         return this.m_mouse_state;
        }
     }
//--- If the button is not pressed
   else
     {
      //--- Write the state of the unpressed button to the variable
      this.m_mouse_state=MOUSE_STATE_NOT_PRESSED;
      //--- If the cursor is inside the panel
      if(x>this.m_x && x<this.m_x+this.m_w && y>this.m_y && y<this.m_y+this.m_h)
        {
         //--- If the cursor is inside the header
         if(y>this.m_y && y<=this.m_y+this.m_header_h)
           {
            //--- Specify the width of the close, collapse/expand and pin buttons
            int wc=(this.m_butt_close ? this.m_header_h : 0);
            int wm=(this.m_butt_minimize ? this.m_header_h : 0);
            int wp=(this.m_butt_pin ? this.m_header_h : 0);
            //--- If the cursor is inside the close button, return this state
            if(x>this.m_x+this.m_w-wc)
               return MOUSE_STATE_INSIDE_CLOSE;
            //--- If the cursor is inside the minimize/expand button, return this state
            if(x>this.m_x+this.m_w-wc-wm)
               return MOUSE_STATE_INSIDE_MINIMIZE;
            //--- If the cursor is inside the pin button, return this state
            if(x>this.m_x+this.m_w-wc-wm-wp)
               return MOUSE_STATE_INSIDE_PIN;
            //--- If the cursor is outside the buttons inside the header area, return this state
            return MOUSE_STATE_INSIDE_HEADER;
           }
         //--- Otherwise, the cursor is inside the working space. Return this state
         else
            return MOUSE_STATE_INSIDE_WINDOW;
        }
     }
//--- In any other case, return the state of the unpressed mouse button
   return MOUSE_STATE_NOT_PRESSED;
  }
メソッドのロジックは、コードコメントで詳しく説明されています。カーソル、パネルおよびその要素の相互座標を決定し、状態を戻すだけです。押されたまたは放されたマウスボタンのフラグは、すぐにメソッドに送信されます。このような状態ごとに、ボタンが押されたときまたはボタンが放されたときの状態を定義する独自のコードブロックがあります。この方法でロジックを使用するのは非常に簡単かつ高速です。ただし、いくつかの欠点があります。コントロール要素上のマウスクリックを検出できないということです。代わりに、クリックのみを検出できます。通常、クリックはマウスボタンを放したときに登録され、長押しはマウスボタンを押したときに登録されます。ここで使用されるロジックでは、マウスボタンを押すことだけが、クリックと長押しとみなされるアクションです。
このメソッドで取得した状態は、イベントハンドラに送信する必要があります。各イベントには、パネルの動作と外観を変更する独自のハンドラがあります。
//+------------------------------------------------------------------+
//| Event handler                                                    |
//+------------------------------------------------------------------+
void CDashboard::OnChartEvent(const int id,const long &lparam,const double &dparam,const string &sparam)
  {
//--- If a graphical object is created
   if(id==CHARTEVENT_OBJECT_CREATE)
     {
      this.BringToTop();
      ::ObjectSetInteger(this.m_chart_id,sparam,OBJPROP_SELECTED,true);
     }
//--- If the chart is changed
   if(id==CHARTEVENT_CHART_CHANGE)
     {
      //--- Get the chart subwindow index (it may change when removing the window of any indicator)
      this.m_wnd=this.GetSubWindow();
      //--- Get the new chart size
      int w=(int)::ChartGetInteger(this.m_chart_id,CHART_WIDTH_IN_PIXELS,this.m_wnd);
      int h=(int)::ChartGetInteger(this.m_chart_id,CHART_HEIGHT_IN_PIXELS,this.m_wnd);
      //--- Determine whether the panel dimensions extend beyond the chart window
      this.m_higher_wnd=this.HigherWnd();
      this.m_wider_wnd=this.WiderWnd();
      //--- If the chart height has changed, adjust the panel vertical position
      if(this.m_chart_h!=h)
        {
         this.m_chart_h=h;
         int y=this.m_y;
         if(this.m_y+this.m_h>h-1)
            y=h-this.m_h-1;
         if(y<1)
            y=1;
         this.Move(this.m_x,y);
        }
      //--- If the chart weight has changed, adjust the panel horizontal position
      if(this.m_chart_w!=w)
        {
         this.m_chart_w=w;
         int x=this.m_x;
         if(this.m_x+this.m_w>w-1)
            x=w-this.m_w-1;
         if(x<1)
            x=1;
         this.Move(x,this.m_y);
        }
     }

//--- Declare variables to store the current cursor shift relative to the initial coordinates of the panel
   static int diff_x=0;
   static int diff_y=0;

//--- Get the flag of the held mouse button. We also take into account the right button for the visual tester (sparam=="2")
   bool pressed=(!this.IsVisualMode() ? (sparam=="1" || sparam=="" ? true : false) : sparam=="1" || sparam=="2" ? true : false);
//--- Get the cursor X and Y coordinates. Take into account the shift for the Y coordinate when working in the chart subwindow
   int  mouse_x=(int)lparam;
   int  mouse_y=(int)dparam-(int)::ChartGetInteger(this.m_chart_id,CHART_WINDOW_YDISTANCE,this.m_wnd);
//--- Get the state of the cursor and mouse buttons relative to the panel
   ENUM_MOUSE_STATE state=this.MouseButtonState(mouse_x,mouse_y,pressed);
//--- If the cursor moves
   if(id==CHARTEVENT_MOUSE_MOVE)
     {
      //--- If a button is pressed inside the working area of the panel
      if(state==MOUSE_STATE_PRESSED_INSIDE_WINDOW)
        {
         //--- Disable chart scrolling, right-click menu and crosshair
         this.SetChartsTool(false);
         //--- Redraw the header area with the default background color
         if(this.m_header_back_color_c!=this.m_header_back_color)
           {
            this.RedrawHeaderArea(this.m_header_back_color);
            this.m_canvas.Update();
           }
         return;
        }
      //--- If a button is pressed inside the panel header area
      else if(state==MOUSE_STATE_PRESSED_INSIDE_HEADER)
        {
         //--- Disable chart scrolling, right-click menu and crosshair
         this.SetChartsTool(false);
         //--- Redraw the header area with a new background color
         color new_color=this.NewColor(this.m_header_back_color,-10,-10,-10);
         if(this.m_header_back_color_c!=new_color)
           {
            this.RedrawHeaderArea(new_color);
            this.m_canvas.Update();
           }
         //--- Shift the panel following the cursor taking into account the amount of cursor displacement relative to the initial coordinates of the panel
         if(this.m_movable)
            this.Move(mouse_x-diff_x,mouse_y-diff_y);
         return;
        }

      //--- If the close button is pressed
      else if(state==MOUSE_STATE_PRESSED_INSIDE_CLOSE)
        {
         //--- Disable chart scrolling, right-click menu and crosshair
         this.SetChartsTool(false);
         //--- Redraw the close button with a new background color
         color new_color=this.NewColor(clrRed,0,40,40);
         if(this.m_butt_close_back_color_c!=new_color)
           {
            this.RedrawButtonClose(new_color);
            this.m_canvas.Update();
           }
         //--- Close button press handling should be defined in the program.
         //--- Send the click event of this button to its OnChartEvent handler.
         //--- Event ID 1001,
         //--- lparam=panel ID (m_id),
         //--- dparam=0
         //--- sparam="Close button pressed"
         ushort event=CHARTEVENT_CUSTOM+1;
         ::EventChartCustom(this.m_chart_id,ushort(event-CHARTEVENT_CUSTOM),this.m_id,0,"Close button pressed");
        }
      //--- If the panel collapse/expand button is pressed
      else if(state==MOUSE_STATE_PRESSED_INSIDE_MINIMIZE)
        {
         //--- Disable chart scrolling, right-click menu and crosshair
         this.SetChartsTool(false);
         //--- "flip" the panel collapse flag,
         this.m_minimized=!this.m_minimized;
         //--- redraw the panel taking into account the new state of the flag,
         this.Draw(this.m_title);
         //--- redraw the panel header area
         this.RedrawHeaderArea();
         //--- If the panel is pinned and expanded, move it to the stored location coordinates
         if(this.m_minimized && !this.m_movable)
            this.Move(this.m_x_dock,this.m_y_dock);
         //--- Update the canvas with chart redrawing and
         this.m_canvas.Update();
         //--- write the state of the panel expand flag to the global terminal variable
         ::GlobalVariableSet(this.m_name_gv_m,this.m_minimized);
        }
      //--- If the panel pin button is pressed
      else if(state==MOUSE_STATE_PRESSED_INSIDE_PIN)
        {
         //--- Disable chart scrolling, right-click menu and crosshair
         this.SetChartsTool(false);
         //--- "flip" the panel collapse flag,
         this.m_movable=!this.m_movable;
         //--- Redraw the pin button with a new background color
         color new_color=this.NewColor(this.m_butt_pin_back_color,30,30,30);
         if(this.m_butt_pin_back_color_c!=new_color)
            this.RedrawButtonPin(new_color);
         //--- If the panel is collapsed and pinned, save its coordinates
         //--- When expanded and collapsed again, the panel returns to these coordinates
         //--- Relevant for pinning a collapsed panel at the bottom of the screen
         if(this.m_minimized && !this.m_movable)
           {
            this.m_x_dock=this.m_x;
            this.m_y_dock=this.m_y;
           }
         //--- Update the canvas with chart redrawing and
         this.m_canvas.Update();
         //--- write the state of the panel movability flag to the global terminal variable
         ::GlobalVariableSet(this.m_name_gv_u,this.m_movable);
        }

      //--- If the cursor is inside the panel header area
      else if(state==MOUSE_STATE_INSIDE_HEADER)
        {
         //--- Disable chart scrolling, right-click menu and crosshair
         this.SetChartsTool(false);
         //--- Redraw the header area with a new background color
         color new_color=this.NewColor(this.m_header_back_color,20,20,20);
         if(this.m_header_back_color_c!=new_color)
           {
            this.RedrawHeaderArea(new_color);
            this.m_canvas.Update();
           }
        }

      //--- If the cursor is inside the close button
      else if(state==MOUSE_STATE_INSIDE_CLOSE)
        {
         //--- Disable chart scrolling, right-click menu and crosshair
         this.SetChartsTool(false);
         //--- Redraw the header area with a minimal change in the background color
         color new_color=this.NewColor(this.m_header_back_color,0,0,1);
         if(this.m_header_back_color_c!=new_color)
            this.RedrawHeaderArea(new_color);
         //--- Redraw the collapse/expand button with the default background color
         if(this.m_butt_min_back_color_c!=this.m_butt_min_back_color)
            this.RedrawButtonMinimize(this.m_butt_min_back_color);
         //--- Redraw the pin button with the default background color
         if(this.m_butt_pin_back_color_c!=this.m_butt_pin_back_color)
            this.RedrawButtonPin(this.m_butt_pin_back_color);
         //--- Redraw the close button with the red background color
         if(this.m_butt_close_back_color_c!=clrRed)
           {
            this.RedrawButtonClose(clrRed);
            this.m_canvas.Update();
           }
        }

      //--- If the cursor is inside the collapse/expand button
      else if(state==MOUSE_STATE_INSIDE_MINIMIZE)
        {
         //--- Disable chart scrolling, right-click menu and crosshair
         this.SetChartsTool(false);
         //--- Redraw the header area with a minimal change in the background color
         color new_color=this.NewColor(this.m_header_back_color,0,0,1);
         if(this.m_header_back_color_c!=new_color)
            this.RedrawHeaderArea(new_color);
         //--- Redraw the close button with the default background color
         if(this.m_butt_close_back_color_c!=this.m_butt_close_back_color)
            this.RedrawButtonClose(this.m_butt_close_back_color);
         //--- Redraw the pin button with the default background color
         if(this.m_butt_pin_back_color_c!=this.m_butt_pin_back_color)
            this.RedrawButtonPin(this.m_butt_pin_back_color);
         //--- Redraw the collapse/expand button with a new background color
         new_color=this.NewColor(this.m_butt_min_back_color,20,20,20);
         if(this.m_butt_min_back_color_c!=new_color)
           {
            this.RedrawButtonMinimize(new_color);
            this.m_canvas.Update();
           }
        }

      //--- If the cursor is inside the pin button
      else if(state==MOUSE_STATE_INSIDE_PIN)
        {
         //--- Disable chart scrolling, right-click menu and crosshair
         this.SetChartsTool(false);
         //--- Redraw the header area with a minimal change in the background color
         color new_color=this.NewColor(this.m_header_back_color,0,0,1);
         if(this.m_header_back_color_c!=new_color)
            this.RedrawHeaderArea(new_color);
         //--- Redraw the close button with the default background color
         if(this.m_butt_close_back_color_c!=this.m_butt_close_back_color)
            this.RedrawButtonClose(this.m_butt_close_back_color);
         //--- Redraw the collapse/expand button with the default background color
         if(this.m_butt_min_back_color_c!=this.m_butt_min_back_color)
            this.RedrawButtonMinimize(this.m_butt_min_back_color);
         //--- Redraw the pin button with a new background color
         new_color=this.NewColor(this.m_butt_pin_back_color,20,20,20);
         if(this.m_butt_pin_back_color_c!=new_color)
           {
            this.RedrawButtonPin(new_color);
            this.m_canvas.Update();
           }
        }

      //--- If the cursor is inside the working space
      else if(state==MOUSE_STATE_INSIDE_WINDOW)
        {
         //--- Disable chart scrolling, right-click menu and crosshair
         this.SetChartsTool(false);
         //--- Redraw the header area with the default background color
         if(this.m_header_back_color_c!=this.m_header_back_color)
           {
            this.RedrawHeaderArea(this.m_header_back_color);
            this.m_canvas.Update();
           }
        }
      //--- Otherwise (the cursor is outside the panel, and we need to restore the chart parameters)
      else
        {
         //--- Enable chart scrolling, right-click menu and crosshair
         this.SetChartsTool(true);
         //--- Redraw the header area with the default background color
         if(this.m_header_back_color_c!=this.m_header_back_color)
           {
            this.RedrawHeaderArea(this.m_header_back_color);
            this.m_canvas.Update();
           }
        }
      //--- Write the cursor shift by X and Y relative to the panel initial coordinates
      diff_x=mouse_x-this.m_x;
      diff_y=mouse_y-this.m_y;
     }
  }
イベントハンドラのロジックは、コード内で十分に詳細にコメントされています。ここでいくつかの注目すべき点を考慮する必要があります。
新しいグラフィカルオブジェクトを作成するイベントの処理は、最初に指定されます。
//--- If a graphical object is created
   if(id==CHARTEVENT_OBJECT_CREATE)
     {
      this.BringToTop();
      ::ObjectSetInteger(this.m_chart_id,sparam,OBJPROP_SELECTED,true);
     }
その機能は何でしょうか。新しいグラフィックオブジェクトを作成すると、チャート上の他のグラフィックオブジェクトの上に配置されるため、パネルの上部に重ねられます。したがって、このようなイベントを定義すると、パネルがすぐに最前面に表示されます。次に、新しいグラフィックオブジェクトが強調表示されます。なぜでしょうか。そうしないと、作図に複数の点を必要とするグラフィカルオブジェクト(トレンドラインなど)は正常に作成されません。すべての制御点が同じ座標に配置され、オブジェクト自体が表示されなくなります。これは、パネルが最前面に表示されると、グラフィカルオブジェクトの作成中に制御が失われるために発生します。したがって、パネルを最前面に移動した後、新しいグラフィックオブジェクトを強制的に選択する必要があります。
したがって、パネルとグラフィックオブジェクトを作成するときの相互の動作は次のようになります。
図6:新しいグラフィカルオブジェクトはパネルの「下」に構築されて作成時にフォーカスを失わない
イベントハンドラには、状態ごとに独自の処理ブロックがあります。これらすべてのブロックのロジックは同一です。例えば、パネルヘッダー上でマウスをクリックしたままにする処理を次のように実行します。
      //--- If a button is pressed inside the panel header area
      else if(state==MOUSE_STATE_PRESSED_INSIDE_HEADER)
        {
         //--- Disable chart scrolling, right-click menu and crosshair
         this.SetChartsTool(false);
         //--- Redraw the header area with a new background color
         color new_color=this.NewColor(this.m_header_back_color,-10,-10,-10);
         if(this.m_header_back_color_c!=new_color)
           {
            this.RedrawHeaderArea(new_color);
            this.m_canvas.Update();
           }
         //--- Shift the panel following the cursor taking into account the amount of cursor displacement relative to the initial coordinates of the panel
         if(this.m_movable)
            this.Move(mouse_x-diff_x,mouse_y-diff_y);
         return;
        }
チャートがパネルと一緒に移動しないようにするため、マウス、右クリックメニュー、および十字線を使用してチャートをスクロールするイベントは無効になります。ヘッダーはマウスのキャプチャに視覚的に反応する必要があるため、色が暗くなります。新しい色に変更する前に、すでに変更されているかどうかを確認する必要があります。常に同じものに変更しても、CPUリソースが無駄になります。移動が無効になっていない(パネルが固定されていない)場合は、マウス座標からパネルの左上隅に対するカーソル位置の移動を差し引いた値から計算された新しい座標に移動します。シフトを考慮しない場合、パネルは左上隅のカーソル座標に正確に配置されます。
パネルを指定した座標に移動するメソッド
//+------------------------------------------------------------------+
//| Move the panel                                                   |
//+------------------------------------------------------------------+
void CDashboard::Move(int x,int y)
  {
   int h=this.m_canvas.Height();
   int w=this.m_canvas.Width();
   if(!this.m_wider_wnd)
     {
      if(x+w>this.m_chart_w-1)
         x=this.m_chart_w-w-1;
      if(x<1)
         x=1;
     }
   else
     {
      if(x>1)
         x=1;
      if(x<this.m_chart_w-w-1)
         x=this.m_chart_w-w-1;
     }
   if(!this.m_higher_wnd)
     {
      if(y+h>this.m_chart_h-2)
         y=this.m_chart_h-h-2;
      if(y<1)
         y=1;
     }
   else
     {
      if(y>1)
         y=1;
      if(y<this.m_chart_h-h-2)
         y=this.m_chart_h-h-2;
     }
   if(this.SetCoords(x,y))
      this.m_canvas.Update();
  }
パネルの移動先の座標がメソッドに渡されます。座標を変更するときにパネルがチャートの外側に出た場合、パネルが常にチャートウィンドウの内側の端から1ピクセルだけインデントされるように座標が調整されます。パネル座標のすべてのチェックと調整が完了すると、チャート上のその位置の新しい座標が確立されます。
パネル座標を設定するメソッド
//+------------------------------------------------------------------+
//| Set the panel X coordinate                                       |
//+------------------------------------------------------------------+
bool CDashboard::SetCoordX(const int coord_x)
  {
   int x=(int)::ObjectGetInteger(this.m_chart_id,this.m_canvas.ChartObjectName(),OBJPROP_XDISTANCE);
   if(x==coord_x)
      return true;
   if(!::ObjectSetInteger(this.m_chart_id,this.m_canvas.ChartObjectName(),OBJPROP_XDISTANCE,coord_x))
      return false;
   if(!::ObjectSetInteger(this.m_chart_id,this.m_workspace.ChartObjectName(),OBJPROP_XDISTANCE,coord_x+1))
      return false;
   this.m_x=coord_x;
   return true;
  }
//+------------------------------------------------------------------+
//| Set the panel Y coordinate                                       |
//+------------------------------------------------------------------+
bool CDashboard::SetCoordY(const int coord_y)
  {
   int y=(int)::ObjectGetInteger(this.m_chart_id,this.m_canvas.ChartObjectName(),OBJPROP_YDISTANCE);
   if(y==coord_y)
      return true;
   if(!::ObjectSetInteger(this.m_chart_id,this.m_canvas.ChartObjectName(),OBJPROP_YDISTANCE,coord_y))
      return false;
   if(!::ObjectSetInteger(this.m_chart_id,this.m_workspace.ChartObjectName(),OBJPROP_YDISTANCE,coord_y+this.m_header_h))
      return false;
   this.m_y=coord_y;
   return true;
  }
パネルの座標と同じ座標がメソッドに渡された場合、それを再度設定する必要はありません。メソッドの成功が返されるだけです。まずキャンバスが移動し、続いて作業スペースが移動します。作業スペースは、キャンバス上の相対的な位置(パネル内の1ピクセル分左側、上部にヘッダーの高さ)を考慮して移動されます。
パネル寸法を設定するメソッド
//+------------------------------------------------------------------+
//| Set the panel width                                              |
//+------------------------------------------------------------------+
bool CDashboard::SetWidth(const int width,const bool redraw=false)
  {
   if(width<4)
     {
      ::PrintFormat("%s: Error. Width cannot be less than 4px",(string)__FUNCTION__);
      return false;
     }
   if(width==this.m_canvas.Width())
      return true;
   if(!this.m_canvas.Resize(width,this.m_canvas.Height()))
      return false;
   if(width-2<1)
      ::ObjectSetInteger(this.m_chart_id,this.m_workspace.ChartObjectName(),OBJPROP_TIMEFRAMES,OBJ_NO_PERIODS);
   else
     {
      ::ObjectSetInteger(this.m_chart_id,this.m_workspace.ChartObjectName(),OBJPROP_TIMEFRAMES,OBJ_ALL_PERIODS);
      if(!this.m_workspace.Resize(width-2,this.m_workspace.Height()))
         return false;
     }
   this.m_w=width;
   return true;
  }
//+------------------------------------------------------------------+
//| Set the panel height                                             |
//+------------------------------------------------------------------+
bool CDashboard::SetHeight(const int height,const bool redraw=false)
  {
   if(height<::fmax(this.m_header_h,1))
     {
      ::PrintFormat("%s: Error. Width cannot be less than %lupx",(string)__FUNCTION__,::fmax(this.m_header_h,1));
      return false;
     }
   if(height==this.m_canvas.Height())
      return true;
   if(!this.m_canvas.Resize(this.m_canvas.Width(),height))
      return false;
   if(height-this.m_header_h-2<1)
      ::ObjectSetInteger(this.m_chart_id,this.m_workspace.ChartObjectName(),OBJPROP_TIMEFRAMES,OBJ_NO_PERIODS);
   else
     {
      ::ObjectSetInteger(this.m_chart_id,this.m_workspace.ChartObjectName(),OBJPROP_TIMEFRAMES,OBJ_ALL_PERIODS);
      if(!this.m_workspace.Resize(this.m_workspace.Width(),height-this.m_header_h-2))
         return false;
     }
   this.m_h=height;
   return true;
  }
ここでは、すべてが座標を設定するときとまったく同じです。メソッドに渡されたサイズがパネルがすでに持っているサイズと同じである場合、メソッドは単にtrueを返します。注目に値する詳細の1つは、作業スペースが常にキャンバスよりも小さいことです。作業スペースのサイズを縮小するときに、サイズが1未満になることが判明した場合、サイズ変更エラーを避けるために、作業スペースはサイズを変更せずに単純に非表示になります。
2つの座標、すべての寸法と座標、およびパネルの寸法を一度に設定する補助メソッド
//+------------------------------------------------------------------+
//| Set the panel coordinates                                        |
//+------------------------------------------------------------------+
bool CDashboard::SetCoords(const int x,const int y)
  {
   bool res=true;
   res &=this.SetCoordX(x);
   res &=this.SetCoordY(y);
   return res;
  }
//+------------------------------------------------------------------+
//| Set the panel size                                               |
//+------------------------------------------------------------------+
bool CDashboard::SetSizes(const int w,const int h,const bool update=false)
  {
   bool res=true;
   res &=this.SetWidth(w);
   res &=this.SetHeight(h);
   if(res && update)
      this.Expand();
   return res;
  }
//+------------------------------------------------------------------+
//| Set panel coordinates and size                                   |
//+------------------------------------------------------------------+
bool CDashboard::SetParams(const int x,const int y,const int w,const int h,const bool update=false)
  {
   bool res=true;
   res &=this.SetCoords(x,y);
   res &=this.SetSizes(w,h);
   if(res && update)
      this.Expand();
   return res;
  }
メソッドはパラメータと更新フラグを受け取ります。パラメータと更新フラグが正常に設定されると、パネル展開メソッドが呼び出され、すべてのパネル要素が再描画されます。
ヘッダー領域を描画するメソッド
//+------------------------------------------------------------------+
//| Draw the header area                                             |
//+------------------------------------------------------------------+
void CDashboard::DrawHeaderArea(const string title)
  {
//--- Exit if the header is not used
   if(!this.m_header)
      return;
//--- Set the title text
   this.m_title=title;
//--- The Y coordinate of the text is located vertically in the center of the header area
   int y=this.m_header_h/2;
//--- Fill the area with color
   this.m_canvas.FillRectangle(0,0,this.m_w-1,this.m_header_h-1,::ColorToARGB(this.m_header_back_color,this.m_header_alpha));
//--- Display the header text
   this.m_canvas.TextOut(2,y,this.m_title,::ColorToARGB(this.m_header_fore_color,this.m_header_alpha),TA_LEFT|TA_VCENTER);
//--- Save the current header background color
   this.m_header_back_color_c=this.m_header_back_color;
//--- Draw control elements (close, collapse/expand and pin buttons) and
   this.DrawButtonClose();
   this.DrawButtonMinimize();
   this.DrawButtonPin();
//--- update the canvas without redrawing the screen
   this.m_canvas.Update(false);
  }
このメソッドはヘッダー領域を描画します。ヘッダー座標で長方形の領域を描画し、コントロール(閉じるボタン、折りたたみ/展開ボタン、ピン留めボタン)を描画します。デフォルトのヘッダー領域の色と透明度が使用されます。
ヘッダー領域を再描画するメソッド
//+------------------------------------------------------------------+
//| Redraw header area                                               |
//+------------------------------------------------------------------+
void CDashboard::RedrawHeaderArea(const color new_color=clrNONE,const string title="",const color title_new_color=clrNONE,const ushort new_alpha=USHORT_MAX)
  {
//--- Exit if the header is not used or all passed parameters have default values
   if(!this.m_header || (new_color==clrNONE && title=="" && title_new_color==clrNONE && new_alpha==USHORT_MAX))
      return;
//--- Exit if all passed parameters are equal to those already set
   if(new_color==this.m_header_back_color && title==this.m_title && title_new_color==this.m_header_fore_color && new_alpha==this.m_header_alpha)
      return;
//--- If the title is not equal to the default value, set a new title
   if(title!="")
      this.m_title=title;
//--- Define new background and text colors, and transparency
   color back_clr=(new_color!=clrNONE ? new_color : this.m_header_back_color);
   color fore_clr=(title_new_color!=clrNONE ? title_new_color : this.m_header_fore_color);
   uchar alpha=uchar(new_alpha==USHORT_MAX ? this.m_header_alpha : new_alpha>255 ? 255 : new_alpha);
//--- The Y coordinate of the text is located vertically in the center of the header area
   int y=this.m_header_h/2;
//--- Fill the area with color
   this.m_canvas.FillRectangle(0,0,this.m_w-1,this.m_header_h-1,::ColorToARGB(back_clr,alpha));
//--- Display the header text
   this.m_canvas.TextOut(2,y,this.m_title,::ColorToARGB(fore_clr,alpha),TA_LEFT|TA_VCENTER);
//--- Save the current header background color, text and transparency
   this.m_header_back_color_c=back_clr;
   this.m_header_fore_color_c=fore_clr;
   this.m_header_alpha_c=alpha;
//--- Draw control elements (close, collapse/expand and pin buttons) and
   this.RedrawButtonClose(back_clr,clrNONE,alpha);
   this.RedrawButtonMinimize(back_clr,clrNONE,alpha);
   this.RedrawButtonPin(back_clr,clrNONE,alpha);
//--- update the canvas without redrawing the screen
   this.m_canvas.Update(true);
  }
新しい背景色、新しいヘッダーテキスト、新しいヘッダーテキストの色、および新しい透明度がメソッドに渡されます。渡されたパラメータがすでに設定されているパラメータと完全に同じである場合は、メソッドを終了します。このメソッドは、ヘッダーの色、テキスト、透明度を更新するために使用されます。
パネルフレームを描画するメソッド
//+------------------------------------------------------------------+
//| Draw the panel frame                                             |
//+------------------------------------------------------------------+
void CDashboard::DrawFrame(void)
  {
   this.m_canvas.Rectangle(0,0,this.m_w-1,this.m_h-1,::ColorToARGB(this.m_border_color,this.m_alpha));
   this.m_border_color_c=this.m_border_color;
   this.m_canvas.Update(false);
  }
キャンバスの周囲にフレームを描画し、設定した色を現在の色として保存します。
パネルを閉じるボタンを描画するメソッド
//+------------------------------------------------------------------+
//| Draws the panel close button                                     |
//+------------------------------------------------------------------+
void CDashboard::DrawButtonClose(void)
  {
//--- Exit if the button is not used
   if(!this.m_butt_close)
      return;
//--- The button width is equal to the height of the header area
   int w=this.m_header_h;
//--- Button coordinates and size
   int x1=this.m_w-w;
   int x2=this.m_w-1;
   int y1=0;
   int y2=w-1;
//--- Shift of the upper left corner of the rectangular area of the image from the upper left corner of the button
   int shift=4;
//--- Draw the button background
   this.m_canvas.FillRectangle(x1,y1,x2,y2,::ColorToARGB(this.m_butt_close_back_color,this.m_header_alpha));
//--- Draw the close button
   this.m_canvas.LineThick(x1+shift+1,y1+shift+1,x2-shift,y2-shift,::ColorToARGB(this.m_butt_close_fore_color,255),3,STYLE_SOLID,LINE_END_ROUND);
   this.m_canvas.LineThick(x1+shift+1,y2-shift-1,x2-shift,y1+shift,::ColorToARGB(this.m_butt_close_fore_color,255),3,STYLE_SOLID,LINE_END_ROUND);
//--- Remember the current background color and button design
   this.m_butt_close_back_color_c=this.m_butt_close_back_color;
   this.m_butt_close_fore_color_c=this.m_butt_close_fore_color;
//--- update the canvas without redrawing the screen
   this.m_canvas.Update(false);
  }
ロジック全体はコードコメントで説明されています。背景とその上に終了アイコン(十字)を描画します。
パネルを閉じるボタンを再描画するメソッド
//+------------------------------------------------------------------+
//| Redraw the panel close button                                    |
//+------------------------------------------------------------------+
void CDashboard::RedrawButtonClose(const color new_back_color=clrNONE,const color new_fore_color=clrNONE,const ushort new_alpha=USHORT_MAX)
  {
//--- Exit if the button is not used or all passed parameters have default values
   if(!this.m_butt_close || (new_back_color==clrNONE && new_fore_color==clrNONE && new_alpha==USHORT_MAX))
      return;
//--- The button width is equal to the height of the header area
   int w=this.m_header_h;
//--- Button coordinates and size
   int x1=this.m_w-w;
   int x2=this.m_w-1;
   int y1=0;
   int y2=w-1;
//--- Shift of the upper left corner of the rectangular area of the image from the upper left corner of the button
   int shift=4;
//--- Define new background and text colors, and transparency
   color back_color=(new_back_color!=clrNONE ? new_back_color : this.m_butt_close_back_color);
   color fore_color=(new_fore_color!=clrNONE ? new_fore_color : this.m_butt_close_fore_color);
   uchar alpha=uchar(new_alpha==USHORT_MAX ? this.m_header_alpha : new_alpha>255 ? 255 : new_alpha);
//--- Draw the button background
   this.m_canvas.FillRectangle(x1,y1,x2,y2,::ColorToARGB(back_color,alpha));
//--- Draw the close button
   this.m_canvas.LineThick(x1+shift+1,y1+shift+1,x2-shift,y2-shift,::ColorToARGB(fore_color,255),3,STYLE_SOLID,LINE_END_ROUND);
   this.m_canvas.LineThick(x1+shift+1,y2-shift-1,x2-shift,y1+shift,::ColorToARGB(fore_color,255),3,STYLE_SOLID,LINE_END_ROUND);
//--- Remember the current background color and button design
   this.m_butt_close_back_color_c=back_color;
   this.m_butt_close_fore_color_c=fore_color;
//--- update the canvas without redrawing the screen
   this.m_canvas.Update(false);
  }
再描画するには、渡されたパラメータの少なくとも1つが現在のパラメータと異なる必要があります。新しい描画パラメータの選択と設定を除いて、残りはボタンの描画メソッドと同じです。
折りたたみ/展開ボタンと固定ボタンを描画および再描画するためのその他のメソッド
//+------------------------------------------------------------------+
//| Draw the panel collapse/expand button                            |
//+------------------------------------------------------------------+
void CDashboard::DrawButtonMinimize(void)
  {
//--- Exit if the button is not used
   if(!this.m_butt_minimize)
      return;
//--- The button width is equal to the height of the header area
   int w=this.m_header_h;
//--- The width of the close button is zero if the button is not used
   int wc=(this.m_butt_close ? w : 0);
//--- Button coordinates and size
   int x1=this.m_w-wc-w;
   int x2=this.m_w-wc-1;
   int y1=0;
   int y2=w-1;
//--- Shift of the upper left corner of the rectangular area of the image from the upper left corner of the button
   int shift=4;
//--- Draw the button background
   this.m_canvas.FillRectangle(x1,y1,x2,y2,::ColorToARGB(this.m_butt_min_back_color,this.m_header_alpha));
//--- If the panel is collapsed, draw a rectangle
   if(this.m_minimized)
      this.m_canvas.Rectangle(x1+shift,y1+shift,x2-shift,y2-shift,::ColorToARGB(this.m_butt_min_fore_color,255));
//--- Otherwise, the panel is expanded. Draw a line segment
   else
      this.m_canvas.LineThick(x1+shift,y2-shift,x2-shift,y2-shift,::ColorToARGB(this.m_butt_min_fore_color,255),3,STYLE_SOLID,LINE_END_ROUND);
//--- Remember the current background color and button design
   this.m_butt_min_back_color_c=this.m_butt_min_back_color;
   this.m_butt_min_fore_color_c=this.m_butt_min_fore_color;
//--- update the canvas without redrawing the screen
   this.m_canvas.Update(false);
  }
//+------------------------------------------------------------------+
//| Redraw the panel collapse/expand button                          |
//+------------------------------------------------------------------+
void CDashboard::RedrawButtonMinimize(const color new_back_color=clrNONE,const color new_fore_color=clrNONE,const ushort new_alpha=USHORT_MAX)
  {
//--- Exit if the button is not used or all passed parameters have default values
   if(!this.m_butt_minimize || (new_back_color==clrNONE && new_fore_color==clrNONE && new_alpha==USHORT_MAX))
      return;
//--- The button width is equal to the height of the header area
   int w=this.m_header_h;
//--- The width of the close button is zero if the button is not used
   int wc=(this.m_butt_close ? w : 0);
//--- Button coordinates and size
   int x1=this.m_w-wc-w;
   int x2=this.m_w-wc-1;
   int y1=0;
   int y2=w-1;
//--- Shift of the upper left corner of the rectangular area of the image from the upper left corner of the button
   int shift=4;
//--- Define new background and text colors, and transparency
   color back_color=(new_back_color!=clrNONE ? new_back_color : this.m_butt_min_back_color);
   color fore_color=(new_fore_color!=clrNONE ? new_fore_color : this.m_butt_min_fore_color);
   uchar alpha=uchar(new_alpha==USHORT_MAX ? this.m_header_alpha : new_alpha>255 ? 255 : new_alpha);
//--- Draw the button background
   this.m_canvas.FillRectangle(x1,y1,x2,y2,::ColorToARGB(back_color,alpha));
//--- If the panel is collapsed, draw a rectangle
   if(this.m_minimized)
      this.m_canvas.Rectangle(x1+shift,y1+shift,x2-shift,y2-shift,::ColorToARGB(fore_color,255));
//--- Otherwise, the panel is expanded. Draw a line segment
   else
      this.m_canvas.LineThick(x1+shift,y2-shift,x2-shift,y2-shift,::ColorToARGB(fore_color,255),3,STYLE_SOLID,LINE_END_ROUND);
//--- Remember the current background color and button design
   this.m_butt_min_back_color_c=back_color;
   this.m_butt_min_fore_color_c=fore_color;
//--- update the canvas without redrawing the screen
   this.m_canvas.Update(false);
  }
//+------------------------------------------------------------------+
//| Draw the panel pin button                                        |
//+------------------------------------------------------------------+
void CDashboard::DrawButtonPin(void)
  {
//--- Exit if the button is not used
   if(!this.m_butt_pin)
      return;
//--- The button width is equal to the height of the header area
   int w=this.m_header_h;
//--- The width of the close and collapse buttons is zero if the button is not used
   int wc=(this.m_butt_close ? w : 0);
   int wm=(this.m_butt_minimize ? w : 0);
//--- Button coordinates and size
   int x1=this.m_w-wc-wm-w;
   int x2=this.m_w-wc-wm-1;
   int y1=0;
   int y2=w-1;
//--- Draw the button background
   this.m_canvas.FillRectangle(x1,y1,x2,y2,::ColorToARGB(this.m_butt_pin_back_color,this.m_header_alpha));
//--- Coordinates of the broken line points
   int x[]={x1+3, x1+6, x1+3,x1+4,x1+6,x1+9,x1+9,x1+10,x1+15,x1+14,x1+13,x1+10,x1+10,x1+9,x1+6};
   int y[]={y1+14,y1+11,y1+8,y1+7,y1+7,y1+4,y1+3,y1+2, y1+7, y1+8, y1+8, y1+11,y1+13,y1+14,y1+11};
//--- Draw the "button" shape
   this.m_canvas.Polygon(x,y,::ColorToARGB(this.m_butt_pin_fore_color,255));
//--- If the movability flag is reset (pinned) - cross out the drawn button
   if(!this.m_movable)
      this.m_canvas.Line(x1+3,y1+2,x1+15,y1+14,::ColorToARGB(this.m_butt_pin_fore_color,255));
//--- Remember the current background color and button design
   this.m_butt_pin_back_color_c=this.m_butt_pin_back_color;
   this.m_butt_pin_fore_color_c=this.m_butt_pin_fore_color;
//--- update the canvas without redrawing the screen
   this.m_canvas.Update(false);
  }
//+------------------------------------------------------------------+
//| Redraw the panel pin button                                      |
//+------------------------------------------------------------------+
void CDashboard::RedrawButtonPin(const color new_back_color=clrNONE,const color new_fore_color=clrNONE,const ushort new_alpha=USHORT_MAX)
  {
//--- Exit if the button is not used or all passed parameters have default values
   if(!this.m_butt_pin || (new_back_color==clrNONE && new_fore_color==clrNONE && new_alpha==USHORT_MAX))
      return;
//--- The button width is equal to the height of the header area
   int w=this.m_header_h;
//--- The width of the close and collapse buttons is zero if the button is not used
   int wc=(this.m_butt_close ? w : 0);
   int wm=(this.m_butt_minimize ? w : 0);
//--- Button coordinates and size
   int x1=this.m_w-wc-wm-w;
   int x2=this.m_w-wc-wm-1;
   int y1=0;
   int y2=w-1;
//--- Define new background and text colors, and transparency
   color back_color=(new_back_color!=clrNONE ? new_back_color : this.m_butt_pin_back_color);
   color fore_color=(new_fore_color!=clrNONE ? new_fore_color : this.m_butt_pin_fore_color);
   uchar alpha=uchar(new_alpha==USHORT_MAX ? this.m_header_alpha : new_alpha>255 ? 255 : new_alpha);
//--- Draw the button background
   this.m_canvas.FillRectangle(x1,y1,x2,y2,::ColorToARGB(back_color,alpha));
//--- Coordinates of the broken line points
   int x[]={x1+3, x1+6, x1+3,x1+4,x1+6,x1+9,x1+9,x1+10,x1+15,x1+14,x1+13,x1+10,x1+10,x1+9,x1+6};
   int y[]={y1+14,y1+11,y1+8,y1+7,y1+7,y1+4,y1+3,y1+2, y1+7, y1+8, y1+8, y1+11,y1+13,y1+14,y1+11};
//--- Draw the "button" shape
   this.m_canvas.Polygon(x,y,::ColorToARGB(this.m_butt_pin_fore_color,255));
//--- If the movability flag is reset (pinned) - cross out the drawn button
   if(!this.m_movable)
      this.m_canvas.Line(x1+3,y1+2,x1+15,y1+14,::ColorToARGB(this.m_butt_pin_fore_color,255));
//--- Remember the current background color and button design
   this.m_butt_pin_back_color_c=back_color;
   this.m_butt_pin_fore_color_c=fore_color;
//--- update the canvas without redrawing the screen
   this.m_canvas.Update(false);
  }
これらのメソッドは、閉じるボタンを描画および再描画するメソッドと同じです。ロジックはまったく同じで、コードのコメントに書かれています。
パネルを描画するメソッド
//+------------------------------------------------------------------+
//| Draw the panel                                                   |
//+------------------------------------------------------------------+
void CDashboard::Draw(const string title)
  {
//--- Set the title text
   this.m_title=title;
//--- If the collapse flag is not set, expand the panel
   if(!this.m_minimized)
      this.Expand();
//--- Otherwise, collapse the panel
   else
      this.Collapse();
//--- Update the canvas without redrawing the chart
   this.m_canvas.Update(false);
//--- Update the working space and redraw the chart
   this.m_workspace.Update();
  }
折りたたみフラグが設定されていない場合は、パネルを展開します(展開された形式で描画します)。折りたたみフラグが設定されている場合は、パネルを折りたたみます。ヘッダーのみを残して、折りたたまれた形式でパネルを描画します。
パネルを折りたたむメソッド
//+------------------------------------------------------------------+
//| Collapse the panel                                               |
//+------------------------------------------------------------------+
void CDashboard::Collapse(void)
  {
//--- Save the pixels of the working space and the panel background into arrays
   this.SaveWorkspace();
   this.SaveBackground();
//--- Remember the current height of the panel
   int h=this.m_h;
//--- Change the dimensions (height) of the canvas and working space
   if(!this.SetSizes(this.m_canvas.Width(),this.m_header_h))
      return;
//--- Draw the header area
   this.DrawHeaderArea(this.m_title);
//--- Return the saved panel height to the variable
   this.m_h=h;
  }
パネルを折りたたむ前に、背景と作業スペースのすべてのピクセルを配列に保存する必要があります。これは、新たにパネルを描画するのではなく、ピクセル配列からパネルイメージと作業スペースを単純に復元するだけで、パネルを迅速に拡張するために必要です。さらに、パネルの背景に対して追加の装飾を描画することもできます(ネームプレートなど)。また、背景とともに保存され、復元されます。
パネルを展開するメソッド
//+------------------------------------------------------------------+
//| Expand the panel                                                 |
//+------------------------------------------------------------------+
void CDashboard::Expand(void)
  {
//--- Resize the panel
   if(!this.SetSizes(this.m_canvas.Width(),this.m_h))
      return;
//--- If the panel background pixels have never been saved into an array
   if(this.m_array_ppx.Size()==0)
     {
      //--- Draw the panel and
      this.m_canvas.Erase(::ColorToARGB(this.m_back_color,this.m_alpha));
      this.DrawFrame();
      this.DrawHeaderArea(this.m_title);
      //--- save the background pixels of the panel and working space into arrays
      this.SaveWorkspace();
      this.SaveBackground();
     }
//--- If the background pixels of the panel and working space were previously saved,
   else
     {
      //--- restore the background pixels of the panel and working space from arrays
      this.RestoreBackground();
      if(this.m_array_wpx.Size()>0)
         this.RestoreWorkspace();
     }
//--- If, after expanding, the panel goes beyond the chart window, adjust the panel location
   if(this.m_y+this.m_canvas.Height()>this.m_chart_h-1)
      this.Move(this.m_x,this.m_chart_h-1-this.m_canvas.Height());
  }
背景と作業領域のピクセルが保存されている配列が空の場合は、描画メソッドを使用してパネル全体を描画します。配列がすでに埋められている場合は、パネルの背景とその作業スペースを配列から復元するだけです。
色を操作するための補助メソッド
//+------------------------------------------------------------------+
//| Returns color with a new color component                         |
//+------------------------------------------------------------------+
color CDashboard::NewColor(color base_color, int shift_red, int shift_green, int shift_blue)
  {
   double clR=0, clG=0, clB=0;
   this.ColorToRGB(base_color,clR,clG,clB);
   double clRn=(clR+shift_red  < 0 ? 0 : clR+shift_red  > 255 ? 255 : clR+shift_red);
   double clGn=(clG+shift_green< 0 ? 0 : clG+shift_green> 255 ? 255 : clG+shift_green);
   double clBn=(clB+shift_blue < 0 ? 0 : clB+shift_blue > 255 ? 255 : clB+shift_blue);
   return this.RGBToColor(clRn,clGn,clBn);
  }
//+------------------------------------------------------------------+
//| Convert RGB to color                                             |
//+------------------------------------------------------------------+
color CDashboard::RGBToColor(const double r,const double g,const double b) const
  {
   int int_r=(int)::round(r);
   int int_g=(int)::round(g);
   int int_b=(int)::round(b);
   int clr=0;
   clr=int_b;
   clr<<=8;
   clr|=int_g;
   clr<<=8;
   clr|=int_r;
//---
   return (color)clr;
  }
//+------------------------------------------------------------------+
//| Getting values of the RGB components                             |
//+------------------------------------------------------------------+
void CDashboard::ColorToRGB(const color clr,double &r,double &g,double &b)
  {
   r=GetR(clr);
   g=GetG(clr);
   b=GetB(clr);
  }
これらのメソッドは、カーソルがパネルコントロールと対話するときに色を変更するために必要です。
ヘッダーの透明度を設定するメソッド
//+------------------------------------------------------------------+
//| Set the header transparency                                      |
//+------------------------------------------------------------------+
void CDashboard::SetHeaderTransparency(const uchar value)
  {
   this.m_header_alpha=value;
   if(this.m_header_alpha_c!=this.m_header_alpha)
      this.RedrawHeaderArea(clrNONE,NULL,clrNONE,value);
   this.m_header_alpha_c=value;
  }
まず、メソッドに渡された透明度の値が、デフォルトの透明度を格納する変数に書き込まれ、その後、新しい値が現在の値と比較されます。値が等しくない場合、ヘッダー領域は完全に再描画されます。最後に、設定された透明度が現在の透明度に書き込まれます。
パネルの透明度を設定するメソッド
//+------------------------------------------------------------------+
//| Set the panel transparency                                       |
//+------------------------------------------------------------------+
void CDashboard::SetTransparency(const uchar value)
  {
   this.m_alpha=value;
   if(this.m_alpha_c!=this.m_alpha)
     {
      this.m_canvas.Erase(::ColorToARGB(this.m_back_color,value));
      this.DrawFrame();
      this.RedrawHeaderArea(clrNONE,NULL,clrNONE,value);
      this.m_canvas.Update(false);
     }
   this.m_alpha_c=value;
  }
ロジックは上記のメソッドと似ています。メソッドに渡された透明度が現在の透明度と等しくない場合、パネルは新しい透明度で完全に再描画されます。
作業スペースのデフォルトのフォントパラメータを設定するメソッド
//+------------------------------------------------------------------+
//| Set the default font parameters of the working space             |
//+------------------------------------------------------------------+
void CDashboard::SetFontParams(const string name,const int size,const uint flags=0,const uint angle=0)
  {
   if(!this.m_workspace.FontSet(name,size*-10,flags,angle))
     {
      ::PrintFormat("%s: Failed to set font options. Error %lu",(string)__FUNCTION__,::GetLastError());
      return;
     }
   this.m_font=name;
   this.m_font_size=size*-10;
  }
メソッドに渡されるフォントパラメータ(フォント名、サイズ、フラグ、角度)は、ワークスペースのCCanvasオブジェクトに設定され、変数に格納されます。
メソッドに渡されるフォントサイズは、TextSetFont関数の注記で説明されている理由により-10倍されます。
フォントサイズは、正または負の値を使用して設定されます。記号は、テキストサイズがオペレーティングシステムの設定(フォントスケール)に依存するかどうかを定義します。
- サイズが正の場合、論理フォントを物理フォントとして表示するときに、デバイスの物理単位(ピクセル)に変換されます。サイズは、使用可能なフォントの銘柄セルの高さに対応します。TextOut()関数を使用して表示されるテキストとOBJ_LABEL(「テキストラベル」)グラフィカルオブジェクトを使用して表示されるテキストを共有して使用する場合はお勧めしません。
- サイズが負の場合、論理ポイントの10分の1に設定されていると見なされ(値-350は35論理ポイントに等しい)、10で除算されます。結果の値は、デバイスの物理単位(ピクセル)に変換され、使用可能なフォントからの文字の高さの絶対値に対応します。画面上のOBJ_LABELオブジェクトサイズのテキストを取得するには、オブジェクトプロパティで指定されたフォントサイズに-10を掛けます。
チャートの操作モードを有効/無効にするメソッド
//+------------------------------------------------------------------+
//| Enable/disable modes of working with the chart                   |
//+------------------------------------------------------------------+
void CDashboard::SetChartsTool(const bool flag)
  {
//--- If the 'true' flag is passed and if chart scrolling is disabled
   if(flag && !::ChartGetInteger(this.m_chart_id,CHART_MOUSE_SCROLL))
     {
      //--- enable chart scrolling, right-click menu and crosshair
      ::ChartSetInteger(0,CHART_MOUSE_SCROLL,true);
      ::ChartSetInteger(0,CHART_CONTEXT_MENU,true);
      ::ChartSetInteger(0,CHART_CROSSHAIR_TOOL,true);
     }
//--- otherwise, if the 'false' flag is passed and if chart scrolling is enabled
   else if(!flag && ::ChartGetInteger(this.m_chart_id,CHART_MOUSE_SCROLL))
     {
      //--- disable chart scrolling, right-click menu and crosshair
      ::ChartSetInteger(0,CHART_MOUSE_SCROLL,false);
      ::ChartSetInteger(0,CHART_CONTEXT_MENU,false);
      ::ChartSetInteger(0,CHART_CROSSHAIR_TOOL,false);
     }
  }
渡されたフラグに応じて、メソッドはマウスによるチャートのスクロール状態をチェックし、チャートを操作するすべてのモードを有効にするか無効にします。カーソルがパネルウィンドウ内またはパネルウィンドウ外にあるときに、モードを設定するコマンドが常に送信されないようにするために、スクロールモードをチェックする必要があります。モードの切り替えは、カーソルがパネルに入ったとき、またはカーソルがその限界を出たときにのみおこなわれます。
指定された座標にテキストメッセージを出力するメソッド
//+------------------------------------------------------------------+
//| Display a text message at the specified coordinates              |
//+------------------------------------------------------------------+
void CDashboard::DrawText(const string text,const int x,const int y,const int width=WRONG_VALUE,const int height=WRONG_VALUE)
  {
//--- Declare variables to record the text width and height in them
   int w=width;
   int h=height;
//--- If the width and height of the text passed to the method have zero values,
//--- then the entire working space is completely cleared using the transparent color
   if(width==0 && height==0)
      this.m_workspace.Erase(0x00FFFFFF);
//--- Otherwise
   else
     {
      //--- If the passed width and height have default values (-1), we get its width and height from the text
      if(width==WRONG_VALUE && height==WRONG_VALUE)
         this.m_workspace.TextSize(text,w,h);
      //--- otherwise,
      else
        {
         //--- if the width passed to the method has the default value (-1) - get the width from the text, or
         //--- if the width passed to the method has a value greater than zero, use the width passed to the method, or
         //--- if the width passed to the method has a zero value, use the value 1 for the width
         w=(width ==WRONG_VALUE ? this.m_workspace.TextWidth(text)  : width>0  ? width  : 1);
         //--- if the height passed to the method has a default value (-1), get the height from the text, or
         //--- if the height passed to the method has a value greater than zero, use the height passed to the method, or
         //--- if the height passed to the method has a zero value, use value 1 for the height
         h=(height==WRONG_VALUE ? this.m_workspace.TextHeight(text) : height>0 ? height : 1);
        }
      //--- Fill the space according to the specified coordinates and the resulting width and height with a transparent color (erase the previous entry)
      this.m_workspace.FillRectangle(x,y,x+w,y+h,0x00FFFFFF);
     }
//--- Display the text to the space cleared of previous text and update the working space without redrawing the screen
   this.m_workspace.TextOut(x,y,text,::ColorToARGB(this.m_fore_color));
   this.m_workspace.Update(false);
  }
キャンバスにグラフィックを表示する場合のキャンバスの操作には、キャンバス上でブラシを使用するように、キャンバス上にグラフィックを描画することが含まれます。キャンバスに描かれた1つの画像は、最初に描かれた別の画像の上に配置されます。画像を置き換えるには、キャンバス全体を完全に再描画するか、前の画像の寸法を計算してこの領域を消去し、消去した領域に次の画像を描画する必要があります。
テキストの場合、次のテキストを描画する前にその領域を消去するために、キャンバス上にすでに描画されているテキストの寸法を取得できます。以前に描画したテキストや図形をすべてオブジェクト内のどこかに保存することは、決して最適な解決策ではありません。したがって、ここでは、最適性と組み合わせた精度と簡素性の間で選択がおこなわれます。ここでは、現在のテキストの寸法(この場所に以前に描画されたテキストの幅と一致しない可能性がある)を取得し、これらの寸法を使用して、次のテキストを表示する前に以前に描画したテキストを消去します。
前のテキストの幅が現在のテキストと同じでない場合、またはむしろ大きい場合は、そのすべてが消去されるわけではありません。このような場合、このメソッドでは、消去領域の必要な高さと幅の寸法を示すパラメータを渡すことができます。
- メソッドに渡された幅と高さの値が-1(デフォルト)の場合、現在のテキストの幅と高さに等しい領域が消去されます。
- ゼロが渡されると、作業スペース全体が完全に消去されます。
- ゼロより大きい幅または高さの値が渡された場合、これらの値がそれぞれ幅と高さに使用されます。
パネルクラスは、データを表形式で表示するように設計されています。パネルに表示されるデータの座標の計算とパネルの視覚的なデザインを容易にするために、テーブルセルの座標を計算するメソッドと、パネルの背景にネームプレートを(必要に応じて)描画するメソッドが2つ用意されています。
- 最初のメソッドは、渡されたデータ(パネル内のテーブルの初期X座標とY座標、行数、列数、行の高さ、列の幅)に基づいてテーブルセルの座標を計算します。テーブルのグリッド線と「交互」行の属性にカスタム独自の色を指定することもできます。
- 2番目のメソッドでは、行と列の数と、パネルの端からのテーブルのインデントの幅に応じて、行と列のサイズが自動的に計算されます。2番目のメソッドでは、テーブルのグリッド線と「交互」行の属性に独自の色を指定することもできます。
指定されたパラメータに基づいて背景グリッドを描画するメソッド
//+------------------------------------------------------------------+
//| Draw the background grid                                         |
//+------------------------------------------------------------------+
void CDashboard::DrawGrid(const uint x,const uint y,const uint rows,const uint columns,const uint row_size,const uint col_size,
                          const color line_color=clrNONE,bool alternating_color=true)
  {
//--- If the panel is collapsed, leave
   if(this.m_minimized)
      return;
//--- Clear all lists of the tabular data object (remove cells from rows and all rows)
   this.m_table_data.Clear();
//--- Line height cannot be less than 2
   int row_h=int(row_size<2 ? 2 : row_size);
//--- Column width cannot be less than 2
   int col_w=int(col_size<2 ? 2 : col_size);

//--- The X1 (left) coordinate of the table cannot be less than 1 (to leave one pixel around the perimeter of the panel for the frame)
   int x1=int(x<1 ? 1 : x);
//--- Calculate the X2 coordinate (right) depending on the number of columns and their width
   int x2=x1+col_w*int(columns>0 ? columns : 1);
//--- The Y1 coordinate is located under the panel title area
   int y1=this.m_header_h+(int)y;
//--- Calculate the Y2 coordinate (bottom) depending on the number of lines and their height
   int y2=y1+row_h*int(rows>0 ? rows : 1);

//--- Get the color of the table grid lines, either by default or passed to the method
   color clr=(line_color==clrNONE ? C'200,200,200' : line_color);
//--- If the initial X coordinate is greater than 1, draw a table frame
//--- (in case of the coordinate 1, the table frame is the panel frame)
   if(x1>1)
      this.m_canvas.Rectangle(x1,y1,x2,y2,::ColorToARGB(clr,this.m_alpha));
//--- In the loop by table rows,
   for(int i=0;i<(int)rows;i++)
     {
      //--- calculate the Y coordinate of the next horizontal grid line (Y coordinate of the next table row)
      int row_y=y1+row_h*i;
      //--- if the flag of "alternating" line colors is passed and the line is even
      if(alternating_color && i%2==0)
        {
         //--- lighten the table background color and draw a background rectangle
         color new_color=this.NewColor(clr,45,45,45);
         this.m_canvas.FillRectangle(x1+1,row_y+1,x2-1,row_y+row_h-1,::ColorToARGB(new_color,this.m_alpha));
        }
      //--- Draw a table grid horizontal line
      this.m_canvas.Line(x1,row_y,x2,row_y,::ColorToARGB(clr,this.m_alpha));

      //--- Create a new table row object
      CTableRow *row_obj=new CTableRow(i);
      if(row_obj==NULL)
        {
         ::PrintFormat("%s: Failed to create table row object at index %lu",(string)__FUNCTION__,i);
         continue;
        }
      //--- Add it to the list of rows of the tabular data object
      //--- (if adding an object failed, delete the created object)
      if(!this.m_table_data.AddRow(row_obj))
         delete row_obj;
      //--- Set its Y coordinate in the created row object taking into account the offset from the panel title
      row_obj.SetY(row_y-this.m_header_h);
     }
//--- In the loop by table columns,
   for(int i=0;i<(int)columns;i++)
     {
      //--- calculate the X coordinate of the next vertical grid line (X coordinate of the next table row)
      int col_x=x1+col_w*i;
      //--- If the grid line goes beyond the panel, interrupt the loop
      if(x1==1 && col_x>=x1+m_canvas.Width()-2)
         break;
      //--- Draw a vertical line of the table grid
      this.m_canvas.Line(col_x,y1,col_x,y2,::ColorToARGB(clr,this.m_alpha));

      //--- Get the number of created rows from the table data object
      int total=this.m_table_data.RowsTotal();
      //--- In the loop by table rows
      for(int j=0;j<total;j++)
        {
         //--- get the next row
         CTableRow *row=m_table_data.GetRow(j);
         if(row==NULL)
            continue;
         //--- Create a new table cell
         CTableCell *cell=new CTableCell(row.Row(),i);
         if(cell==NULL)
           {
            ::PrintFormat("%s: Failed to create table cell object at index %lu",(string)__FUNCTION__,i);
            continue;
           }
         //--- Add the created cell to the row
         //--- (if adding an object failed, delete the created object)
         if(!row.AddCell(cell))
           {
            delete cell;
            continue;
           }
         //--- In the created cell object, set its X coordinate and the Y coordinate from the row object
         cell.SetXY(col_x,row.Y());
        }
     }
//--- Update the canvas without redrawing the chart
   this.m_canvas.Update(false);
  }
メソッドのロジックと、テーブルを描画し、表形式のデータオブジェクト内にそのインスタンスを作成するシーケンスは、コードのほぼすべての行の下に詳細に記述されています。表形式データオブジェクト内の描画されたテーブルのインスタンスに書き込まれるデータは、各セルの座標を取得するために必要となるため、データをパネルに表示するときに必要な座標を指定すると便利です。テーブル内の位置(行と列)でセル番号を指定し、パネル上のこのセルの左上隅の座標を取得するだけです。
自動セルサイズで背景グリッドを描画するメソッド
//+------------------------------------------------------------------+
//| Draws the background grid with automatic cell sizing             |
//+------------------------------------------------------------------+
void CDashboard::DrawGridAutoFill(const uint border,const uint rows,const uint columns,const color line_color=clrNONE,bool alternating_color=true)
  {
//--- If the panel is collapsed, leave
   if(this.m_minimized)
      return;
//--- X1 (left) table coordinate
   int x1=(int)border;
//--- X2 (right) table coordinate
   int x2=this.m_canvas.Width()-(int)border-1;
//--- Y1 (upper) table coordinate
   int y1=this.m_header_h+(int)border;
//--- Y2 (lower) table coordinate
   int y2=this.m_canvas.Height()-(int)border-1;

//--- Get the color of the table grid lines, either by default or passed to the method
   color clr=(line_color==clrNONE ? C'200,200,200' : line_color);
//--- If the offset from the edge of the panel is greater than zero, draw a table border,
//--- otherwise, the panel border is used as the table border
   if(border>0)
      this.m_canvas.Rectangle(x1,y1,x2,y2,::ColorToARGB(clr,this.m_alpha));

//--- Height of the entire table grid
   int greed_h=y2-y1;
//--- Calculate the row height depending on the table height and the number of rows
   int row_h=(int)::round((double)greed_h/(double)rows);
//--- In the loop based on the number of rows
   for(int i=0;i<(int)rows;i++)
     {
      //--- calculate the Y coordinate of the next horizontal grid line (Y coordinate of the next table row)
      int row_y=y1+row_h*i;
      //--- if the flag of "alternating" line colors is passed and the line is even
      if(alternating_color && i%2==0)
        {
         //--- lighten the table background color and draw a background rectangle
         color new_color=this.NewColor(clr,45,45,45);
         this.m_canvas.FillRectangle(x1+1,row_y+1,x2-1,row_y+row_h-1,::ColorToARGB(new_color,this.m_alpha));
        }
      //--- Draw a table grid horizontal line
      this.m_canvas.Line(x1,row_y,x2,row_y,::ColorToARGB(clr,this.m_alpha));

      //--- Create a new table row object
      CTableRow *row_obj=new CTableRow(i);
      if(row_obj==NULL)
        {
         ::PrintFormat("%s: Failed to create table row object at index %lu",(string)__FUNCTION__,i);
         continue;
        }
      //--- Add it to the list of rows of the tabular data object
      //--- (if adding an object failed, delete the created object)
      if(!this.m_table_data.AddRow(row_obj))
         delete row_obj;
      //--- Set its Y coordinate in the created row object taking into account the offset from the panel title
      row_obj.SetY(row_y-this.m_header_h);
     }

//--- Table grid width
   int greed_w=x2-x1;
//--- Calculate the column width depending on the table width and the number of columns
   int col_w=(int)::round((double)greed_w/(double)columns);
//--- In the loop by table columns,
   for(int i=0;i<(int)columns;i++)
     {
      //--- calculate the X coordinate of the next vertical grid line (X coordinate of the next table row)
      int col_x=x1+col_w*i;
      //--- If this is not the very first vertical line, draw it
      //--- (the first vertical line is either the table frame or the panel frame)
      if(i>0)
         this.m_canvas.Line(col_x,y1,col_x,y2,::ColorToARGB(clr,this.m_alpha));

      //--- Get the number of created rows from the table data object
      int total=this.m_table_data.RowsTotal();
      //--- In the loop by table rows
      for(int j=0;j<total;j++)
        {
         //--- get the next row
         CTableRow *row=this.m_table_data.GetRow(j);
         if(row==NULL)
            continue;
         //--- Create a new table cell
         CTableCell *cell=new CTableCell(row.Row(),i);
         if(cell==NULL)
           {
            ::PrintFormat("%s: Failed to create table cell object at index %lu",(string)__FUNCTION__,i);
            continue;
           }
         //--- Add the created cell to the row
         //--- (if adding an object failed, delete the created object)
         if(!row.AddCell(cell))
           {
            delete cell;
            continue;
           }
         //--- In the created cell object, set its X coordinate and the Y coordinate from the row object
         cell.SetXY(col_x,row.Y());
        }
     }
//--- Update the canvas without redrawing the chart
   this.m_canvas.Update(false);
  }
このメソッドは、パネルの端からのテーブルのインデント、行の高さ(テーブルの高さ/行数)、および列の幅(テーブルの幅/列数)に応じてテーブルの幅と高さを自動計算する点のみが上記のメソッドと異なります。また、コード内で直接完全にコメント化されています。
この銘板はパネルを作成し、チャート上に描画した後に作成(パネルへの描画)する必要があります。そうしないと、銘板は描画されませんが、表形式のデータはすべて計算され、使用できます。つまり、チャート上にパネルを表示した後にテーブルを描画する必要があるのは、パネル上にテーブルを描画する必要がある場合のみです。
パネルと作業スペースの背景を迅速に復元するために、パネルが折りたたまれる前に、作業スペースとパネルの画像からピクセルを受け取る配列を使用します。パネルを拡張する場合、パネル上に以前に描画されたものをすべて再描画するのではなく、パネルの背景と作業スペースがピクセルの配列から単純に復元されます。これは、後で再描画するためにキャンバスに描画されたすべてを保存するよりもはるかに実用的です。
パネルと作業スペースには2つのメソッドがあります。ピクセル配列に画像を保存するメソッドと、ピクセル配列から画像を復元するメソッドです。
作業スペースをピクセルの配列に保存するメソッド
//+------------------------------------------------------------------+
//| Save the working space to the array of pixels                    |
//+------------------------------------------------------------------+
void CDashboard::SaveWorkspace(void)
  {
//--- Calculate the required size of the array (width * height of the working space)
   uint size=this.m_workspace.Width()*this.m_workspace.Height();
//--- If the size of the array is not equal to the calculated one, change it
   if(this.m_array_wpx.Size()!=size)
     {
      ::ResetLastError();
      if(::ArrayResize(this.m_array_wpx,size)!=size)
        {
         ::PrintFormat("%s: ArrayResize failed. Error %lu",(string)__FUNCTION__,::GetLastError());
         return;
        }
     }
   uint n=0;
//--- In the loop along the height of the working space (pixel Y coordinate)
   for(int y=0;y<this.m_workspace.Height();y++)
      //--- in the loop by the working space width (pixel X coordinate)
      for(int x=0;x<this.m_workspace.Width();x++)
        {
         //--- calculate the pixel index in the receiving array
         n=this.m_workspace.Width()*y+x;
         if(n>this.m_array_wpx.Size()-1)
            break;
         //--- copy pixel to the receiving array from the working space X and Y
         this.m_array_wpx[n]=this.m_workspace.PixelGet(x,y);
        }
  }
2つのネストされたループで各画像ラインの各ピクセルを調べ、受信配列にコピーします。
ピクセルの配列から作業スペースを復元するメソッド
//+------------------------------------------------------------------+
//| Restore the working space from the array of pixels               |
//+------------------------------------------------------------------+
void CDashboard::RestoreWorkspace(void)
  {
//--- Exit if the array is empty
   if(this.m_array_wpx.Size()==0)
      return;
   uint n=0;
//--- In the loop along the height of the working space (pixel Y coordinate)
   for(int y=0;y<this.m_workspace.Height();y++)
      //--- in the loop by the working space width (pixel X coordinate)
      for(int x=0;x<this.m_workspace.Width();x++)
        {
         //--- calculate the pixel index in the array
         n=this.m_workspace.Width()*y+x;
         if(n>this.m_array_wpx.Size()-1)
            break;
         //--- copy the pixel from the array to the X and Y coordinates of the working space
         this.m_workspace.PixelSet(x,y,this.m_array_wpx[n]);
        }
  }
2つのネストされたループで、配列内の各画像ラインの各ピクセルのインデックスを計算し、それらを配列から画像のX座標とY座標にコピーします。
パネルの背景をピクセルの配列に保存するメソッド
//+------------------------------------------------------------------+
//| Save the panel background to the pixel array                     |
//+------------------------------------------------------------------+
void CDashboard::SaveBackground(void)
  {
//--- Calculate the required size of the array (panel width * height)
   uint size=this.m_canvas.Width()*this.m_canvas.Height();
//--- If the size of the array is not equal to the calculated one, change it
   if(this.m_array_ppx.Size()!=size)
     {
      ::ResetLastError();
      if(::ArrayResize(this.m_array_ppx,size)!=size)
        {
         ::PrintFormat("%s: ArrayResize failed. Error %lu",(string)__FUNCTION__,::GetLastError());
         return;
        }
     }
   uint n=0;
//--- In the loop by the panel height (pixel Y coordinate)
   for(int y=0;y<this.m_canvas.Height();y++)
      //--- in the loop by the panel width (pixel X coordinate)
      for(int x=0;x<this.m_canvas.Width();x++)
        {
         //--- calculate the pixel index in the receiving array
         n=this.m_canvas.Width()*y+x;
         if(n>this.m_array_ppx.Size()-1)
            break;
         //--- copy pixel to the receiving array from the panel X and Y
         this.m_array_ppx[n]=this.m_canvas.PixelGet(x,y);
        }
  }
ピクセルの配列からパネルの背景を復元するメソッド
//+------------------------------------------------------------------+
//| Restore the panel background from the array of pixels            |
//+------------------------------------------------------------------+
void CDashboard::RestoreBackground(void)
  {
//--- Exit if the array is empty
   if(this.m_array_ppx.Size()==0)
      return;
   uint n=0;
//--- In the loop by the panel height (pixel Y coordinate)
   for(int y=0;y<this.m_canvas.Height();y++)
      //--- in the loop by the panel width (pixel X coordinate)
      for(int x=0;x<this.m_canvas.Width();x++)
        {
         //--- calculate the pixel index in the array
         n=this.m_canvas.Width()*y+x;
         if(n>this.m_array_ppx.Size()-1)
            break;
         //--- copy the pixel from the array to the X and Y coordinates of the panel
         this.m_canvas.PixelSet(x,y,this.m_array_ppx[n]);
        }
  }
オブジェクトを最前面に表示するには、オブジェクトを非表示にし、すぐに表示するという2つの操作を続けて実行する必要があります。各グラフィックオブジェクトには、各時間枠での表示を制御するOBJPROP_TIMEFRAMESプロパティがあります。すべての時間枠でオブジェクトを非表示にするには、このプロパティをOBJ_NO_PERIODSに設定する必要があります。したがって、オブジェクトを表示するには、OBJPROP_TIMEFRAMESプロパティをOBJ_ALL_PERIODSに設定する必要があります。
パネルを非表示にするメソッド
//+------------------------------------------------------------------+
//| Hide the panel                                                   |
//+------------------------------------------------------------------+
void CDashboard::Hide(const bool redraw=false)
  {
   ::ObjectSetInteger(this.m_chart_id,this.m_workspace.ChartObjectName(),OBJPROP_TIMEFRAMES,OBJ_NO_PERIODS);
   ::ObjectSetInteger(this.m_chart_id,this.m_canvas.ChartObjectName(),OBJPROP_TIMEFRAMES,OBJ_NO_PERIODS);
   if(redraw)
      ::ChartRedraw(this.m_chart_id);
  }
パネルおよび作業スペースオブジェクトの場合、OBJPROP_TIMEFRAMESプロパティはOBJ_NO_PERIODSに設定され、変更を即座に反映するためにチャートが再描画されます(対応するフラグが設定されている場合)。
パネルを表示するメソッド
//+------------------------------------------------------------------+
//| Display the panel                                                |
//+------------------------------------------------------------------+
void CDashboard::Show(const bool redraw=false)
  {
   ::ObjectSetInteger(this.m_chart_id,this.m_canvas.ChartObjectName(),OBJPROP_TIMEFRAMES,OBJ_ALL_PERIODS);
   if(!this.m_minimized)
      ::ObjectSetInteger(this.m_chart_id,this.m_workspace.ChartObjectName(),OBJPROP_TIMEFRAMES,OBJ_ALL_PERIODS);
   if(redraw)
      ::ChartRedraw(this.m_chart_id);
  }
パネルオブジェクトの場合、OBJPROP_TIMEFRAMESプロパティはすぐにOBJ_ALL_PERIODSに設定されます。作業スペースオブジェクトの場合、パネルが展開状態にある場合にのみ値が設定されます。
再描画フラグがチェックされている場合、チャートが再描画され、変更がすぐに表示されます。
パネルを最前面に移動するメソッド
//+------------------------------------------------------------------+
//| Bring the panel to the foreground                                |
//+------------------------------------------------------------------+
void CDashboard::BringToTop(void)
  {
   this.Hide(false);
   this.Show(true);
  }
まず、チャートを再描画せずにパネルと作業スペースを非表示にし、すぐに表示してチャートを再描画します。
場合によっては、ピクセル配列をメモリに保存できない場合は、ピクセル配列をファイルに保存し、そこから読み込む必要があります。このクラスには、ピクセル配列をファイルに保存し、ファイルから読み込むためのメソッドが含まれています。
//+------------------------------------------------------------------+
//| Save the pixel array of the working space to a file              |
//+------------------------------------------------------------------+
bool CDashboard::FileSaveWorkspace(void)
  {
//--- Define the folder and file name
   string filename=this.m_program_name+"\\Dashboard"+(string)this.m_id+"\\workspace.bin";
//--- If the saved array is empty, inform of that and return 'false'
   if(this.m_array_wpx.Size()==0)
     {
      ::PrintFormat("%s: Error. The workspace pixel array is empty.",__FUNCTION__);
      return false;
     }
//--- If the array could not be saved to a file, report this and return 'false'
   if(!::FileSave(filename,this.m_array_wpx))
     {
      ::PrintFormat("%s: FileSave '%s' failed. Error %lu",__FUNCTION__,filename,::GetLastError());
      return false;
     }
//--- Successful, return 'true'
   return true;
  }
//+------------------------------------------------------------------+
//| Save the pixel array of the panel background to a file           |
//+------------------------------------------------------------------+
bool CDashboard::FileSaveBackground(void)
  {
//--- Define the folder and file name
   string filename=this.m_program_name+"\\Dashboard"+(string)this.m_id+"\\background.bin";
//--- If the saved array is empty, inform of that and return 'false'
   if(this.m_array_ppx.Size()==0)
     {
      ::PrintFormat("%s: Error. The background pixel array is empty.",__FUNCTION__);
      return false;
     }
//--- If the array could not be saved to a file, report this and return 'false'
   if(!::FileSave(filename,this.m_array_ppx))
     {
      ::PrintFormat("%s: FileSave '%s' failed. Error %lu",__FUNCTION__,filename,::GetLastError());
      return false;
     }
//--- Successful, return 'true'
   return true;
  }
//+------------------------------------------------------------------+
//| Upload the array of working space pixels from a file             |
//+------------------------------------------------------------------+
bool CDashboard::FileLoadWorkspace(void)
  {
//--- Define the folder and file name
   string filename=this.m_program_name+"\\Dashboard"+(string)this.m_id+"\\workspace.bin";
//--- If failed to upload data from the file into the array, report this and return 'false'
   if(::FileLoad(filename,this.m_array_wpx)==WRONG_VALUE)
     {
      ::PrintFormat("%s: FileLoad '%s' failed. Error %lu",__FUNCTION__,filename,::GetLastError());
      return false;
     }
//--- Successful, return 'true'
   return true;
  }
//+------------------------------------------------------------------+
//| Upload the array of panel background pixels from a file          |
//+------------------------------------------------------------------+
bool CDashboard::FileLoadBackground(void)
  {
//--- Define the folder and file name
   string filename=this.m_program_name+"\\Dashboard"+(string)this.m_id+"\\background.bin";
//--- If failed to upload data from the file into the array, report this and return 'false'
   if(::FileLoad(filename,this.m_array_ppx)==WRONG_VALUE)
     {
      ::PrintFormat("%s: FileLoad '%s' failed. Error %lu",__FUNCTION__,filename,::GetLastError());
      return false;
     }
//--- Successful, return 'true'
   return true;
  }
記事執筆時点で必要性が判明したため、現時点ではこれらのメソッドの処理は実装されていません。ダッシュボードクラスに関する今後の記事では、これらのメソッドが使用される可能性があります。
ダッシュボード付き指標
ダッシュボードをテストするために、通常の移動平均を描く簡単な指標を作成してみましょう。現在の買値と売値、およびマウスカーソルが現在置かれているローソク足データが表示されます。
Indicatorsフォルダーで、新しいカスタム指標を含む新しいTestDashboardフォルダーを作成します。
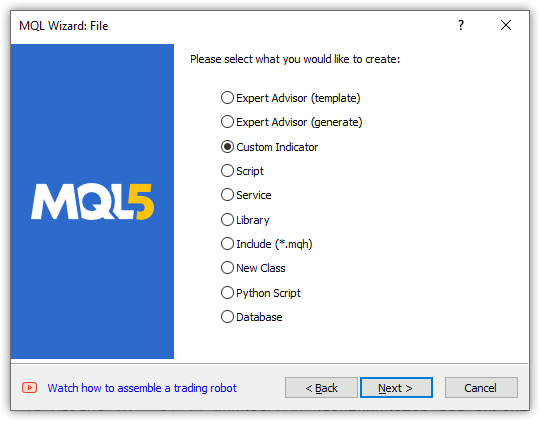
次に、パラメータを設定します。
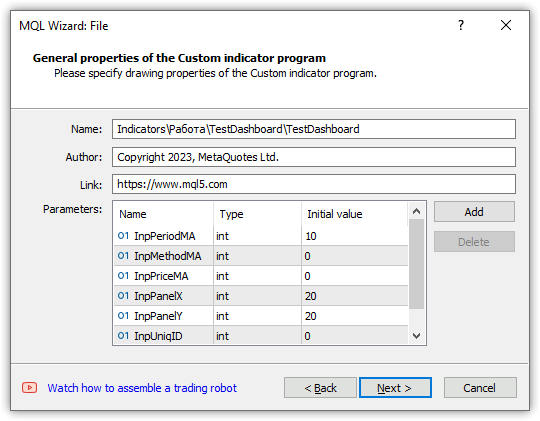
さらに改善する場合は、最初のOnCalculate、OnChartEvent、およびOnTimerタイプを選択します。
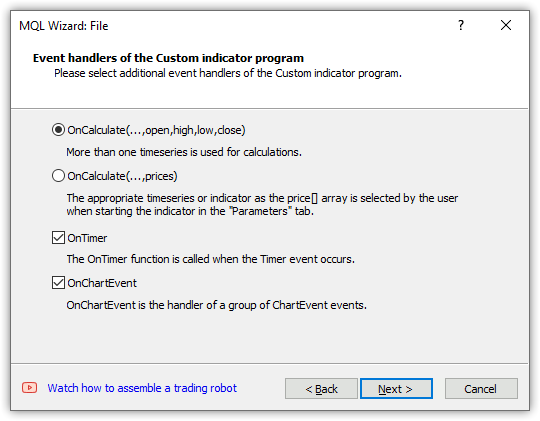
描画するバッファを1つ選択し、[Finish]をクリックします。
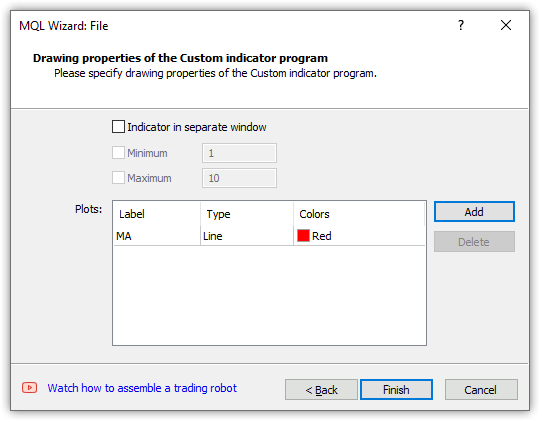
次のテンプレートを取得します。
//+------------------------------------------------------------------+
//|                                                TestDashboard.mq5 |
//|                                  Copyright 2023, MetaQuotes Ltd. |
//|                                             https://www.mql5.com |
//+------------------------------------------------------------------+
#property copyright "Copyright 2023, MetaQuotes Ltd."
#property link      "https://www.mql5.com"
#property version   "1.00"
#property indicator_chart_window
#property indicator_buffers 1
#property indicator_plots   1
//--- plot MA
#property indicator_label1  "MA"
#property indicator_type1   DRAW_LINE
#property indicator_color1  clrRed
#property indicator_style1  STYLE_SOLID
#property indicator_width1  1
//--- input parameters
input int      InpPeriodMA=10;
input int      InpMethodMA=0;
input int      InpPriceMA=0;
input int      InpPanelX=20;
input int      InpPanelY=20;
input int      InpUniqID=0;
//--- indicator buffers
double         MABuffer[];
//+------------------------------------------------------------------+
//| Custom indicator initialization function                         |
//+------------------------------------------------------------------+
int OnInit()
  {
//--- indicator buffers mapping
   SetIndexBuffer(0,MABuffer,INDICATOR_DATA);

//---
   return(INIT_SUCCEEDED);
  }
//+------------------------------------------------------------------+
//| Custom indicator iteration function                              |
//+------------------------------------------------------------------+
int OnCalculate(const int rates_total,
                const int prev_calculated,
                const datetime &time[],
                const double &open[],
                const double &high[],
                const double &low[],
                const double &close[],
                const long &tick_volume[],
                const long &volume[],
                const int &spread[])
  {
//---

//--- return value of prev_calculated for the next call
   return(rates_total);
  }
//+------------------------------------------------------------------+
//| Timer function                                                   |
//+------------------------------------------------------------------+
void OnTimer()
  {
//---

  }
//+------------------------------------------------------------------+
//| ChartEvent function                                              |
//+------------------------------------------------------------------+
void OnChartEvent(const int id,
                  const long &lparam,
                  const double &dparam,
                  const string &sparam)
  {
//---

  }
//+------------------------------------------------------------------+
インクルードされたパネルクラスファイルが指標と同じフォルダーに配置されるように、作成した指標フォルダーにパネルオブジェクトクラスファイルを保存しましょう。パネルクラスを完成させた後、その最終バージョンを取引ターミナルのファイルサンドボックスのIncludeフォルダーに配置して、カスタムプログラムで使用できます。
作成した指標テンプレートを調整してみましょう。パネルオブジェクトクラスをインクルードし、よりわかりやすい初期値で入力を初期化し、描画されるバッファの名前を修正して、グローバル変数を宣言します。
//+------------------------------------------------------------------+
//|                                                TestDashboard.mq5 |
//|                                  Copyright 2023, MetaQuotes Ltd. |
//|                                             https://www.mql5.com |
//+------------------------------------------------------------------+
#property copyright "Copyright 2023, MetaQuotes Ltd."
#property link      "https://www.mql5.com"
#property version   "1.00"
#property indicator_chart_window
#property indicator_buffers 1
#property indicator_plots   1
//--- plot MA
#property indicator_label1  "MA"
#property indicator_type1   DRAW_LINE
#property indicator_color1  clrRed
#property indicator_style1  STYLE_SOLID
#property indicator_width1  1
//--- includes
#include "Dashboard.mqh"
//--- input variables
input int                  InpPeriodMA =  10;            /* MA Period   */ // Moving average calculation period
input ENUM_MA_METHOD       InpMethodMA =  MODE_SMA;      /* MA Method   */ // Moving average calculation method
input ENUM_APPLIED_PRICE   InpPriceMA  =  PRICE_CLOSE;   /* MA Price    */ // Moving average calculation price
input int                  InpPanelX   =  20;            /* Dashboard X */ // Panel X coordinate
input int                  InpPanelY   =  20;            /* Dashboard Y */ // Panel Y coordinate
input int                  InpUniqID   =  0;             /* Unique ID   */ // Unique ID for the panel object
//--- indicator buffers
double         BufferMA[];
//--- global variables
CDashboard    *dashboard=NULL;
int            handle_ma;        // Moving Average indicator handle
int            period_ma;        // Moving Average calculation period
int            mouse_bar_index;  // Index of the bar the data is taken from
string         plot_label;       // Name of the graphical indicator series displayed in DataWindow
//+------------------------------------------------------------------+
//| Custom indicator initialization function                         |
//+------------------------------------------------------------------+
int OnInit()
  {
OnInit()ハンドラで、移動平均標準指標のハンドルを作成し、指標のパラメータと描画されるバッファを設定します。指標は履歴の先頭から現在のデータまで計算されるため、時系列と同様に指標バッファのインデックスを設定します。同じハンドラでダッシュボードオブジェクトを作成します。オブジェクトを作成したらすぐにそれを表示し、テーブルグリッドを描画します。次に、表形式のデータをジャーナルに送信します。
//+------------------------------------------------------------------+
//| Custom indicator initialization function                         |
//+------------------------------------------------------------------+
int OnInit()
  {
//--- indicator buffers mapping
   SetIndexBuffer(0,BufferMA,INDICATOR_DATA);

//--- Create indicator handle
   period_ma=(InpPeriodMA<1 ? 1 : InpPeriodMA);
   ResetLastError();
   handle_ma=iMA(Symbol(),PERIOD_CURRENT,period_ma,0,InpMethodMA,InpPriceMA);
   if(handle_ma==INVALID_HANDLE)
     {
      PrintFormat("%s Failed to create MA indicator handle. Error %lu",__FUNCTION__,GetLastError());
      return INIT_FAILED;
     }
//--- Set the indicator parameters
   IndicatorSetInteger(INDICATOR_DIGITS,Digits());
   IndicatorSetString(INDICATOR_SHORTNAME,"Test Dashboard");
//--- Set the parameters of the buffer being drawn
   plot_label="MA("+(string)period_ma+","+StringSubstr(EnumToString(Period()),7)+")";
   PlotIndexSetString(0,PLOT_LABEL,plot_label);
   ArraySetAsSeries(BufferMA,true);

//--- Create the panel object
   dashboard=new CDashboard(InpUniqID,InpPanelX,InpPanelY,200,250);
   if(dashboard==NULL)
     {
      Print("Error. Failed to create dashboard object");
      return INIT_FAILED;
     }
//--- Display the panel with the "Symbol, Timeframe description" header text
   dashboard.View(Symbol()+", "+StringSubstr(EnumToString(Period()),7));
//--- Draw the name plate on the panel background
   dashboard.DrawGridAutoFill(2,12,2);
   //dashboard.DrawGrid(2,1,12,2,19,97);
//--- Display tabular data in the journal
   dashboard.GridPrint(2);
//--- Initialize the variable with the index of the mouse cursor bar
   mouse_bar_index=0;
//--- Successful initialization
   return(INIT_SUCCEEDED);
  }
ここでのロジックはすべてコード内でコメント化されています。テーブルは、行と列のサイズが自動計算されて作成されます。単純なテーブルの作成はコード内でコメント化されています。自動ネームプレートをコメントアウトし、単純なネームプレートのコメントを解除して、指標を再コンパイルできます。現在のテーブルパラメータを考慮すると、その違いはわずかです。
OnDeinit()ハンドラで、パネルを削除し、指標ハンドルを解放し、チャートのコメントを消去します。
//+------------------------------------------------------------------+
//| Custom indicator deinitialization function                       |
//+------------------------------------------------------------------+
void OnDeinit(const int reason)
  {
//--- If the panel object exists, delete it
   if(dashboard!=NULL)
      delete dashboard;
//--- Release the handle of the MA indicator
   ResetLastError();
   if(!IndicatorRelease(handle_ma))
      PrintFormat("%s: IndicatorRelease failed. Error %ld",__FUNCTION__,GetLastError());
//--- Delete all comments
   Comment("");
  }
OnCalculate()ハンドラでは、事前定義されたすべてのtimeseries配列にtimeseriesのようなインデックスが付けられるため、描画バッファのインデックスと一致します。それ以外はすべてハンドラコードのコメントで説明されています。
//+------------------------------------------------------------------+
//| Custom indicator iteration function                              |
//+------------------------------------------------------------------+
int OnCalculate(const int rates_total,
                const int prev_calculated,
                const datetime &time[],
                const double &open[],
                const double &high[],
                const double &low[],
                const double &close[],
                const long &tick_volume[],
                const long &volume[],
                const int &spread[])
  {
//--- Set indexing for the arrays as in a timeseries
   ArraySetAsSeries(time,true);
   ArraySetAsSeries(open,true);
   ArraySetAsSeries(high,true);
   ArraySetAsSeries(low,true);
   ArraySetAsSeries(close,true);
   ArraySetAsSeries(tick_volume,true);
   ArraySetAsSeries(volume,true);
   ArraySetAsSeries(spread,true);

//--- Check for the minimum number of bars for calculation
   if(rates_total<period_ma) return 0;

//--- Check and calculate the number of calculated bars
   int limit=rates_total-prev_calculated;
//--- If 'limit' is 0, then only the current bar is calculated
//--- If 'limit' is 1 (opening a new bar), then two bars are calculated - the current newly opened one and the previous one
//--- If 'limit' is more than 1, then this is either the first launch of the indicator, or some changes in history - the indicator is completely recalculated
   if(limit>1)
     {
      limit=rates_total-period_ma-1;
      ArrayInitialize(BufferMA,EMPTY_VALUE);
     }

//--- Calculate the amount of data copied from the indicator handle to the drawing buffer
   int count=(limit>1 ? rates_total : 1),copied=0;
//--- Prepare data (receive data to the moving average buffer by handle)
   copied=CopyBuffer(handle_ma,0,0,count,BufferMA);
   if(copied!=count) return 0;

//--- Loop of indicator calculation based on the moving average data
   for(int i=limit; i>=0 && !IsStopped(); i--)
     {
      // Here we calculate a certain indicator based on the standard Moving Average data
     }

//--- Receive price and timeseries data and display it on the panel
//--- At the first launch, we display the data of the current bar on the panel
   static bool first=true;
   if(first)
     {
      DrawData(0,TimeCurrent());
      first=false;
     }

//--- Declare the price structure and get the current prices
   MqlTick  tick={0};
   if(!SymbolInfoTick(Symbol(),tick))
      return 0;

//--- If the cursor is on the current bar, display the data of the current bar on the panel
   if(mouse_bar_index==0)
      DrawData(0,time[0]);
//--- Otherwise, display only the Bid and Ask prices on the panel (we update the prices on the panel at each tick)
   else
     {
      dashboard.DrawText("Bid",dashboard.CellX(0,0)+2,dashboard.CellY(0,0)+2); dashboard.DrawText(DoubleToString(tick.bid,Digits()),dashboard.CellX(0,1)+2,dashboard.CellY(0,1)+2,90);
      dashboard.DrawText("Ask",dashboard.CellX(1,0)+2,dashboard.CellY(1,0)+2); dashboard.DrawText(DoubleToString(tick.ask,Digits()),dashboard.CellX(1,1)+2,dashboard.CellY(1,1)+2,90);
     }

//--- return value of prev_calculated for the next call
   return(rates_total);
  }
OnChartEvent()ハンドラでは、指標はまずOnChartEventパネルハンドラを呼び出し、次に必要なイベントを処理します。
//+------------------------------------------------------------------+
//| ChartEvent function                                              |
//+------------------------------------------------------------------+
void OnChartEvent(const int id,
                  const long &lparam,
                  const double &dparam,
                  const string &sparam)
  {
//--- Call the panel event handler
   dashboard.OnChartEvent(id,lparam,dparam,sparam);

//--- If the cursor moves or a click is made on the chart
   if(id==CHARTEVENT_MOUSE_MOVE || id==CHARTEVENT_CLICK)
     {
      //--- Declare the variables to record time and price coordinates in them
      datetime time=0;
      double price=0;
      int wnd=0;
      //--- If the cursor coordinates are converted to date and time
      if(ChartXYToTimePrice(ChartID(),(int)lparam,(int)dparam,wnd,time,price))
        {
         //--- write the bar index where the cursor is located to a global variable
         mouse_bar_index=iBarShift(Symbol(),PERIOD_CURRENT,time);
         //--- Display the bar data under the cursor on the panel
         DrawData(mouse_bar_index,time);
        }
     }

//--- If we received a custom event, display the appropriate message in the journal
   if(id>CHARTEVENT_CUSTOM)
     {
      //--- Here we can implement handling a click on the close button on the panel
      PrintFormat("%s: Event id=%ld, object id (lparam): %lu, event message (sparam): %s",__FUNCTION__,id,lparam,sparam);
     }
  }
ここでは、閉じるボタンがクリックされた際にパネルからイベントを受け取り、そのイベントに反応する必要がある場合、その処理を登録する必要があります。このイベントでのプログラムの動作に関する決定はプログラム開発者にあります。
現在の価格とバーデータをインデックス別に表示する関数
//+------------------------------------------------------------------+
//| Display data from the specified timeseries index to the panel    |
//+------------------------------------------------------------------+
void DrawData(const int index,const datetime time)
  {
//--- Declare the variables to receive data in them
   MqlTick  tick={0};
   MqlRates rates[1];
//--- Exit if unable to get the current prices
   if(!SymbolInfoTick(Symbol(),tick))
      return;
//--- Exit if unable to get the bar data by the specified index
   if(CopyRates(Symbol(),PERIOD_CURRENT,index,1,rates)!=1)
      return;
//--- Display the current prices and data of the specified bar on the panel
   dashboard.DrawText("Bid",        dashboard.CellX(0,0)+2,   dashboard.CellY(0,0)+2);  dashboard.DrawText(DoubleToString(tick.bid,Digits()),       dashboard.CellX(0,1)+2,   dashboard.CellY(0,1)+2,90);
   dashboard.DrawText("Ask",        dashboard.CellX(1,0)+2,   dashboard.CellY(1,0)+2);  dashboard.DrawText(DoubleToString(tick.ask,Digits()),       dashboard.CellX(1,1)+2,   dashboard.CellY(1,1)+2,90);
   dashboard.DrawText("Date",       dashboard.CellX(2,0)+2,   dashboard.CellY(2,0)+2);  dashboard.DrawText(TimeToString(rates[0].time,TIME_DATE),   dashboard.CellX(2,1)+2,   dashboard.CellY(2,1)+2,90);
   dashboard.DrawText("Time",       dashboard.CellX(3,0)+2,   dashboard.CellY(3,0)+2);  dashboard.DrawText(TimeToString(rates[0].time,TIME_MINUTES),dashboard.CellX(3,1)+2,   dashboard.CellY(3,1)+2,90);

   dashboard.DrawText("Open",       dashboard.CellX(4,0)+2,   dashboard.CellY(4,0)+2);  dashboard.DrawText(DoubleToString(rates[0].open,Digits()),  dashboard.CellX(4,1)+2,   dashboard.CellY(4,1)+2,90);
   dashboard.DrawText("High",       dashboard.CellX(5,0)+2,   dashboard.CellY(5,0)+2);  dashboard.DrawText(DoubleToString(rates[0].high,Digits()),  dashboard.CellX(5,1)+2,   dashboard.CellY(5,1)+2,90);
   dashboard.DrawText("Low",        dashboard.CellX(6,0)+2,   dashboard.CellY(6,0)+2);  dashboard.DrawText(DoubleToString(rates[0].low,Digits()),   dashboard.CellX(6,1)+2,   dashboard.CellY(6,1)+2,90);
   dashboard.DrawText("Close",      dashboard.CellX(7,0)+2,   dashboard.CellY(7,0)+2);  dashboard.DrawText(DoubleToString(rates[0].close,Digits()), dashboard.CellX(7,1)+2,   dashboard.CellY(7,1)+2,90);

   dashboard.DrawText("Volume",     dashboard.CellX(8,0)+2,   dashboard.CellY(8,0)+2);  dashboard.DrawText((string)rates[0].real_volume,            dashboard.CellX(8,1)+2,   dashboard.CellY(8,1)+2,90);
   dashboard.DrawText("Tick Volume",dashboard.CellX(9,0)+2,   dashboard.CellY(9,0)+2);  dashboard.DrawText((string)rates[0].tick_volume,            dashboard.CellX(9,1)+2,   dashboard.CellY(9,1)+2,90);
   dashboard.DrawText("Spread",     dashboard.CellX(10,0)+2,  dashboard.CellY(10,0)+2); dashboard.DrawText((string)rates[0].spread,                 dashboard.CellX(10,1)+2,  dashboard.CellY(10,1)+2,90);
   dashboard.DrawText(plot_label,   dashboard.CellX(11,0)+2,  dashboard.CellY(11,0)+2); dashboard.DrawText(DoubleToString(BufferMA[index],Digits()),dashboard.CellX(11,1)+2,  dashboard.CellY(11,1)+2,90);
//--- Redraw the chart to immediately display all changes on the panel
   ChartRedraw(ChartID());
  }
パネルクラスのDrawTextメソッド
void CDashboard::DrawText(const string text,const int x,const int y,const int width=WRONG_VALUE,const int height=WRONG_VALUE)
に注目すると、X座標とY座標がテキストの後にメソッドに渡されていることがわかります。これは表形式のデータから得られるもので、行番号と列番号によってテーブルのセルの位置を示します。
例えば、BidとAskは、テーブルのセルの「アドレス」にあるパネルに、Bid 0.0(「Bid」テキスト)および0.1(「Bid」テキスト)として表示されます。
dashboard.DrawText("Bid", dashboard.CellX(0,0)+2, dashboard.CellY(0,0)+2); dashboard.DrawText(DoubleToString(tick.bid,Digits()), dashboard.CellX(0,1)+2, dashboard.CellY(0,1)+2,90);
セル値はここで取得されます
「Bid」テキストの場合:
- CellX(0,0):0行目、0列目のセル - X座標値
- CellY(0,0):0行目、0列目のセル - Y座標値
Bid価格値の場合:
- CellX(0,1):0行目、1列目のセル - X座標値
- CellY(0,1):0行目、1列目のセル - Y座標値
2番目のセルに表示されるテキスト幅の値90は、現在のテキストの幅が前のテキストよりも狭い可能性がある場合を示します。それにより、前のテキストは完全に消去されず、2つのテキストが重なって表示されます。したがって、ここでは表示される碑文の幅を明示的に指定します。これにより、以前に描画されたテキストは確実に消去されますが、テキストが書き込まれるテーブルフィールドの幅が90ピクセルよりも広いため、隣接するデータは消去されません。
したがって、テーブルの各セルについて、パネル内のその座標を取得し、そこにテキストを表示できます。座標はテーブルのグリッド線の交点として示されるため、XとYの座標に2ピクセルが追加され、テーブルのセル内のテキストが整列します。
指標をコンパイルしてチャート上で起動すると、パネル上に作成および描画されたテーブルのデータがジャーナルに表示されます。
Table: Rows: 12, Columns: 2
  Row   0    Column   0      Cell X:  2      Cell Y:  2
  Row   0    Column   1      Cell X:  100    Cell Y:  2
  Row   1    Column   0      Cell X:  2      Cell Y:  21
  Row   1    Column   1      Cell X:  100    Cell Y:  21
  Row   2    Column   0      Cell X:  2      Cell Y:  40
  Row   2    Column   1      Cell X:  100    Cell Y:  40
  Row   3    Column   0      Cell X:  2      Cell Y:  59
  Row   3    Column   1      Cell X:  100    Cell Y:  59
  Row   4    Column   0      Cell X:  2      Cell Y:  78
  Row   4    Column   1      Cell X:  100    Cell Y:  78
  Row   5    Column   0      Cell X:  2      Cell Y:  97
  Row   5    Column   1      Cell X:  100    Cell Y:  97
  Row   6    Column   0      Cell X:  2      Cell Y:  116
  Row   6    Column   1      Cell X:  100    Cell Y:  116
  Row   7    Column   0      Cell X:  2      Cell Y:  135
  Row   7    Column   1      Cell X:  100    Cell Y:  135
  Row   8    Column   0      Cell X:  2      Cell Y:  154
  Row   8    Column   1      Cell X:  100    Cell Y:  154
  Row   9    Column   0      Cell X:  2      Cell Y:  173
  Row   9    Column   1      Cell X:  100    Cell Y:  173
  Row   10   Column   0      Cell X:  2      Cell Y:  192
  Row   10   Column   1      Cell X:  100    Cell Y:  192
  Row   11   Column   0      Cell X:  2      Cell Y:  211
  Row   11   Column   1      Cell X:  100    Cell Y:  211
同じチャート上のパネルで2つの指標を起動し、パネルの一意のIDに異なる値を指定すると、それらは互いに独立して機能します。
ここで、パネルは個別に機能しますが、各指標には独自のパネルがあることがわかります。ただし、矛盾もあります。パネルを移動すると、チャートも移動しようとします。これが発生するのは、1番目のパネル(移動しているパネル)ではチャートの移動が無効になり、2番目のパネルではカーソルが外側にあることを確認してチャートの移動がオンになるためです。
この動作を除くためにできる最も簡単なことは、アクティブなパネルのIDが書き込まれるセマフォをグローバル端末変数に配置することです。残りは、そこに自分のID以外のものが表示されても、チャートの管理に干渉しません。
テスタービジュアルモードで指標を実行し、パネルを移動しようとすると、多少の困難を伴いながらパネルが画面上を移動します。同時に、テストされたチャートのバーからデータを取得できます。バーをクリックすると、そのデータがパネルに表示されます。また、マウスの右ボタン(マウスの右ボタンを押したままチャートに沿ってカーソルを移動)を使用すると、現在カーソルが置かれているパネルを指定してデータを表示したり、ヘッダー領域でパネルをつかんで目的の場所に移動したりすることができます。残念ながら、イベント処理の実装が不完全であるため、テスタービジュアルモードではこのようなトリックに頼らなければなりません。
結論
今日は、指標を使用したカスタム戦略の開発に役立つ小さなパネルを作成しました。以降の記事では、すべての標準指標について、EAでの指標の組み込みとそのデータの処理について見ていきます。
MetaQuotes Ltdによってロシア語から翻訳されました。
元の記事: https://www.mql5.com/ru/articles/13179
警告: これらの資料についてのすべての権利はMetaQuotes Ltd.が保有しています。これらの資料の全部または一部の複製や再プリントは禁じられています。
この記事はサイトのユーザーによって執筆されたものであり、著者の個人的な見解を反映しています。MetaQuotes Ltdは、提示された情報の正確性や、記載されているソリューション、戦略、または推奨事項の使用によって生じたいかなる結果についても責任を負いません。

- 無料取引アプリ
- 8千を超えるシグナルをコピー
- 金融ニュースで金融マーケットを探索
Artem、質問があります。void CDashboard::Move(int x, int y)メソッドの中にそのようなものがあります:
特に、この ブロックに興味があります。すなわち、パネルの高さがチャート・ウィンドウより低く、そのY点(左上隅)がウィンドウの高さとパネルの高さの差(2ピクセルで補正)より低い場合、パネルの上点はこの差の値が割り当てられます。なぜこうなるのか、何がポイントなのか。
要するに、CDashboard::Move(int x, int y) メソッドで固着が発生して いるからです。チャート・サイズを変更してからパネルを動かそうとすると、常に座標が修正されてしまい、パネル・ウィンドウを自由に動かすことができないのです...。
移動(int x, int y)
どこかにバグがある。座標とサイズの値をプリントする必要がある(デバッガで見ることもできるが、うまくいかないことが多い)。
以下はコメントにあるロジックです:
チャートサイズを変更した後にパネルを移動させようとすると、常に座標が修正され、パネルウィンドウを自由に移動させることができない...。
Move()メソッドではthis.m_higher_wnd変数の値は関係ない可能性が高い。これらの値はイベントハンドラで設定されます:
ここのどこかで、チャート・ウィンドウが拡張されたときにオーバーサイズのフラグが正しく設定されていない可能性があります。
これらの行を
をMove()メソッドの一番最初に書いて、マウスが動くたびに正しい値が設定されるようにすれば、このバグは消えるでしょうか?もしそうなら、問題はこれらの変数の値にあり、なぜウィンドウが展開されたときに変数の値が取得されないのか、イベント・ハンドラを調べる必要があるということです。そこですべてが正常であれば、エラーを見つけるためにMove()メソッドを表示する必要があります。
バグが消えました。CDashboard::OnChartEvent()メソッドに以下の 変更を加えた:
CDashboard:: Move()メソッドを常に読み込まないようにするため、チャート・ウィンドウの幅と高さが直接変更されるブロックにサイズ超過フラグのチェックを追加した。
バグが消えました。CDashboard::OnChartEvent()メソッドの中で、私は以下の 変更を行った:
CDashboard:: Move()メソッドを常に読み込まないようにするため、チャート・ウィンドウの幅と高さが直接変更されるブロックにサイズ超過フラグのチェックを追加した。